EZH2

Gene symbol: EZH2
Gene: 2146
Uniprot Function: Polycomb group (PcG) protein. Catalytic subunit of the PRC2/EED-EZH2 complex, which methylates 'Lys-9' (H3K9me) and 'Lys-27' (H3K27me) of histone H3, leading to transcriptional repression of the affected target gene. Able to mono-, di- and trimethylate 'Lys-27' of histone H3 to form H3K27me1, H3K27me2 and H3K27me3, respectively. Displays a preference for substrates with less methylation, loses activity when progressively more methyl groups are incorporated into H3K27, H3K27me0 > H3K27me1 > H3K27me2 (PubMed:22323599, PubMed:30923826). Compared to EZH1-containing complexes, it is more abundant in embryonic stem cells and plays a major role in forming H3K27me3, which is required for embryonic stem cell identity and proper differentiation. The PRC2/EED-EZH2 complex may also serve as a recruiting platform for DNA methyltransferases, thereby linking two epigenetic repression systems. Genes repressed by the PRC2/EED-EZH2 complex include HOXC8, HOXA9, MYT1, CDKN2A and retinoic acid target genes. EZH2 can also methylate non-histone proteins such as the transcription factor GATA4 and the nuclear receptor RORA. Regulates the circadian clock via histone methylation at the promoter of the circadian genes. Essential for the CRY1/2-mediated repression of the transcriptional activation of PER1/2 by the CLOCK-ARNTL/BMAL1 heterodimer; involved in the di and trimethylation of 'Lys-27' of histone H3 on PER1/2 promoters which is necessary for the CRY1/2 proteins to inhibit transcription.
Mitotic Index 0.0232
Interphase Cluster: #51 (30 genes)
Mitotic Cluster: #116 (23 genes)
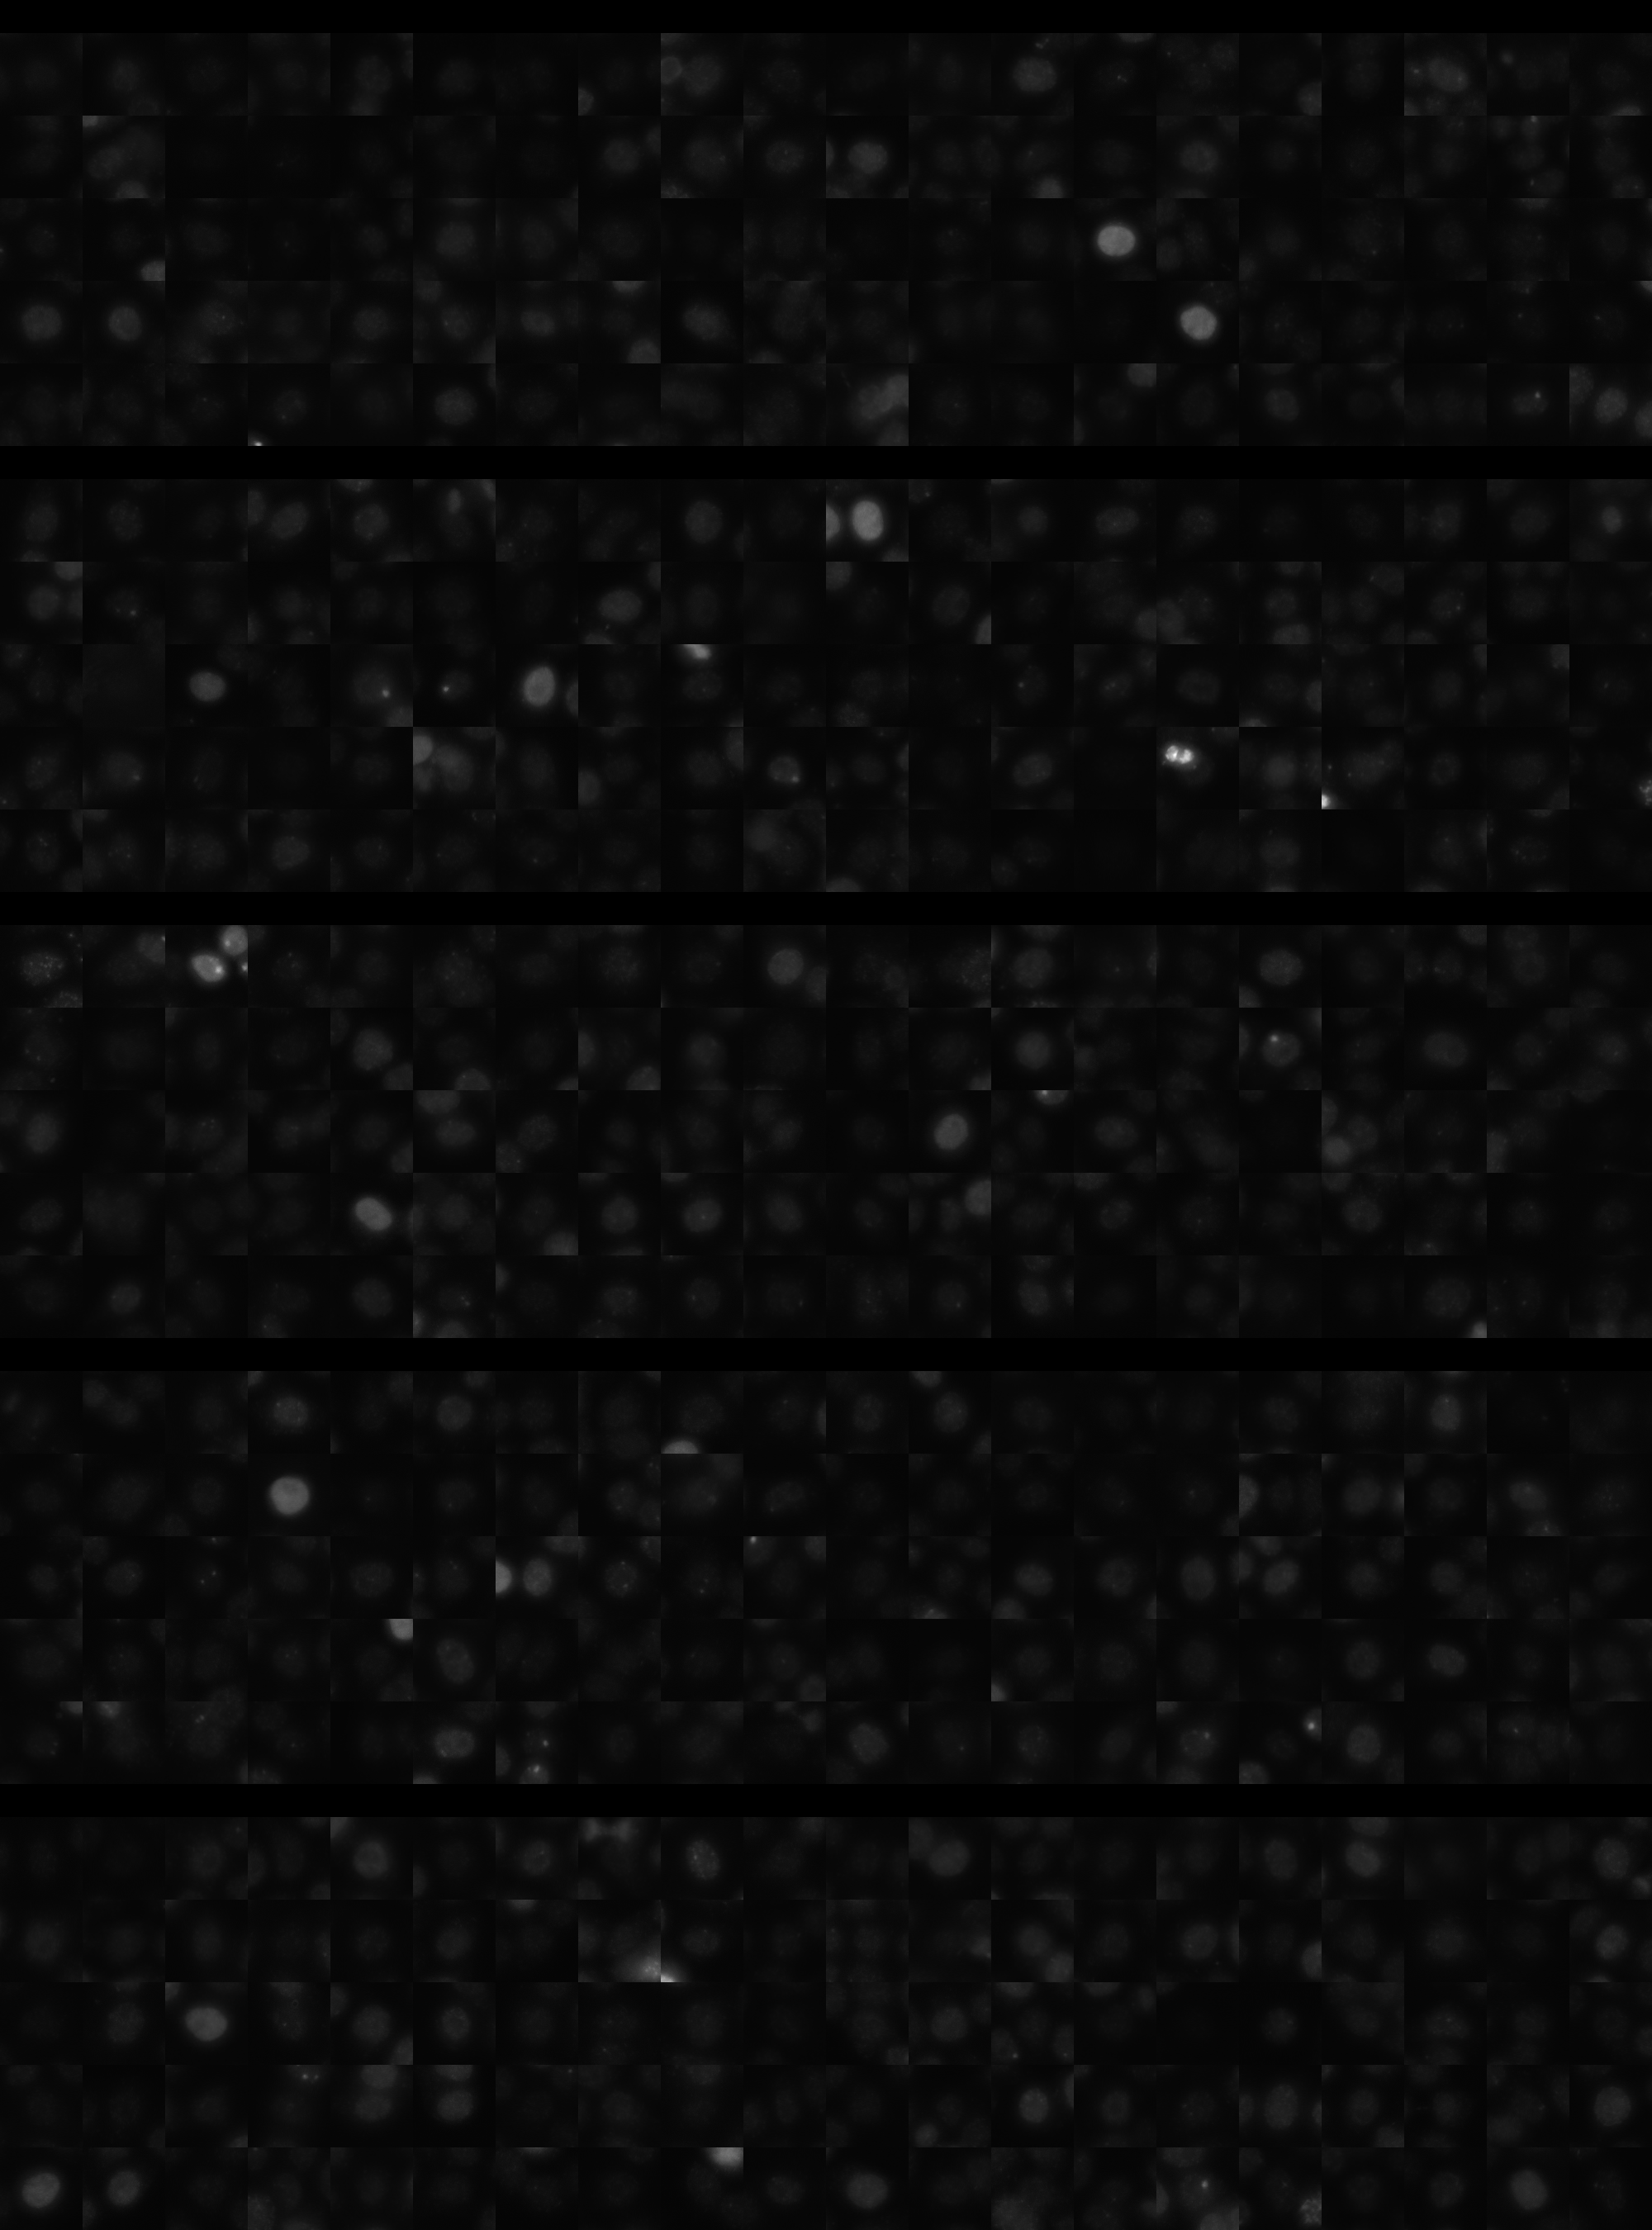
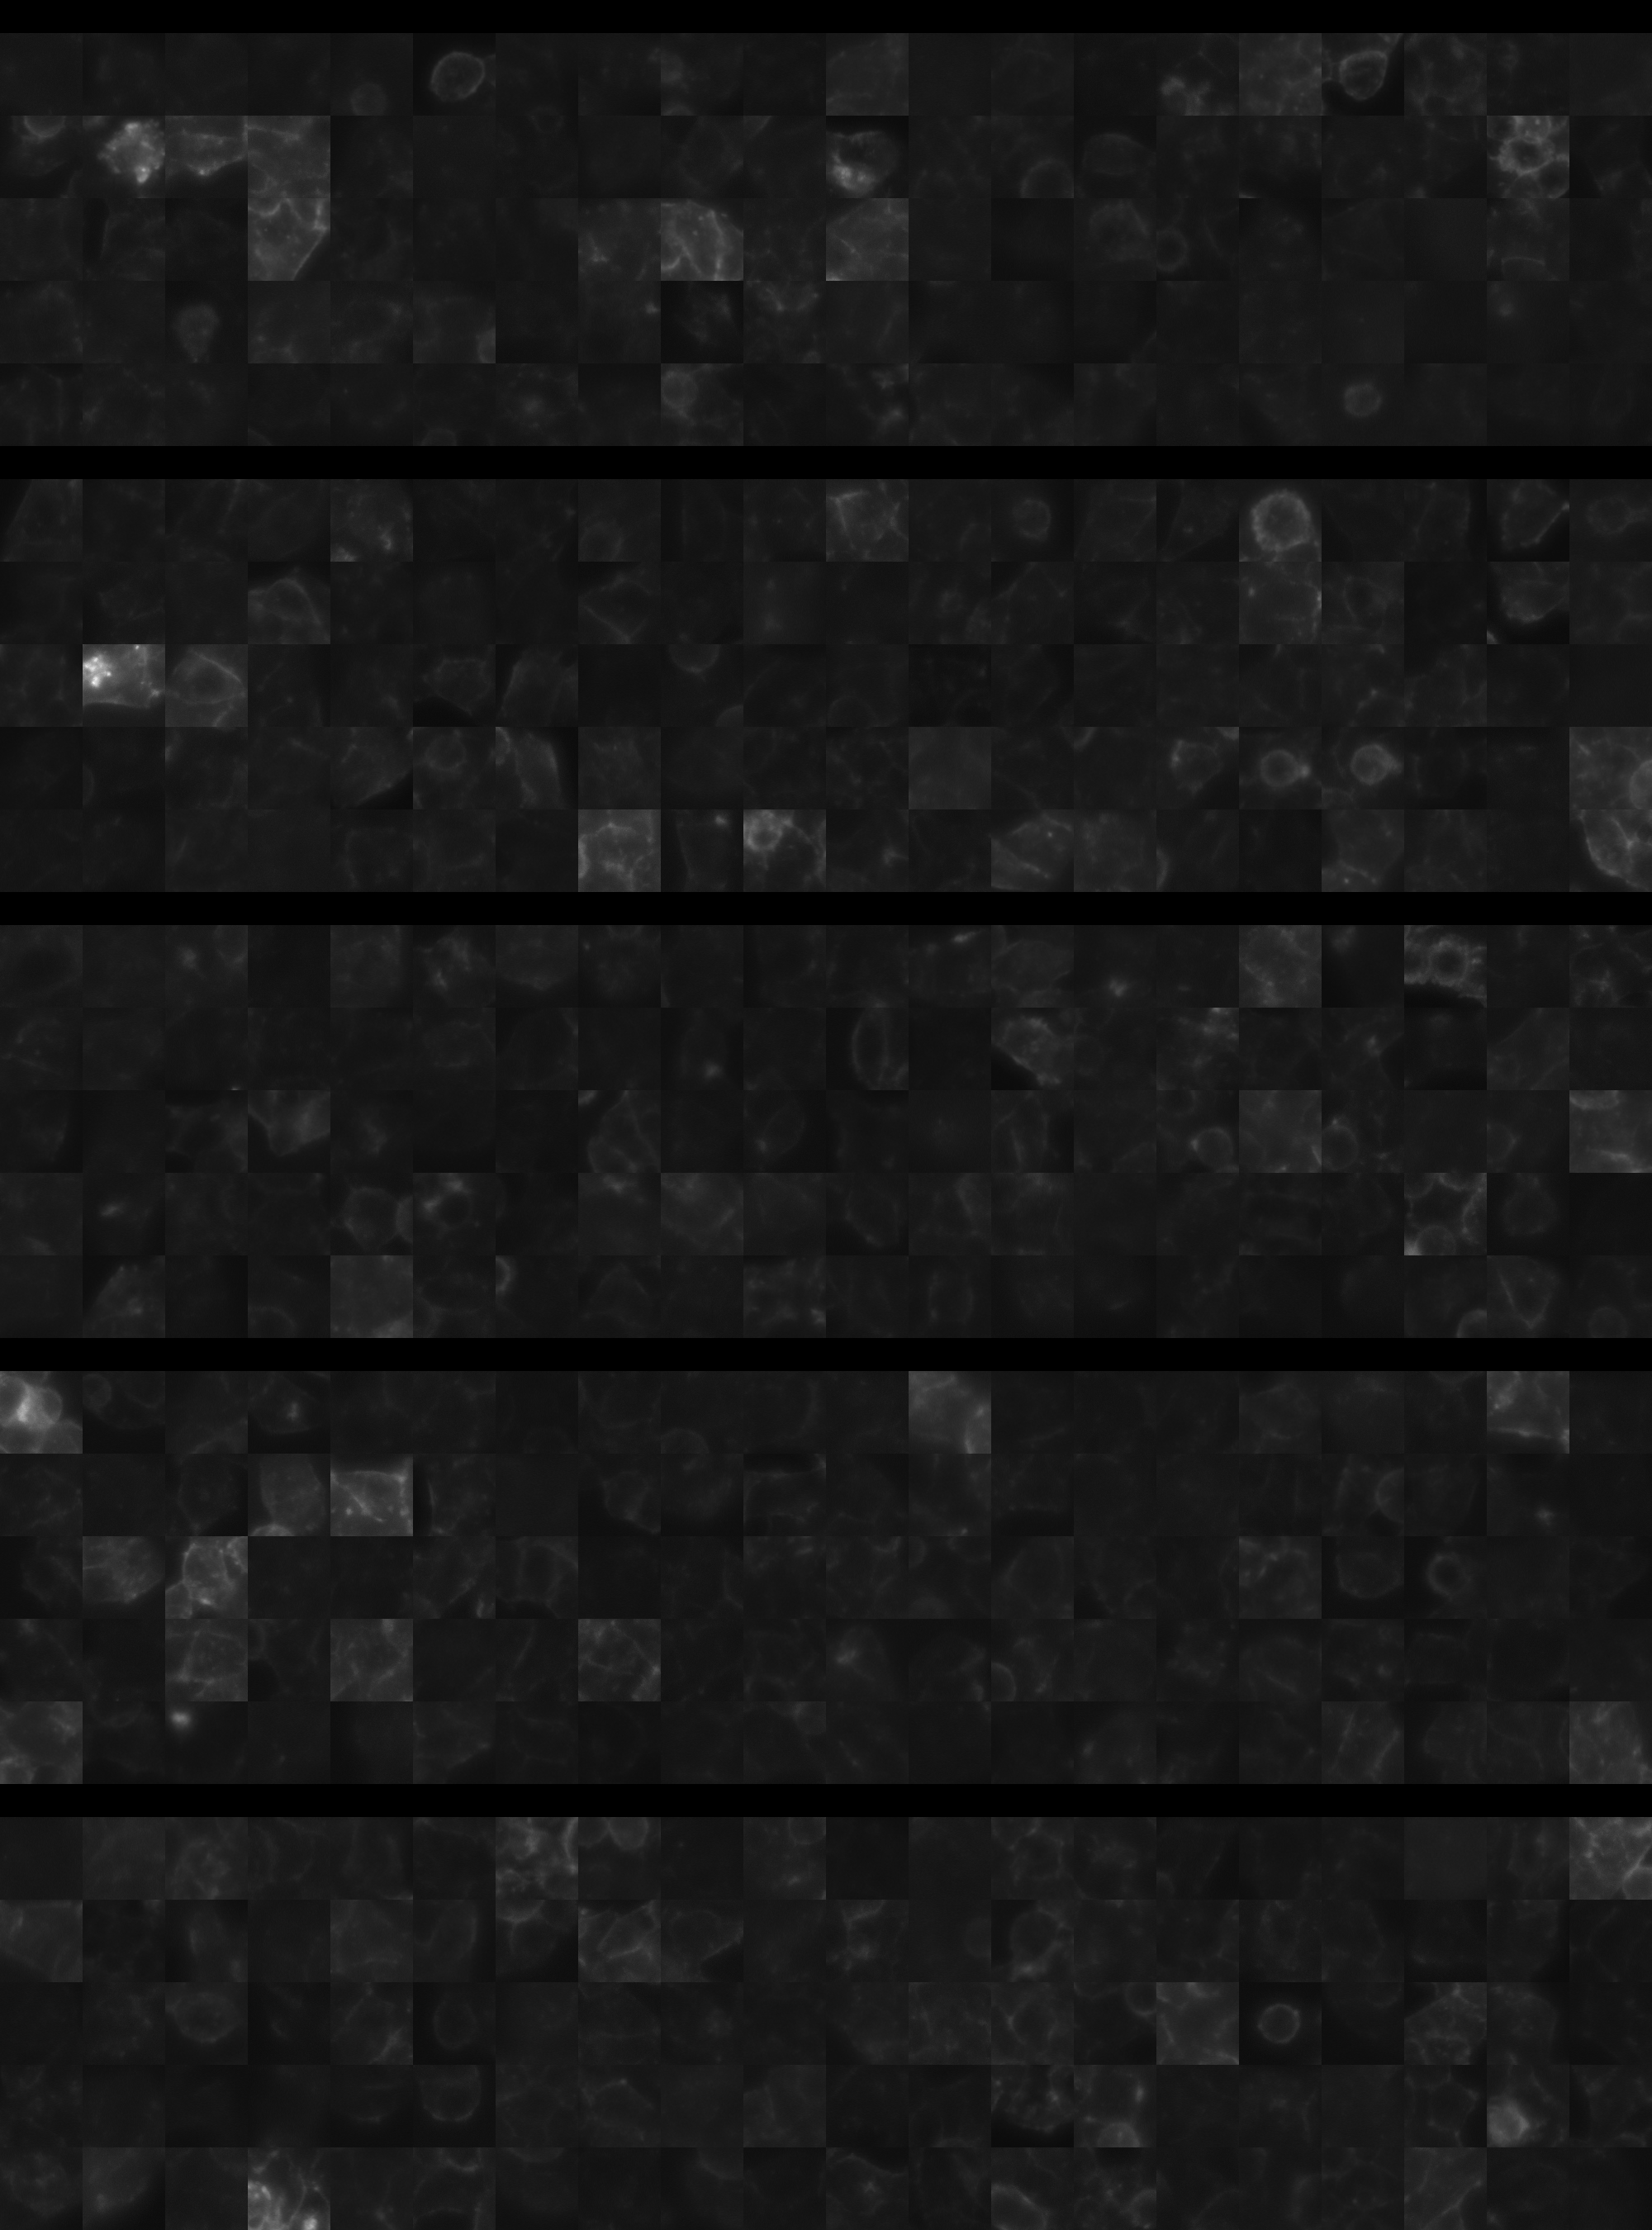
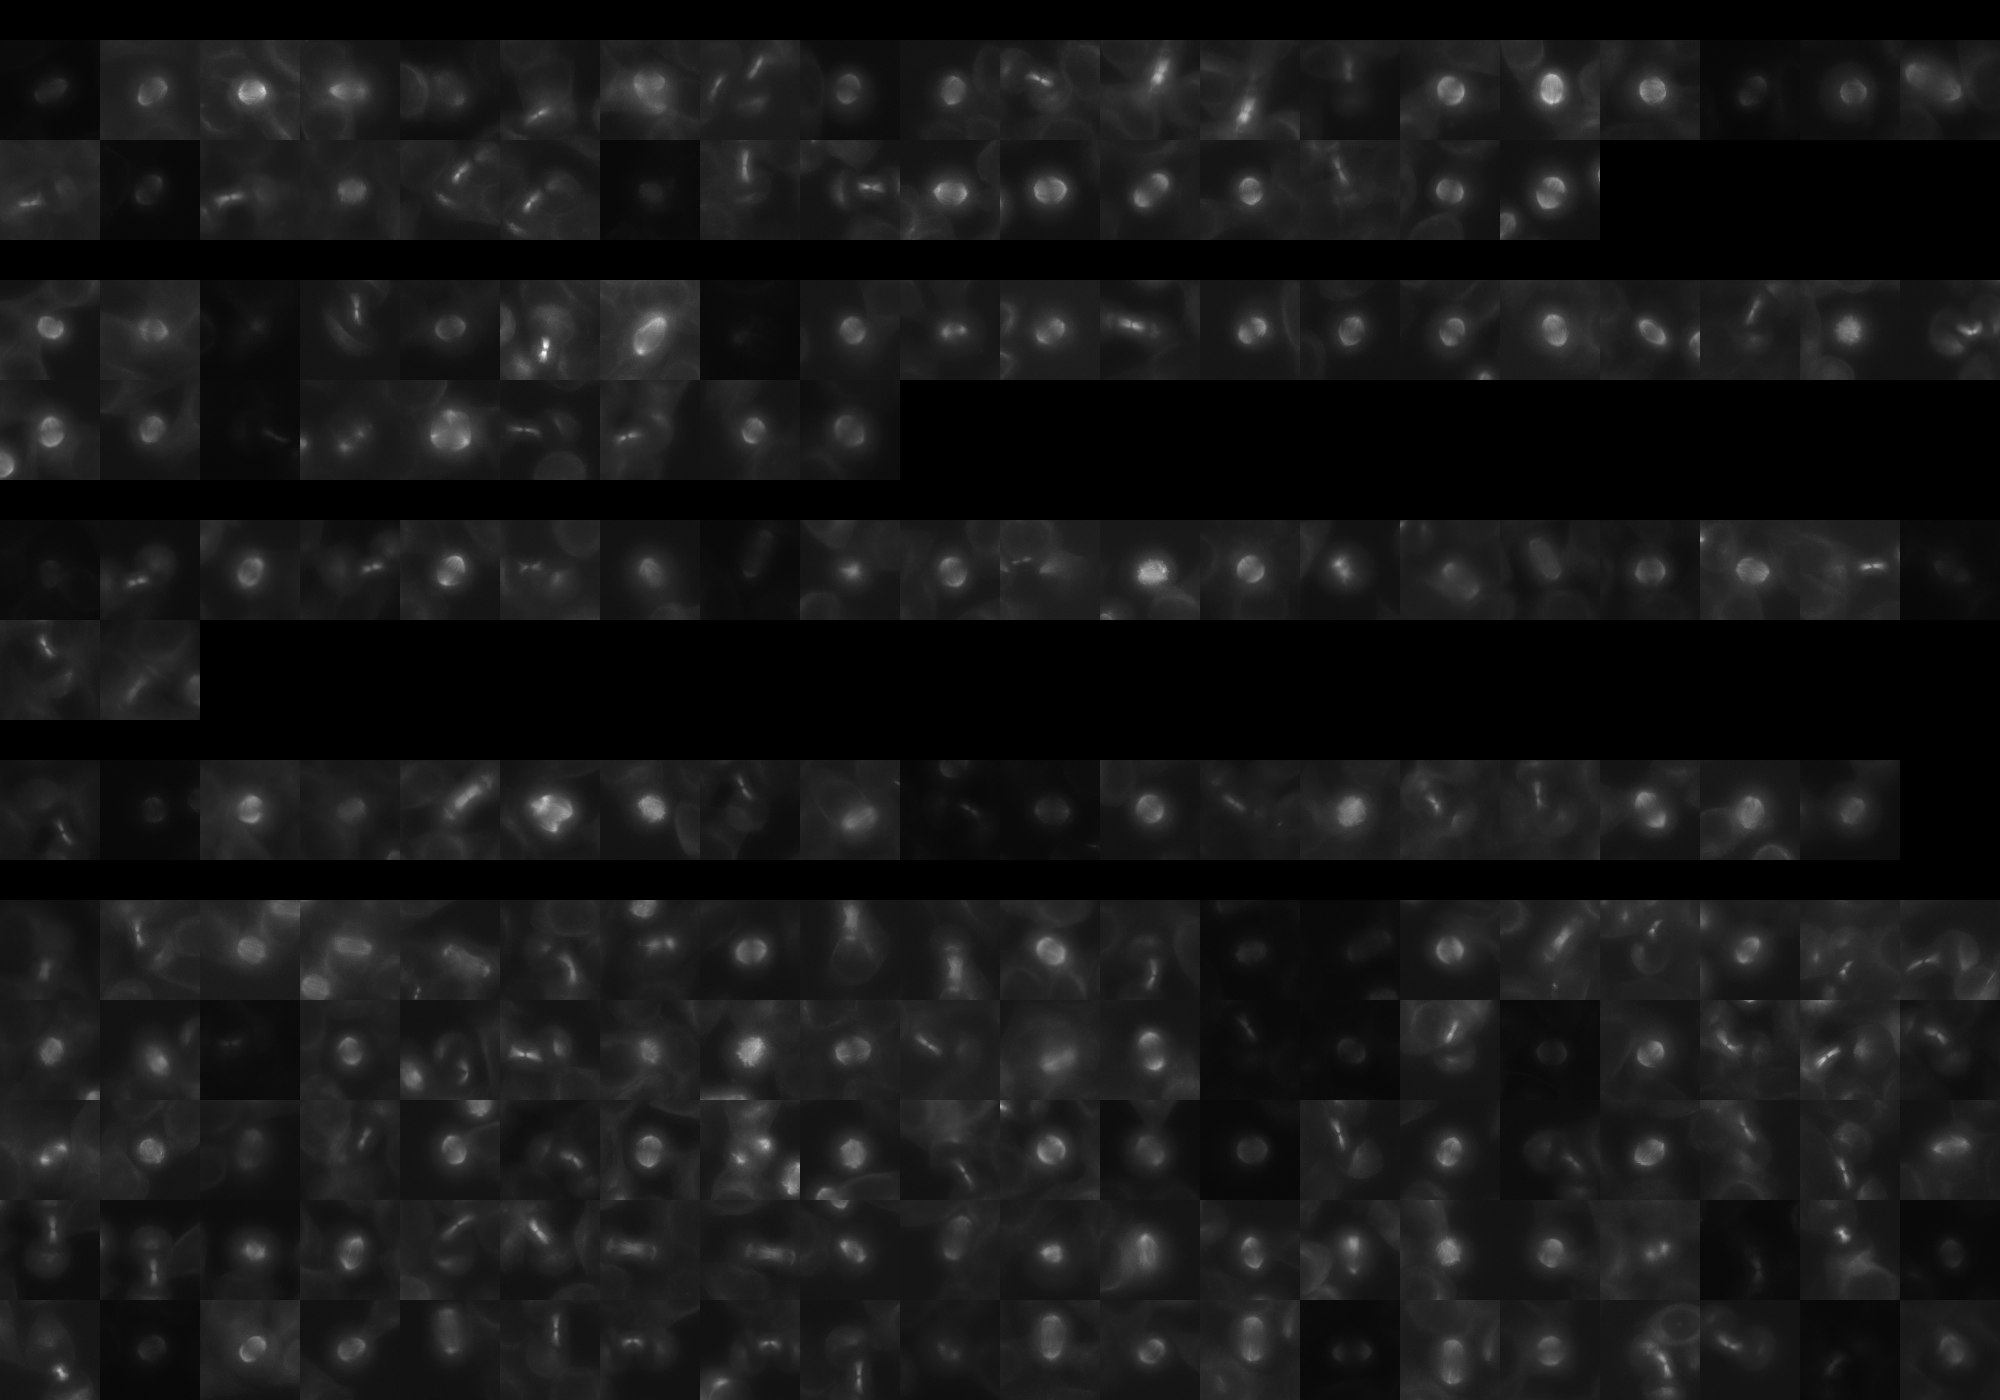
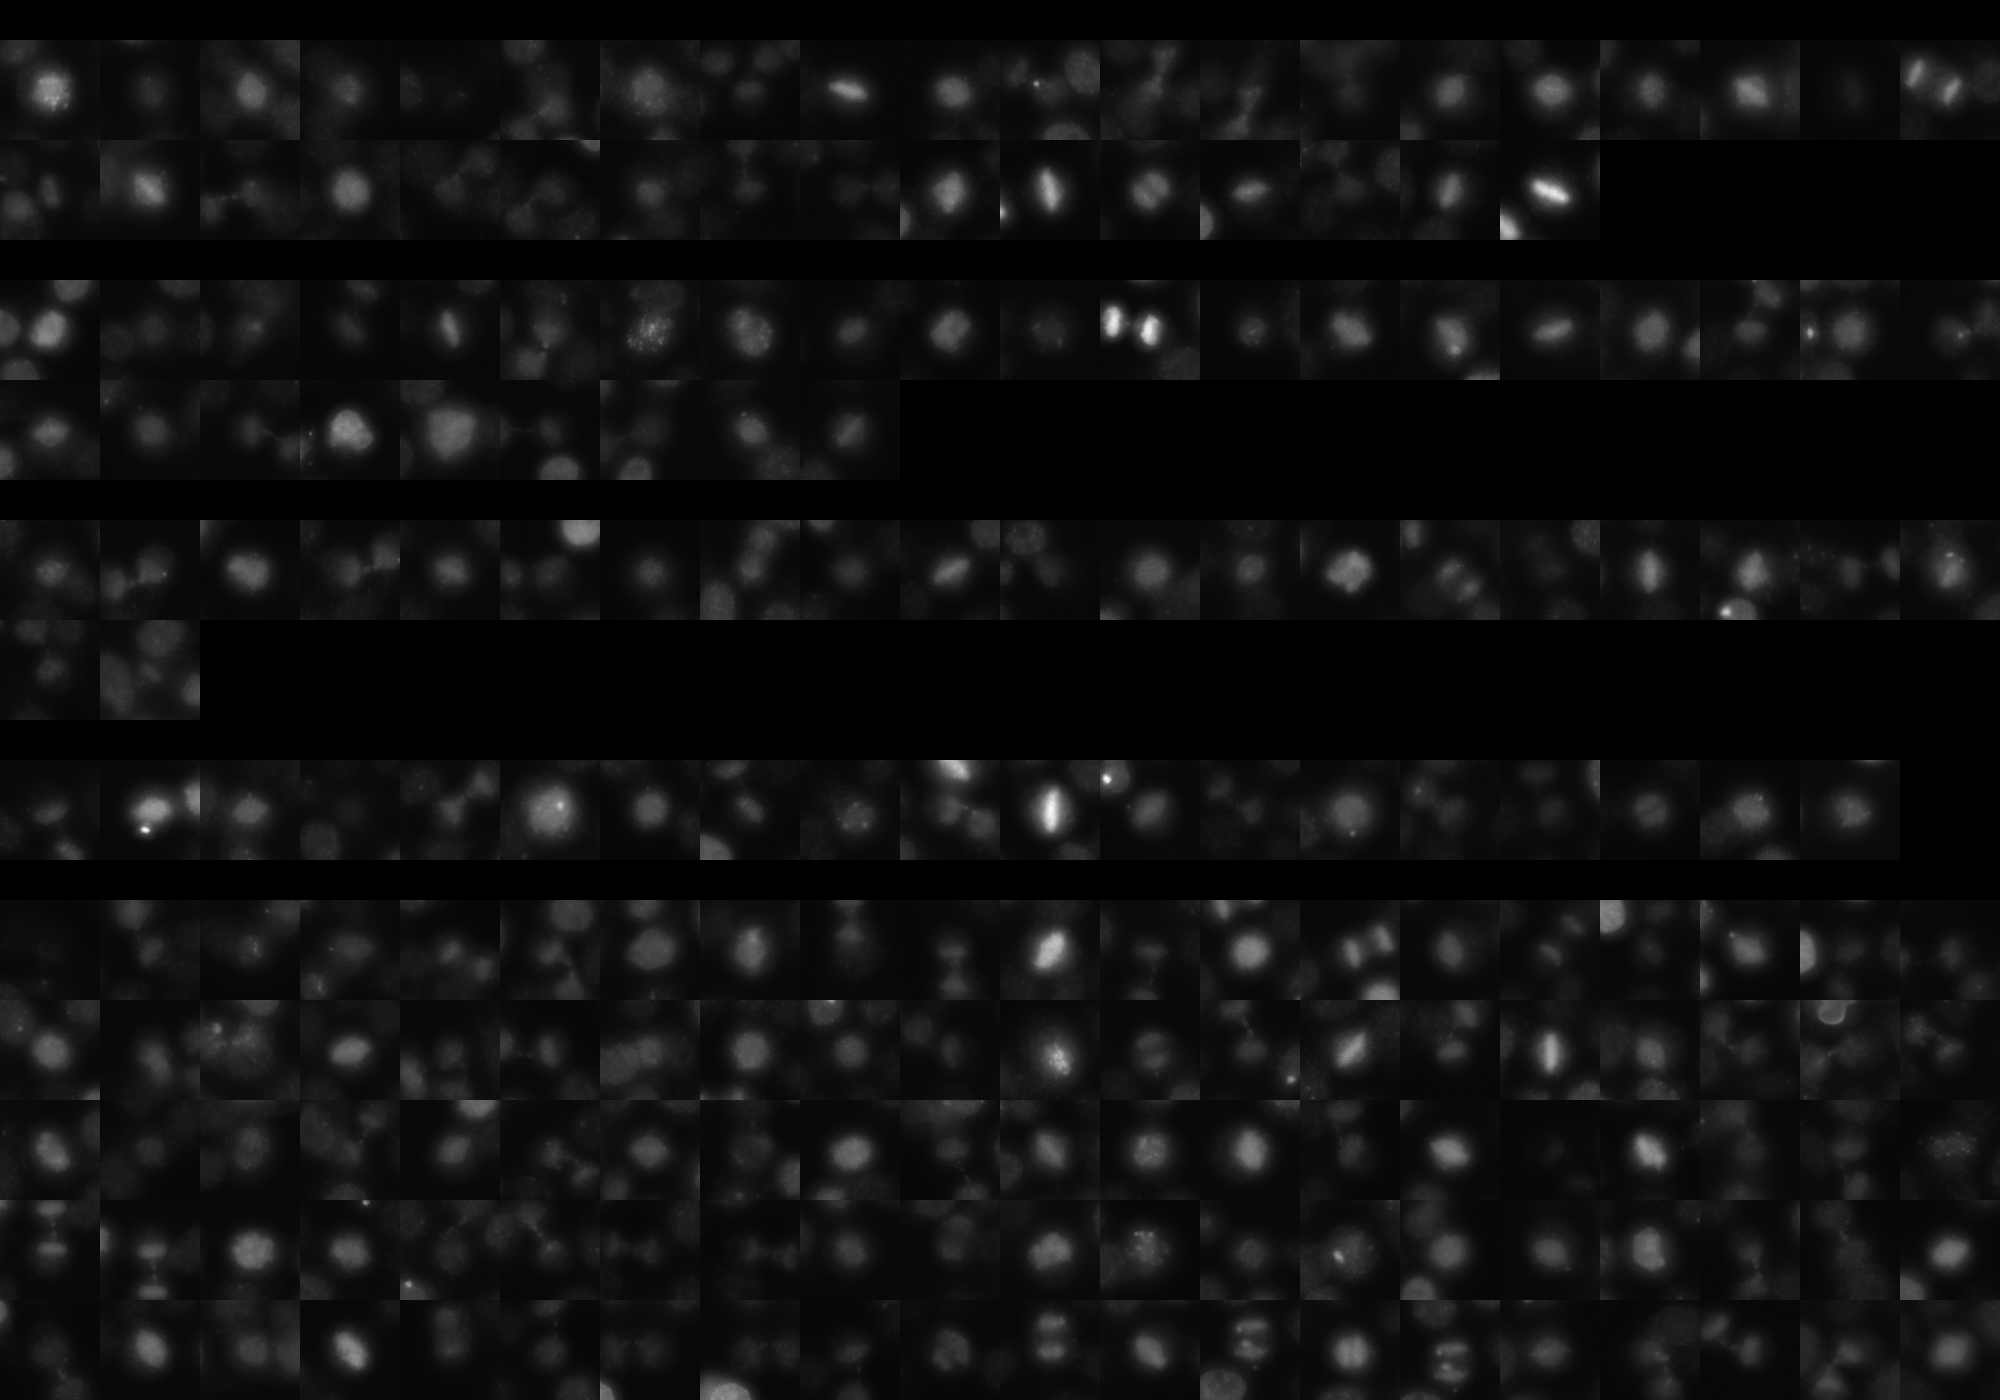
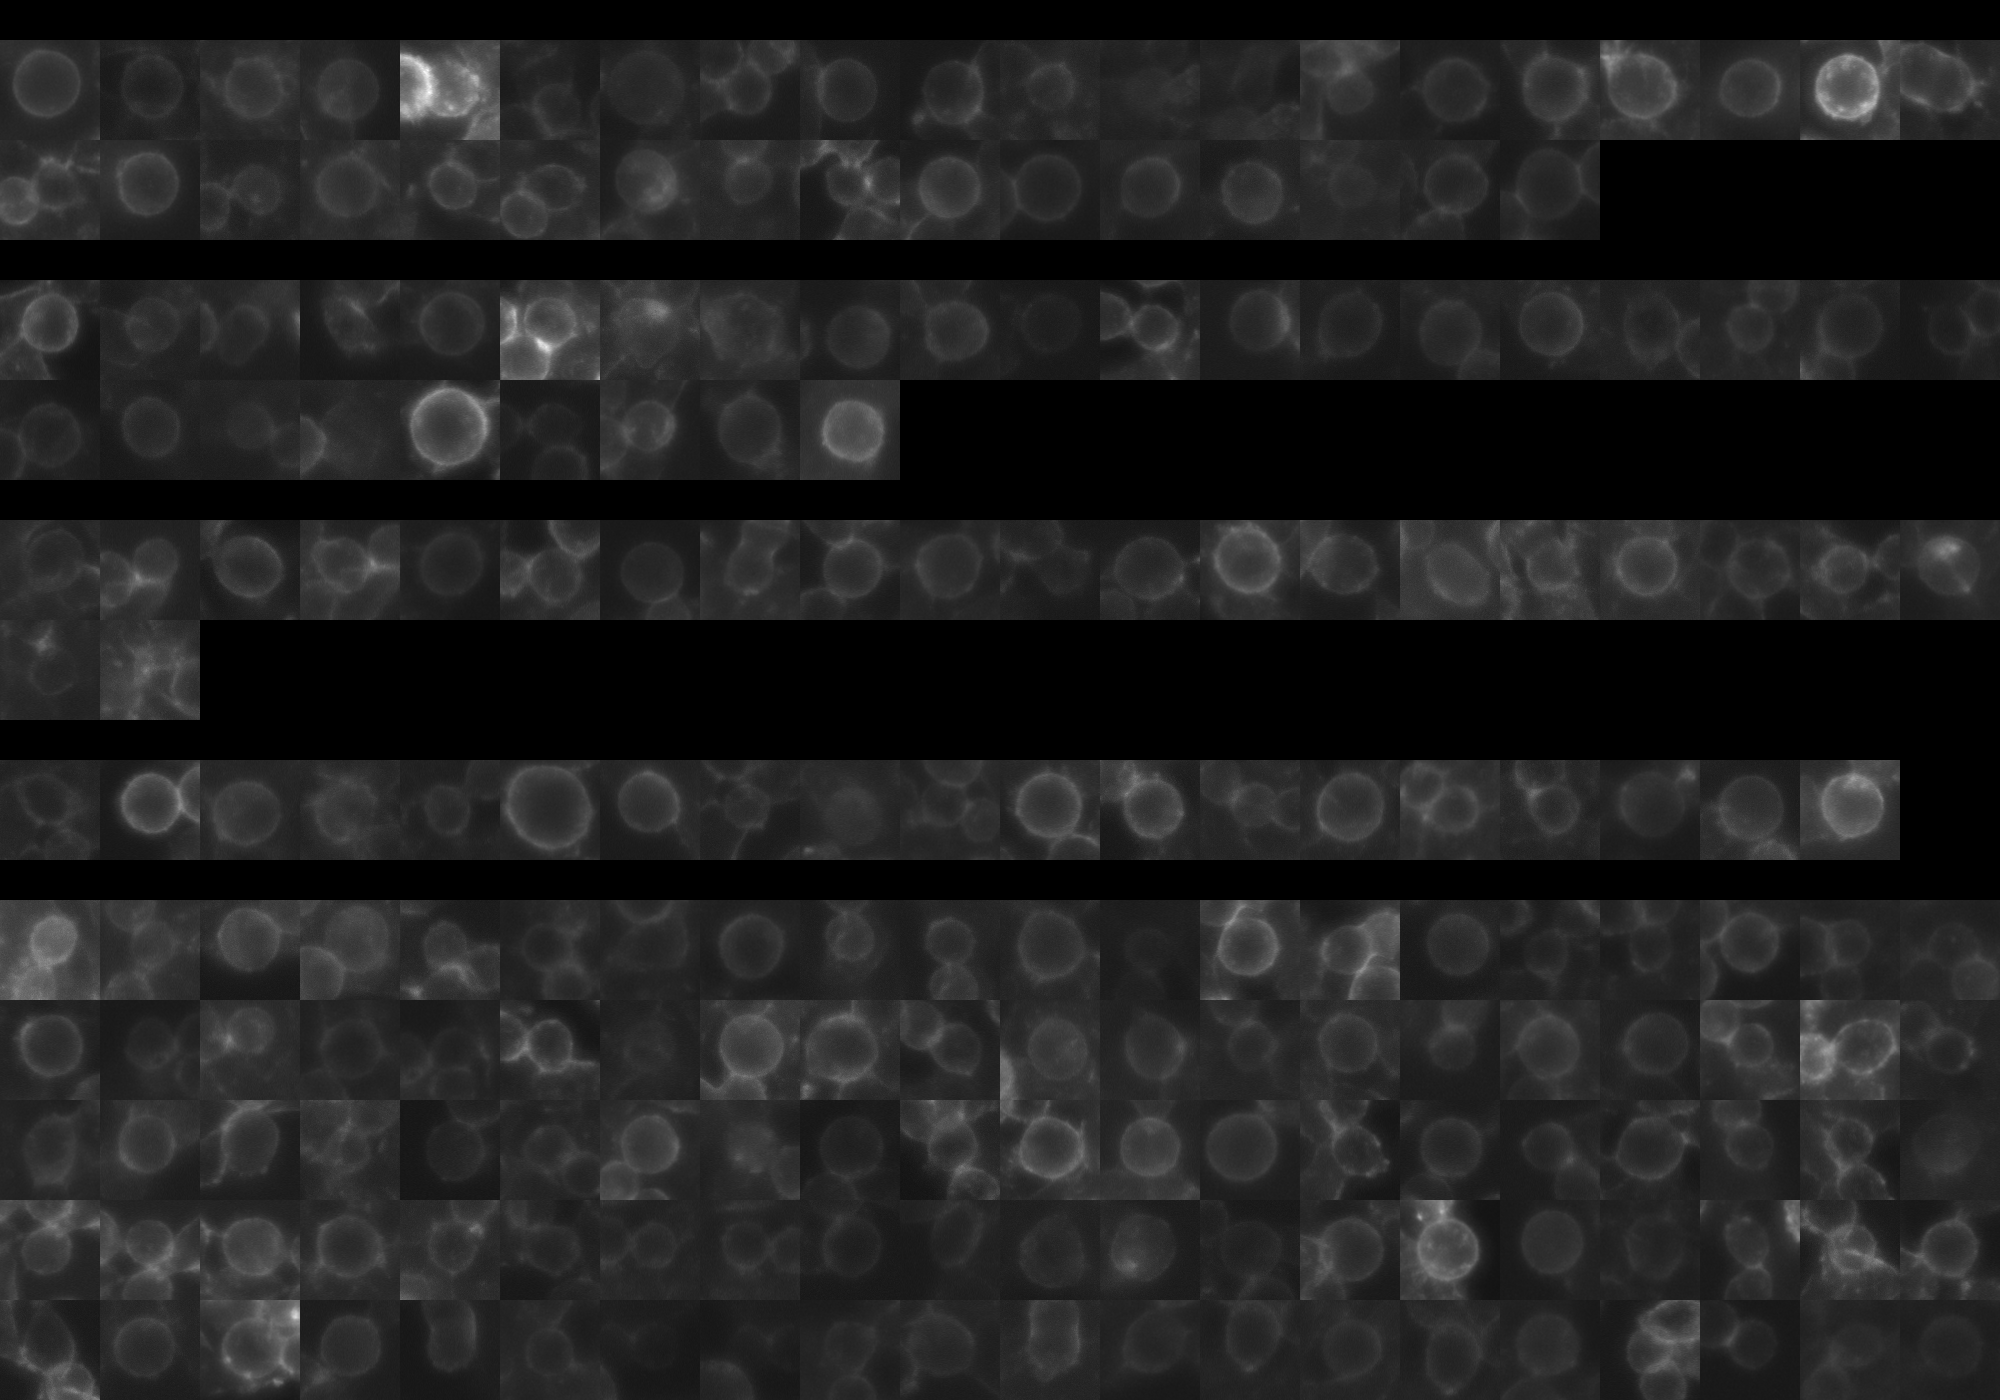
sgRNA 1: ACCAAGAATGGAAACAGCGA (interphase cells: 1297, mitotic cells: 36)
sgRNA 2: CTTCTGTGAGCTCATTGCGC (interphase cells: 1086, mitotic cells: 29)
sgRNA 3: GATCTGGAGGATCACCGAGA (interphase cells: 915, mitotic cells: 22)
sgRNA 4: TCAGAAGGAAATTTCCGAGG (interphase cells: 1157, mitotic cells: 19)

Interphase Cluster

Mitotic Cluster

Overview

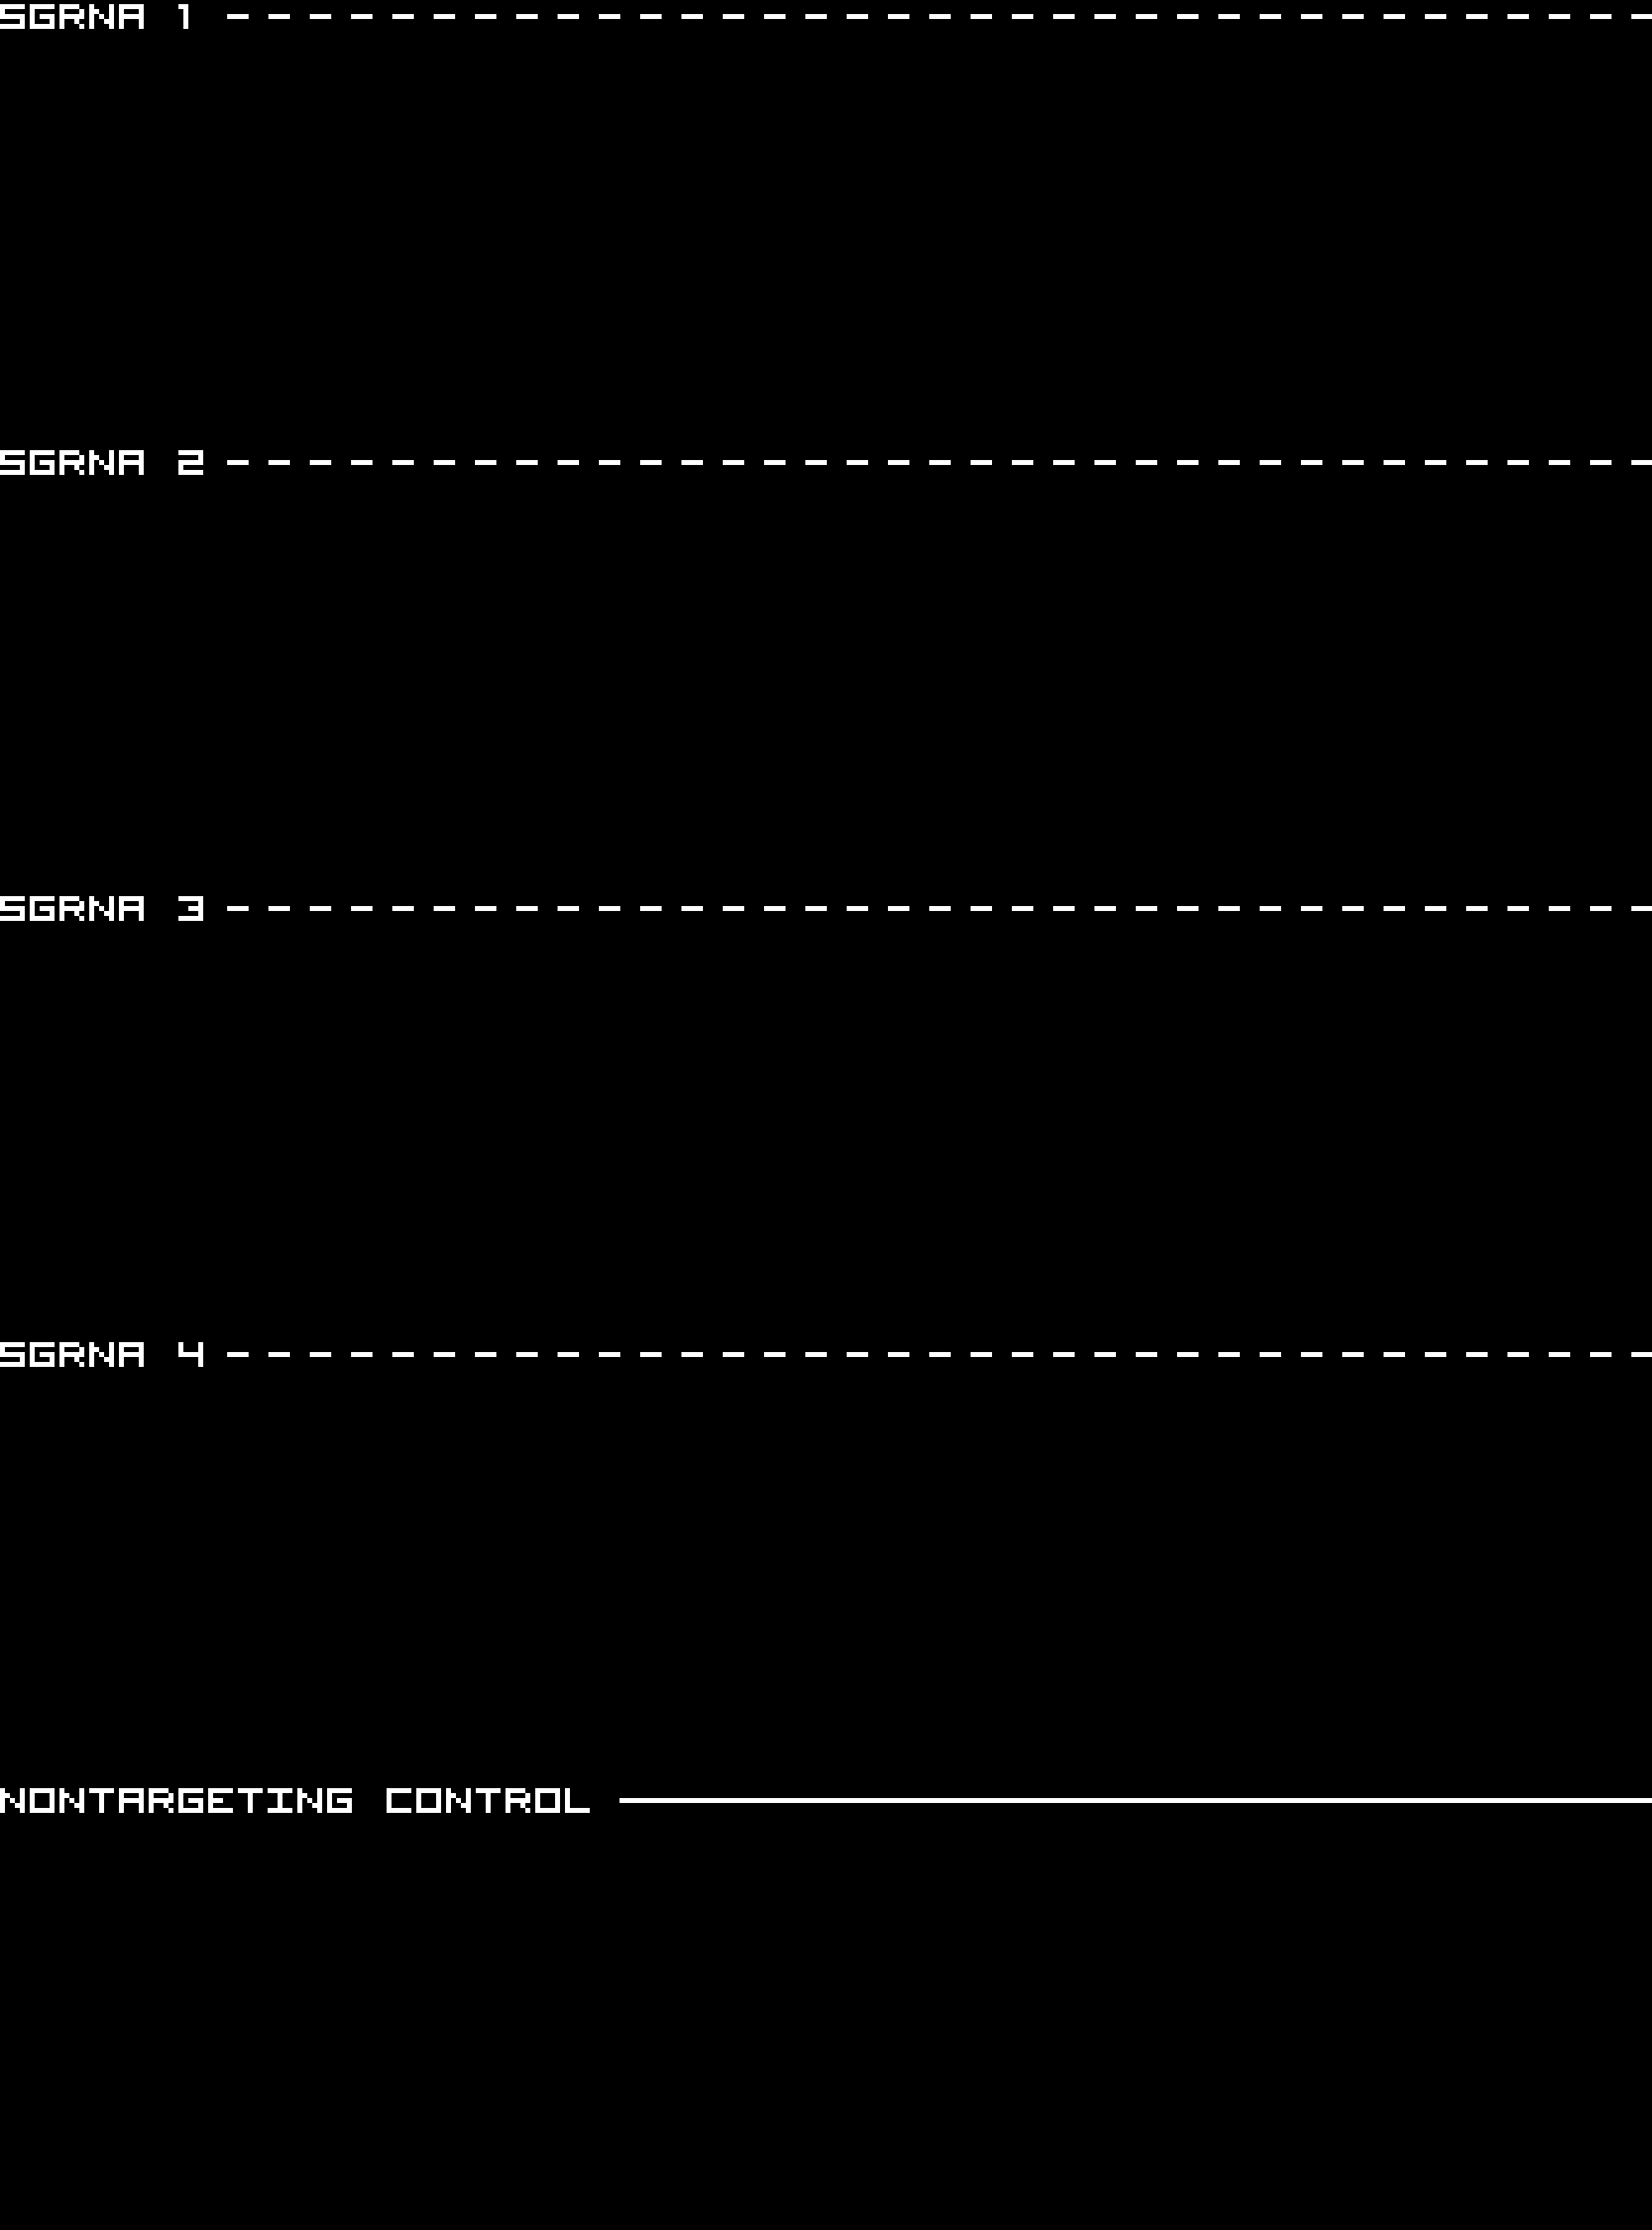
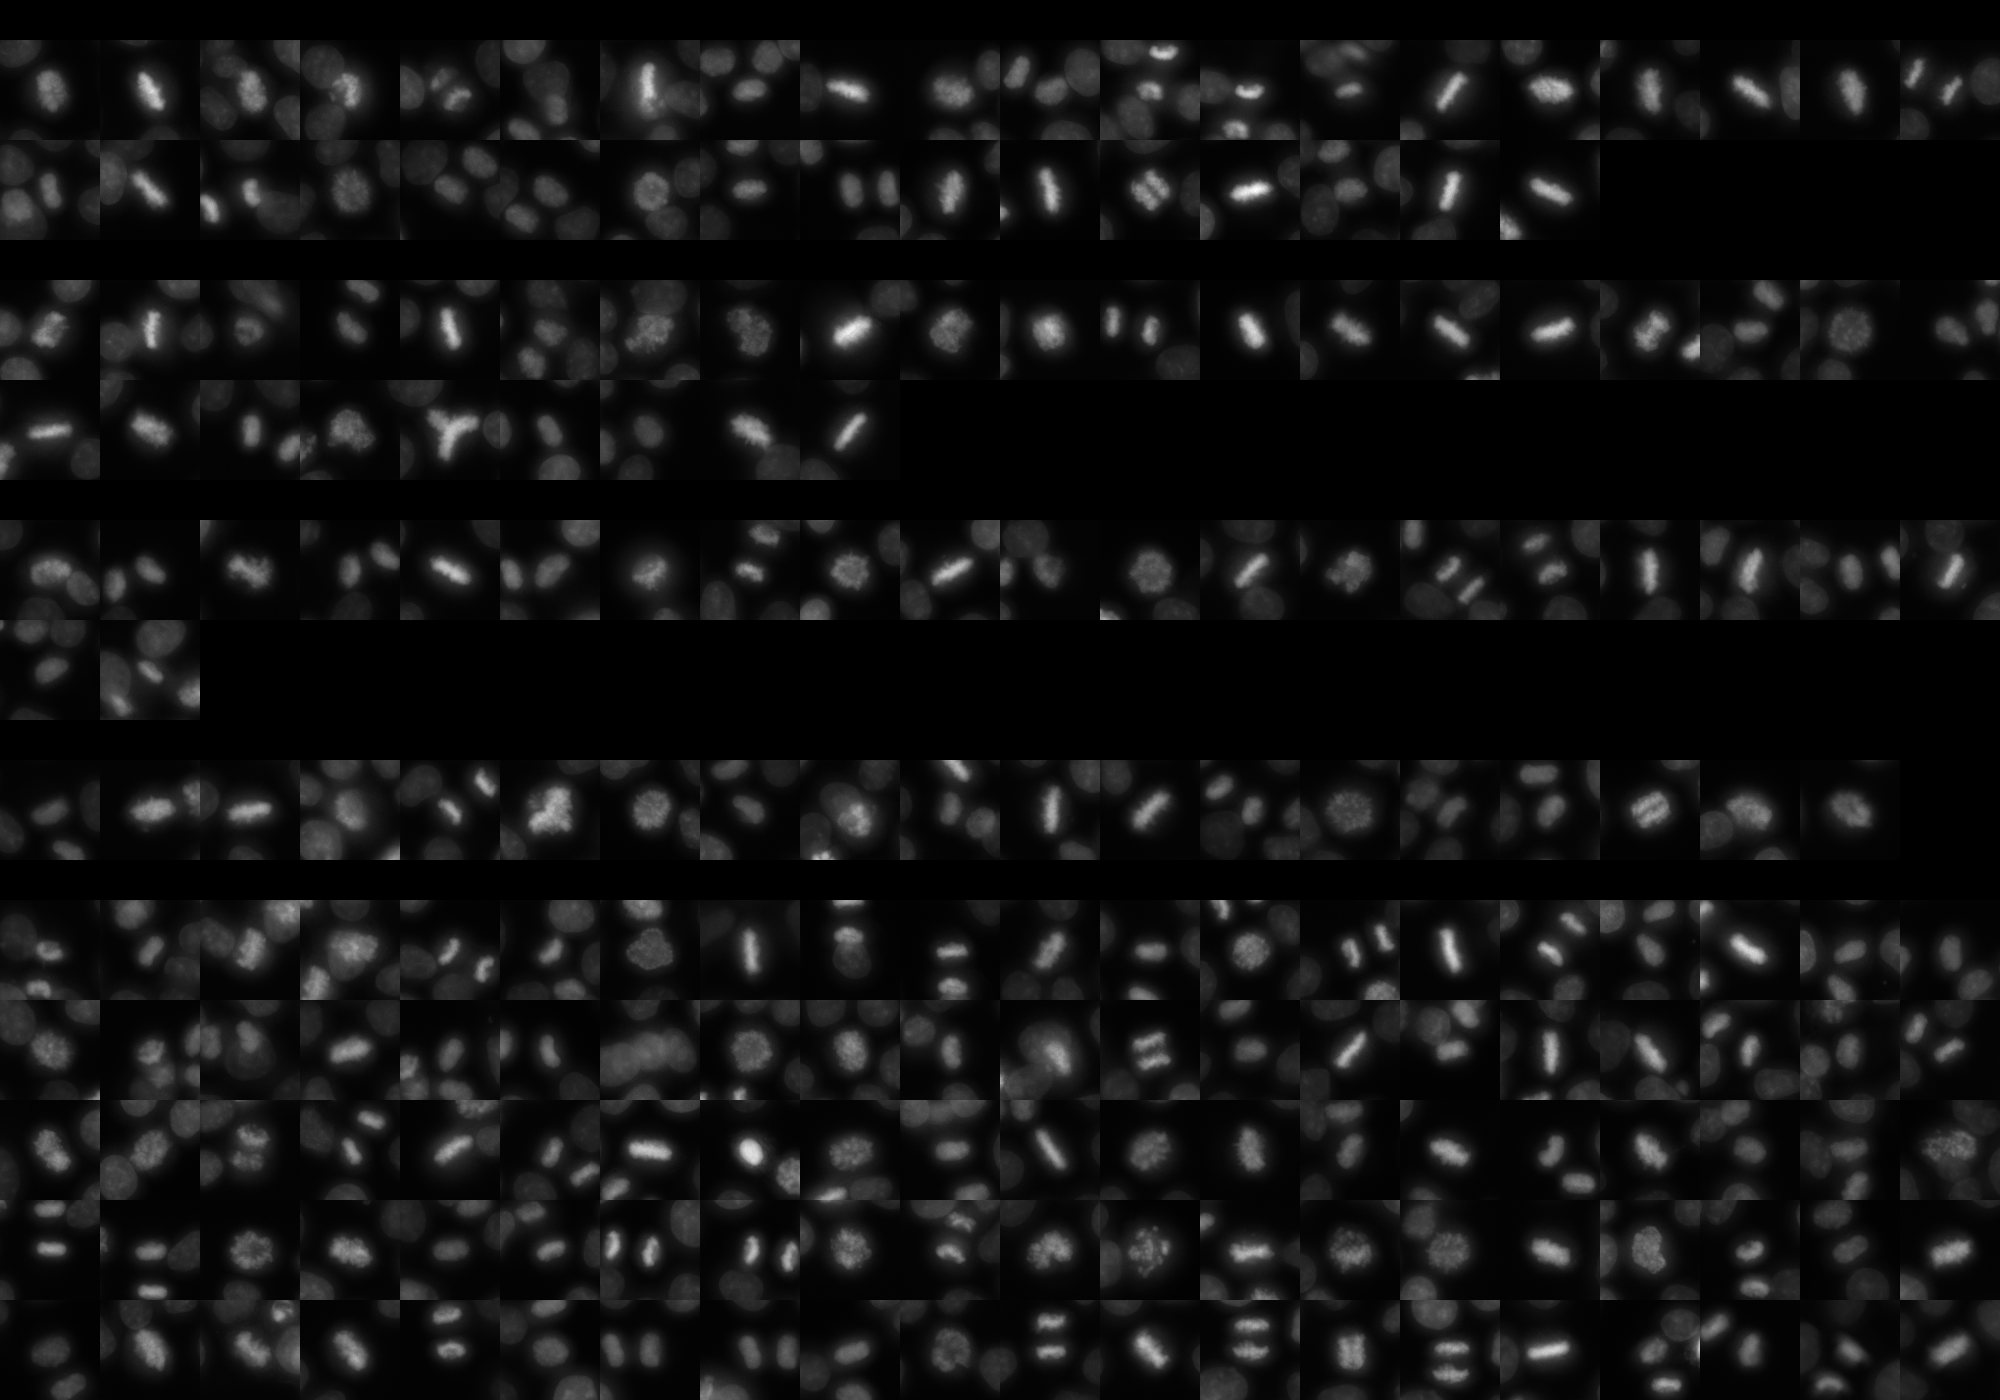
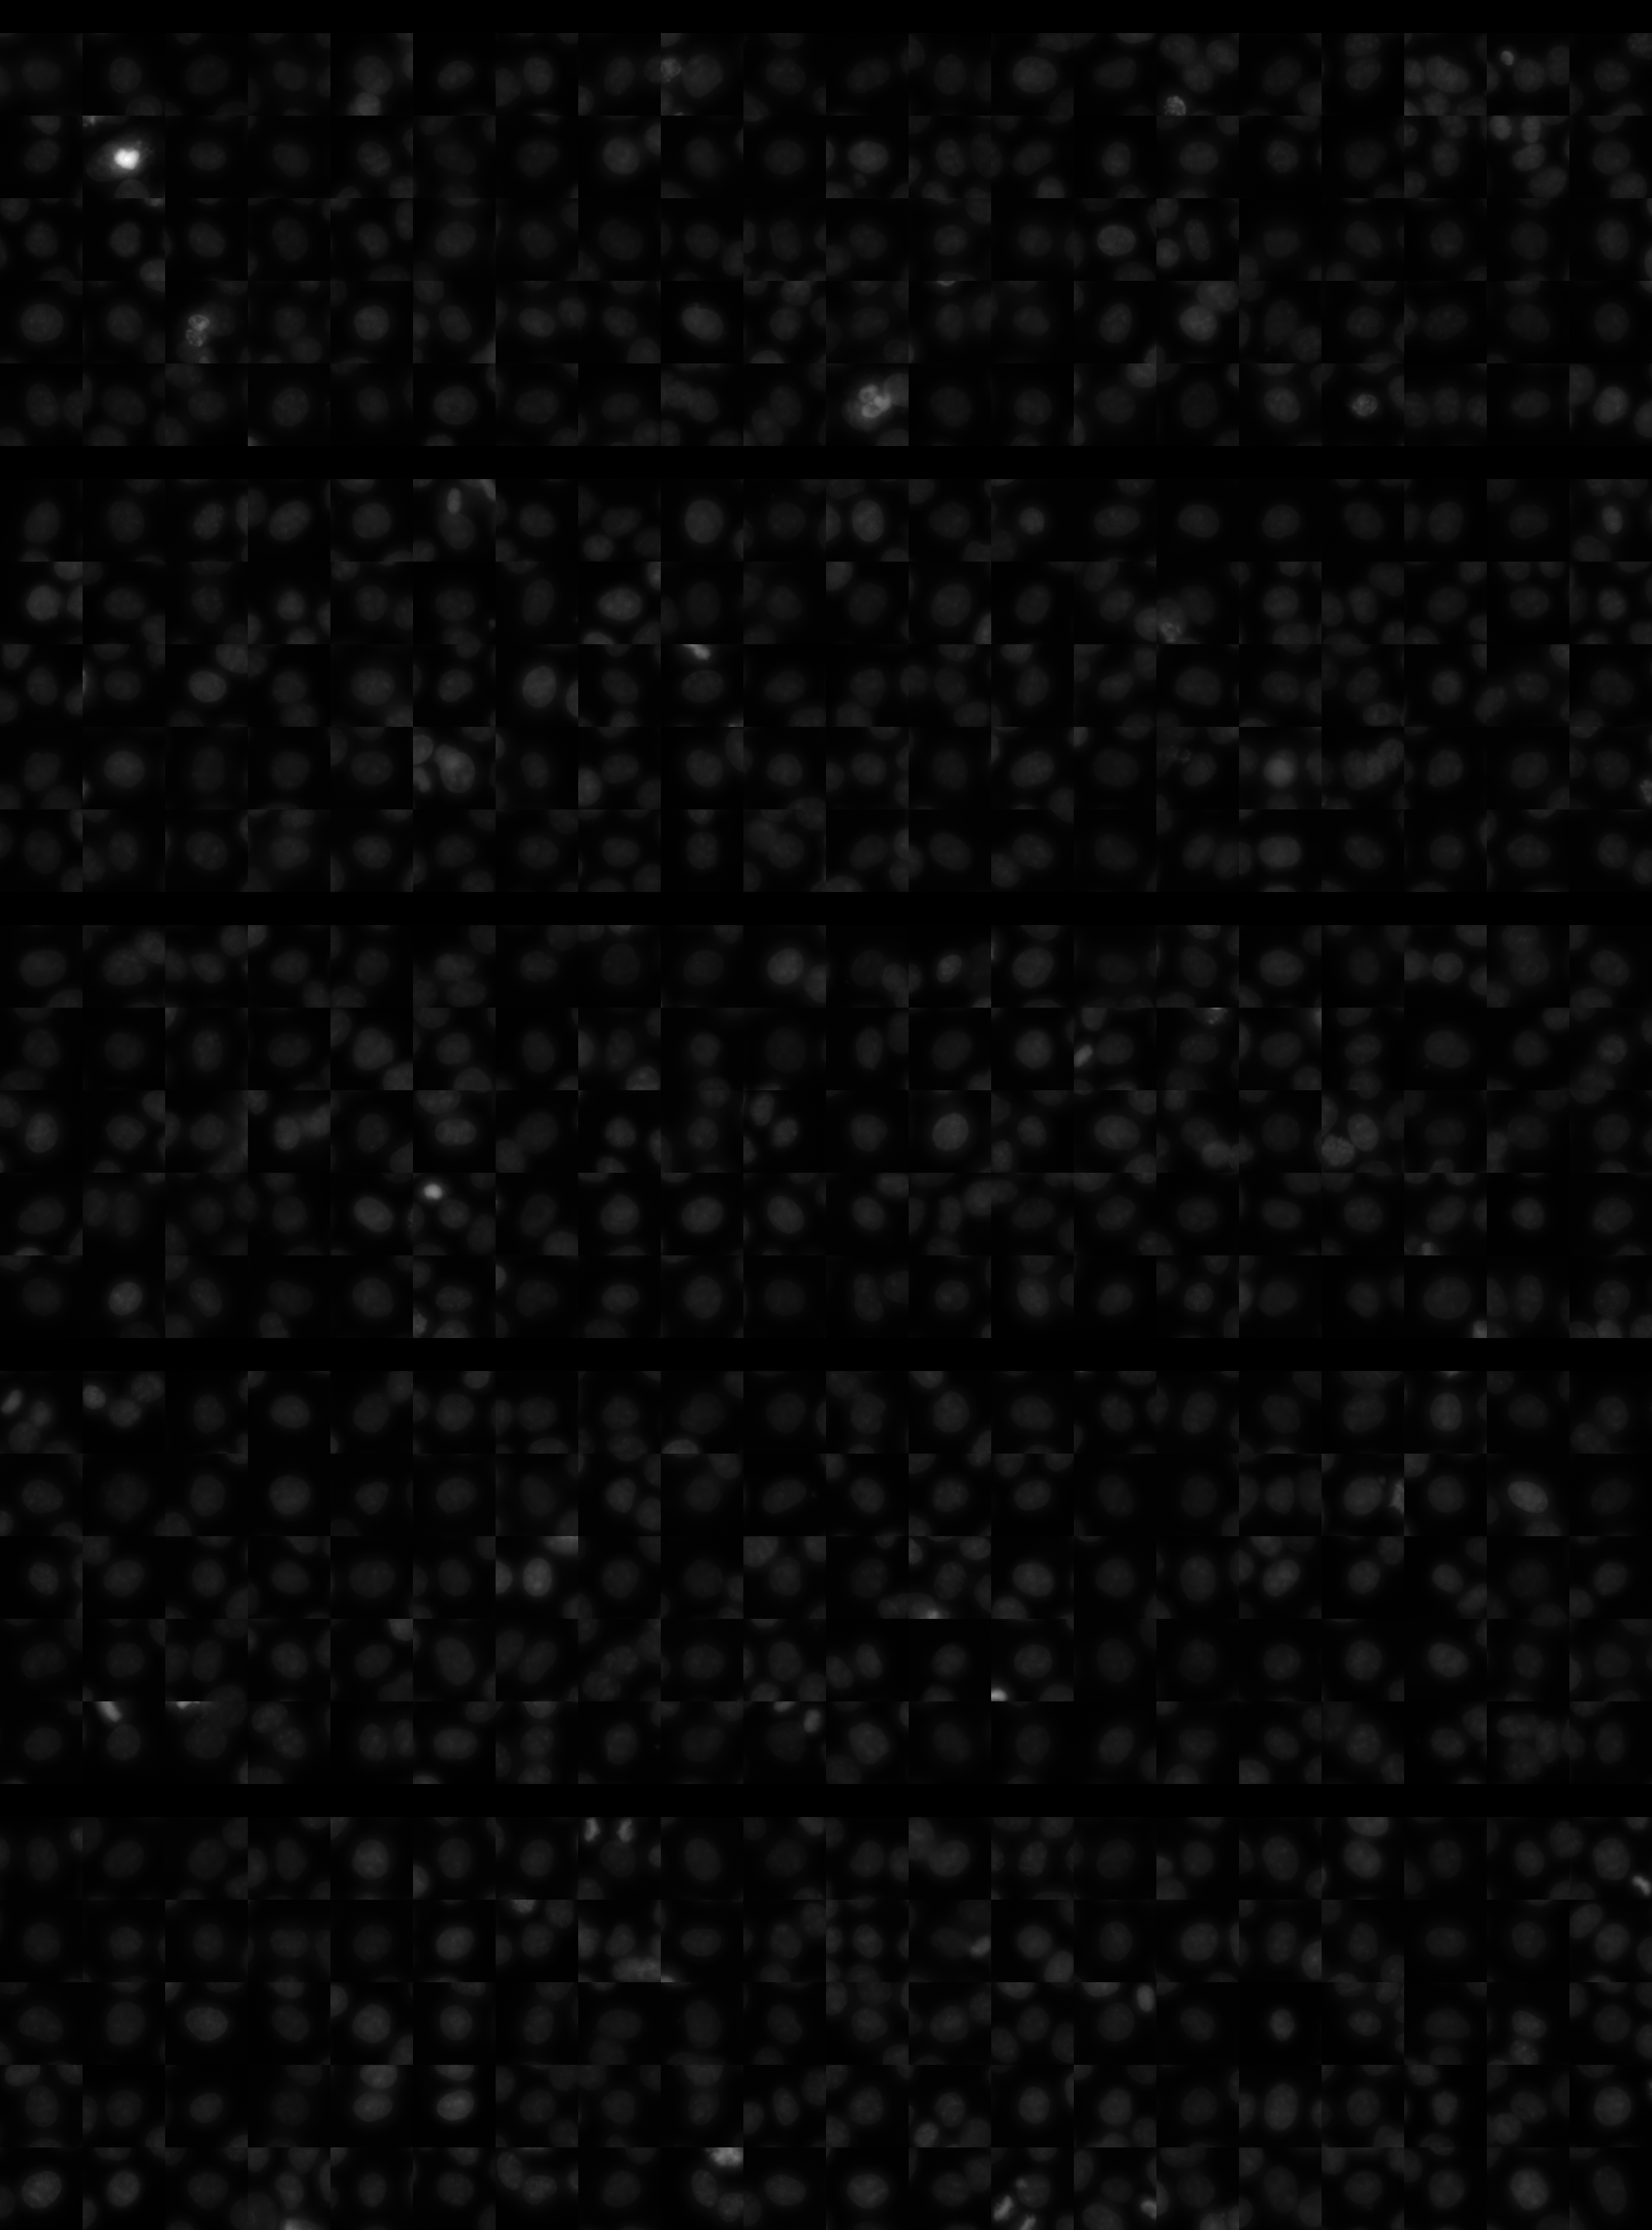
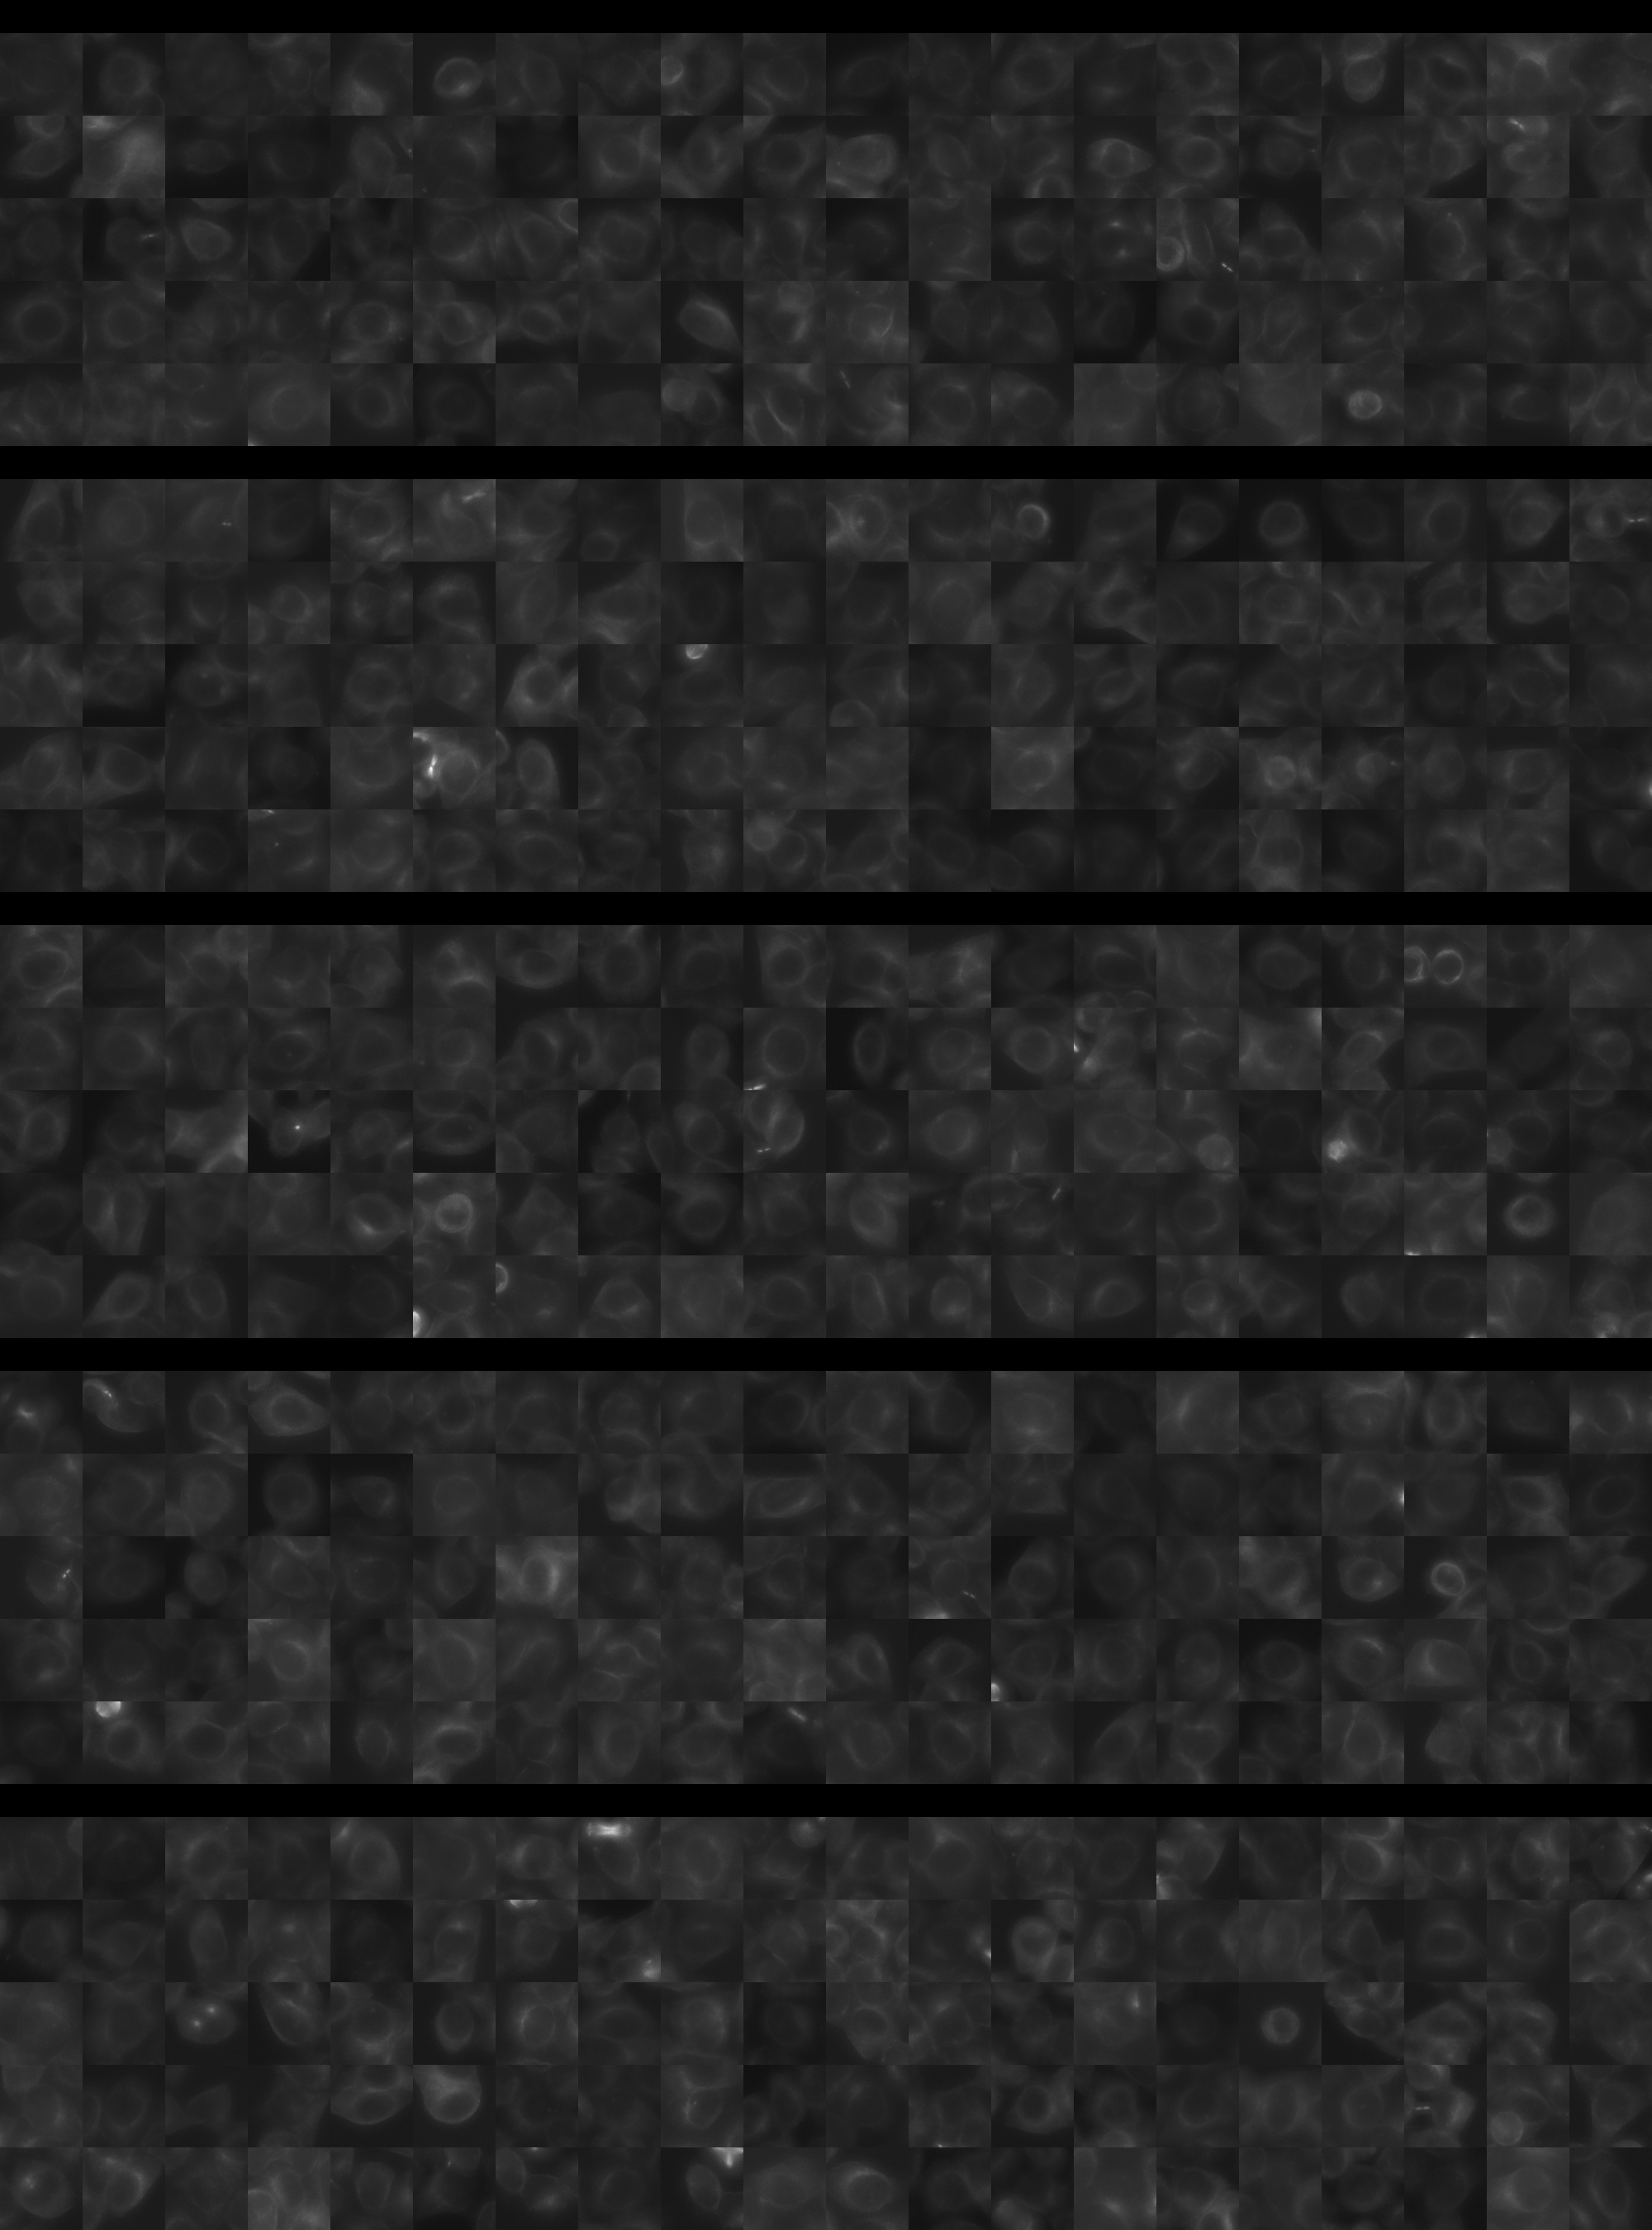
Each montage below shows randomly selected individual cell images for the same target gene separated by sgRNA, along with an example montage of cells expressing a non-targeting negative control sgRNA at the bottom. sgRNA labels in the montages correspond to the numbered sgRNA sequences in the gene info table above. The DNA (blue) and tubulin (green) channels are displayed by default, with gH2AX (grayscale) and actin (yellow) available using the check boxes. Channel brightness, contrast, and opacity are adjustable by clicking the arrow next to the channel name. When only one channel is selected, the display defaults to grayscale. Click the “Zoom” checkbox above the channel controls to enable image zooming (via scrolling) and panning (via click-and-drag).

The cell boxes displayed for this gene are square, 30.36 μm per side for the interphase montage and 30.36 μm per side for the mitotic montage.
Features

Interphase Score Rank FDR q-value
Nucleus DNA Integrated 0.029 1735 of 5322 0.746
Nucleus DNA Mean -1.324e-01 4861 of 5322 0.002
Nucleus gH2AX Mean 0.013 4390 of 5322 0.776
Nucleus DNA - gH2AX Correlation -9.860e-02 3949 of 5322 0.002
Nucleus Shape Area 0.115 588 of 5322 0.025
Nucleus Shape Eccentricity 0.085 311 of 5322 0.022
Nucleus Shape Form Factor -7.255e-02 3656 of 5322 0.076
Nucleus Shape Solidity -6.671e-02 3393 of 5322 0.063
Cell DNA Mass Displacement 0.049 1202 of 5322 0.398
Cell Tubulin Mean -3.453e-02 3948 of 5322 0.537
Cell Tubulin Mass Displacement 0.051 589 of 5322 0.271
Cell Actin Mean -1.217e-01 5040 of 5322 0.005
Cell Tubulin - Actin Correlation 0.014 2978 of 5322 0.803
Cell DNA - Tubulin Correlation 0.027 2706 of 5322 0.557
Cell Shape Area 0.067 1081 of 5322 0.283
Cell Shape Eccentricity 0.068 222 of 5322 0.203
Mitotic Score Rank FDR q-value
Nucleus DNA Integrated 0.241 899 of 5322 0.824
Nucleus DNA Mean -3.028e-02 3439 of 5322 1.000
Nucleus DNA Mass Displacement -1.235e-01 4870 of 5322 0.999
Nucleus DNA Mean Frac 3 0.044 2435 of 5322 1.000
Nucleus gH2AX Mean 0.013 2782 of 5322 1.000
Nucleus gH2AX Mean Frac 0 0.097 988 of 5322 1.000
Nucleus Tubulin Mean Frac 0 0.029 3054 of 5322 0.999
Nucleus Tubulin Mean Edge 0.026 2799 of 5322 0.999
Nucleus Tubulin Std Edge 0.101 1252 of 5322 0.999
Nucleus Shape Area 0.294 820 of 5322 0.747
Nucleus Shape Eccentricity 0.067 1167 of 5322 1.000
Nucleus Shape Form Factor 0.079 550 of 5322 0.998
Cell Tubulin Mean 0.141 1531 of 5322 0.997
Cell Tubulin Mean Frac 3 -2.685e-01 4561 of 5322 0.999
Cell Actin Mean 0.164 1161 of 5322 0.997
Cell Shape Area 0.197 1417 of 5322 0.994
( Reset Zoom )
Brightness
Contrast
Opacity
Brightness
Contrast
Opacity
Brightness
Contrast
Opacity
Brightness
Contrast
Opacity
Brightness
Contrast
Opacity

( Reset Zoom )
Brightness
Contrast
Opacity
Brightness
Contrast
Opacity
Brightness
Contrast
Opacity
Brightness
Contrast
Opacity
Brightness
Contrast
Opacity

MIT Central Accessability