EIF3A

Gene symbol: EIF3A
Gene: 8661
Uniprot Function: RNA-binding component of the eukaryotic translation initiation factor 3 (eIF-3) complex, which is required for several steps in the initiation of protein synthesis (PubMed:17581632, PubMed:25849773). The eIF-3 complex associates with the 40S ribosome and facilitates the recruitment of eIF-1, eIF-1A, eIF-2:GTP:methionyl-tRNAi and eIF-5 to form the 43S pre-initiation complex (43S PIC). The eIF-3 complex stimulates mRNA recruitment to the 43S PIC and scanning of the mRNA for AUG recognition. The eIF-3 complex is also required for disassembly and recycling of post-termination ribosomal complexes and subsequently prevents premature joining of the 40S and 60S ribosomal subunits prior to initiation (PubMed:17581632, PubMed:11169732). The eIF-3 complex specifically targets and initiates translation of a subset of mRNAs involved in cell proliferation, including cell cycling, differentiation and apoptosis, and uses different modes of RNA stem-loop binding to exert either translational activation or repression (PubMed:25849773, PubMed:27462815).
Mitotic Index 0.022
Interphase Cluster: #66 (29 genes)
Mitotic Cluster: #5 (49 genes)
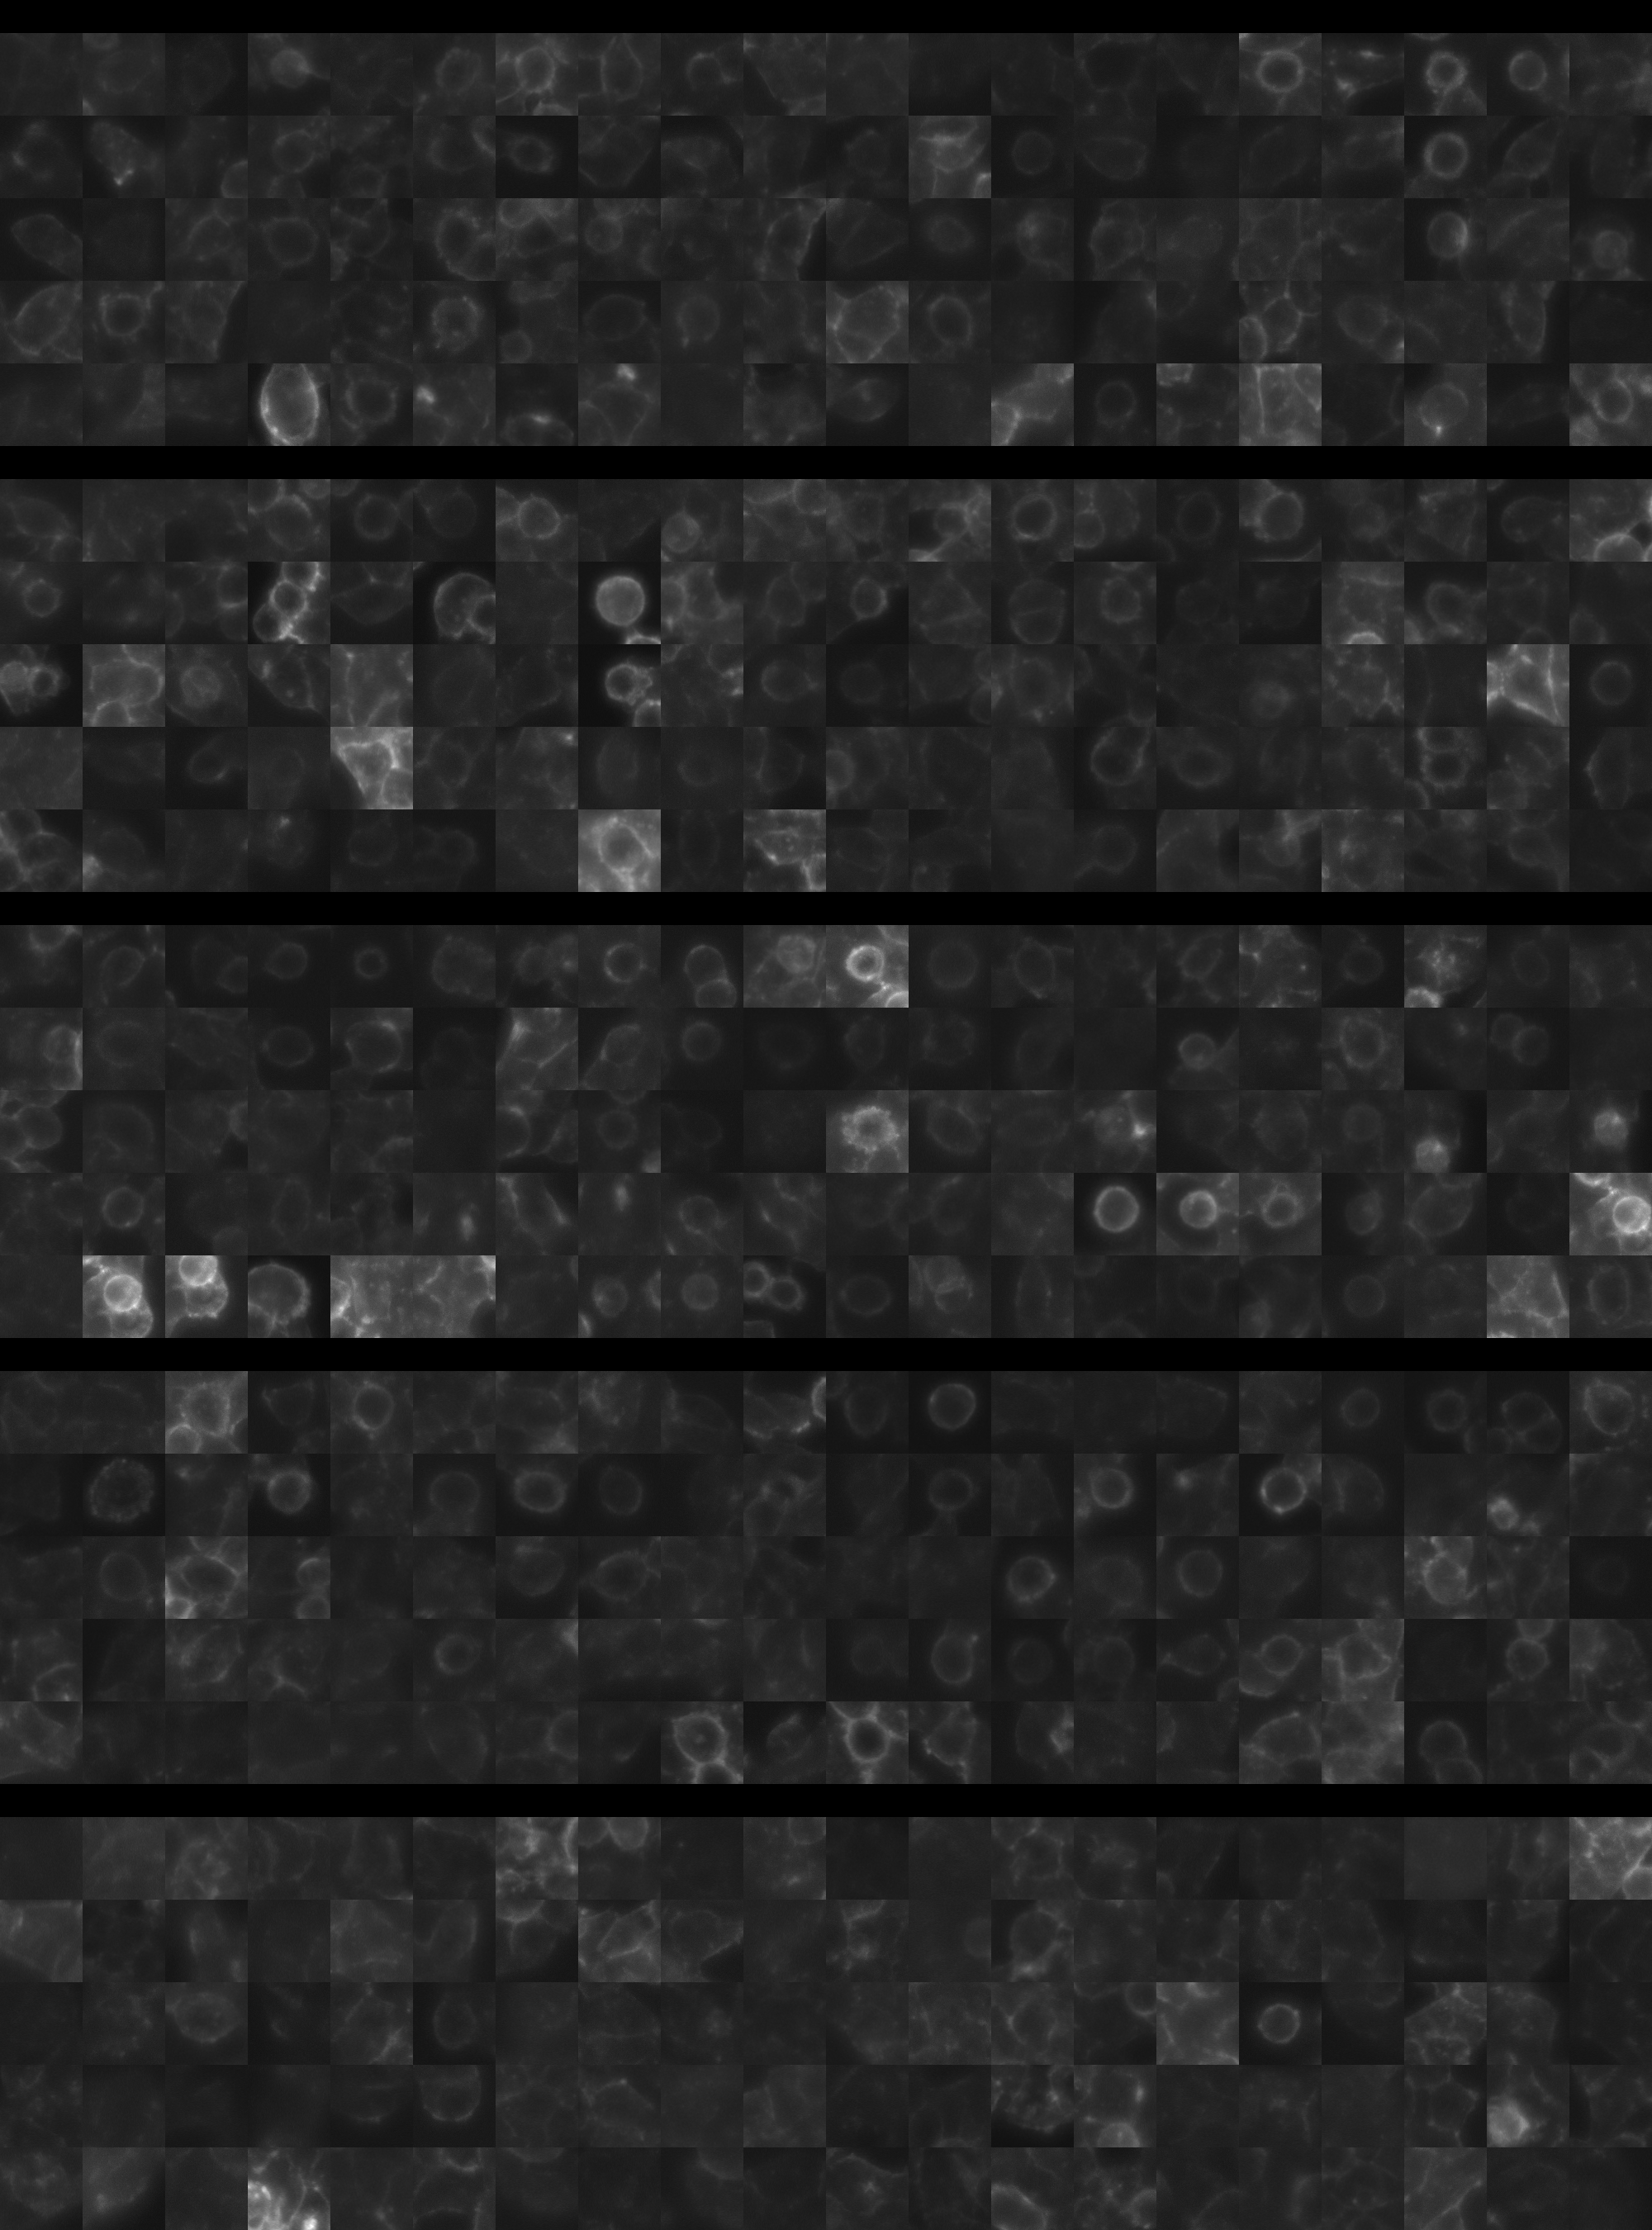
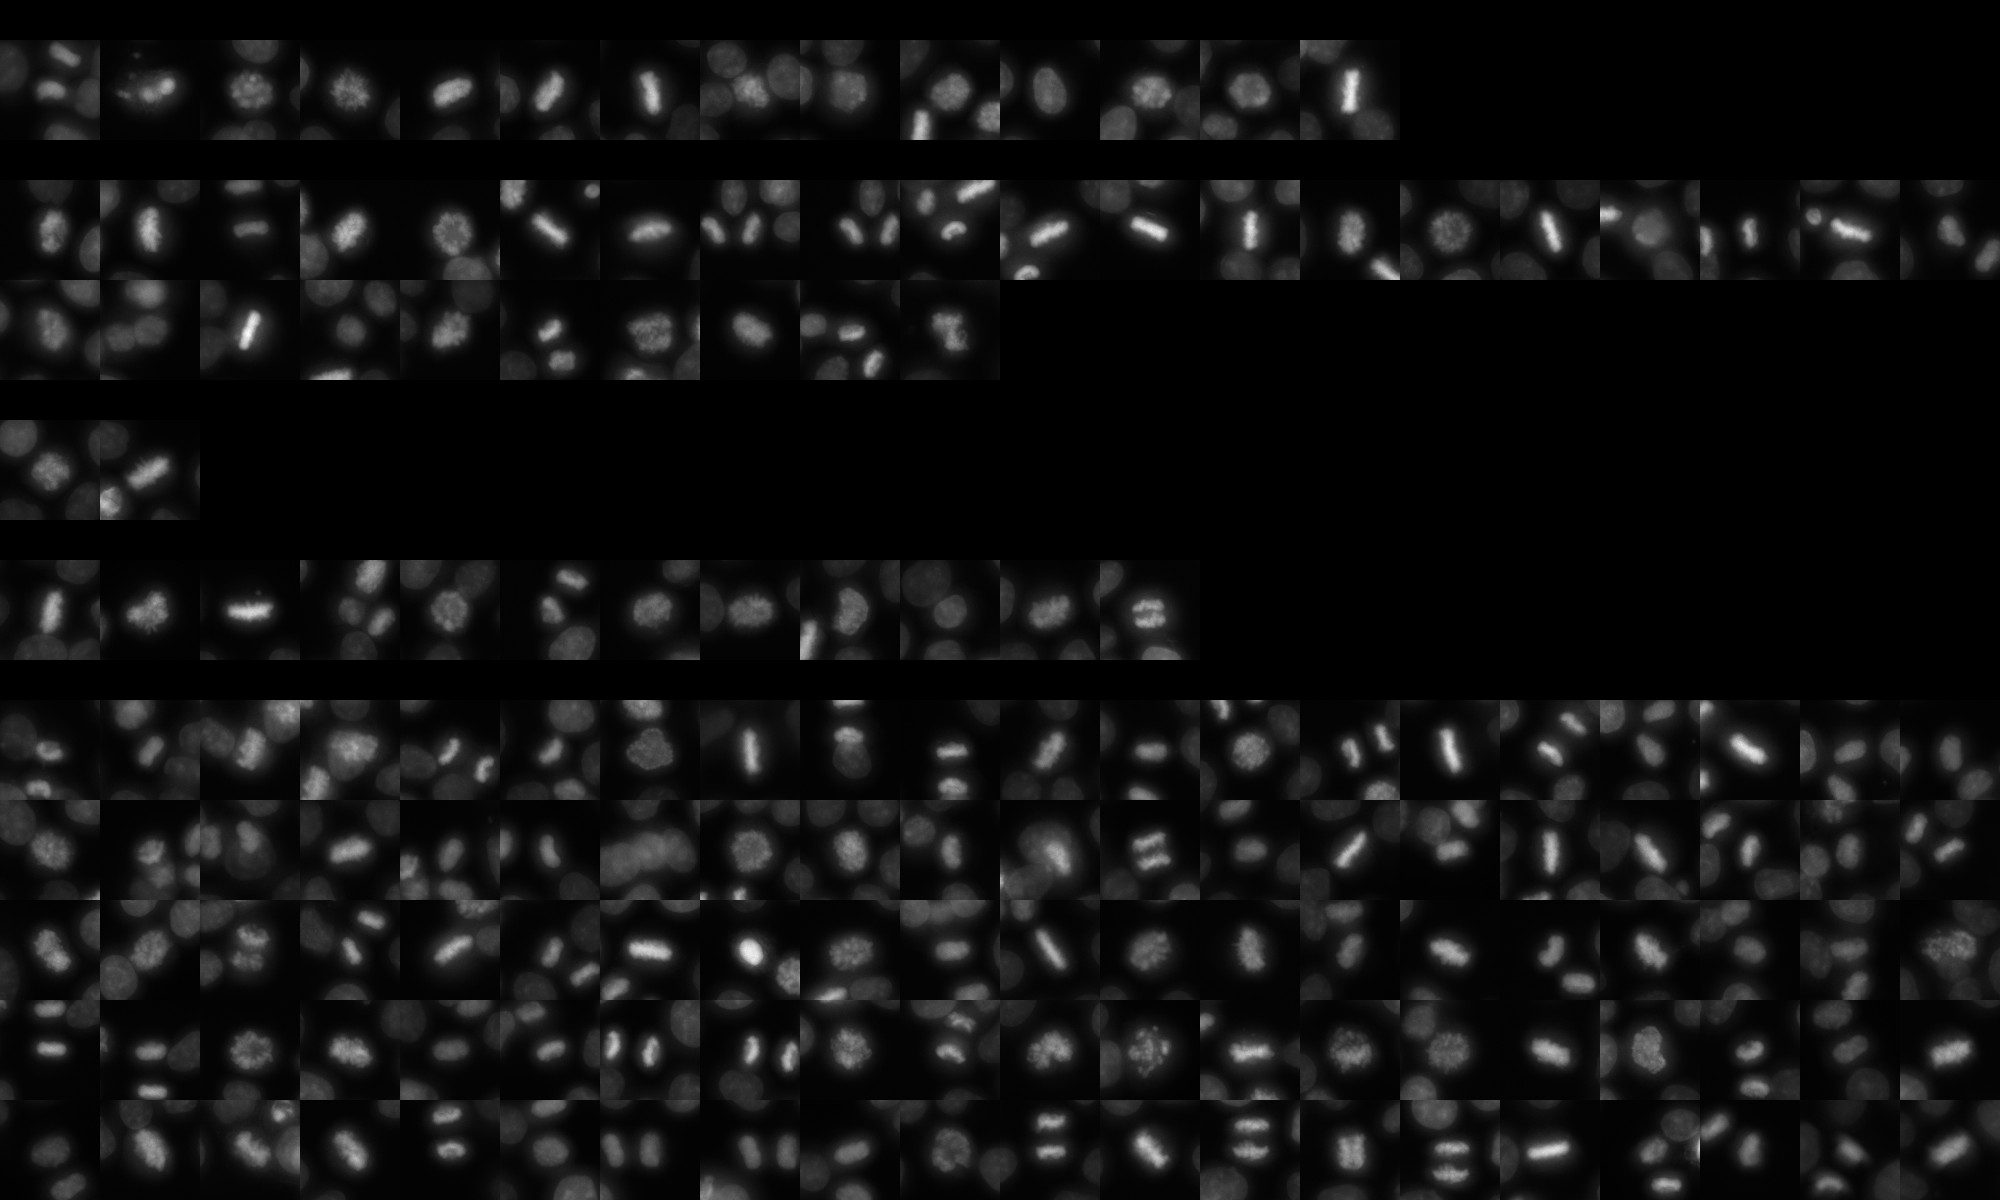
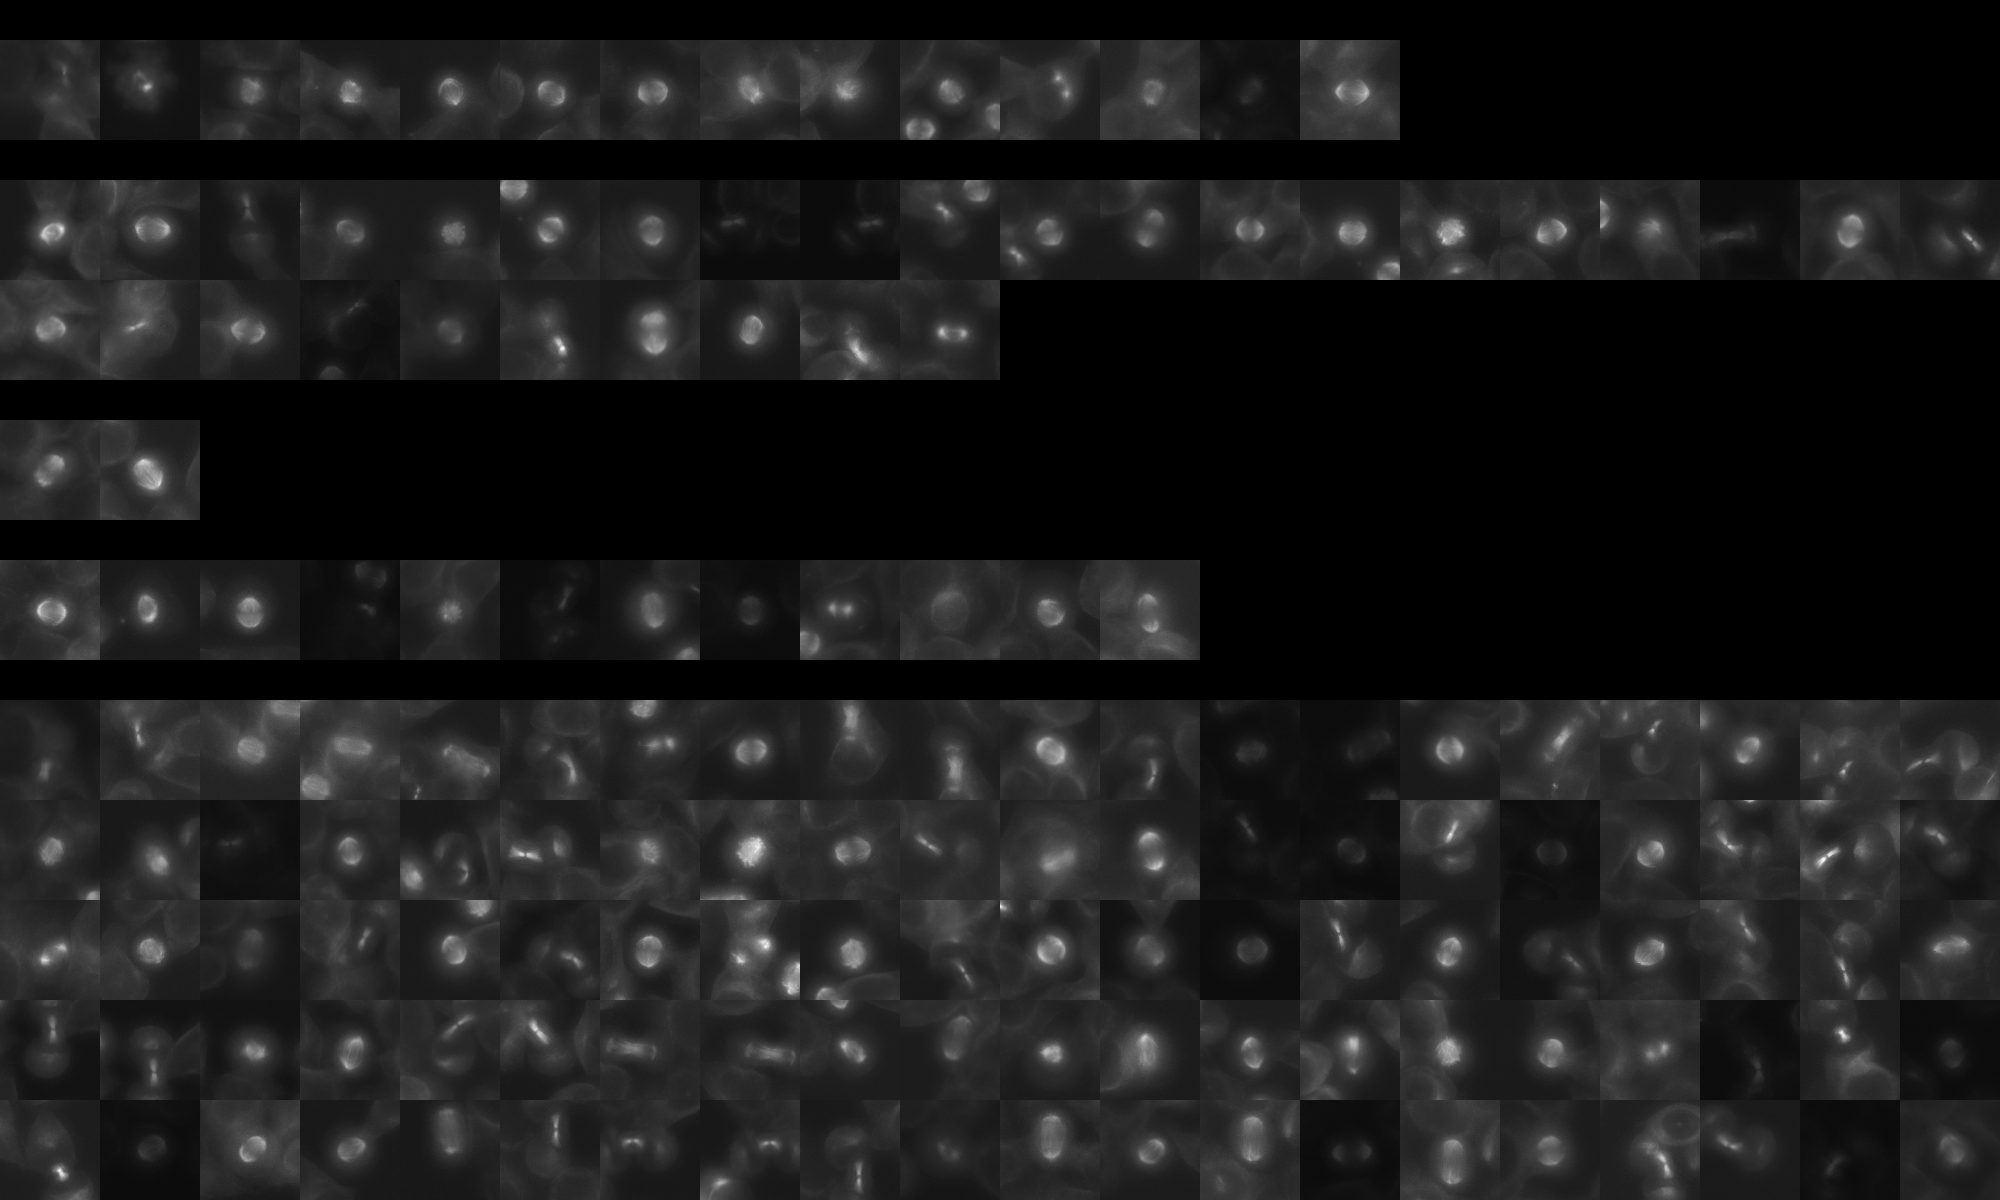
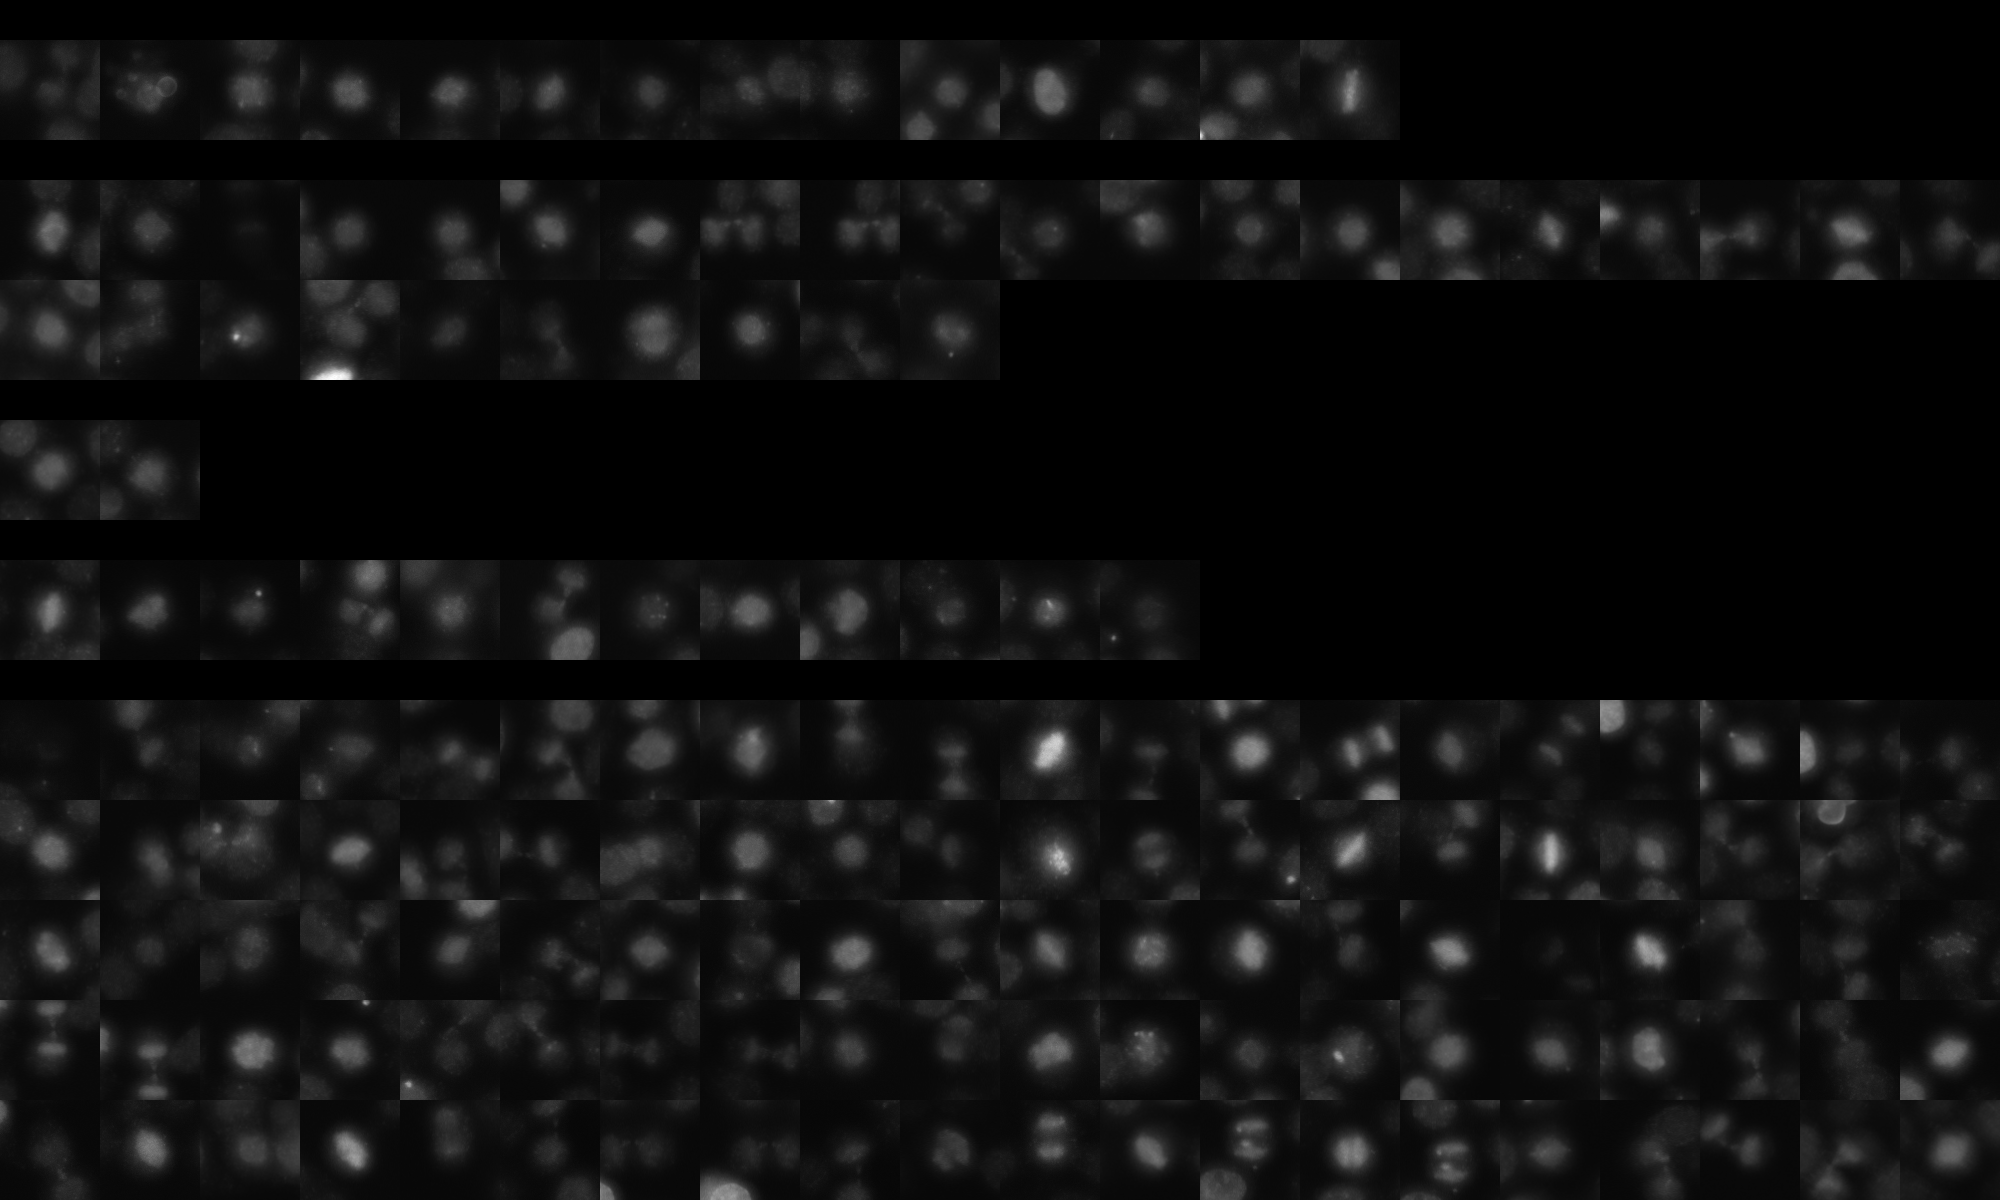
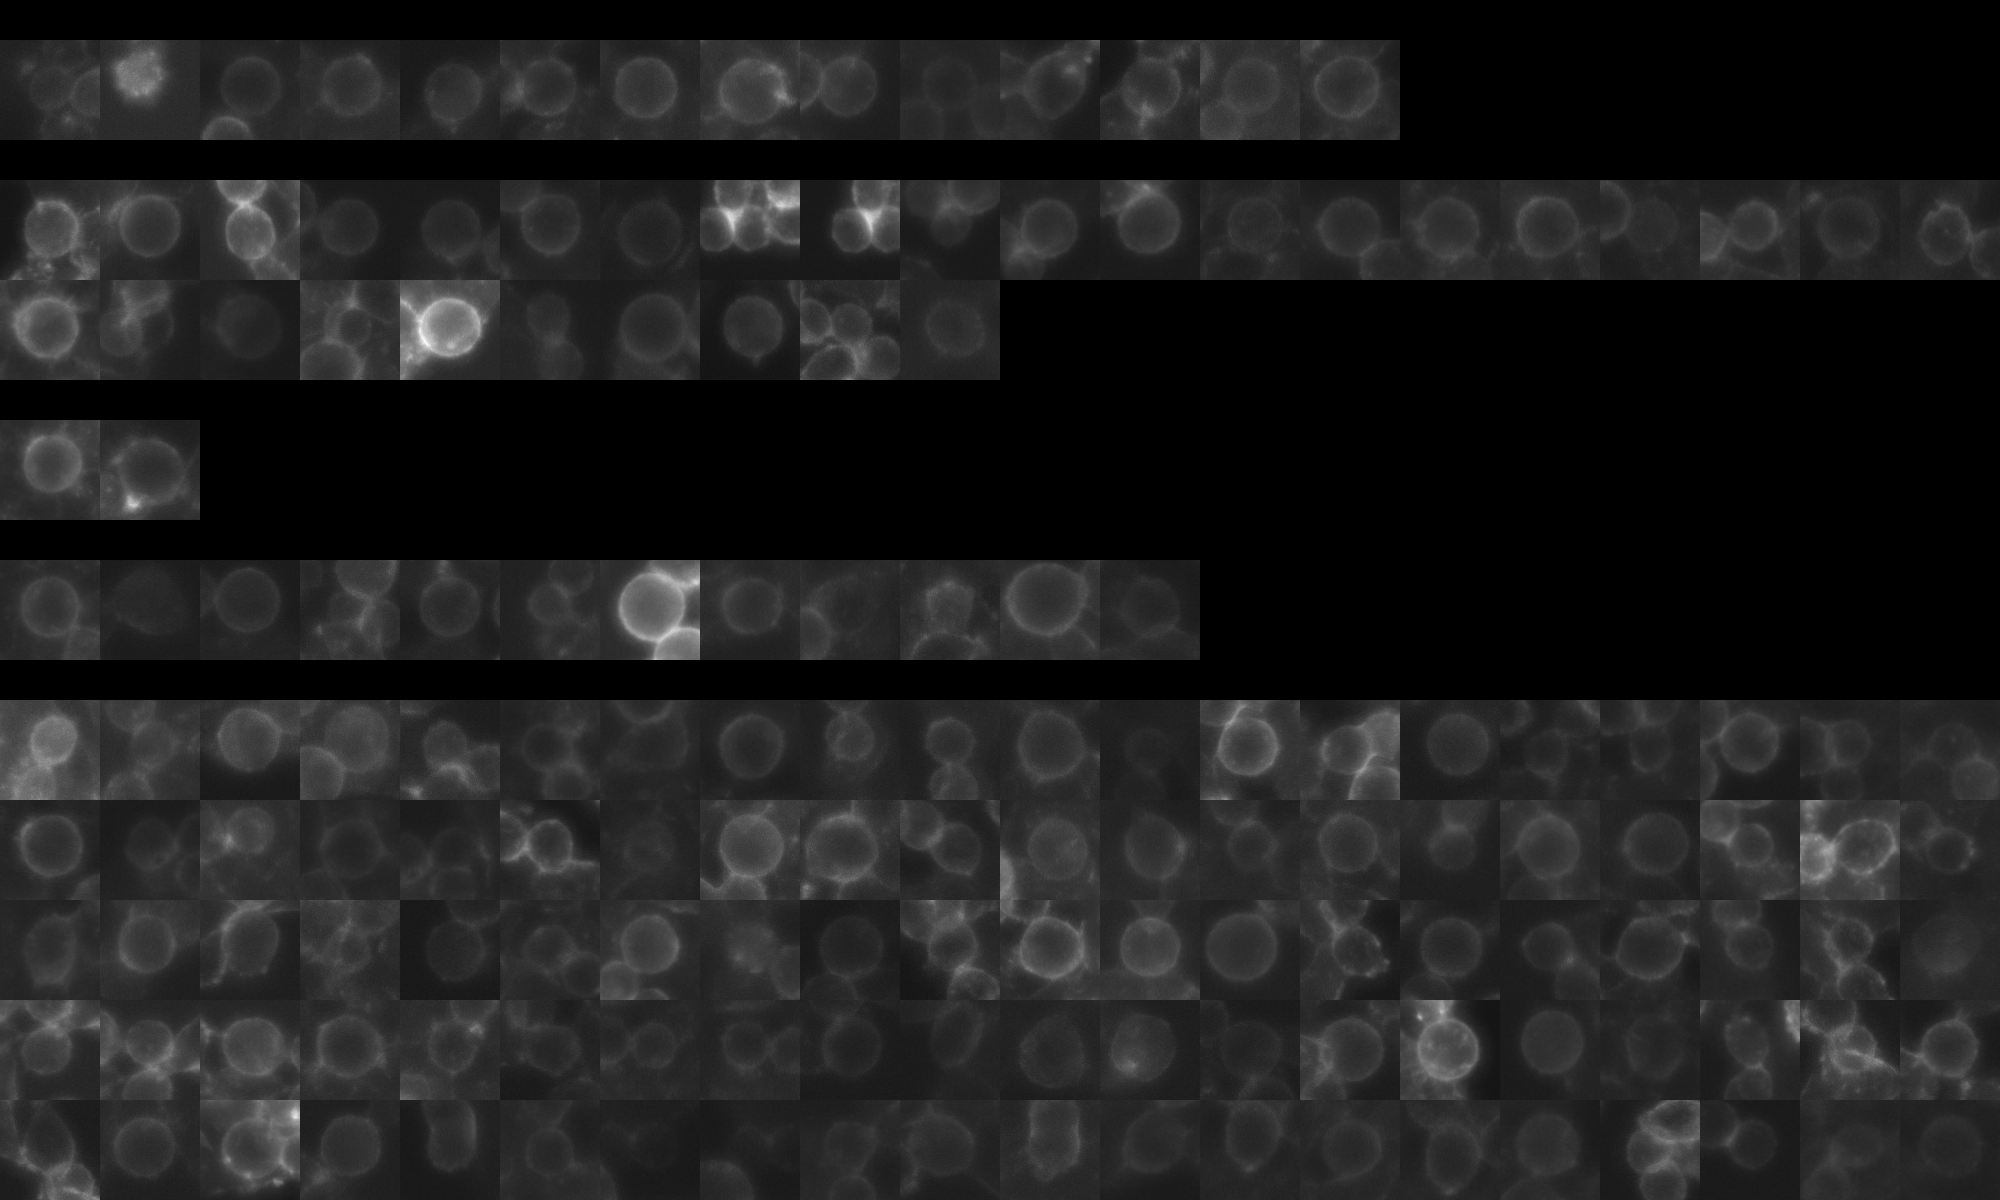
sgRNA 1: AAGGCCAATTCGTGTCGGTG (interphase cells: 668, mitotic cells: 14)
sgRNA 2: AATGCCCTCAAACGCGCCAA (interphase cells: 1366, mitotic cells: 30)
sgRNA 3: TCAATGGAGGACTCTCGTTG (interphase cells: 201, mitotic cells: 2)
sgRNA 4: TTTGATAAAGAGCGCTTACG (interphase cells: 346, mitotic cells: 12)

Interphase Cluster

Mitotic Cluster

Overview

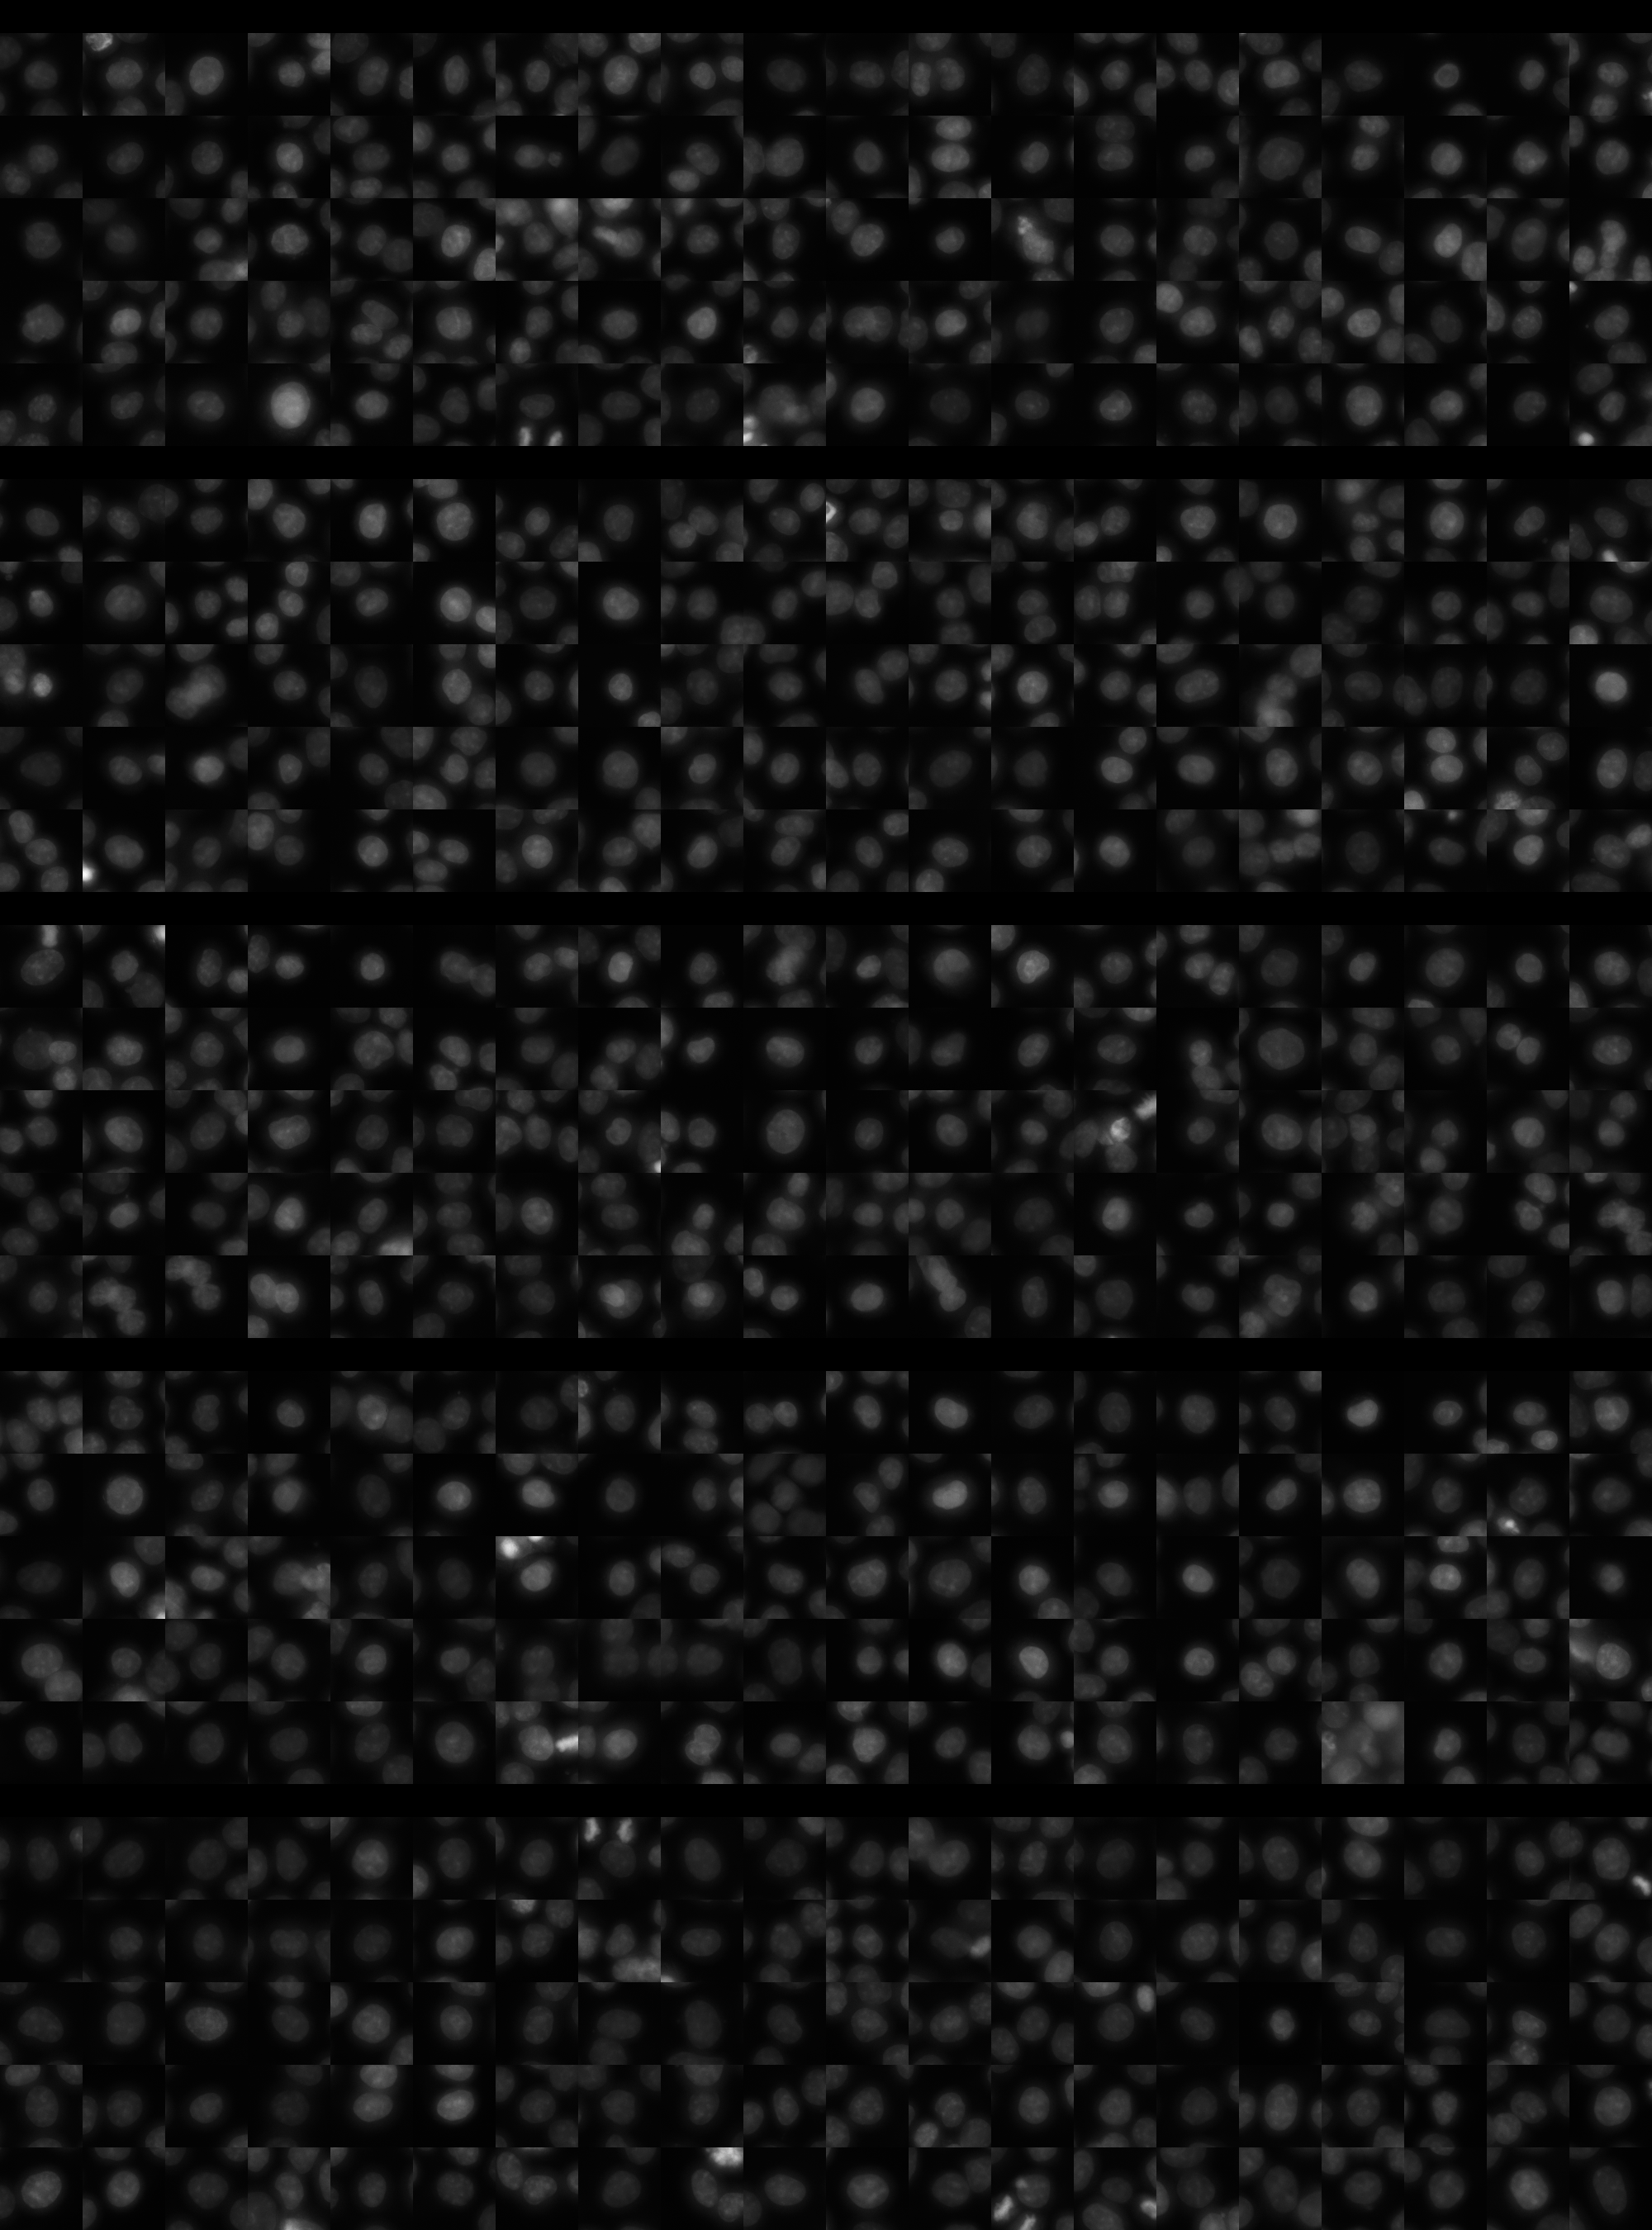
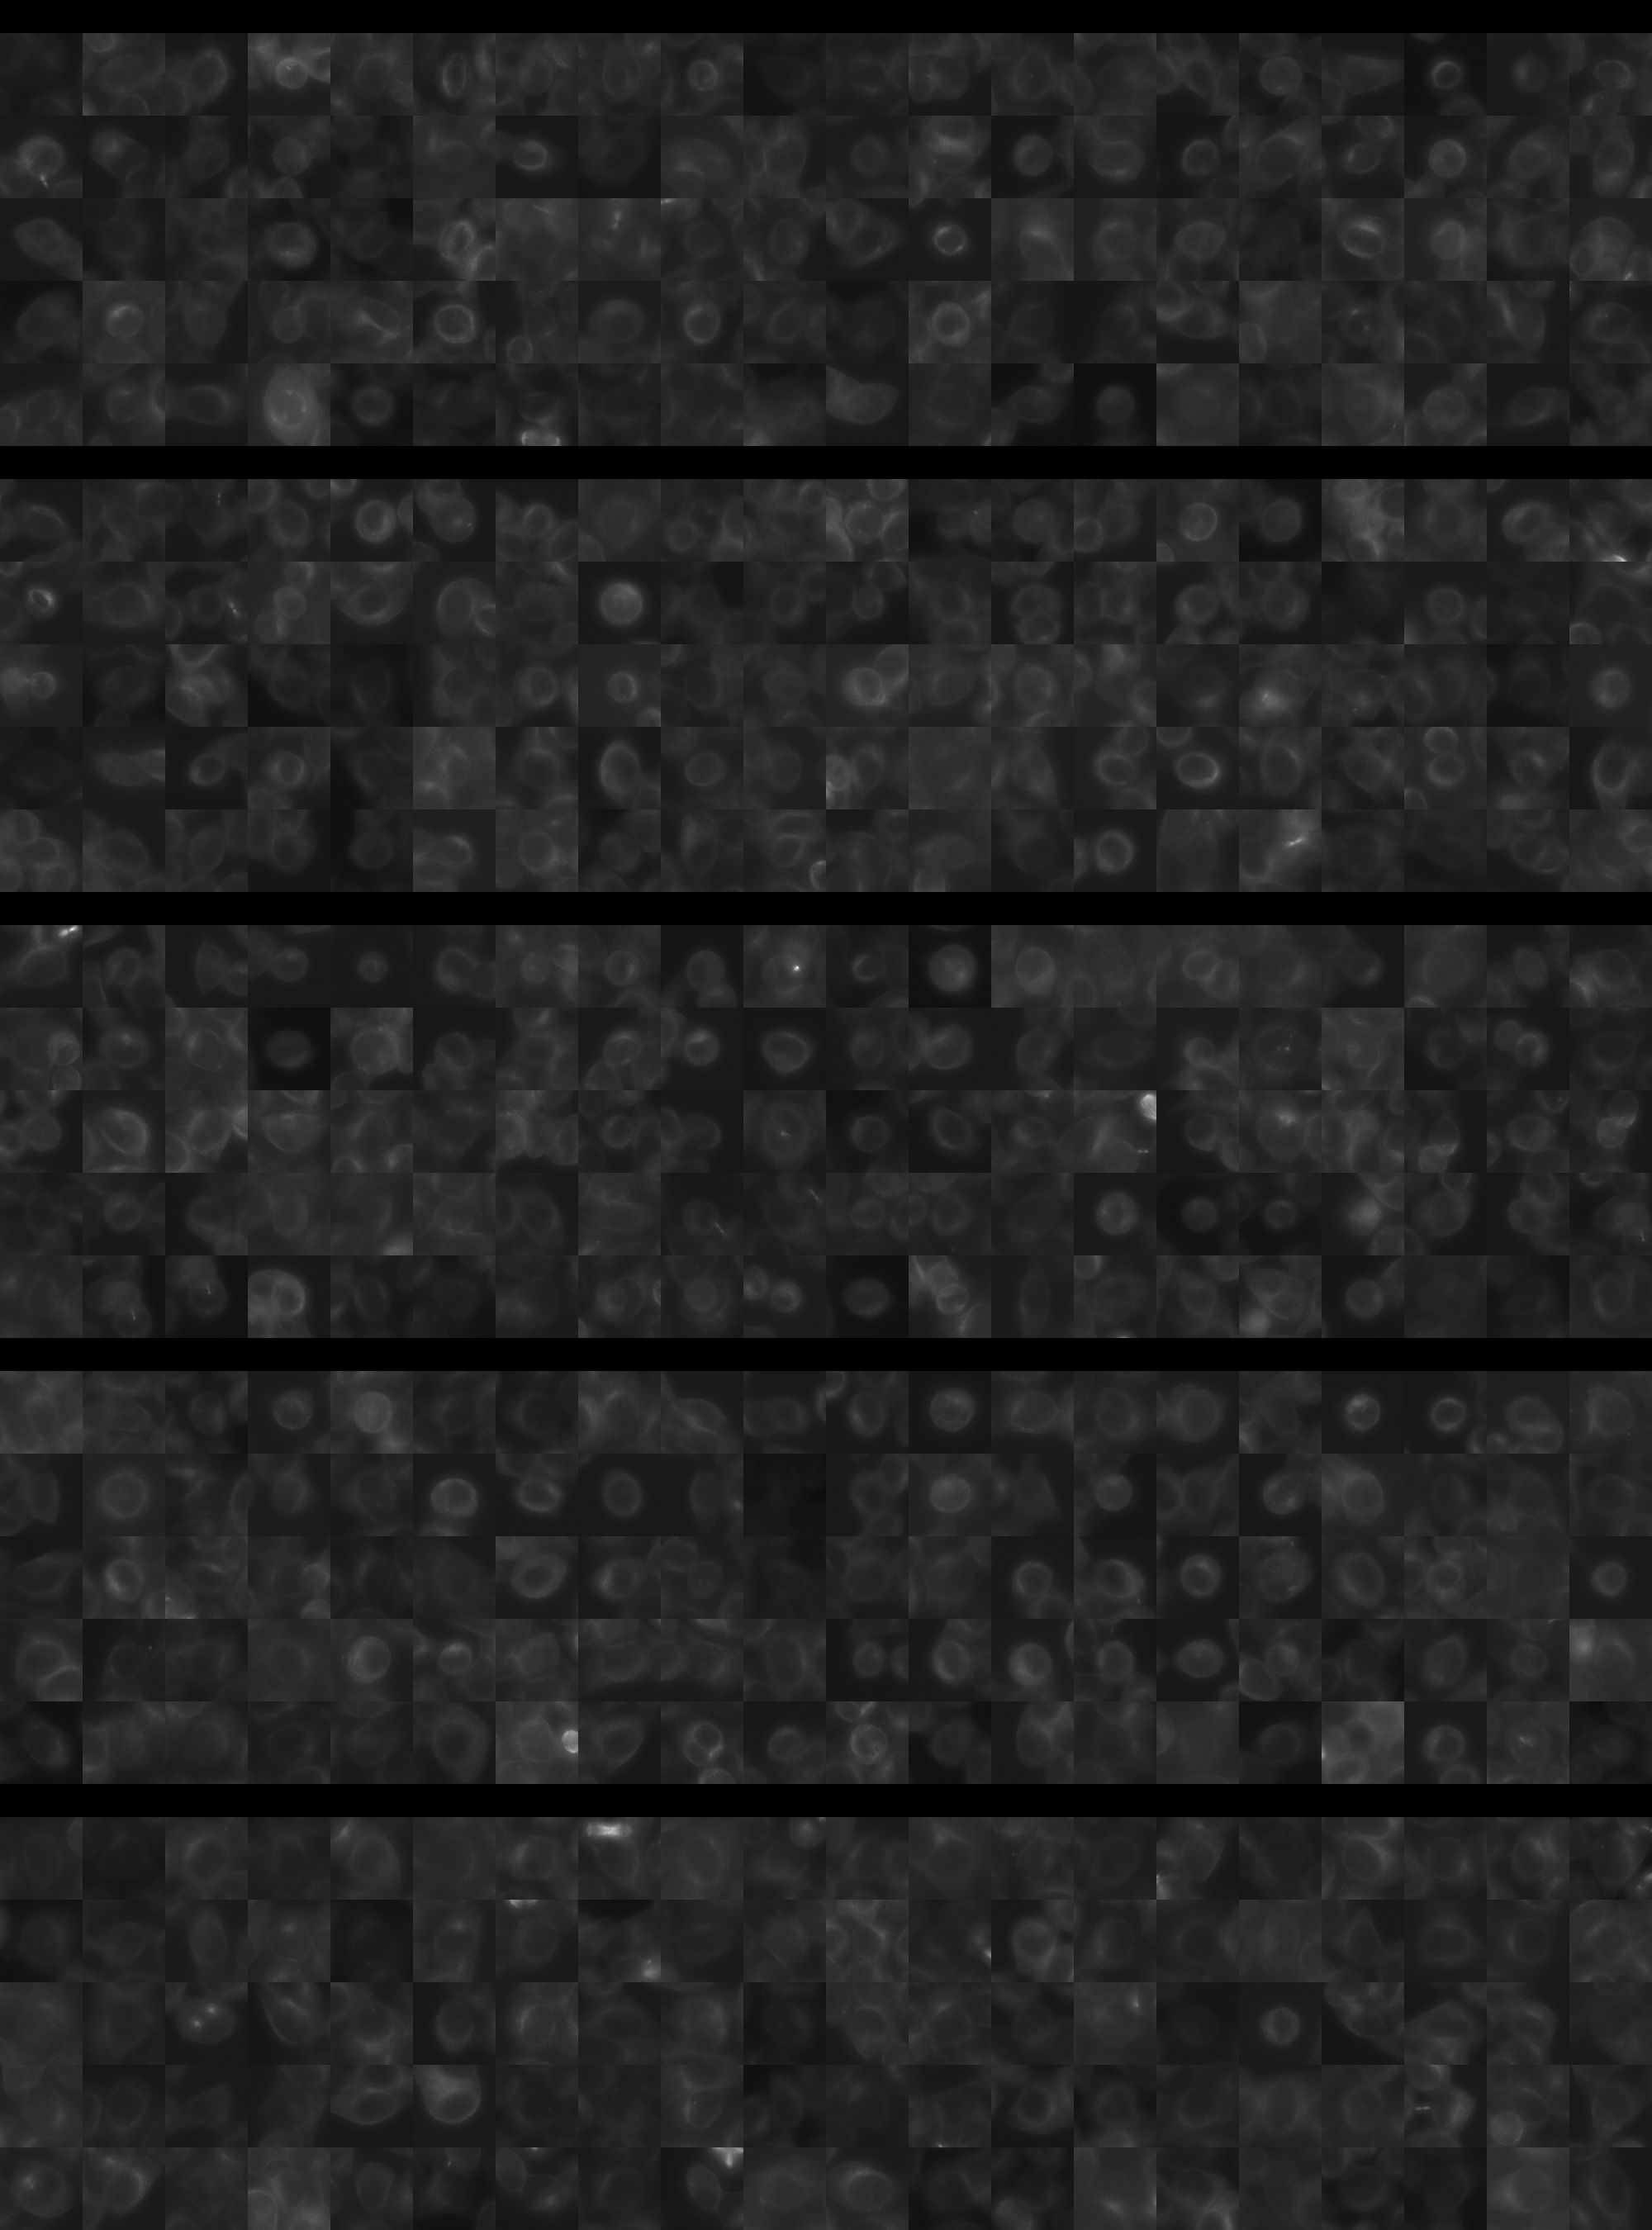
Each montage below shows randomly selected individual cell images for the same target gene separated by sgRNA, along with an example montage of cells expressing a non-targeting negative control sgRNA at the bottom. sgRNA labels in the montages correspond to the numbered sgRNA sequences in the gene info table above. The DNA (blue) and tubulin (green) channels are displayed by default, with gH2AX (grayscale) and actin (yellow) available using the check boxes. Channel brightness, contrast, and opacity are adjustable by clicking the arrow next to the channel name. When only one channel is selected, the display defaults to grayscale. Click the “Zoom” checkbox above the channel controls to enable image zooming (via scrolling) and panning (via click-and-drag).

The cell boxes displayed for this gene are square, 30.36 μm per side for the interphase montage and 30.36 μm per side for the mitotic montage.
Features

Interphase Score Rank FDR q-value
Nucleus DNA Integrated 0.433 54 of 5322 5.407e-04
Nucleus DNA Mean 1.348 6 of 5322 1.505e-04
Nucleus gH2AX Mean 0.520 91 of 5322 1.367e-04
Nucleus DNA - gH2AX Correlation 0.434 7 of 5322 1.021e-04
Nucleus Shape Area -7.253e-01 5303 of 5322 1.633e-04
Nucleus Shape Eccentricity -2.472e-01 5293 of 5322 4.529e-04
Nucleus Shape Form Factor 0.042 119 of 5322 0.330
Nucleus Shape Solidity -1.080e-01 4434 of 5322 0.021
Cell DNA Mass Displacement 0.044 1446 of 5322 0.629
Cell Tubulin Mean 0.428 49 of 5322 2.141e-04
Cell Tubulin Mass Displacement 0.015 2106 of 5322 0.891
Cell Actin Mean 0.303 141 of 5322 1.723e-04
Cell Tubulin - Actin Correlation 0.135 348 of 5322 0.008
Cell DNA - Tubulin Correlation 0.592 22 of 5322 1.948e-04
Cell Shape Area -6.991e-01 5296 of 5322 1.651e-04
Cell Shape Eccentricity -4.200e-02 5132 of 5322 0.727
Mitotic Score Rank FDR q-value
Nucleus DNA Integrated -3.829e-03 3988 of 5322 0.996
Nucleus DNA Mean 0.003 2910 of 5322 1.000
Nucleus DNA Mass Displacement -1.750e-01 5122 of 5322 0.999
Nucleus DNA Mean Frac 3 0.390 87 of 5322 1.000
Nucleus gH2AX Mean 0.004 2906 of 5322 1.000
Nucleus gH2AX Mean Frac 0 -1.926e-01 4752 of 5322 1.000
Nucleus Tubulin Mean Frac 0 0.136 1492 of 5322 0.999
Nucleus Tubulin Mean Edge -5.549e-02 3866 of 5322 0.999
Nucleus Tubulin Std Edge 0.037 2044 of 5322 0.999
Nucleus Shape Area 0.287 852 of 5322 0.902
Nucleus Shape Eccentricity -2.385e-01 4736 of 5322 1.000
Nucleus Shape Form Factor -1.199e-01 3131 of 5322 0.998
Cell Tubulin Mean 0.131 1665 of 5322 0.997
Cell Tubulin Mean Frac 3 -2.917e-01 4678 of 5322 0.999
Cell Actin Mean -2.257e-02 3522 of 5322 0.997
Cell Shape Area -5.961e-02 4512 of 5322 0.998
( Reset Zoom )
Brightness
Contrast
Opacity
Brightness
Contrast
Opacity
Brightness
Contrast
Opacity
Brightness
Contrast
Opacity
Brightness
Contrast
Opacity

( Reset Zoom )
Brightness
Contrast
Opacity
Brightness
Contrast
Opacity
Brightness
Contrast
Opacity
Brightness
Contrast
Opacity
Brightness
Contrast
Opacity

MIT Central Accessability