ECT2

Gene symbol: ECT2
Gene: 1894
Uniprot Function: Guanine nucleotide exchange factor (GEF) that catalyzes the exchange of GDP for GTP. Promotes guanine nucleotide exchange on the Rho family members of small GTPases, like RHOA, RHOC, RAC1 and CDC42. Required for signal transduction pathways involved in the regulation of cytokinesis. Component of the centralspindlin complex that serves as a microtubule-dependent and Rho-mediated signaling required for the myosin contractile ring formation during the cell cycle cytokinesis. Regulates the translocation of RHOA from the central spindle to the equatorial region. Plays a role in the control of mitotic spindle assembly; regulates the activation of CDC42 in metaphase for the process of spindle fibers attachment to kinetochores before chromosome congression. Involved in the regulation of epithelial cell polarity; participates in the formation of epithelial tight junctions in a polarity complex PARD3-PARD6-protein kinase PRKCQ-dependent manner. Plays a role in the regulation of neurite outgrowth. Inhibits phenobarbital (PB)-induced NR1I3 nuclear translocation. Stimulates the activity of RAC1 through its association with the oncogenic PARD6A-PRKCI complex in cancer cells, thereby acting to coordinately drive tumor cell proliferation and invasion. Also stimulates genotoxic stress-induced RHOB activity in breast cancer cells leading to their cell death.
Mitotic Index 0.0285
Interphase Cluster: #148 (19 genes)
Mitotic Cluster: #46 (30 genes)
sgRNA 1: GAGTCTAGCATTAACTATGG (interphase cells: 1709, mitotic cells: 63)
sgRNA 2: GTGACATTGGTCCATCACAT (interphase cells: 202, mitotic cells: 3)
sgRNA 3: TATTAACATCCACTACTGGG (interphase cells: 1965, mitotic cells: 48)
sgRNA 4: TTCTTATCCGACCAGTACAG (interphase cells: 288, mitotic cells: 8)

Interphase Cluster

Mitotic Cluster

Overview

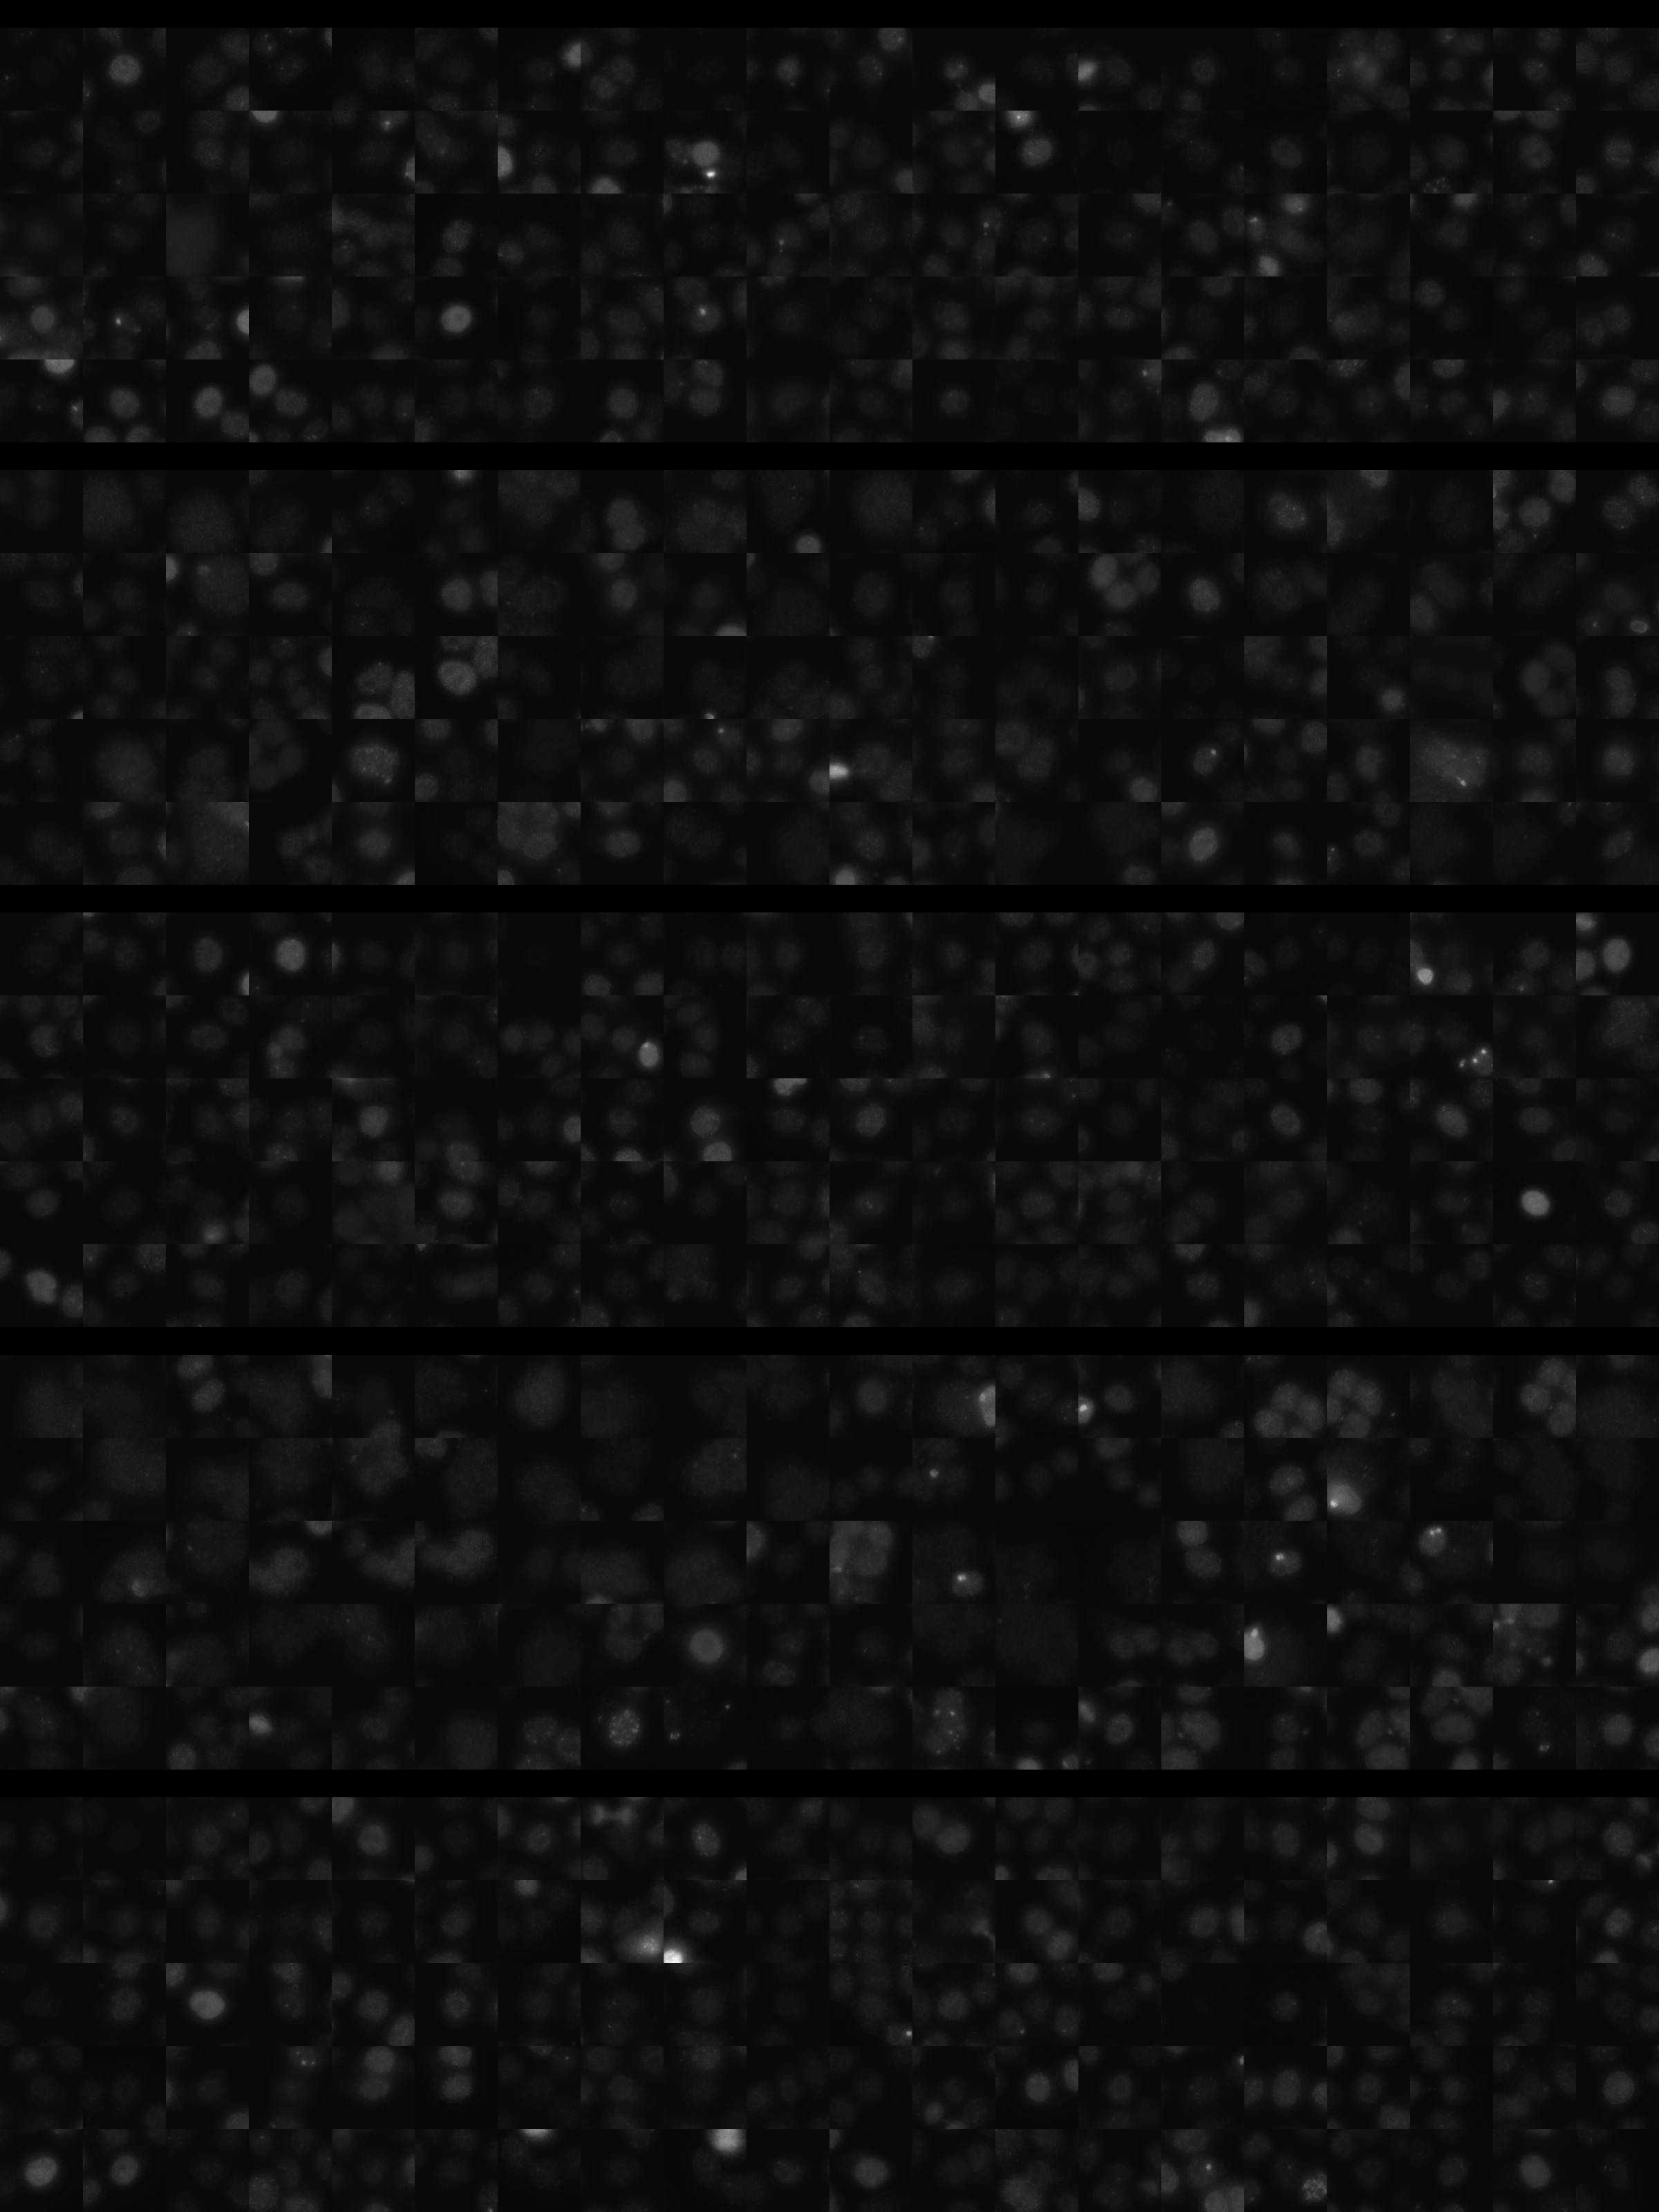
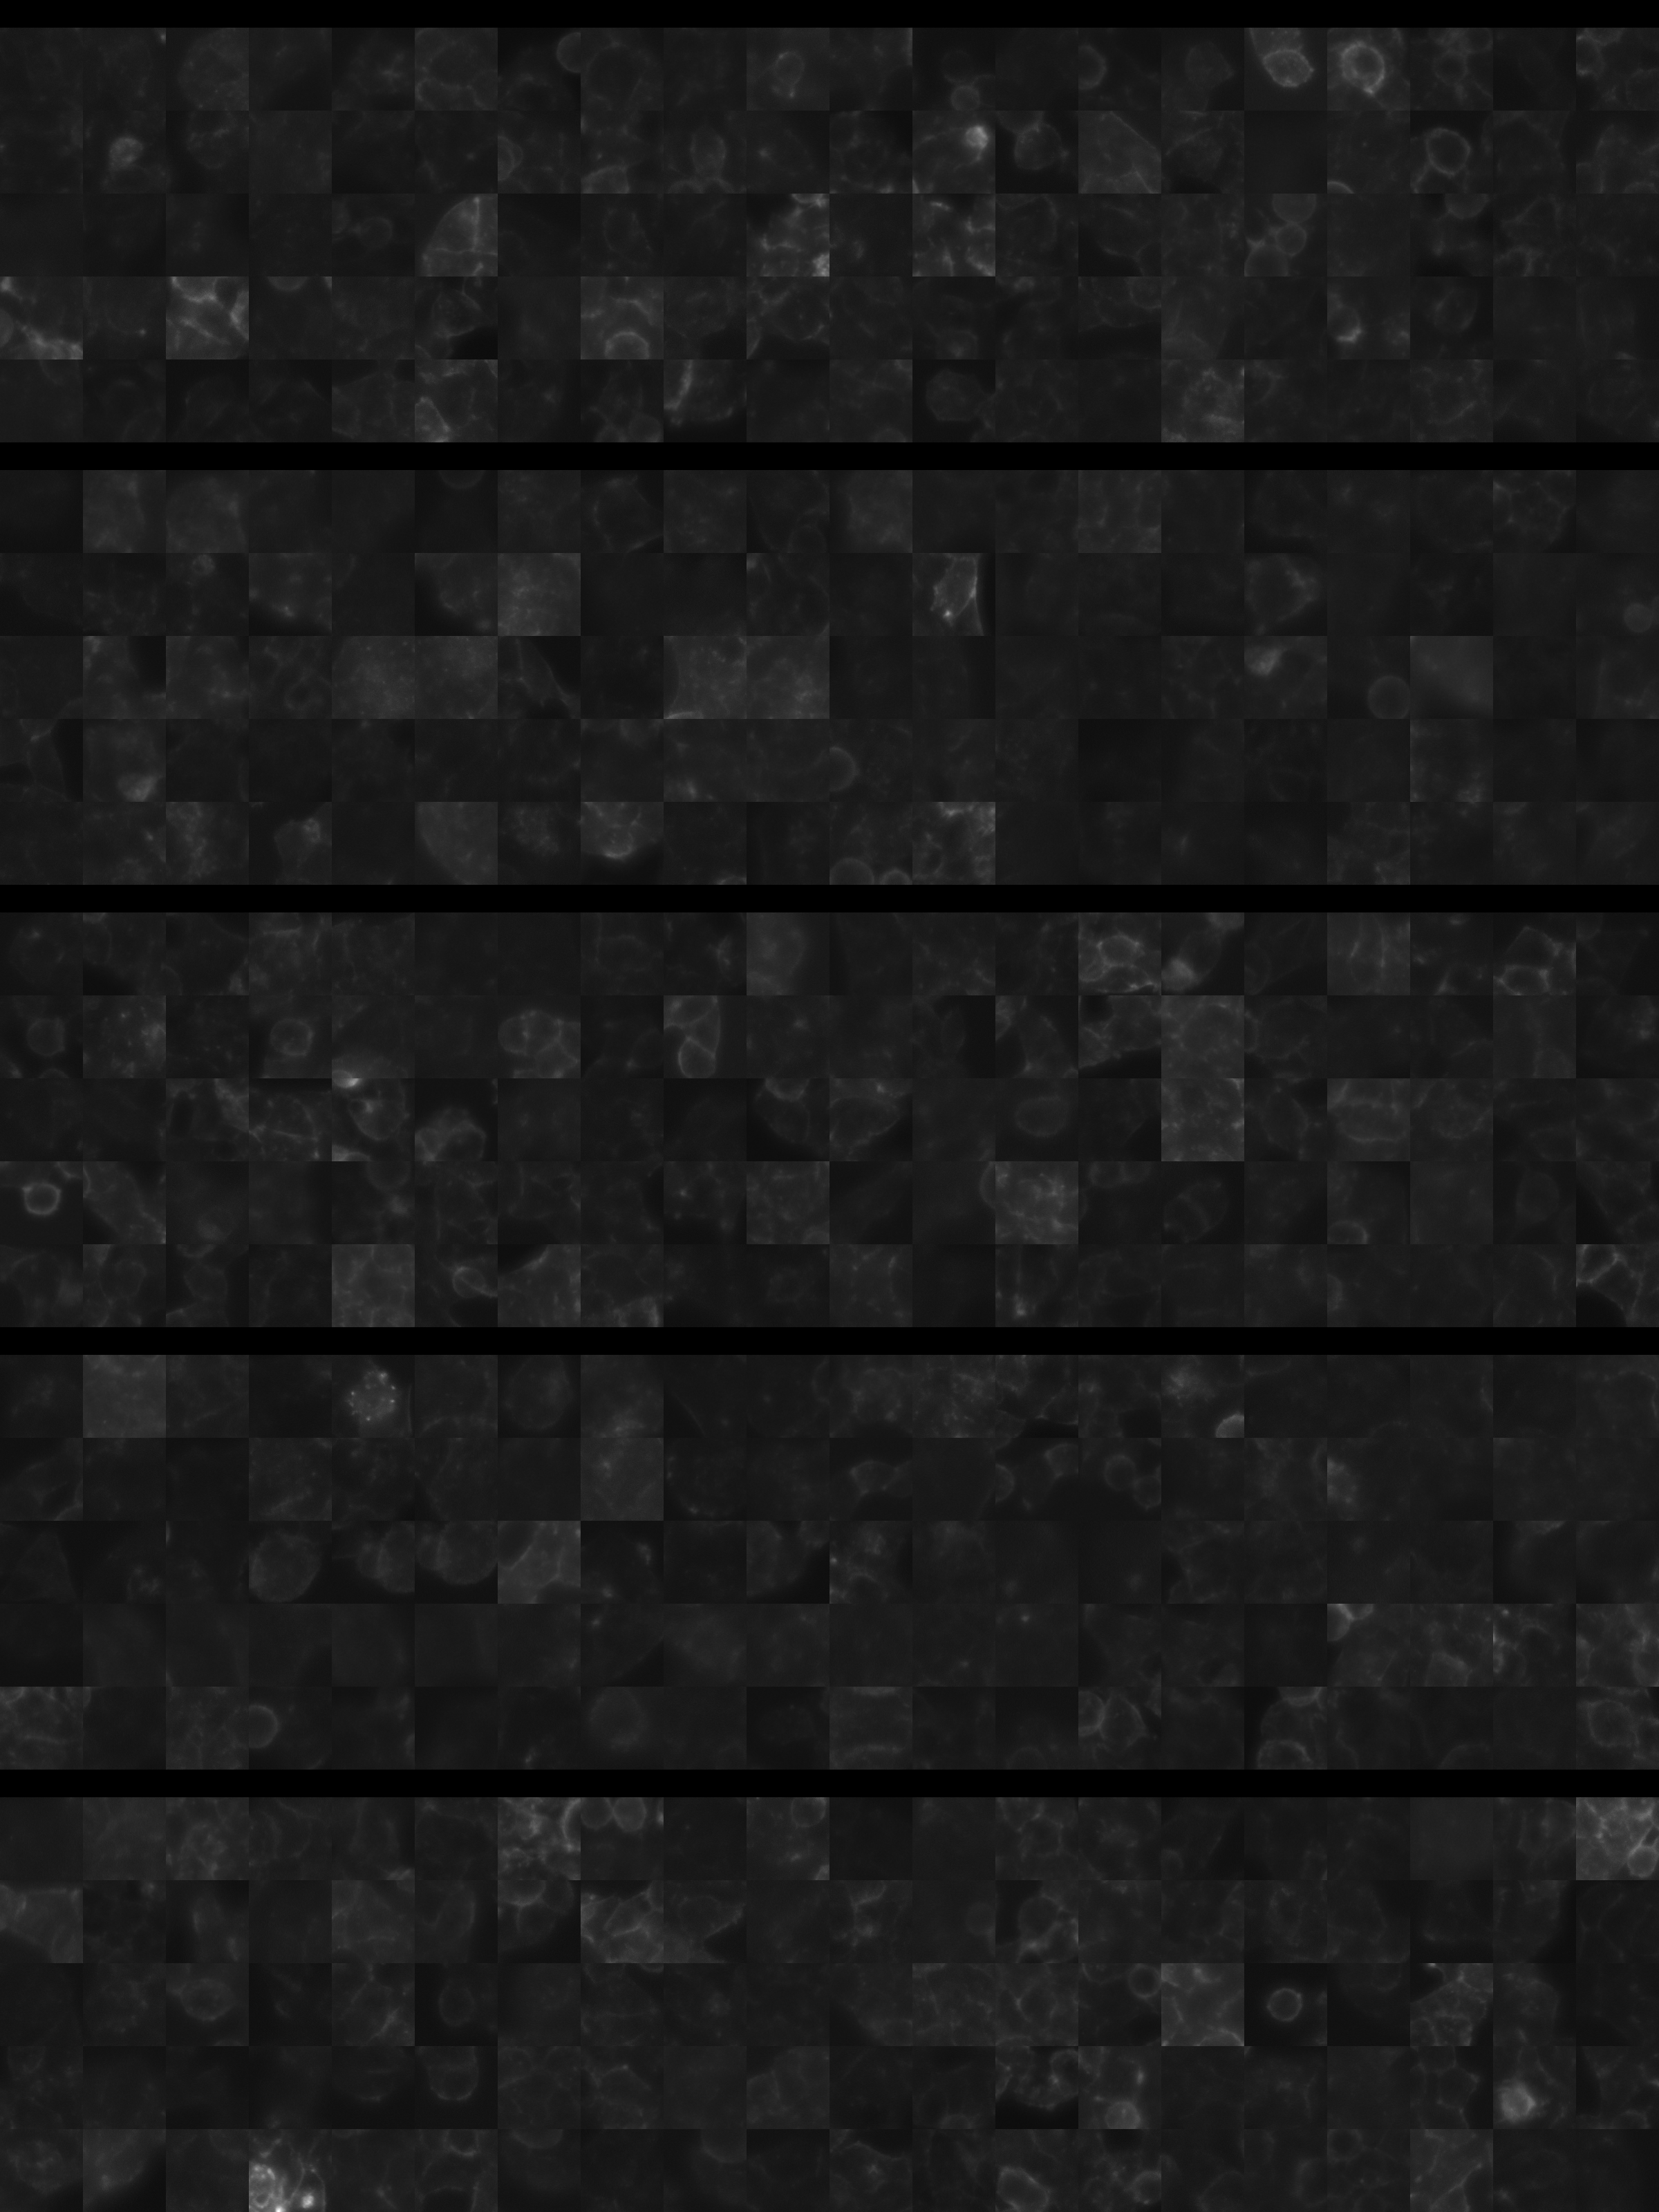
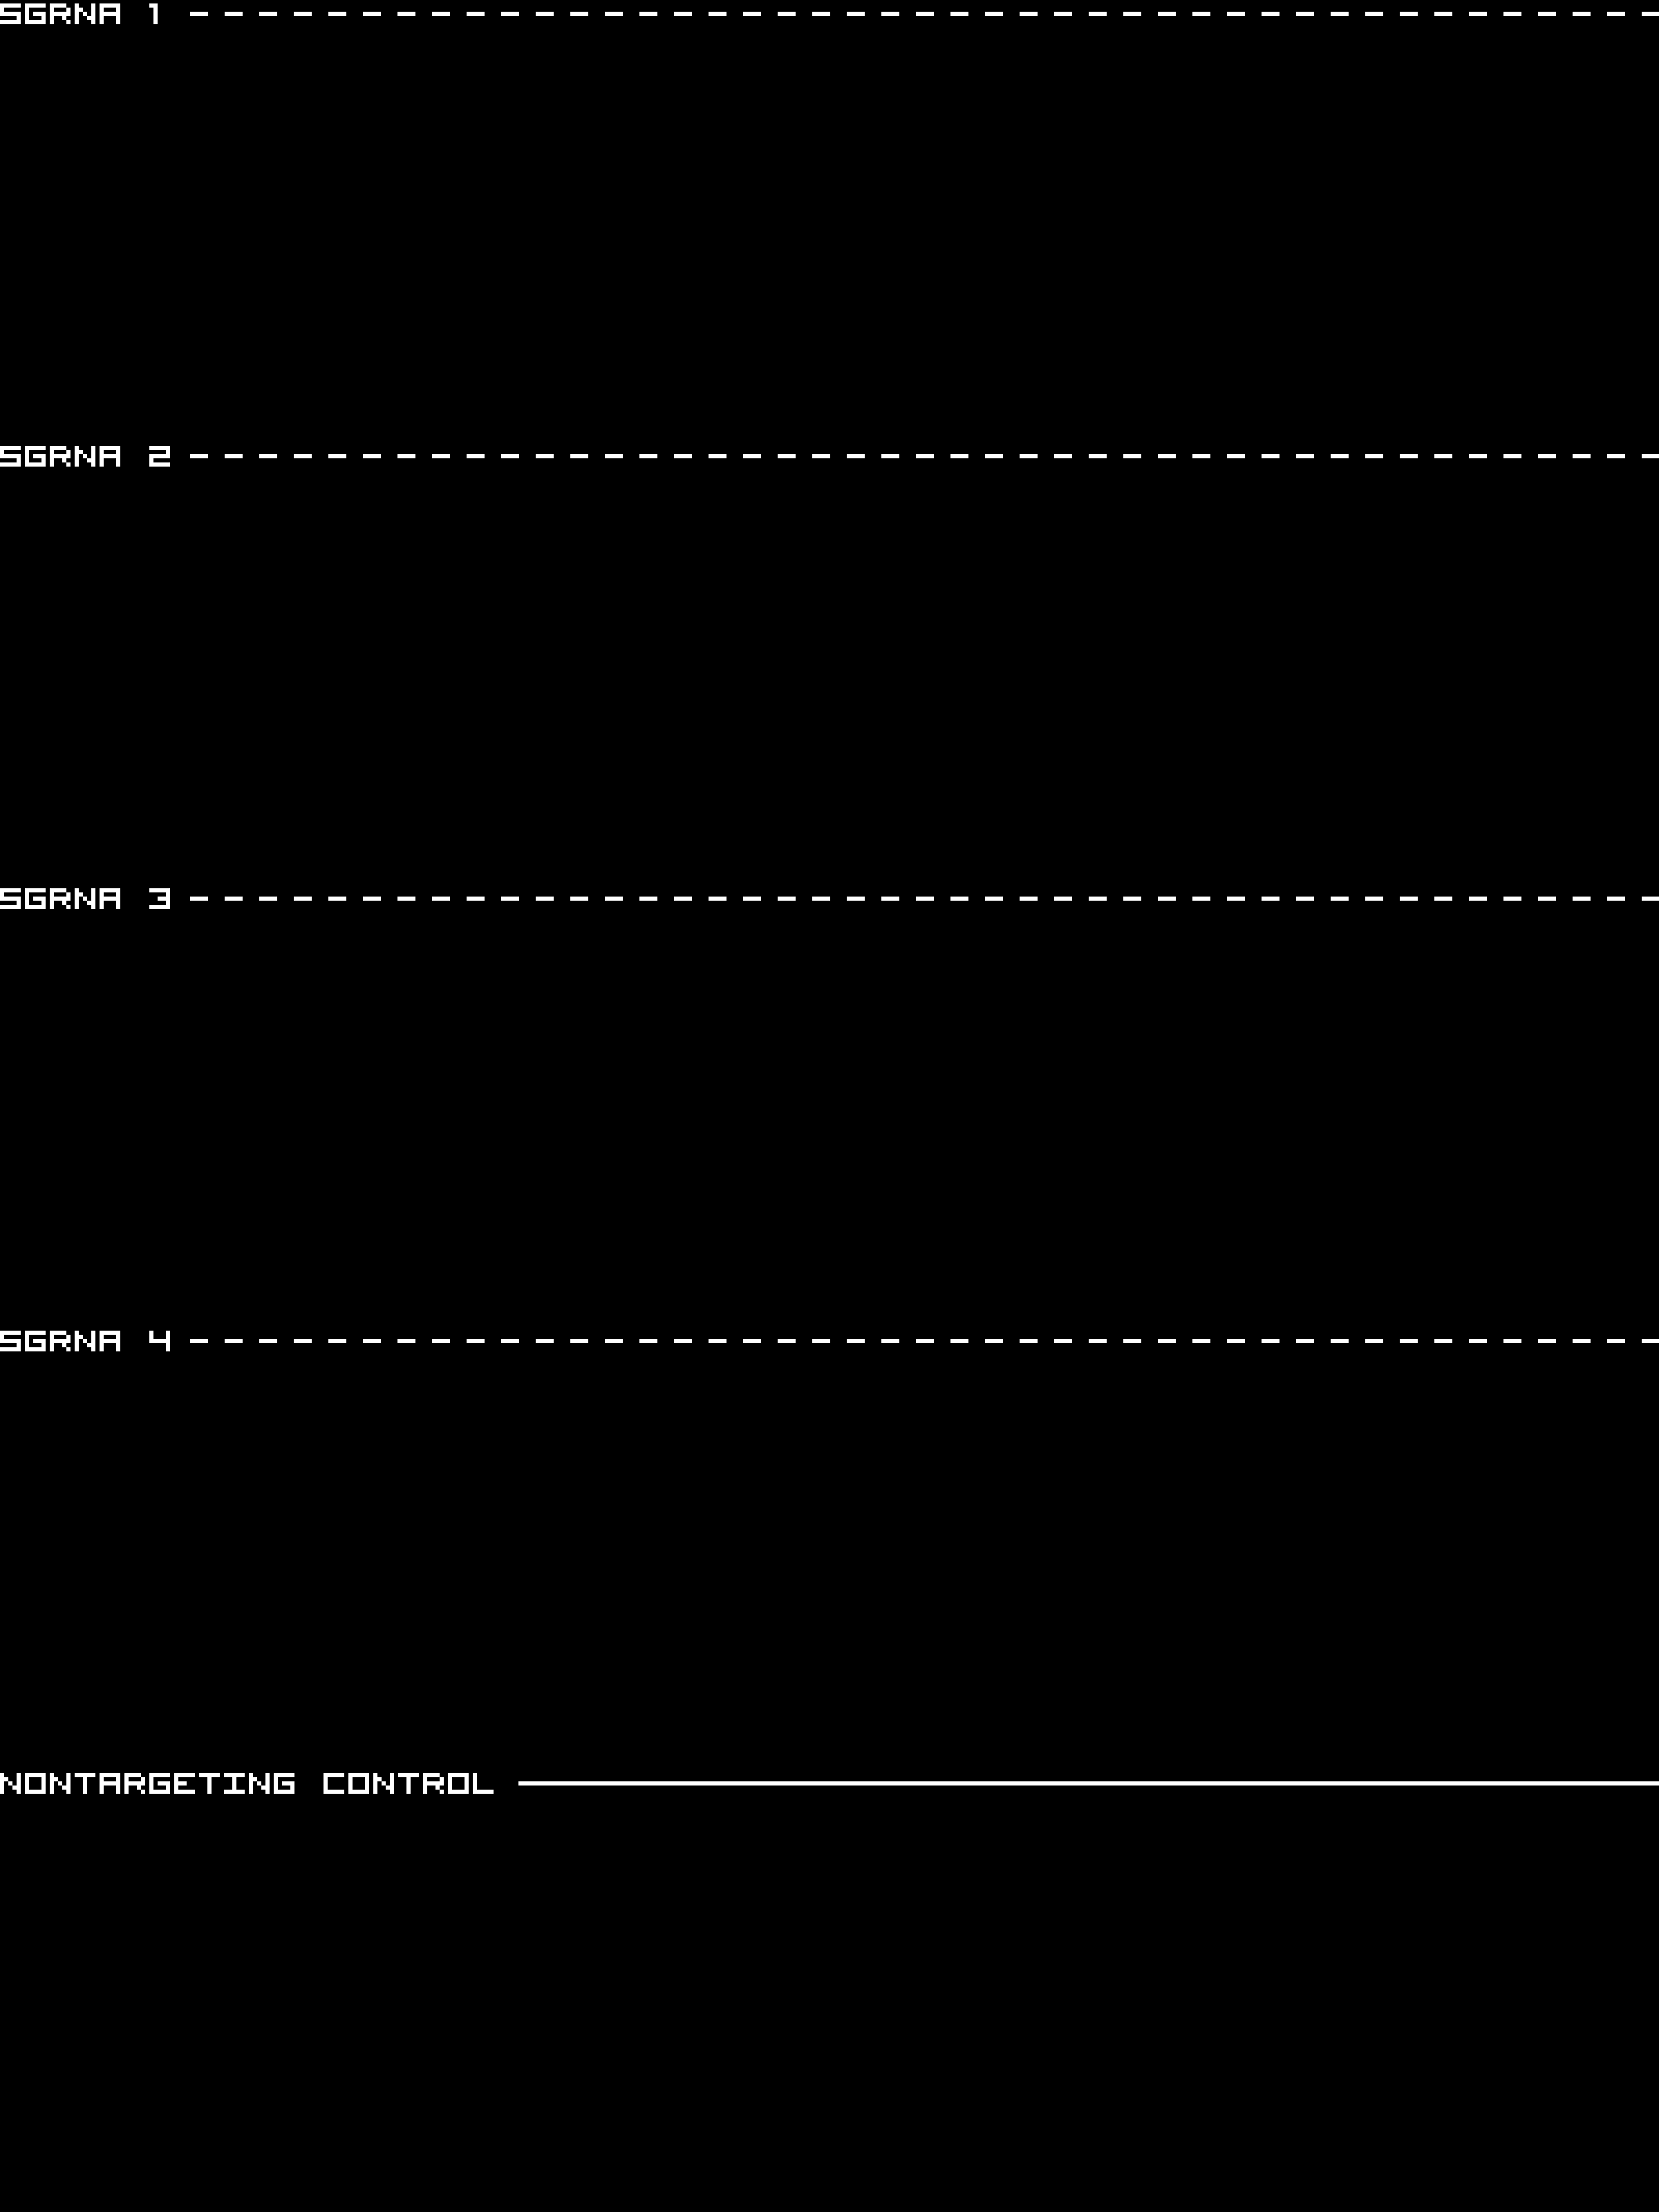
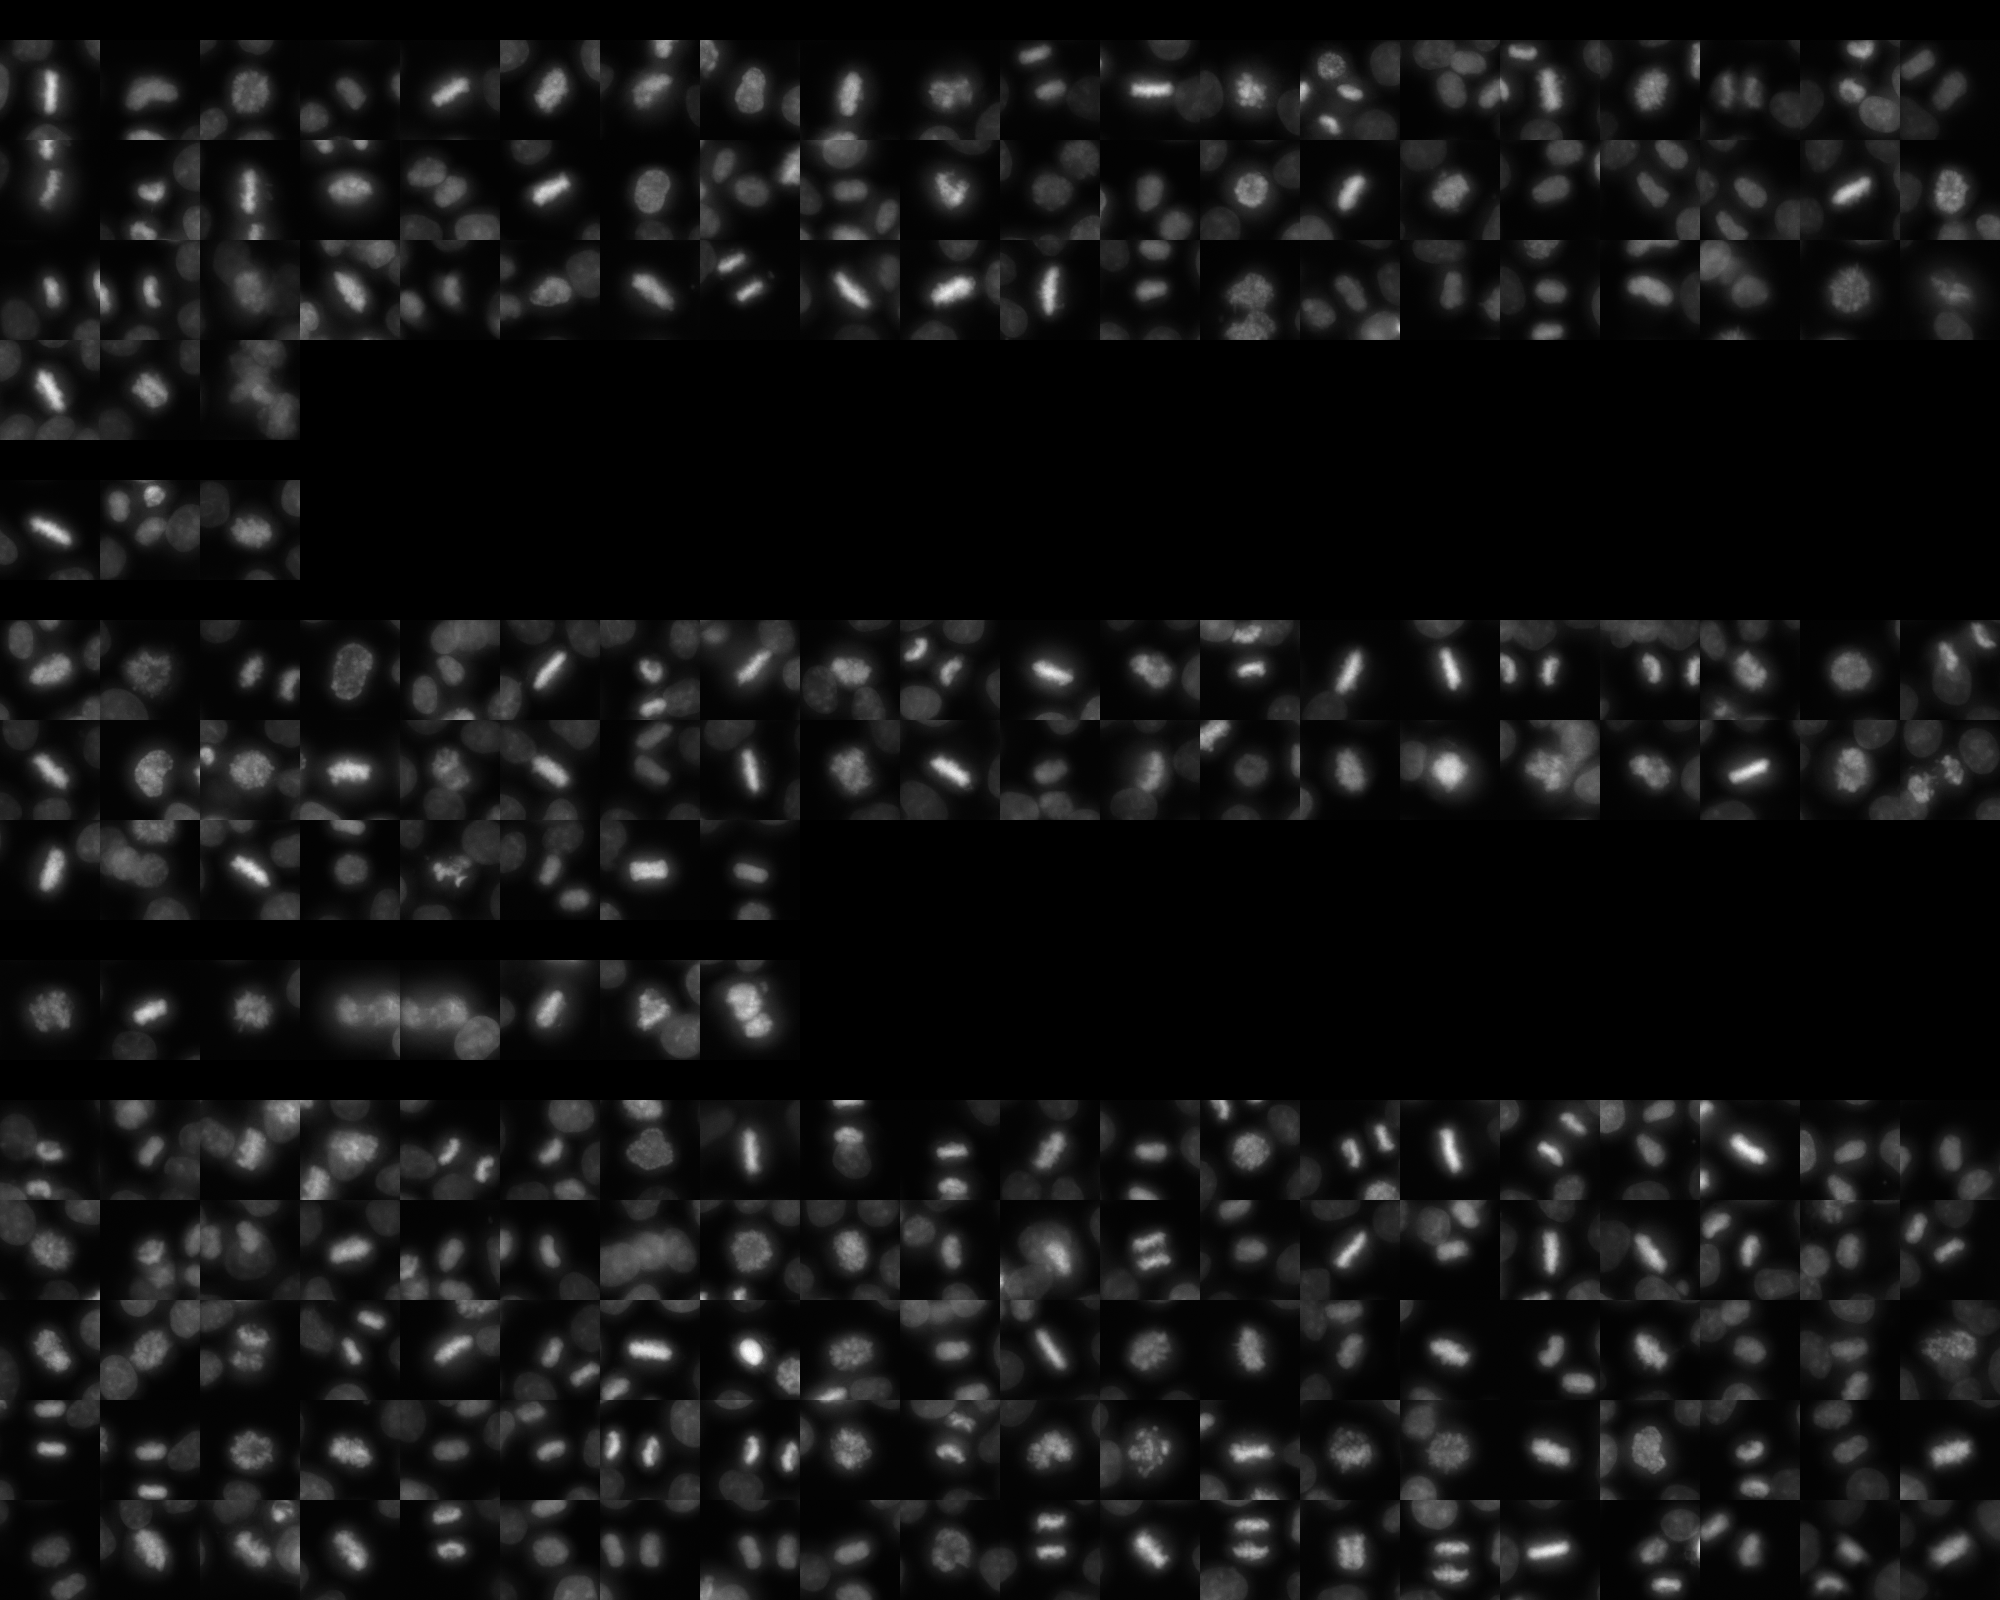
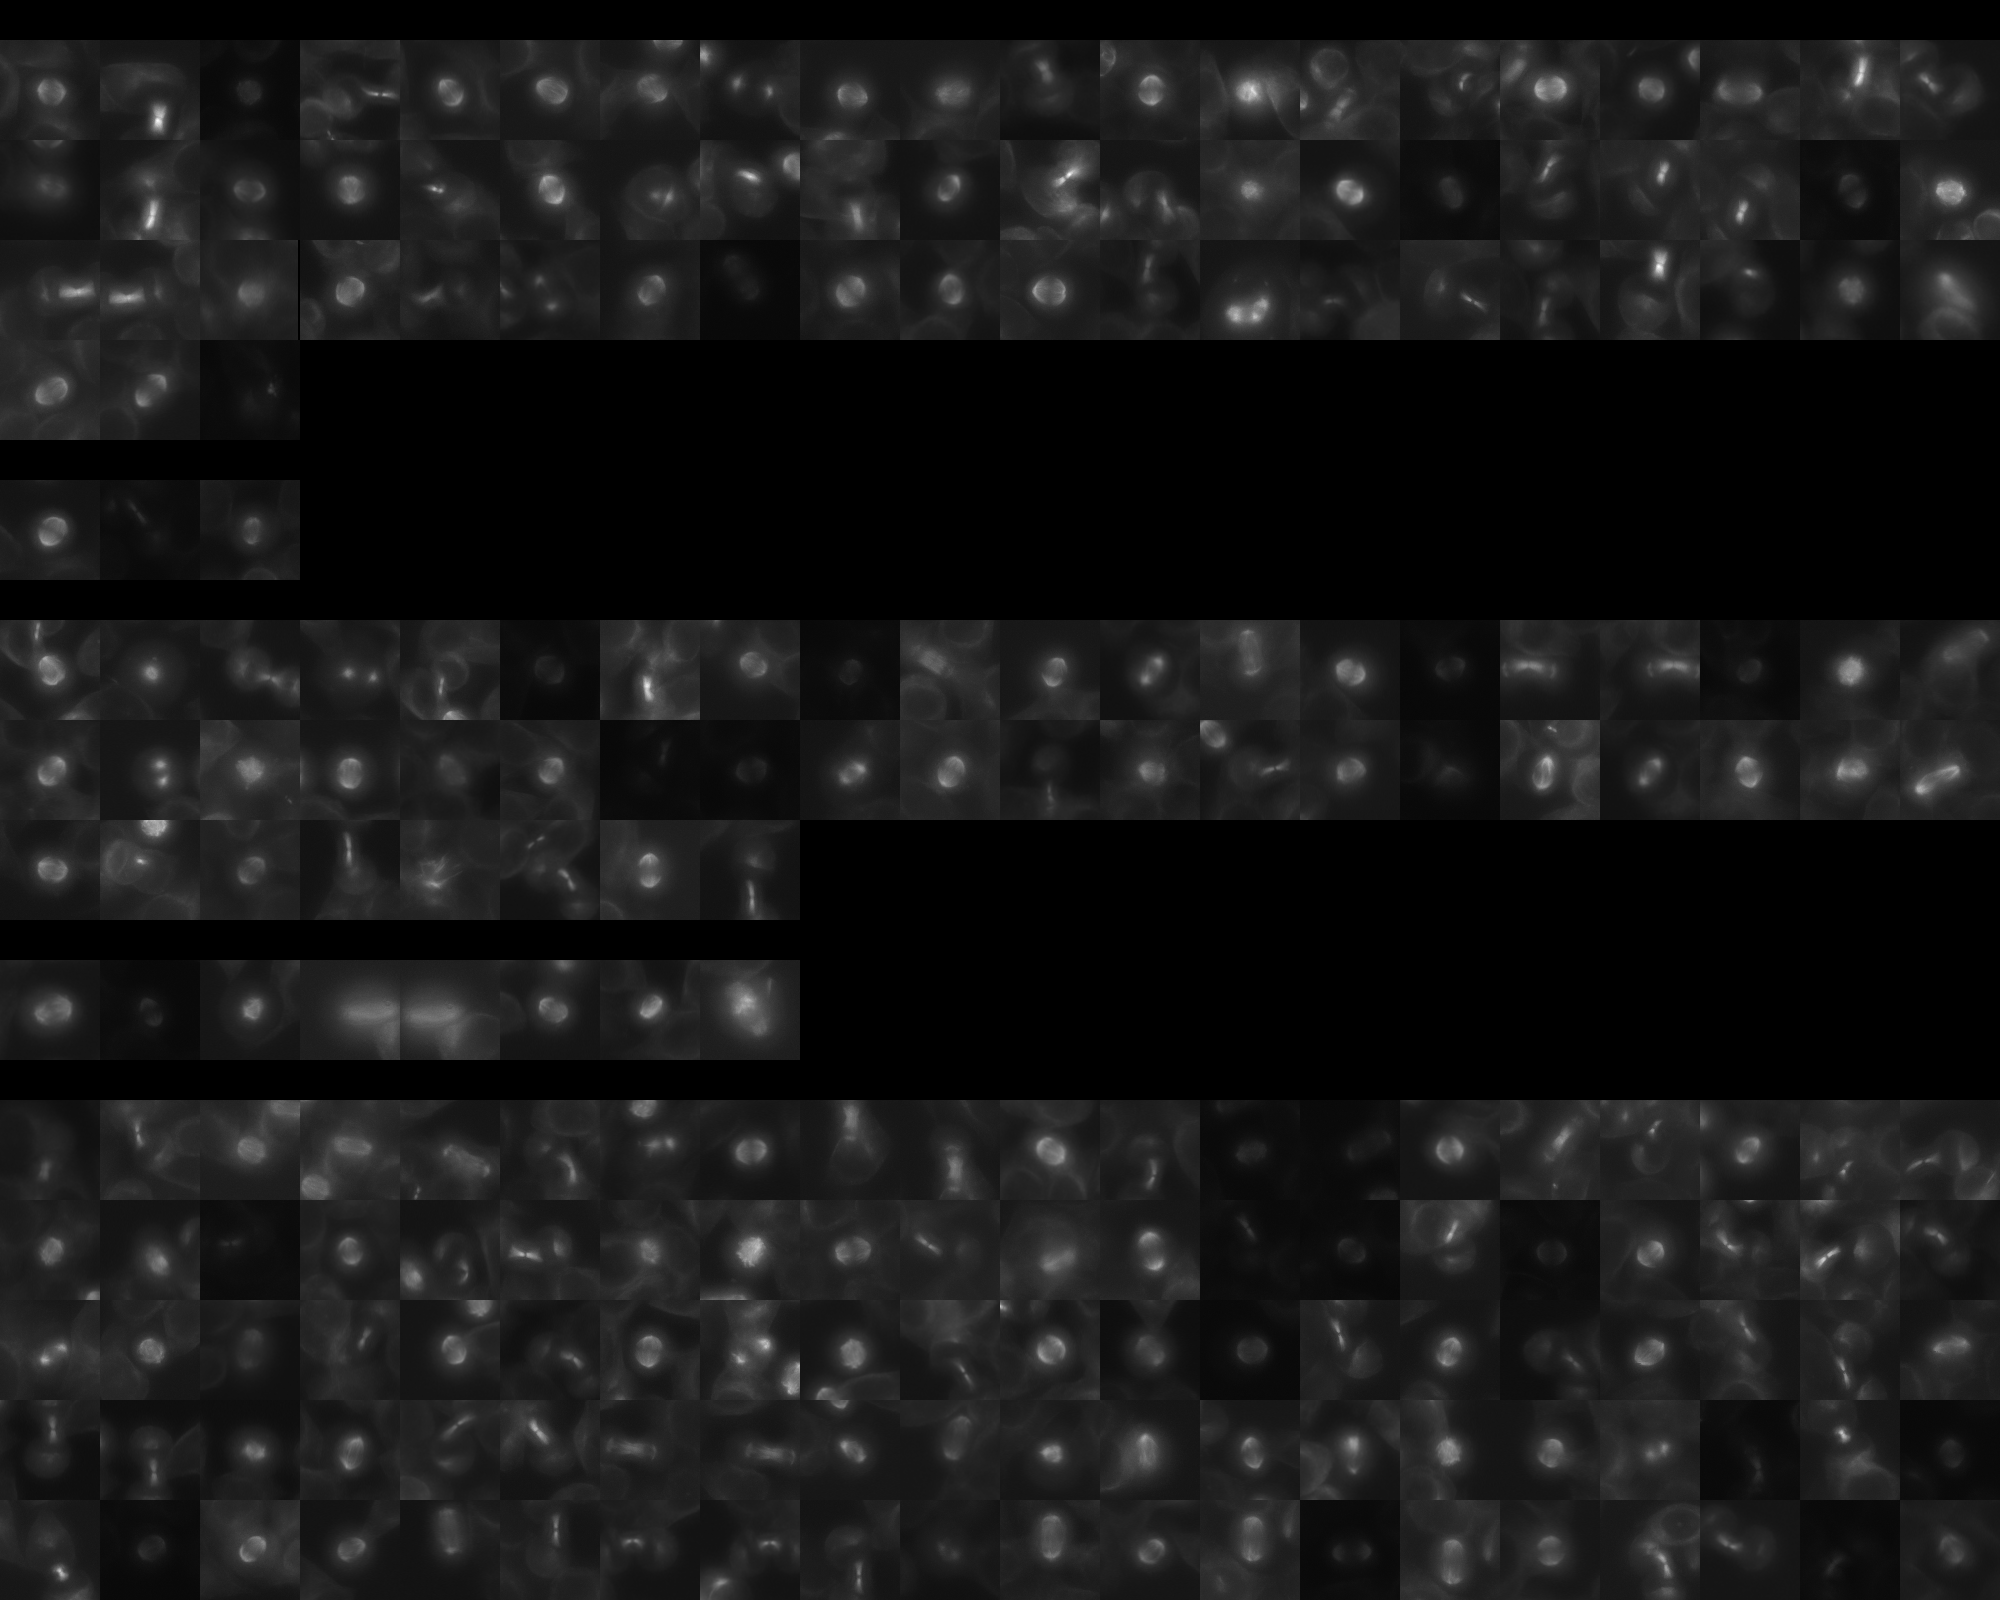
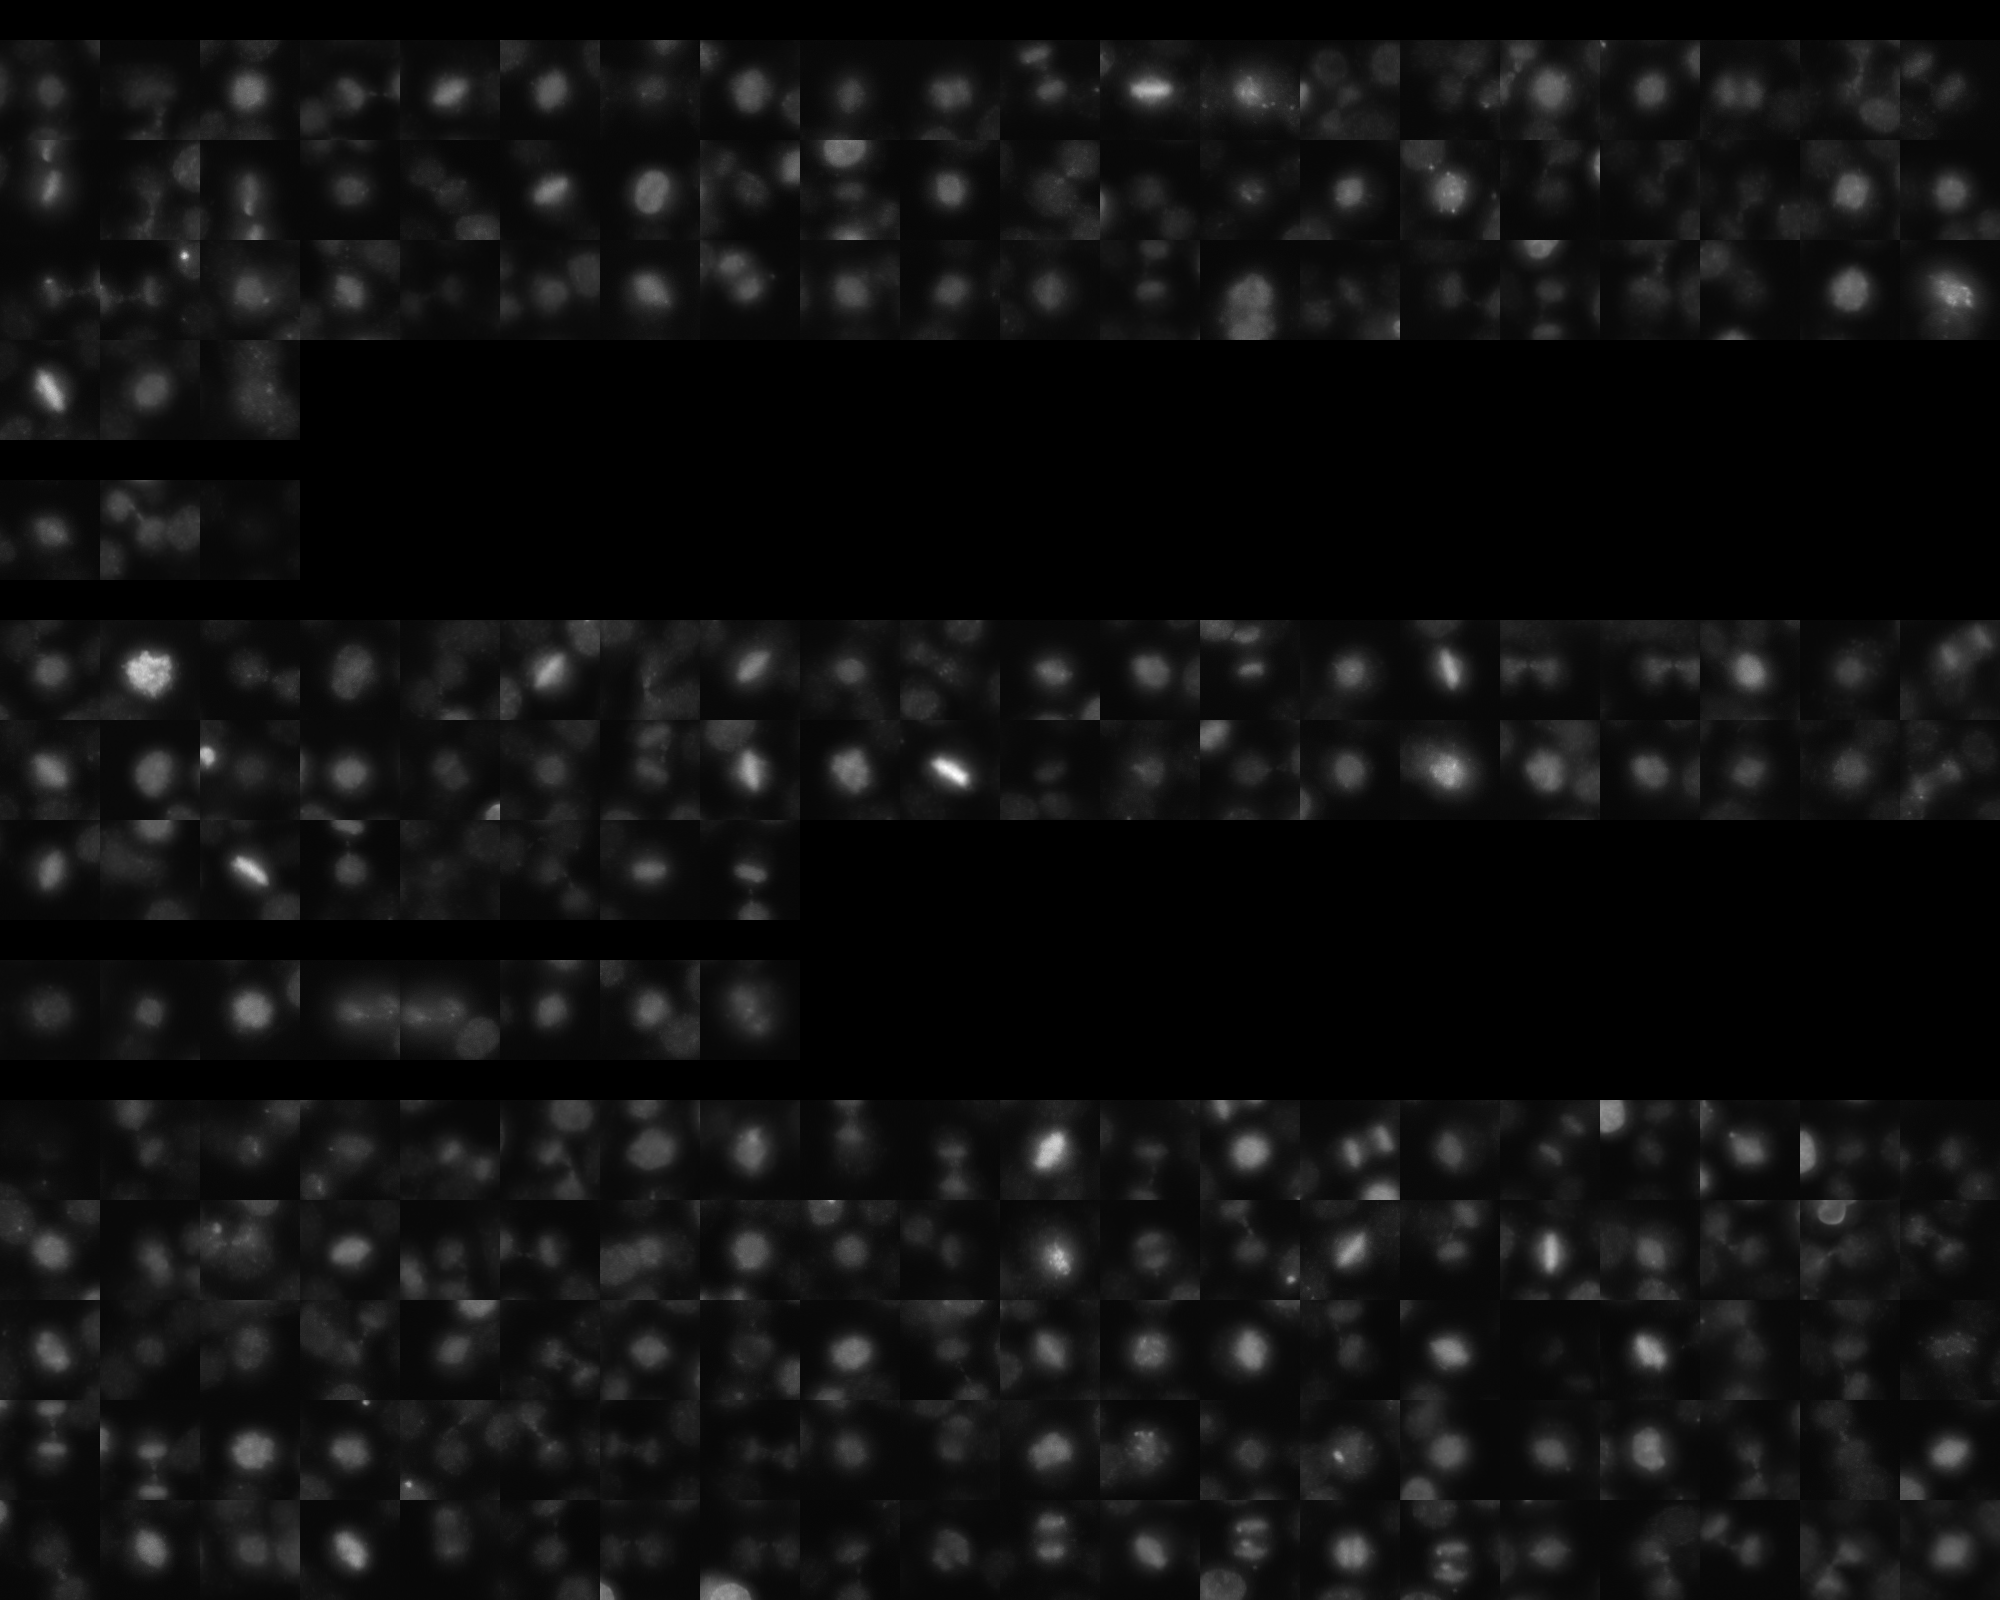
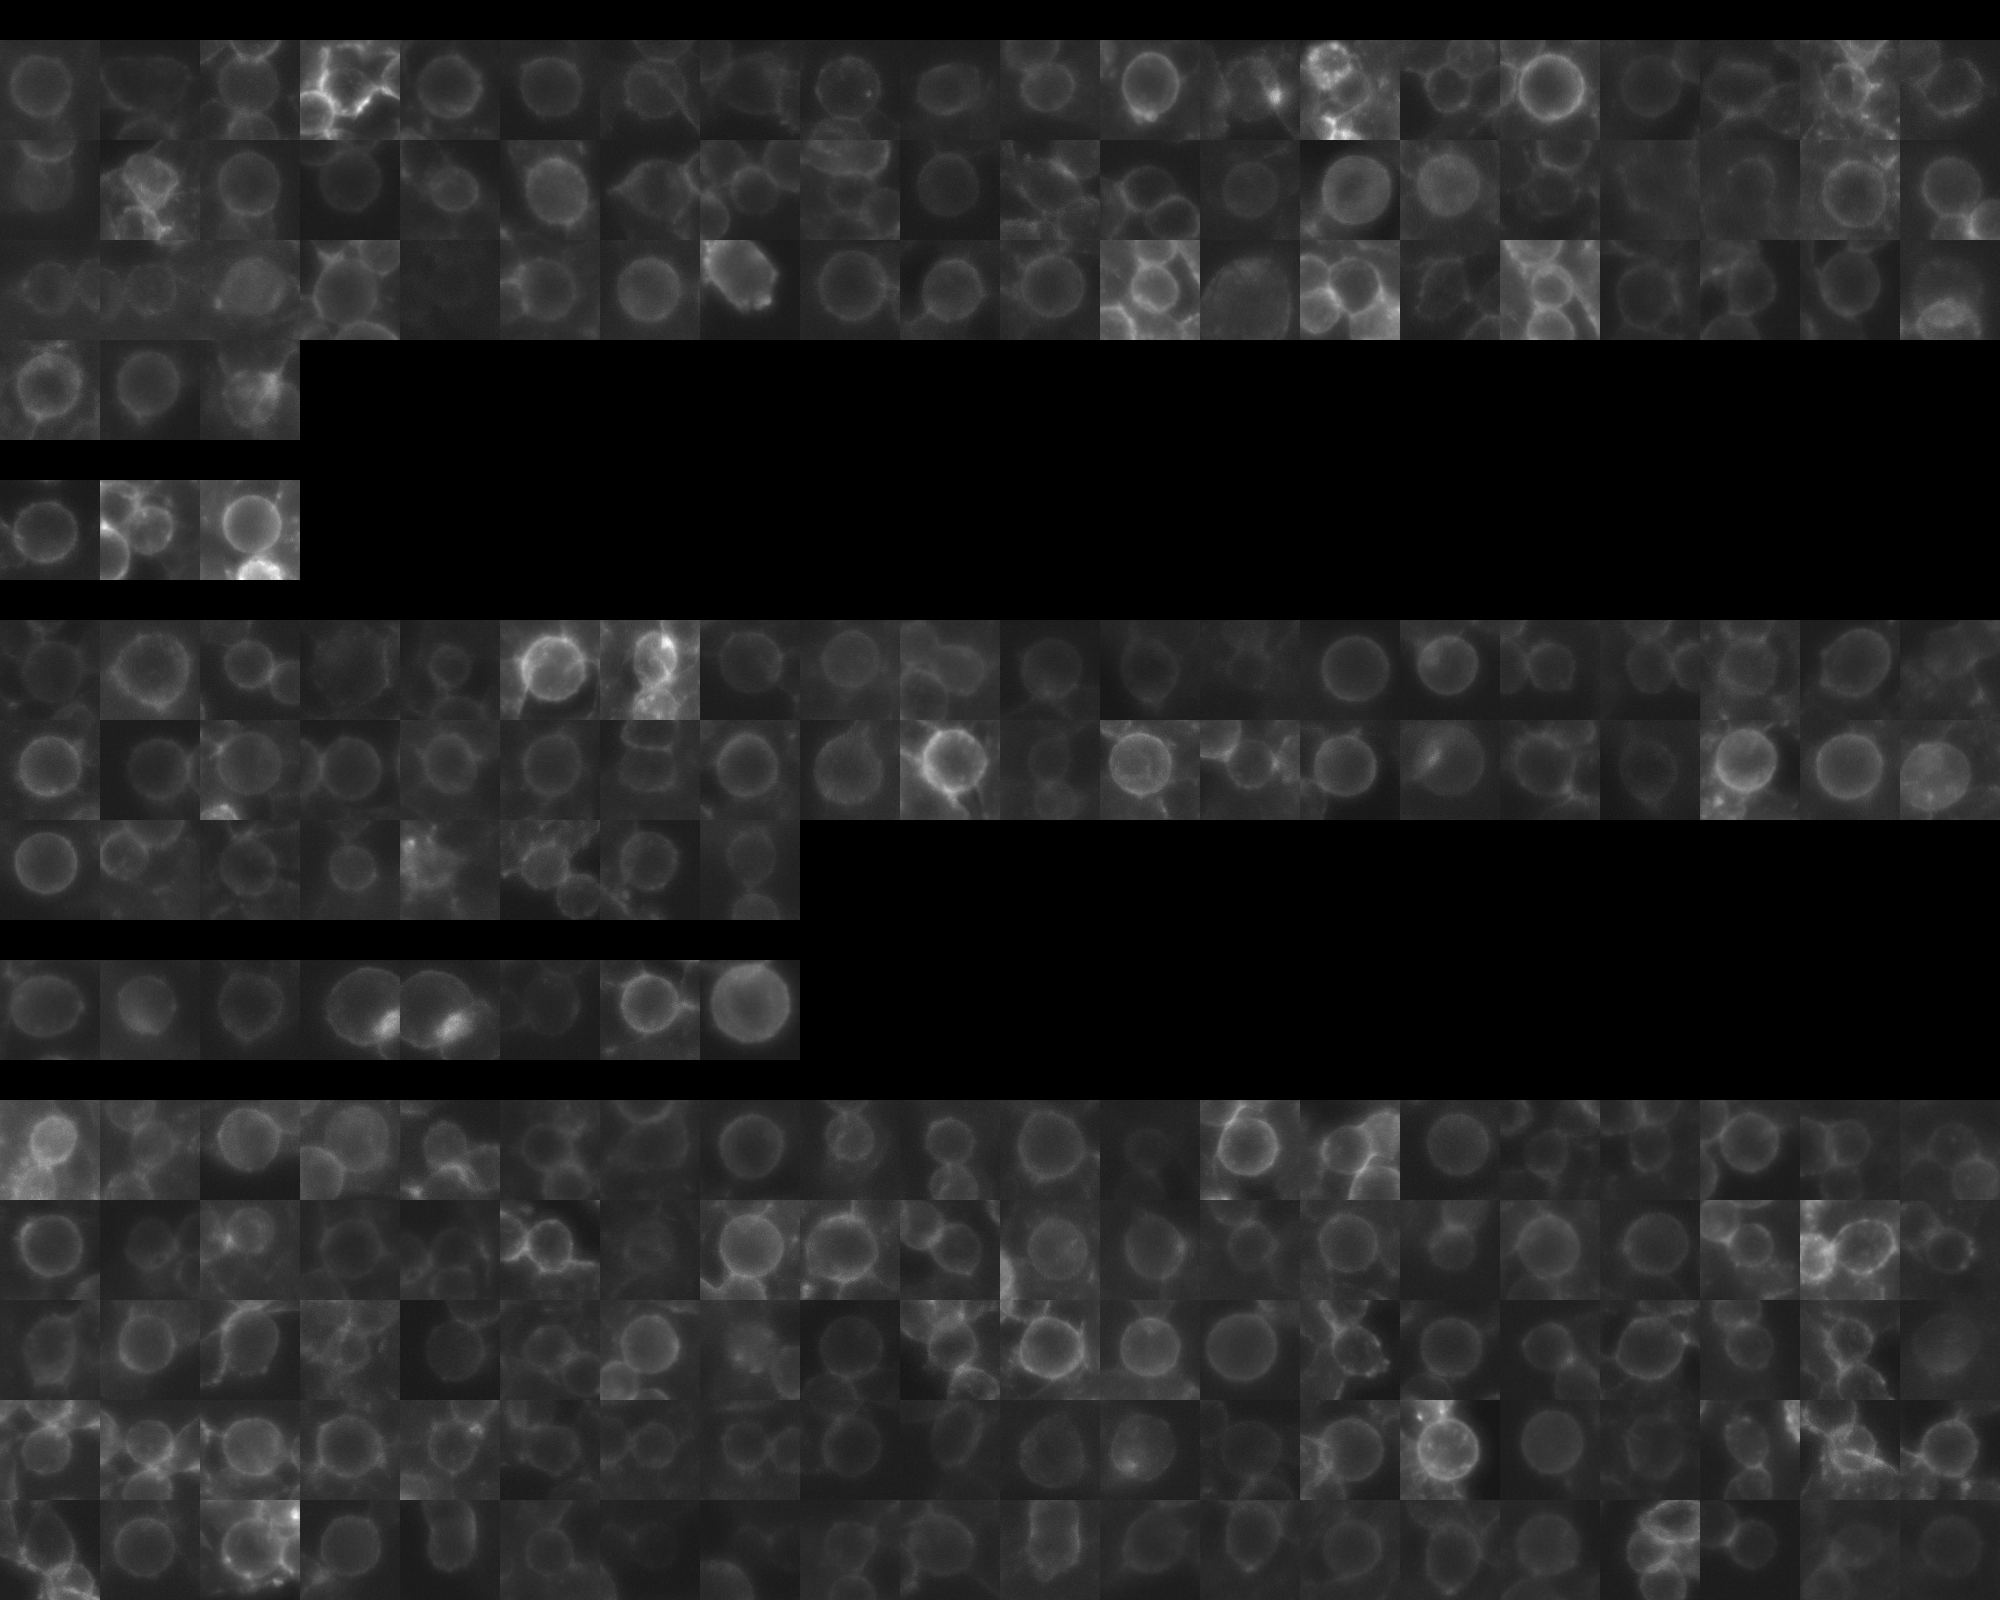
Each montage below shows randomly selected individual cell images for the same target gene separated by sgRNA, along with an example montage of cells expressing a non-targeting negative control sgRNA at the bottom. sgRNA labels in the montages correspond to the numbered sgRNA sequences in the gene info table above. The DNA (blue) and tubulin (green) channels are displayed by default, with gH2AX (grayscale) and actin (yellow) available using the check boxes. Channel brightness, contrast, and opacity are adjustable by clicking the arrow next to the channel name. When only one channel is selected, the display defaults to grayscale. Click the “Zoom” checkbox above the channel controls to enable image zooming (via scrolling) and panning (via click-and-drag).

The cell boxes displayed for this gene are square, 36.43 μm per side for the interphase montage and 30.36 μm per side for the mitotic montage.
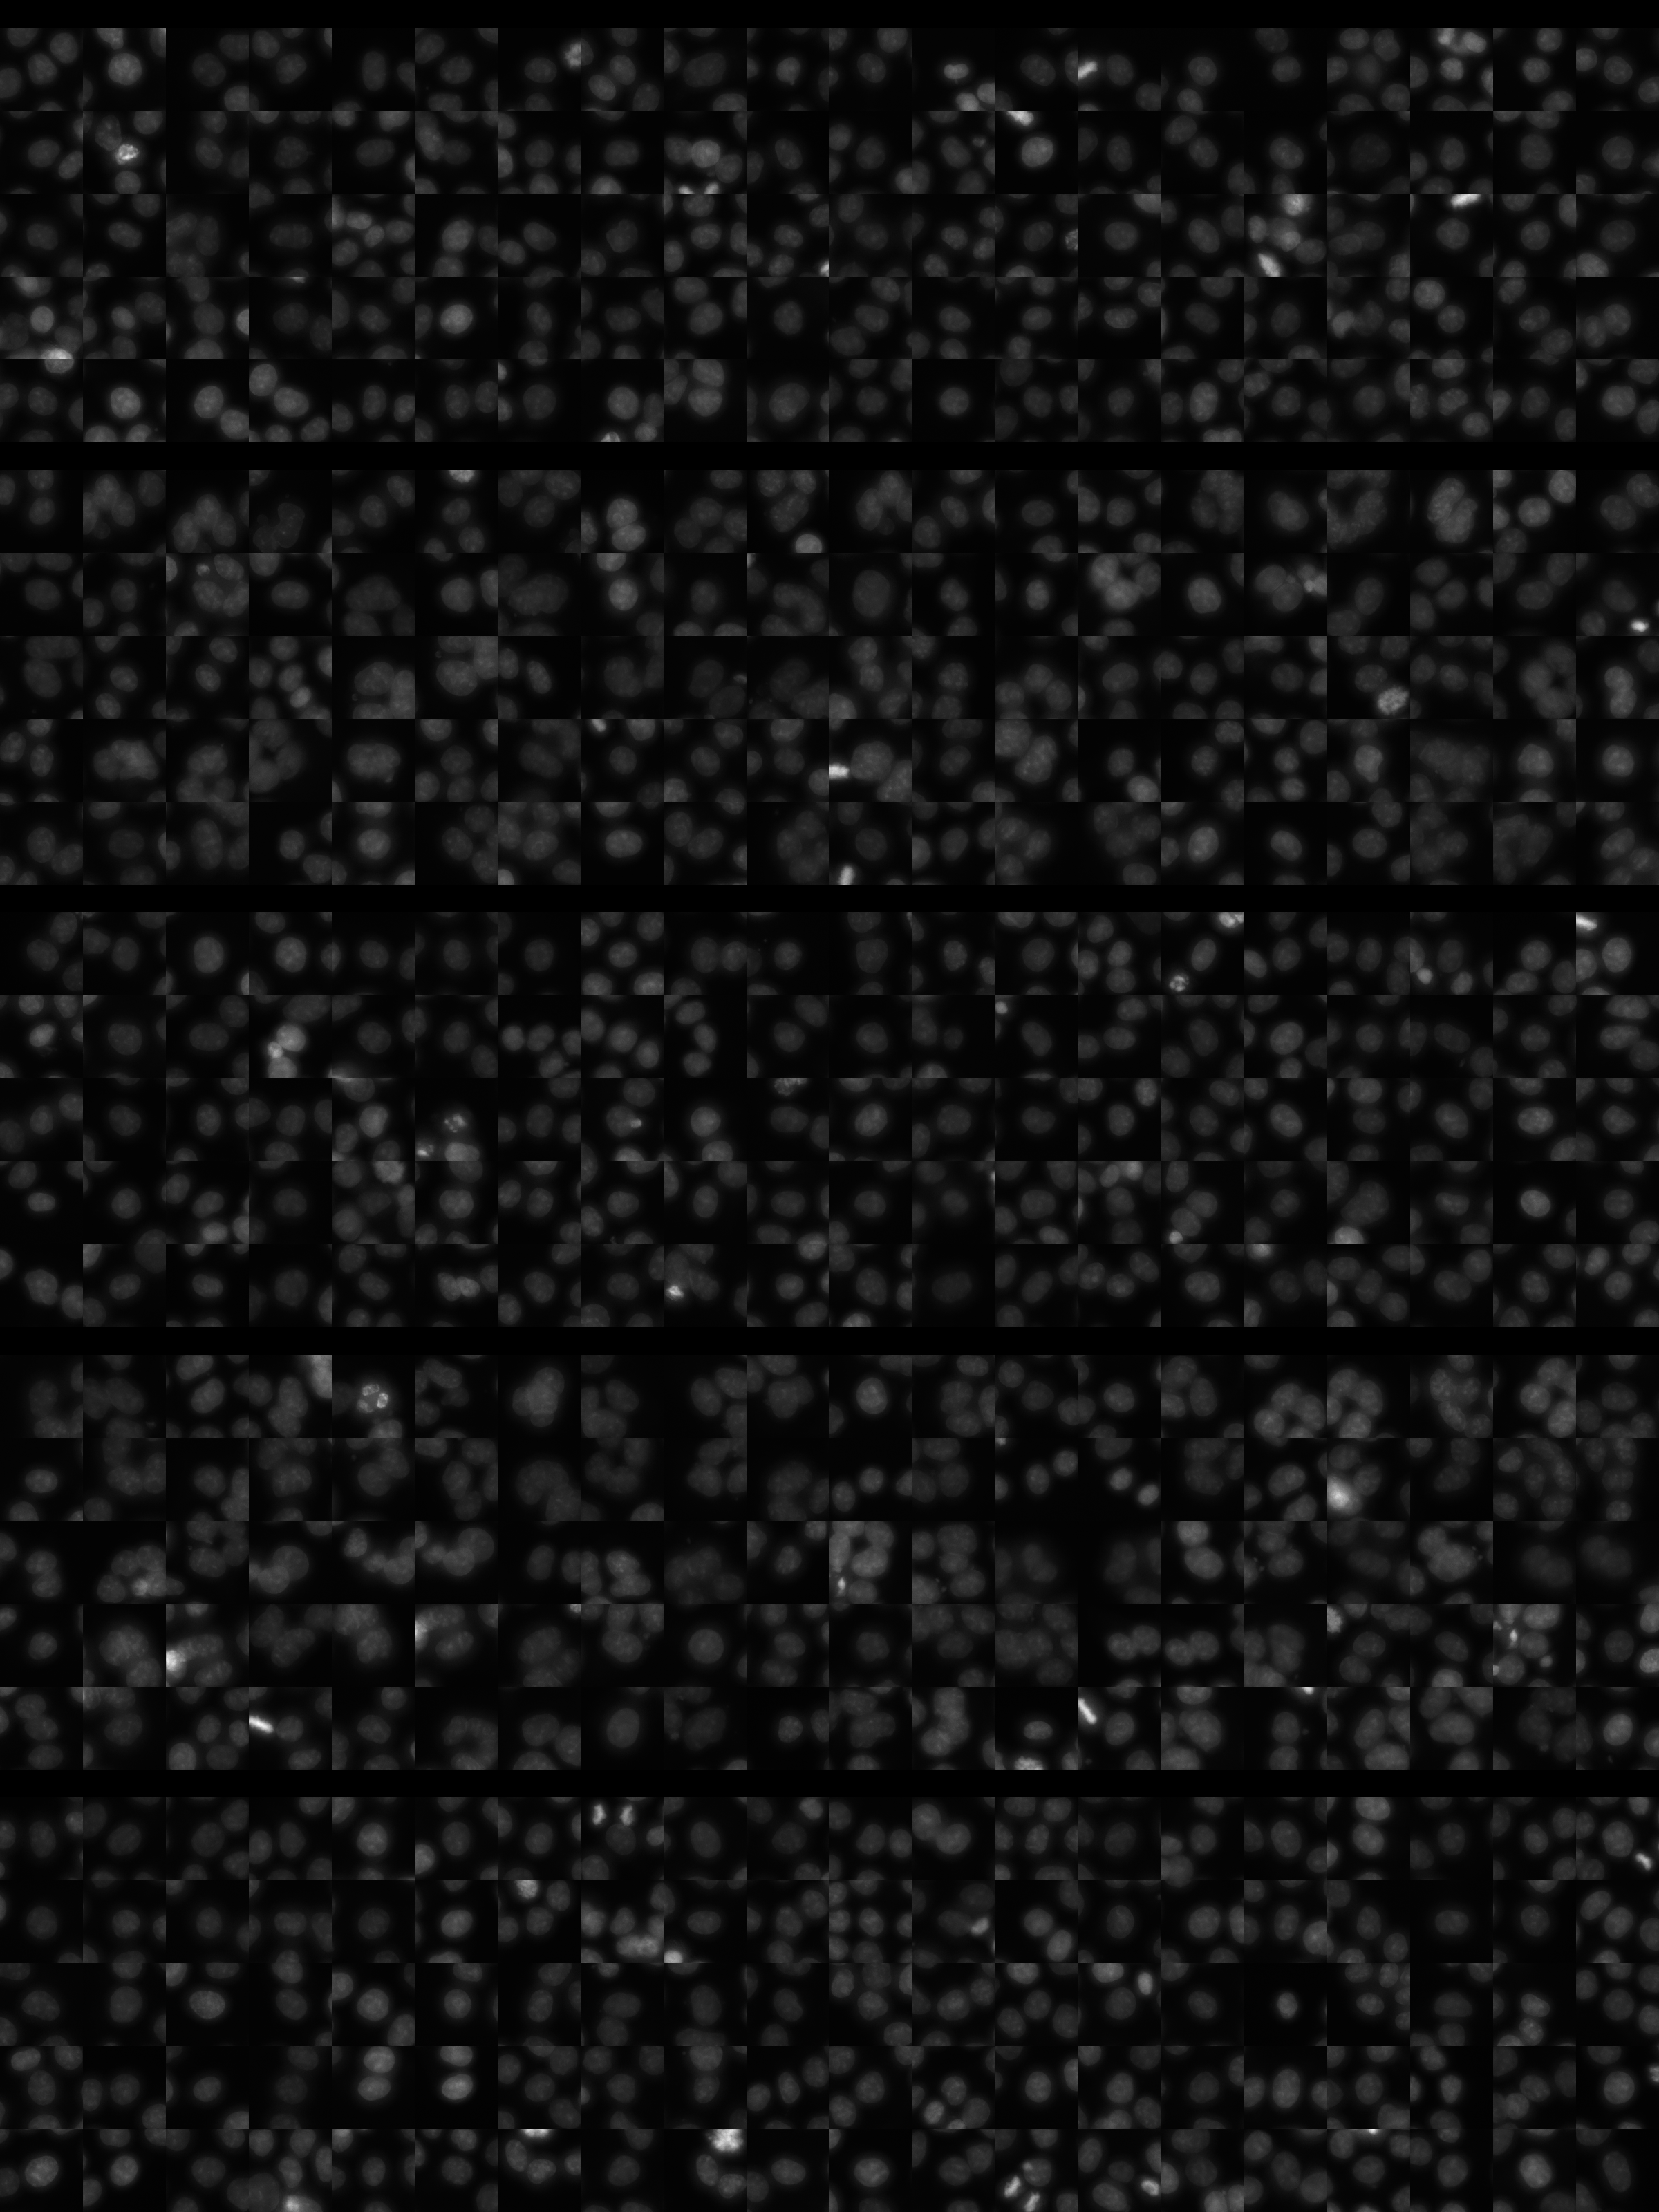
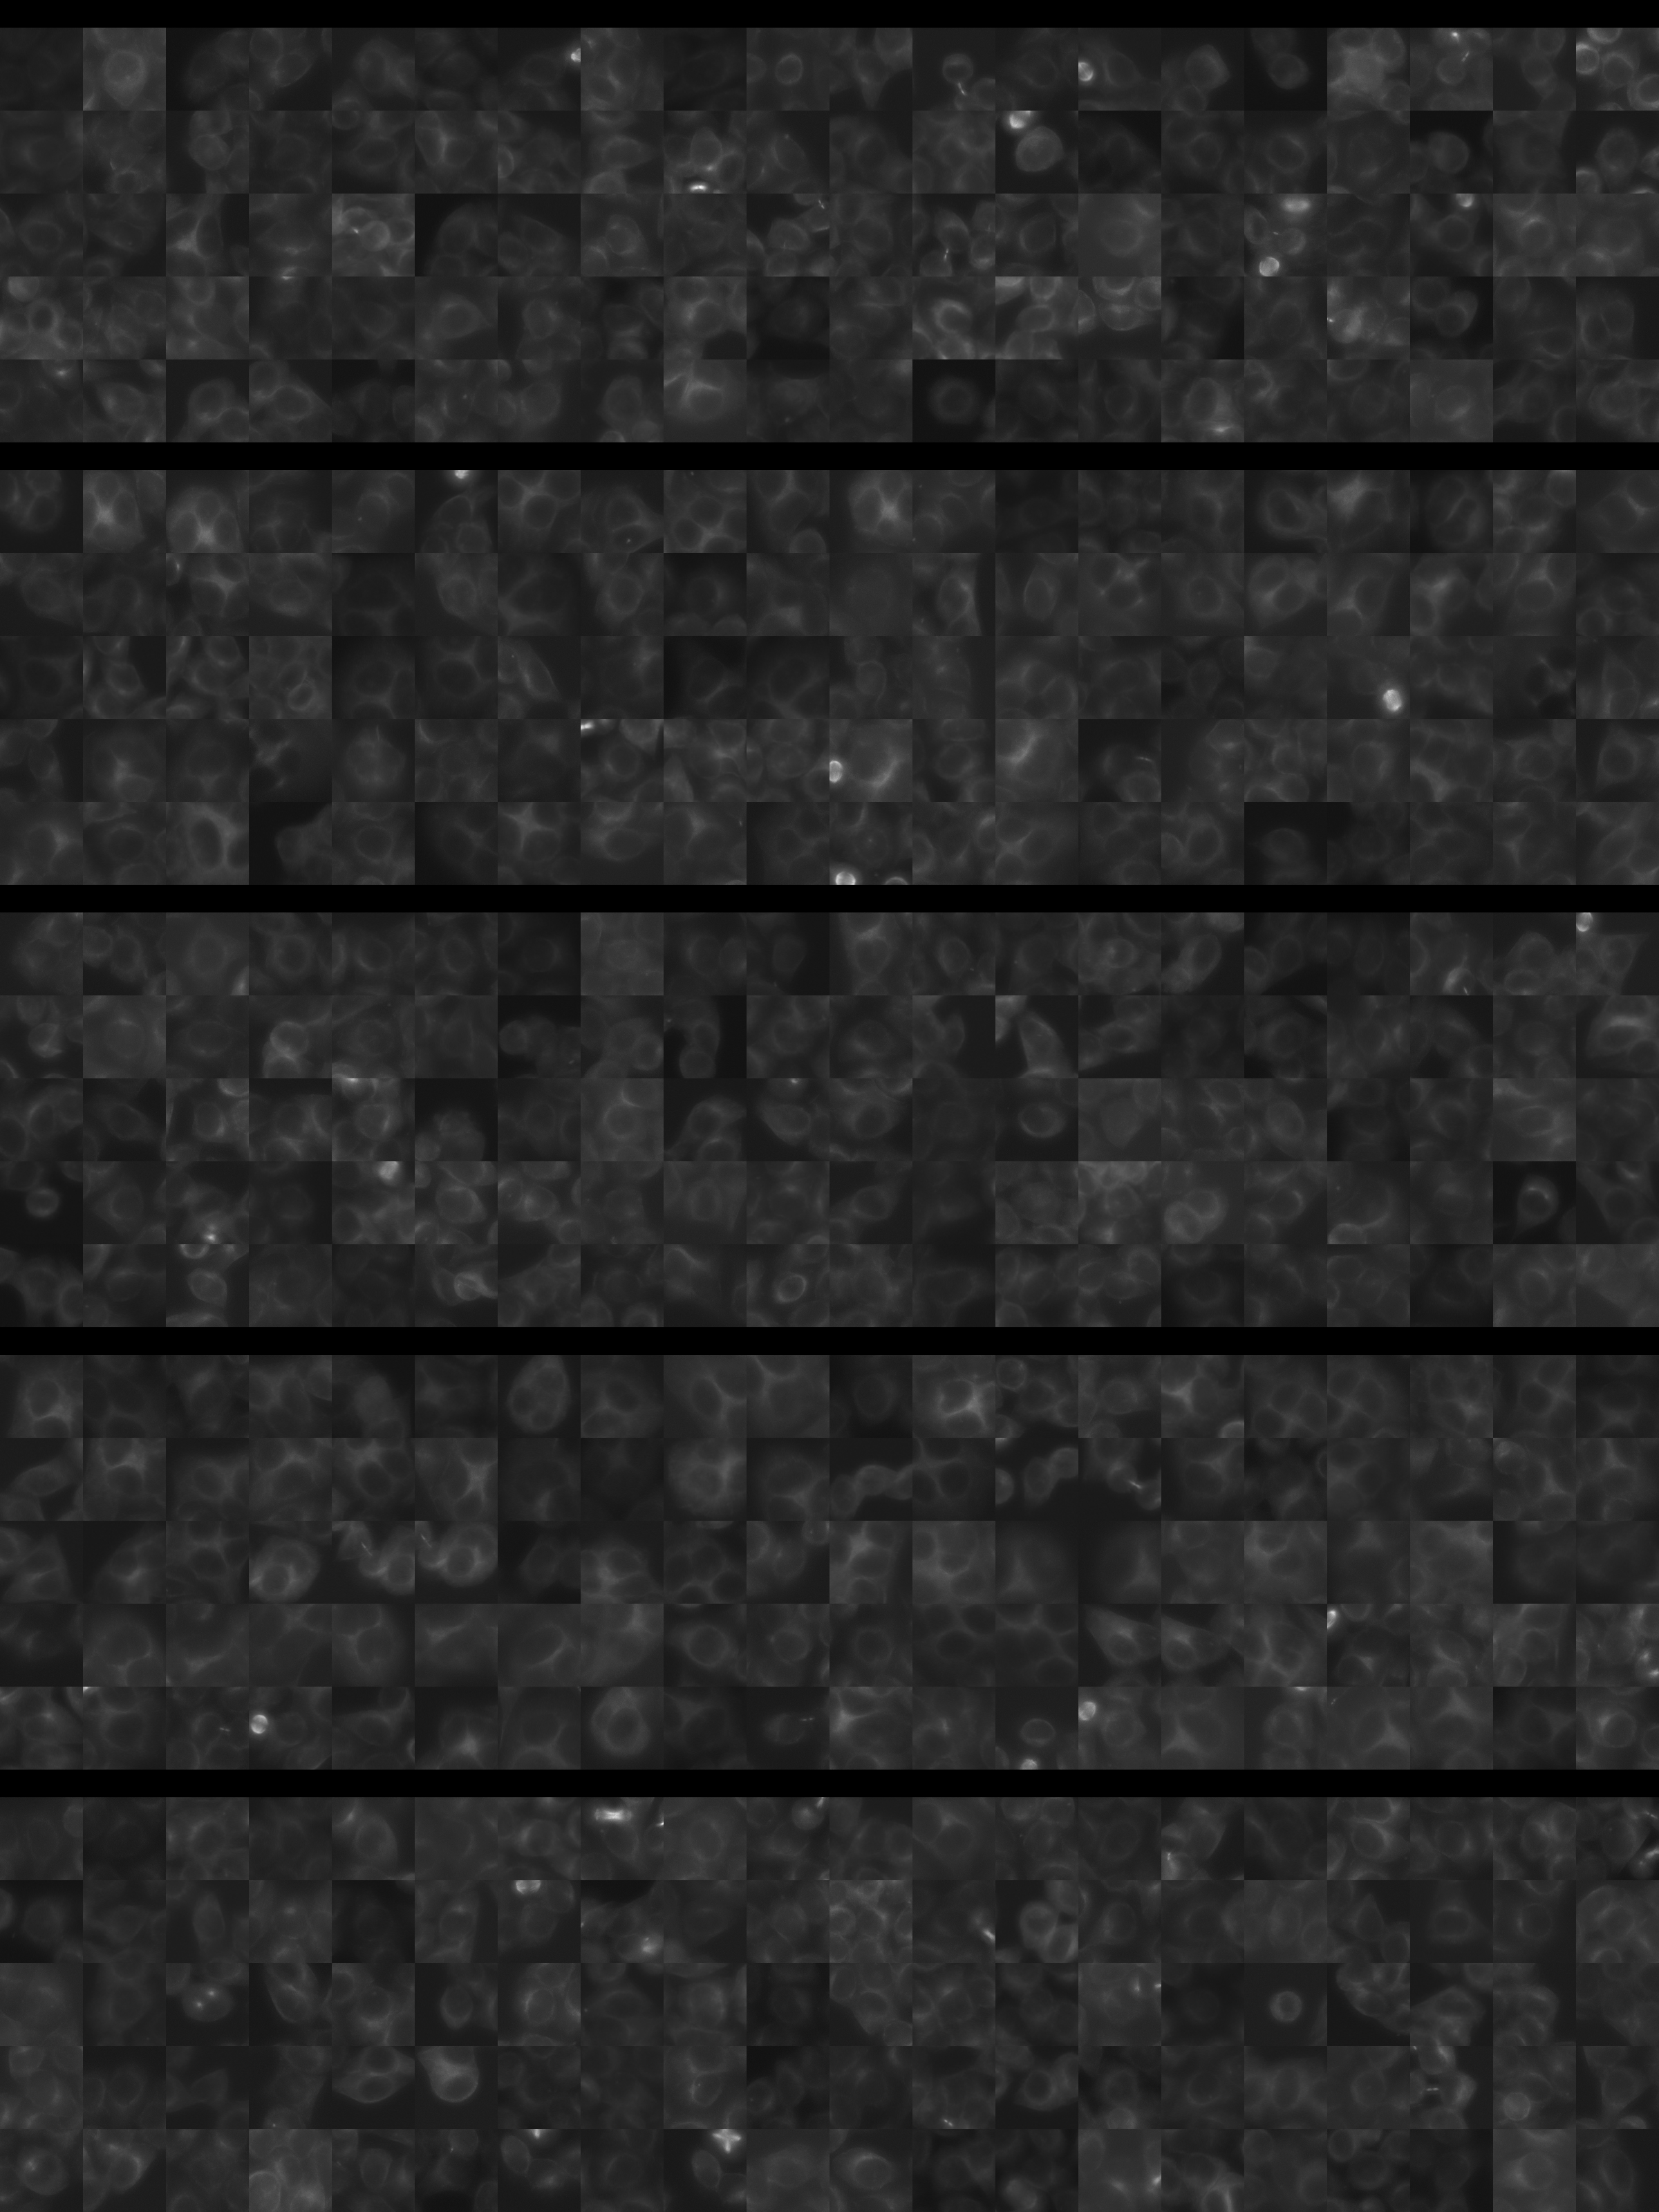
Features

Interphase Score Rank FDR q-value
Nucleus DNA Integrated 0.184 188 of 5322 0.004
Nucleus DNA Mean -1.440e-02 2457 of 5322 0.852
Nucleus gH2AX Mean 0.028 4084 of 5322 0.582
Nucleus DNA - gH2AX Correlation -2.054e-01 5132 of 5322 1.021e-04
Nucleus Shape Area 0.133 464 of 5322 0.029
Nucleus Shape Eccentricity 0.174 35 of 5322 4.529e-04
Nucleus Shape Form Factor -2.859e-01 5289 of 5322 2.872e-04
Nucleus Shape Solidity -3.258e-01 5302 of 5322 1.903e-04
Cell DNA Mass Displacement 0.410 4 of 5322 0.001
Cell Tubulin Mean 0.153 268 of 5322 0.002
Cell Tubulin Mass Displacement 0.339 11 of 5322 3.984e-04
Cell Actin Mean -7.105e-02 4677 of 5322 0.237
Cell Tubulin - Actin Correlation 0.031 2164 of 5322 0.628
Cell DNA - Tubulin Correlation -1.137e-02 4216 of 5322 0.850
Cell Shape Area 0.078 893 of 5322 0.280
Cell Shape Eccentricity 0.080 131 of 5322 0.272
Mitotic Score Rank FDR q-value
Nucleus DNA Integrated 0.391 287 of 5322 0.663
Nucleus DNA Mean 0.285 268 of 5322 1.000
Nucleus DNA Mass Displacement 0.028 3063 of 5322 0.999
Nucleus DNA Mean Frac 3 0.304 203 of 5322 1.000
Nucleus gH2AX Mean -6.900e-02 3901 of 5322 1.000
Nucleus gH2AX Mean Frac 0 0.053 1503 of 5322 1.000
Nucleus Tubulin Mean Frac 0 -6.952e-02 4398 of 5322 0.999
Nucleus Tubulin Mean Edge 0.085 2047 of 5322 0.999
Nucleus Tubulin Std Edge 0.108 1179 of 5322 0.999
Nucleus Shape Area 0.107 2565 of 5322 0.990
Nucleus Shape Eccentricity -1.378e-01 4011 of 5322 1.000
Nucleus Shape Form Factor 0.066 634 of 5322 0.998
Cell Tubulin Mean 0.145 1497 of 5322 0.997
Cell Tubulin Mean Frac 3 -4.196e-01 5071 of 5322 0.801
Cell Actin Mean -2.186e-01 5081 of 5322 0.997
Cell Shape Area 0.128 2229 of 5322 0.998
( Reset Zoom )
Brightness
Contrast
Opacity
Brightness
Contrast
Opacity
Brightness
Contrast
Opacity
Brightness
Contrast
Opacity
Brightness
Contrast
Opacity

( Reset Zoom )
Brightness
Contrast
Opacity
Brightness
Contrast
Opacity
Brightness
Contrast
Opacity
Brightness
Contrast
Opacity
Brightness
Contrast
Opacity

MIT Central Accessability