DTL

Gene symbol: DTL
Gene: 51514
Uniprot Function: Substrate-specific adapter of a DCX (DDB1-CUL4-X-box) E3 ubiquitin-protein ligase complex required for cell cycle control, DNA damage response and translesion DNA synthesis. The DCX(DTL) complex, also named CRL4(CDT2) complex, mediates the polyubiquitination and subsequent degradation of CDT1, CDKN1A/p21(CIP1), FBH1, KMT5A and SDE2 (PubMed:16861906, PubMed:16949367, PubMed:16964240, PubMed:17085480, PubMed:18703516, PubMed:18794347, PubMed:18794348, PubMed:19332548, PubMed:20129063, PubMed:23478441, PubMed:23478445, PubMed:23677613, PubMed:27906959). CDT1 degradation in response to DNA damage is necessary to ensure proper cell cycle regulation of DNA replication (PubMed:16861906, PubMed:16949367, PubMed:17085480). CDKN1A/p21(CIP1) degradation during S phase or following UV irradiation is essential to control replication licensing (PubMed:18794348, PubMed:19332548). KMT5A degradation is also important for a proper regulation of mechanisms such as TGF-beta signaling, cell cycle progression, DNA repair and cell migration (PubMed:23478445). Most substrates require their interaction with PCNA for their polyubiquitination: substrates interact with PCNA via their PIP-box, and those containing the 'K+4' motif in the PIP box, recruit the DCX(DTL) complex, leading to their degradation. In undamaged proliferating cells, the DCX(DTL) complex also promotes the 'Lys-164' monoubiquitination of PCNA, thereby being involved in PCNA-dependent translesion DNA synthesis (PubMed:20129063, PubMed:23478441, PubMed:23478445, PubMed:23677613). The DDB1-CUL4A-DTL E3 ligase complex regulates the circadian clock function by mediating the ubiquitination and degradation of CRY1 (PubMed:26431207).
Mitotic Index 0.0179
Interphase Cluster: #26 (38 genes)
Mitotic Cluster: #34 (33 genes)
sgRNA 1: ACAGCTGTATTCTGTACGGG (interphase cells: 1106, mitotic cells: 14)
sgRNA 2: AGGTGATAAACTTTCCACGG (interphase cells: 827, mitotic cells: 16)
sgRNA 3: TGAAGCTGCCTACATATGGA (interphase cells: 583, mitotic cells: 12)
sgRNA 4: TTTCCAGCAAAGTGTTACTG (interphase cells: 509, mitotic cells: 13)

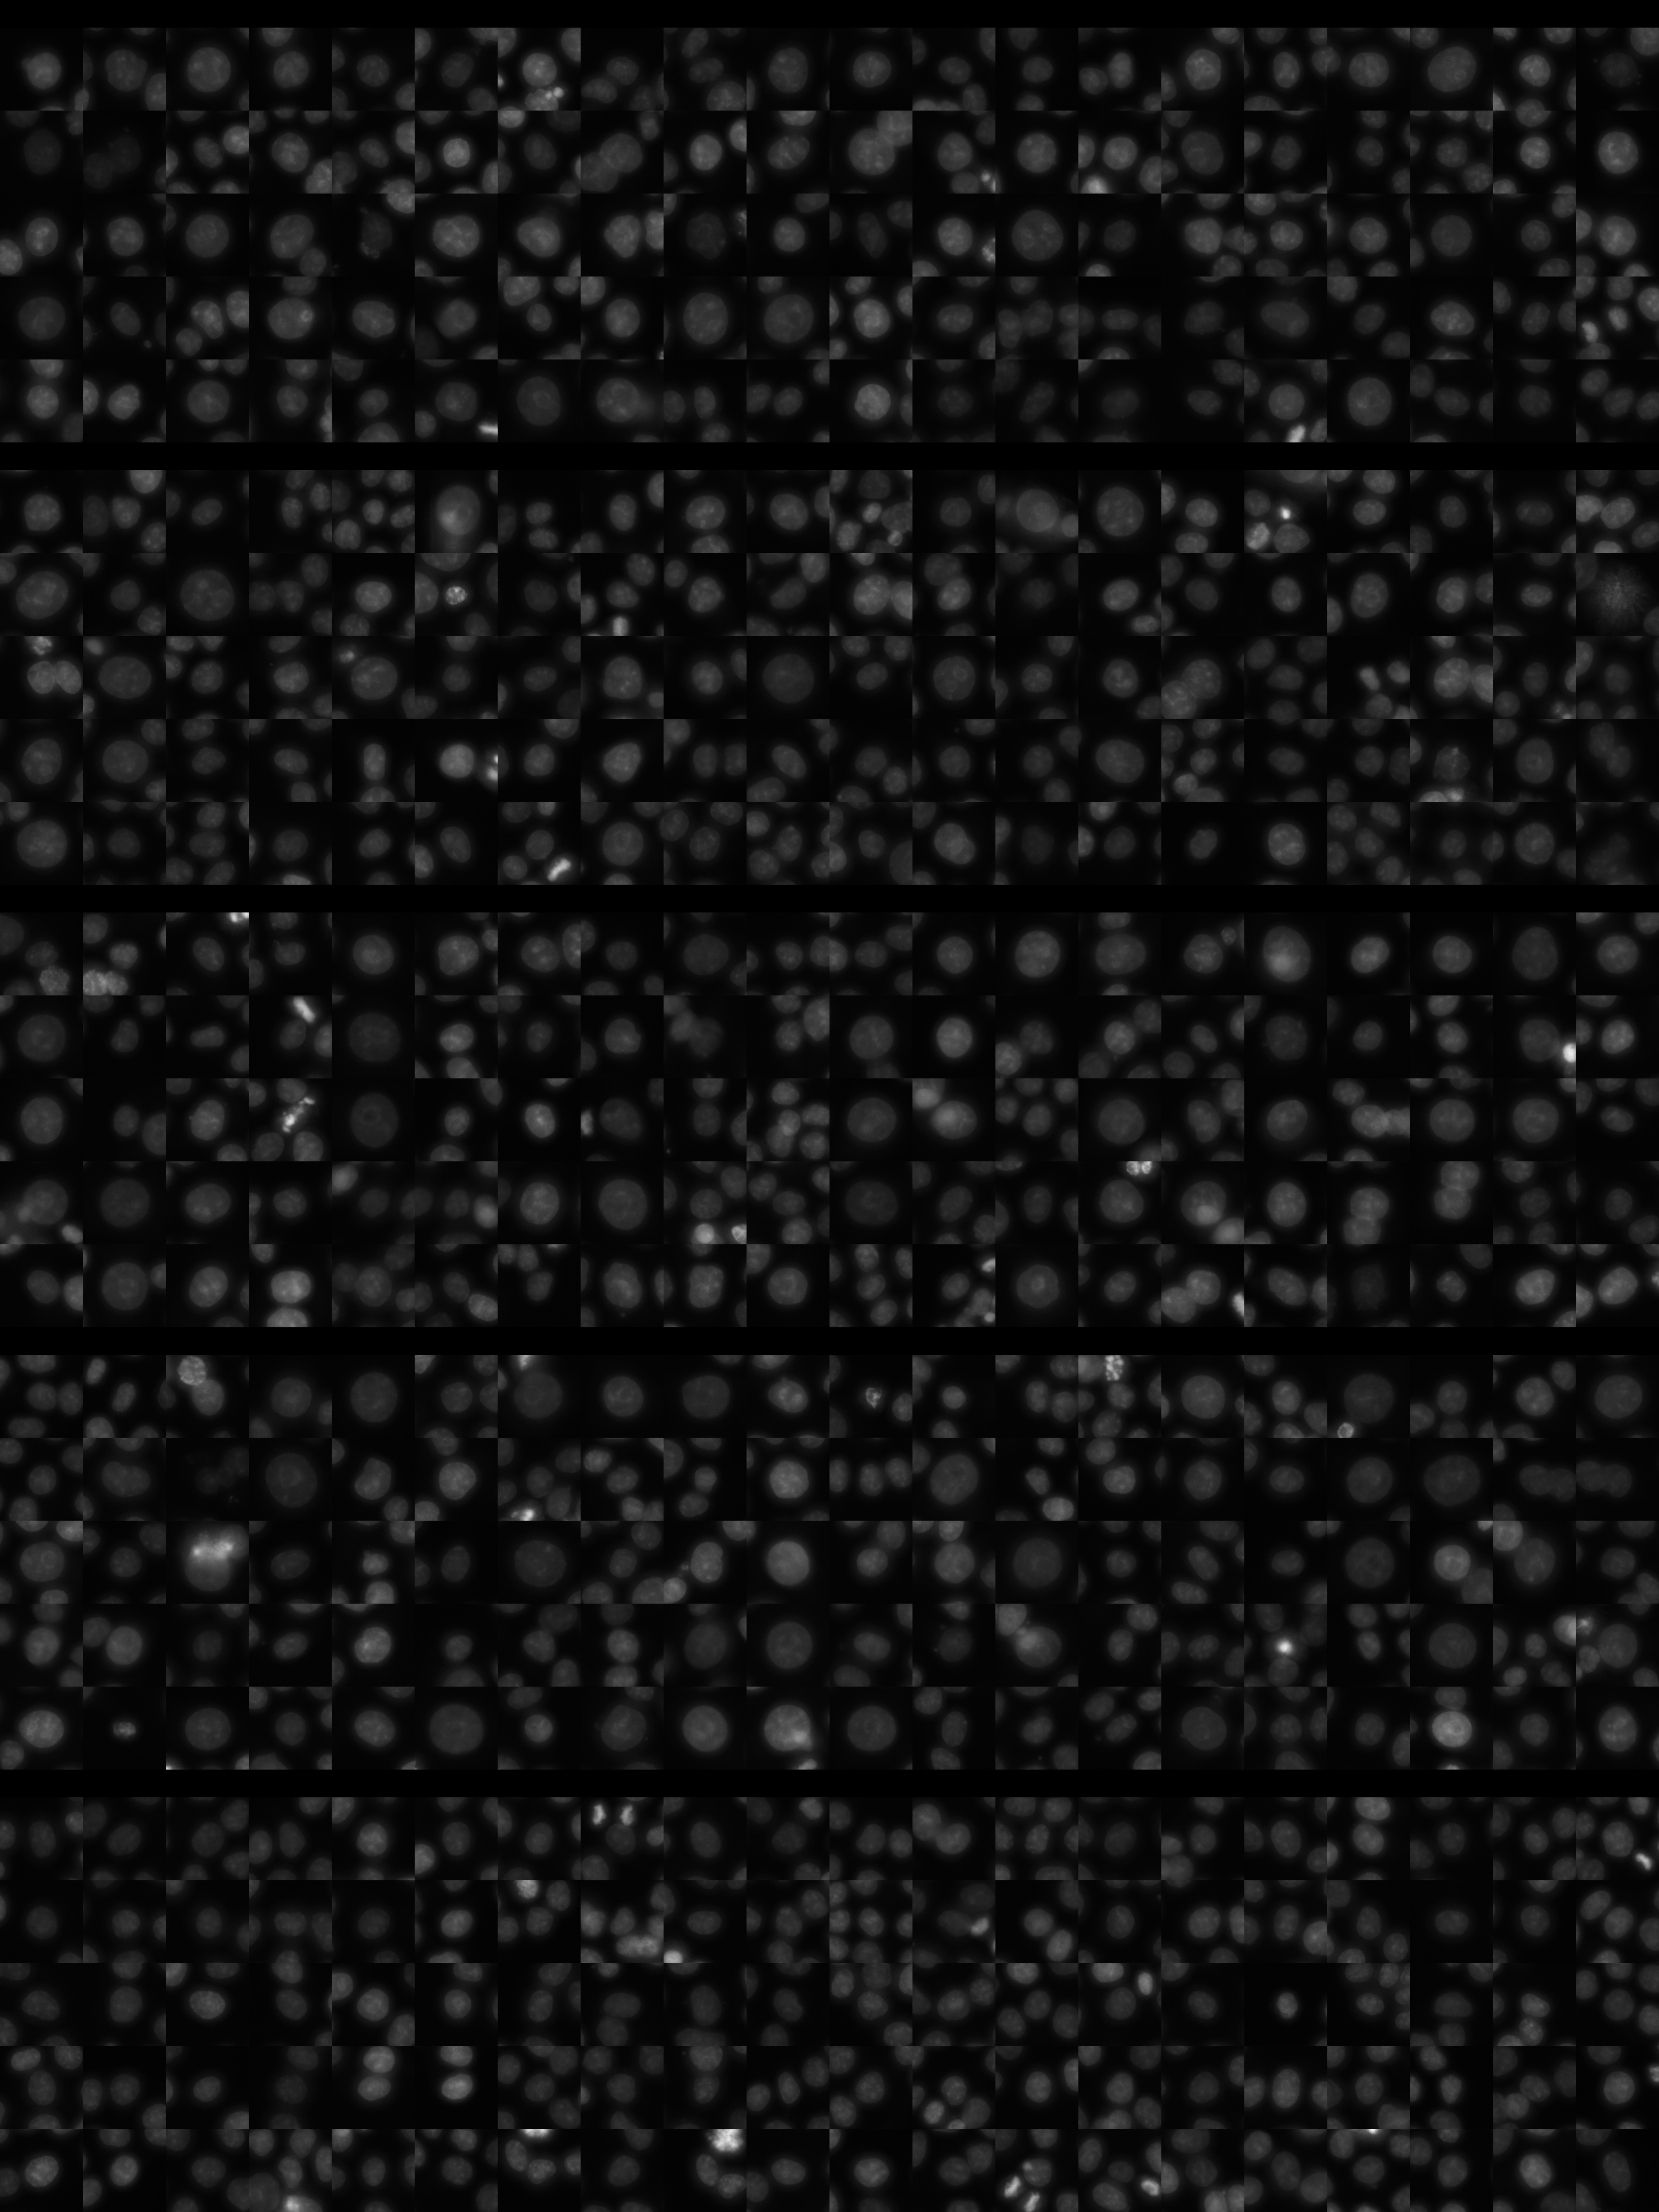
Interphase Cluster

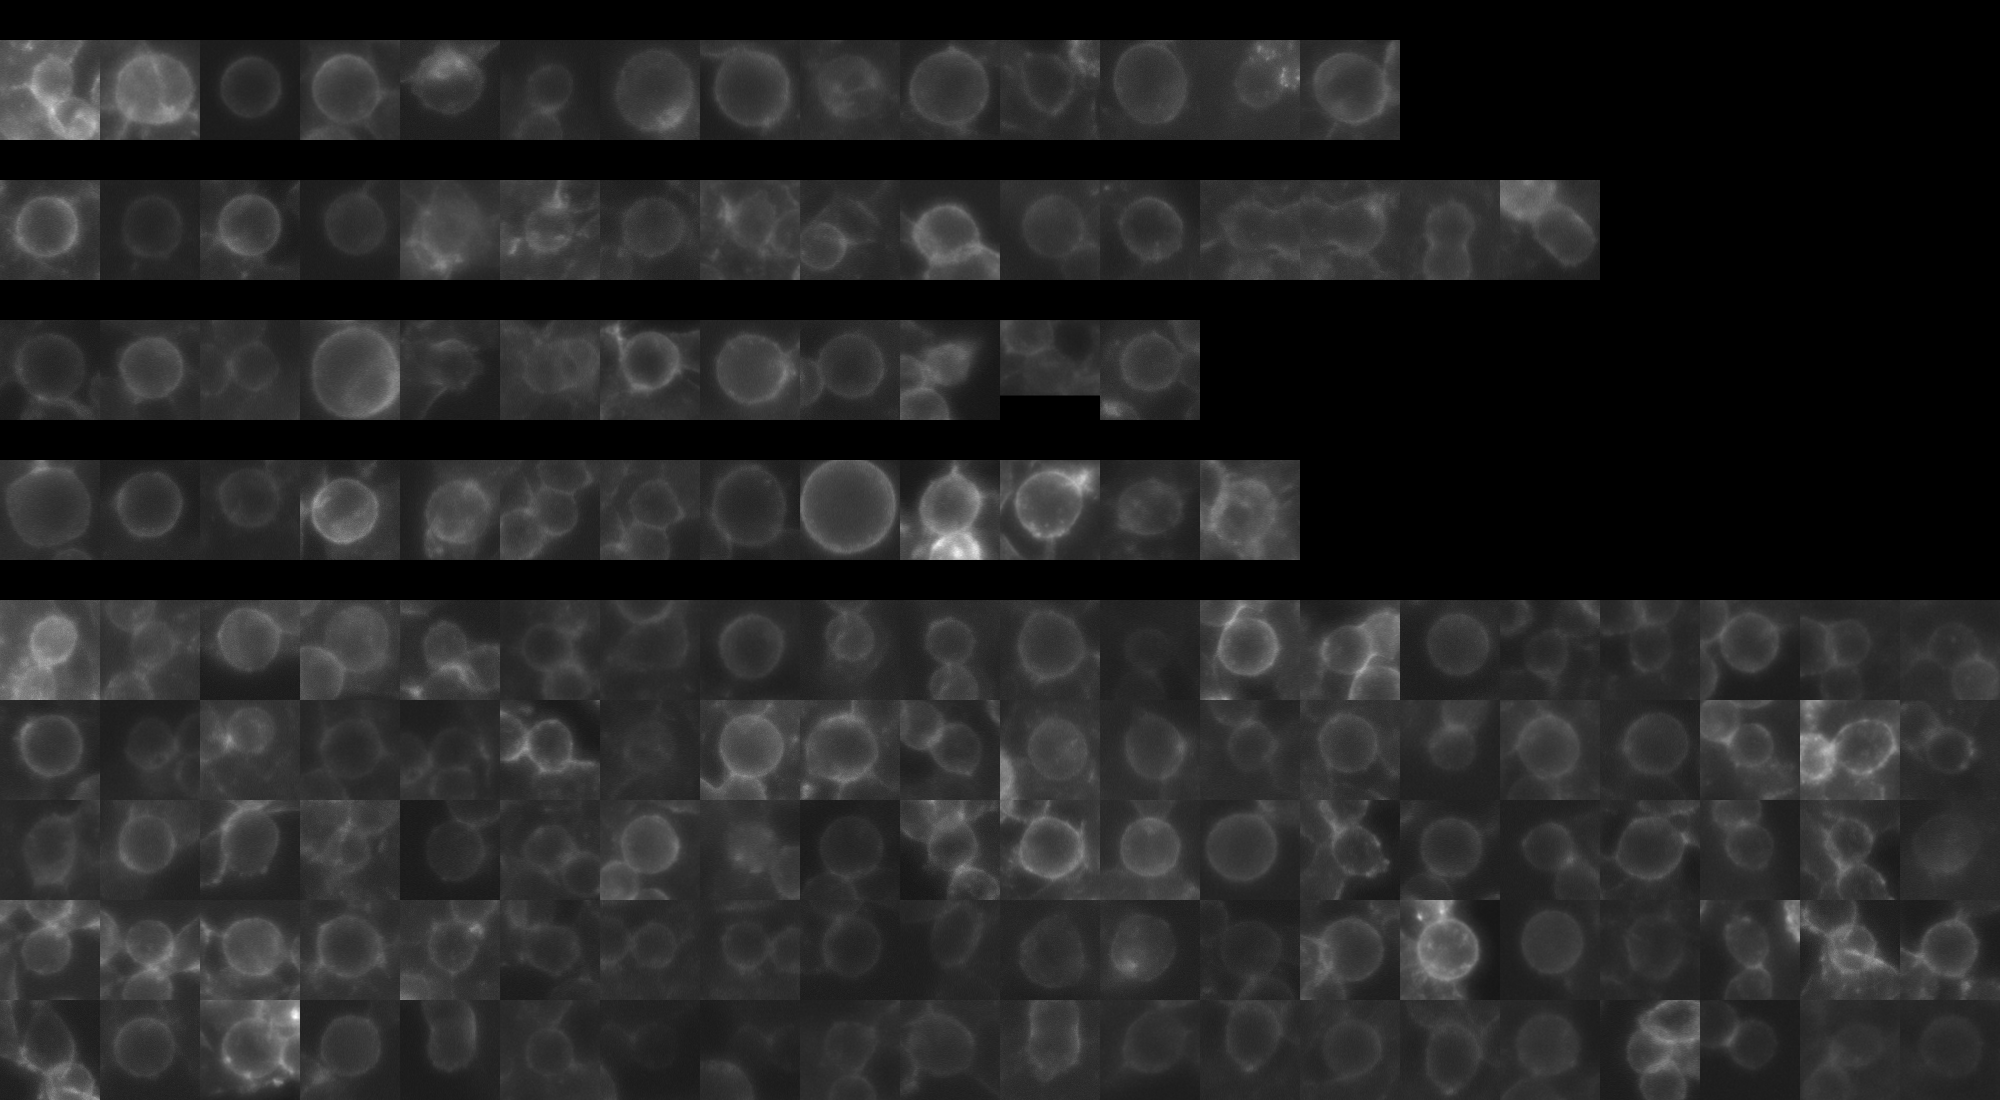
Mitotic Cluster

Overview

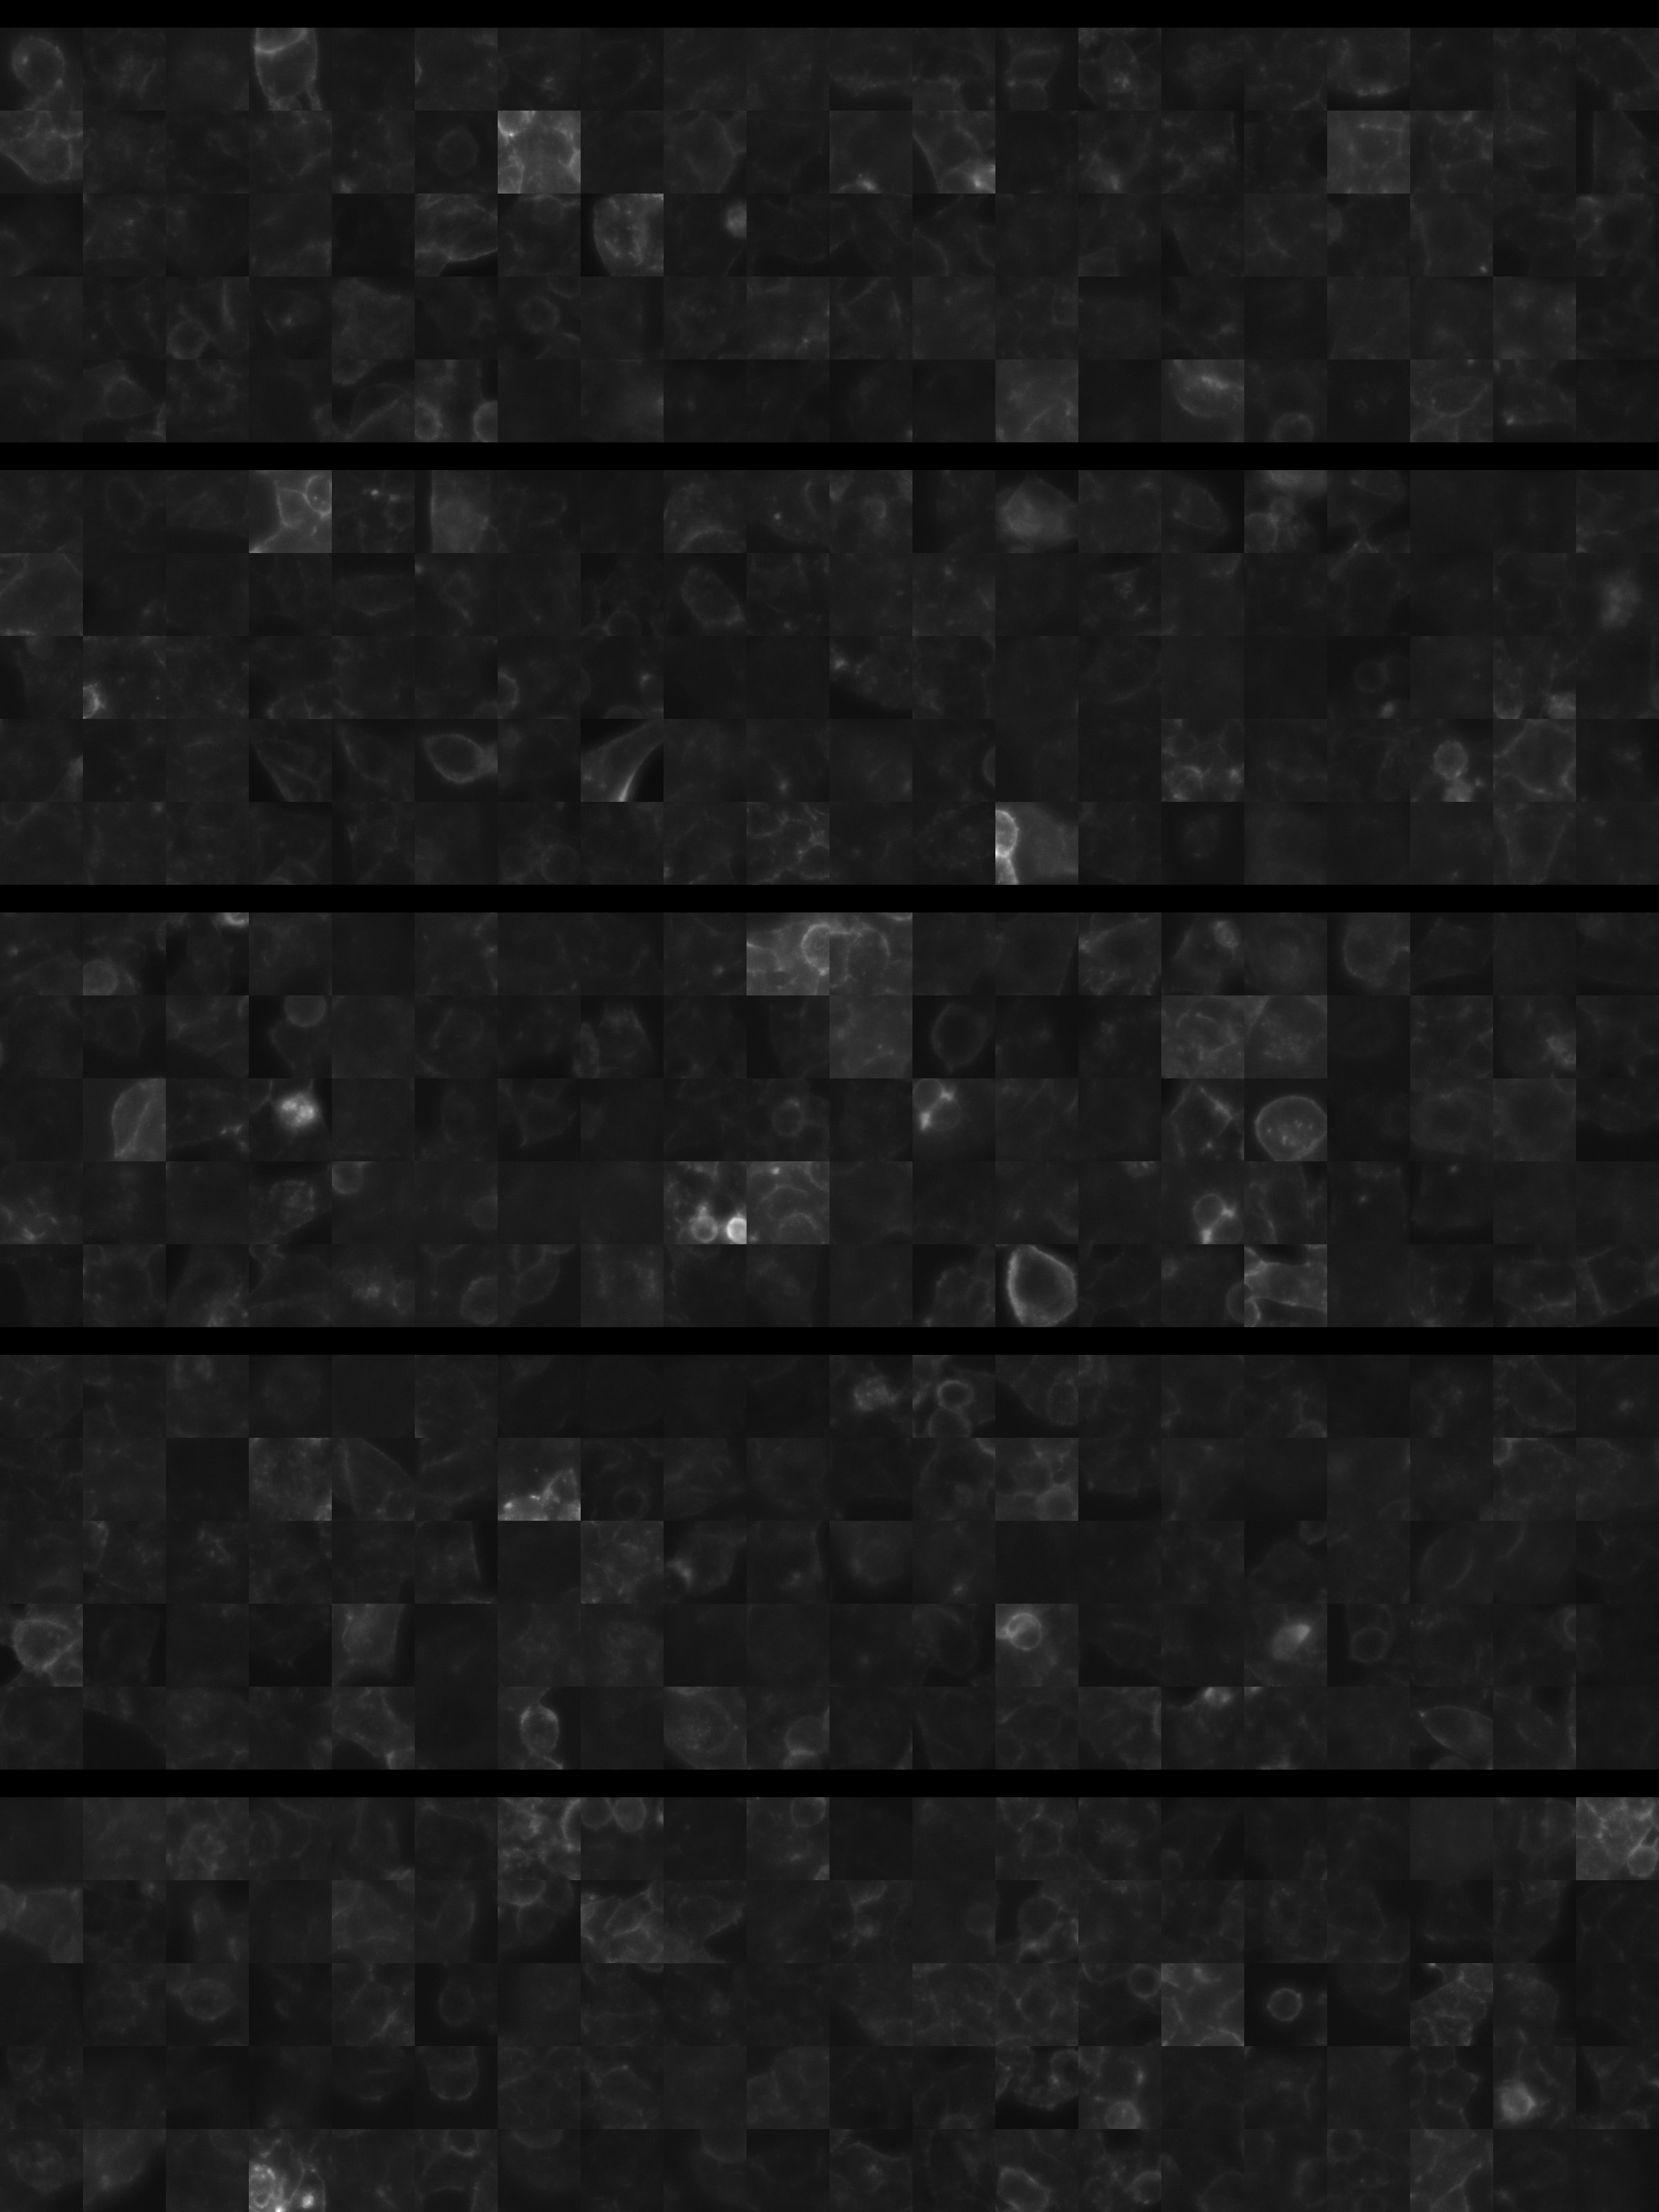
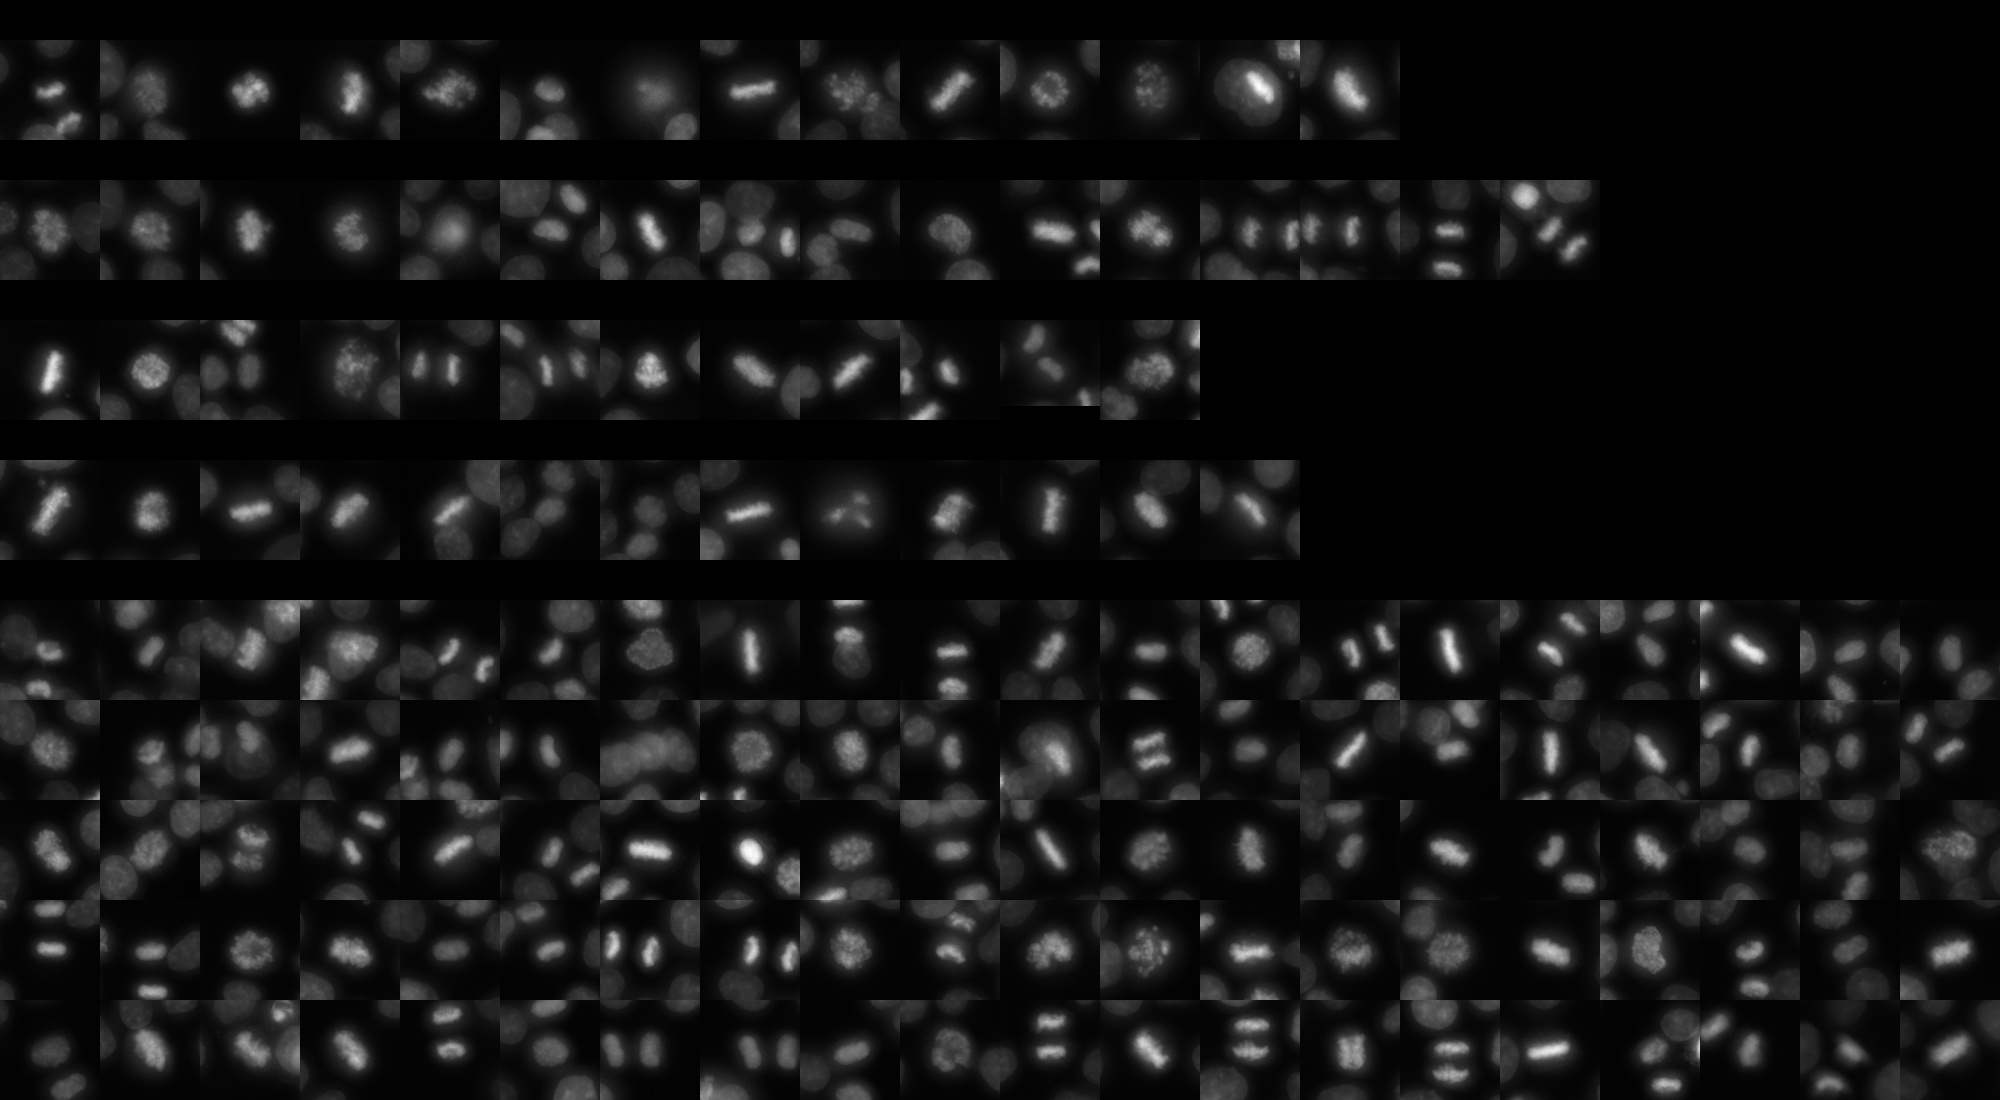
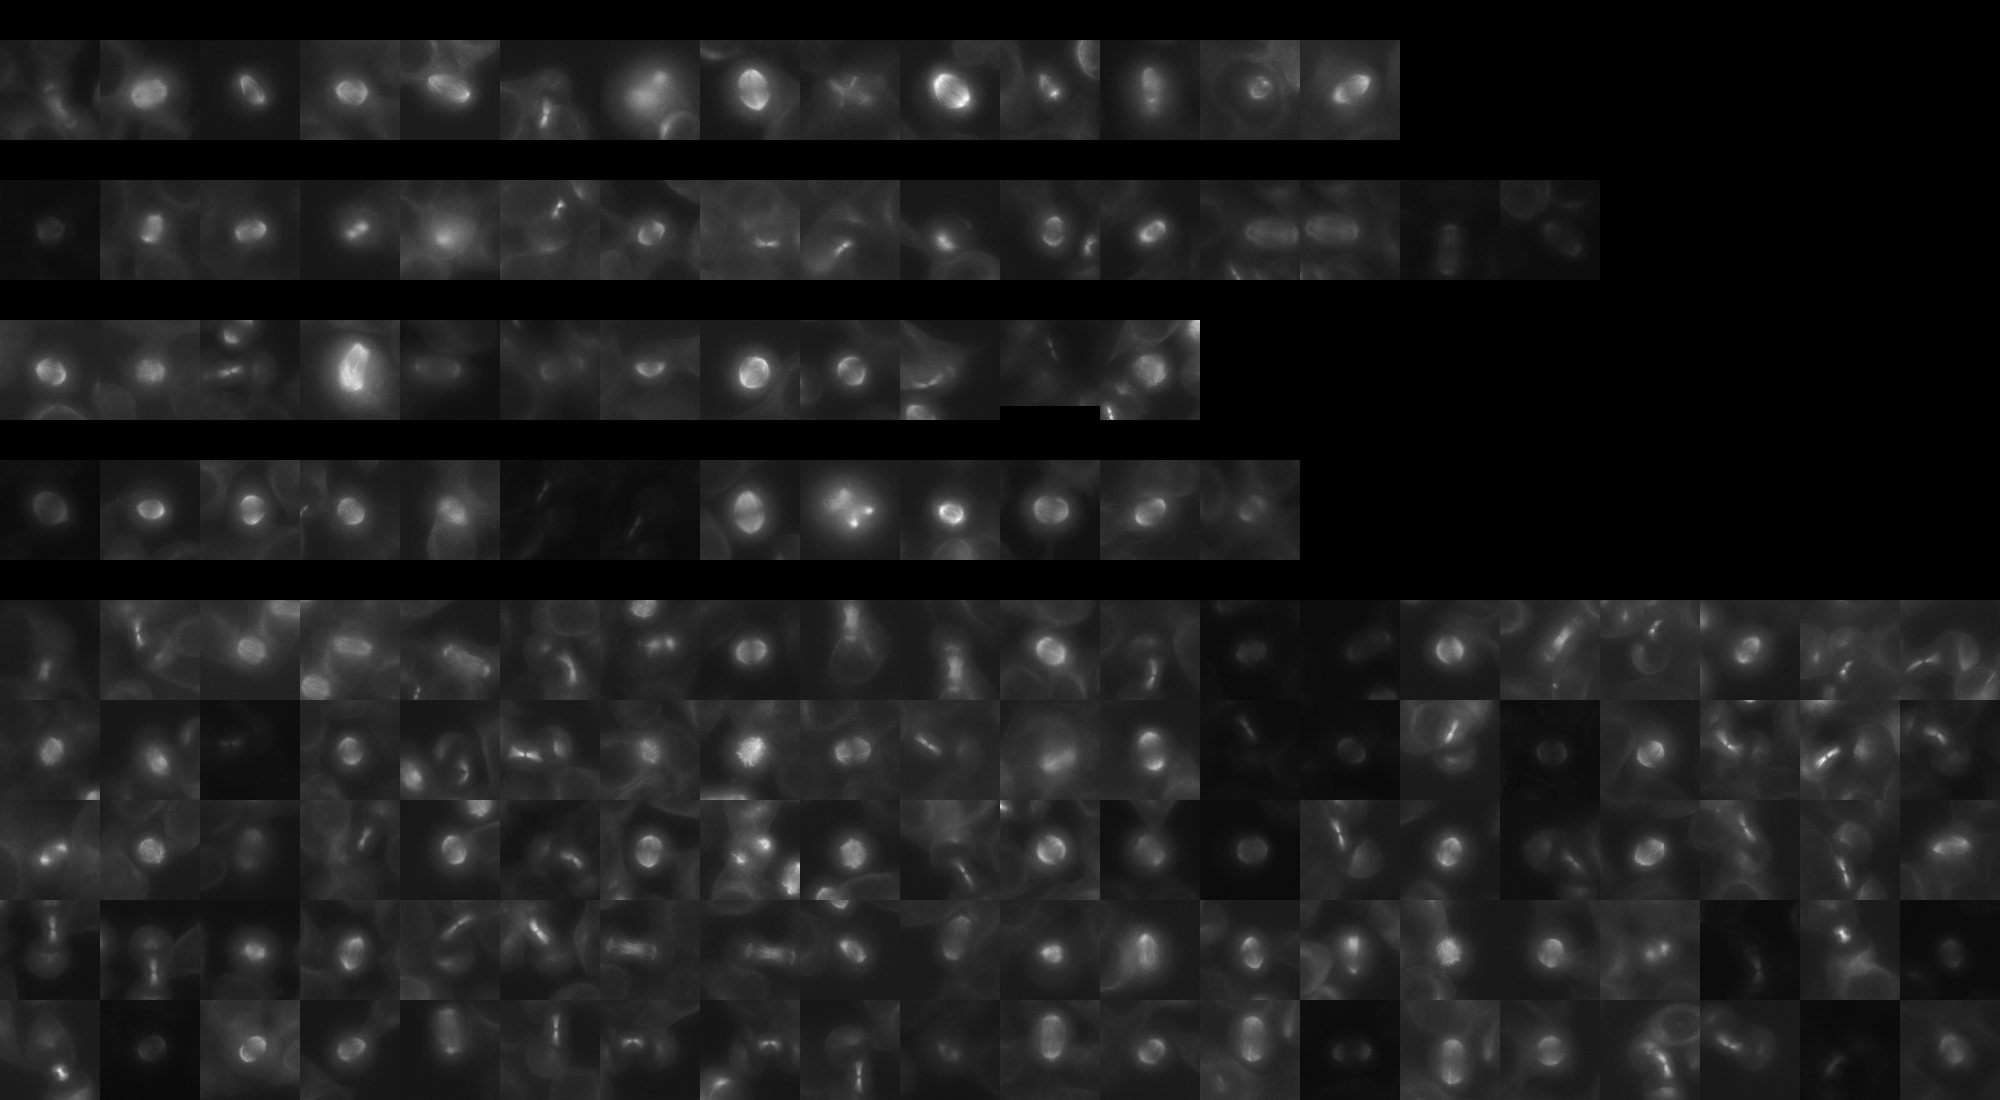
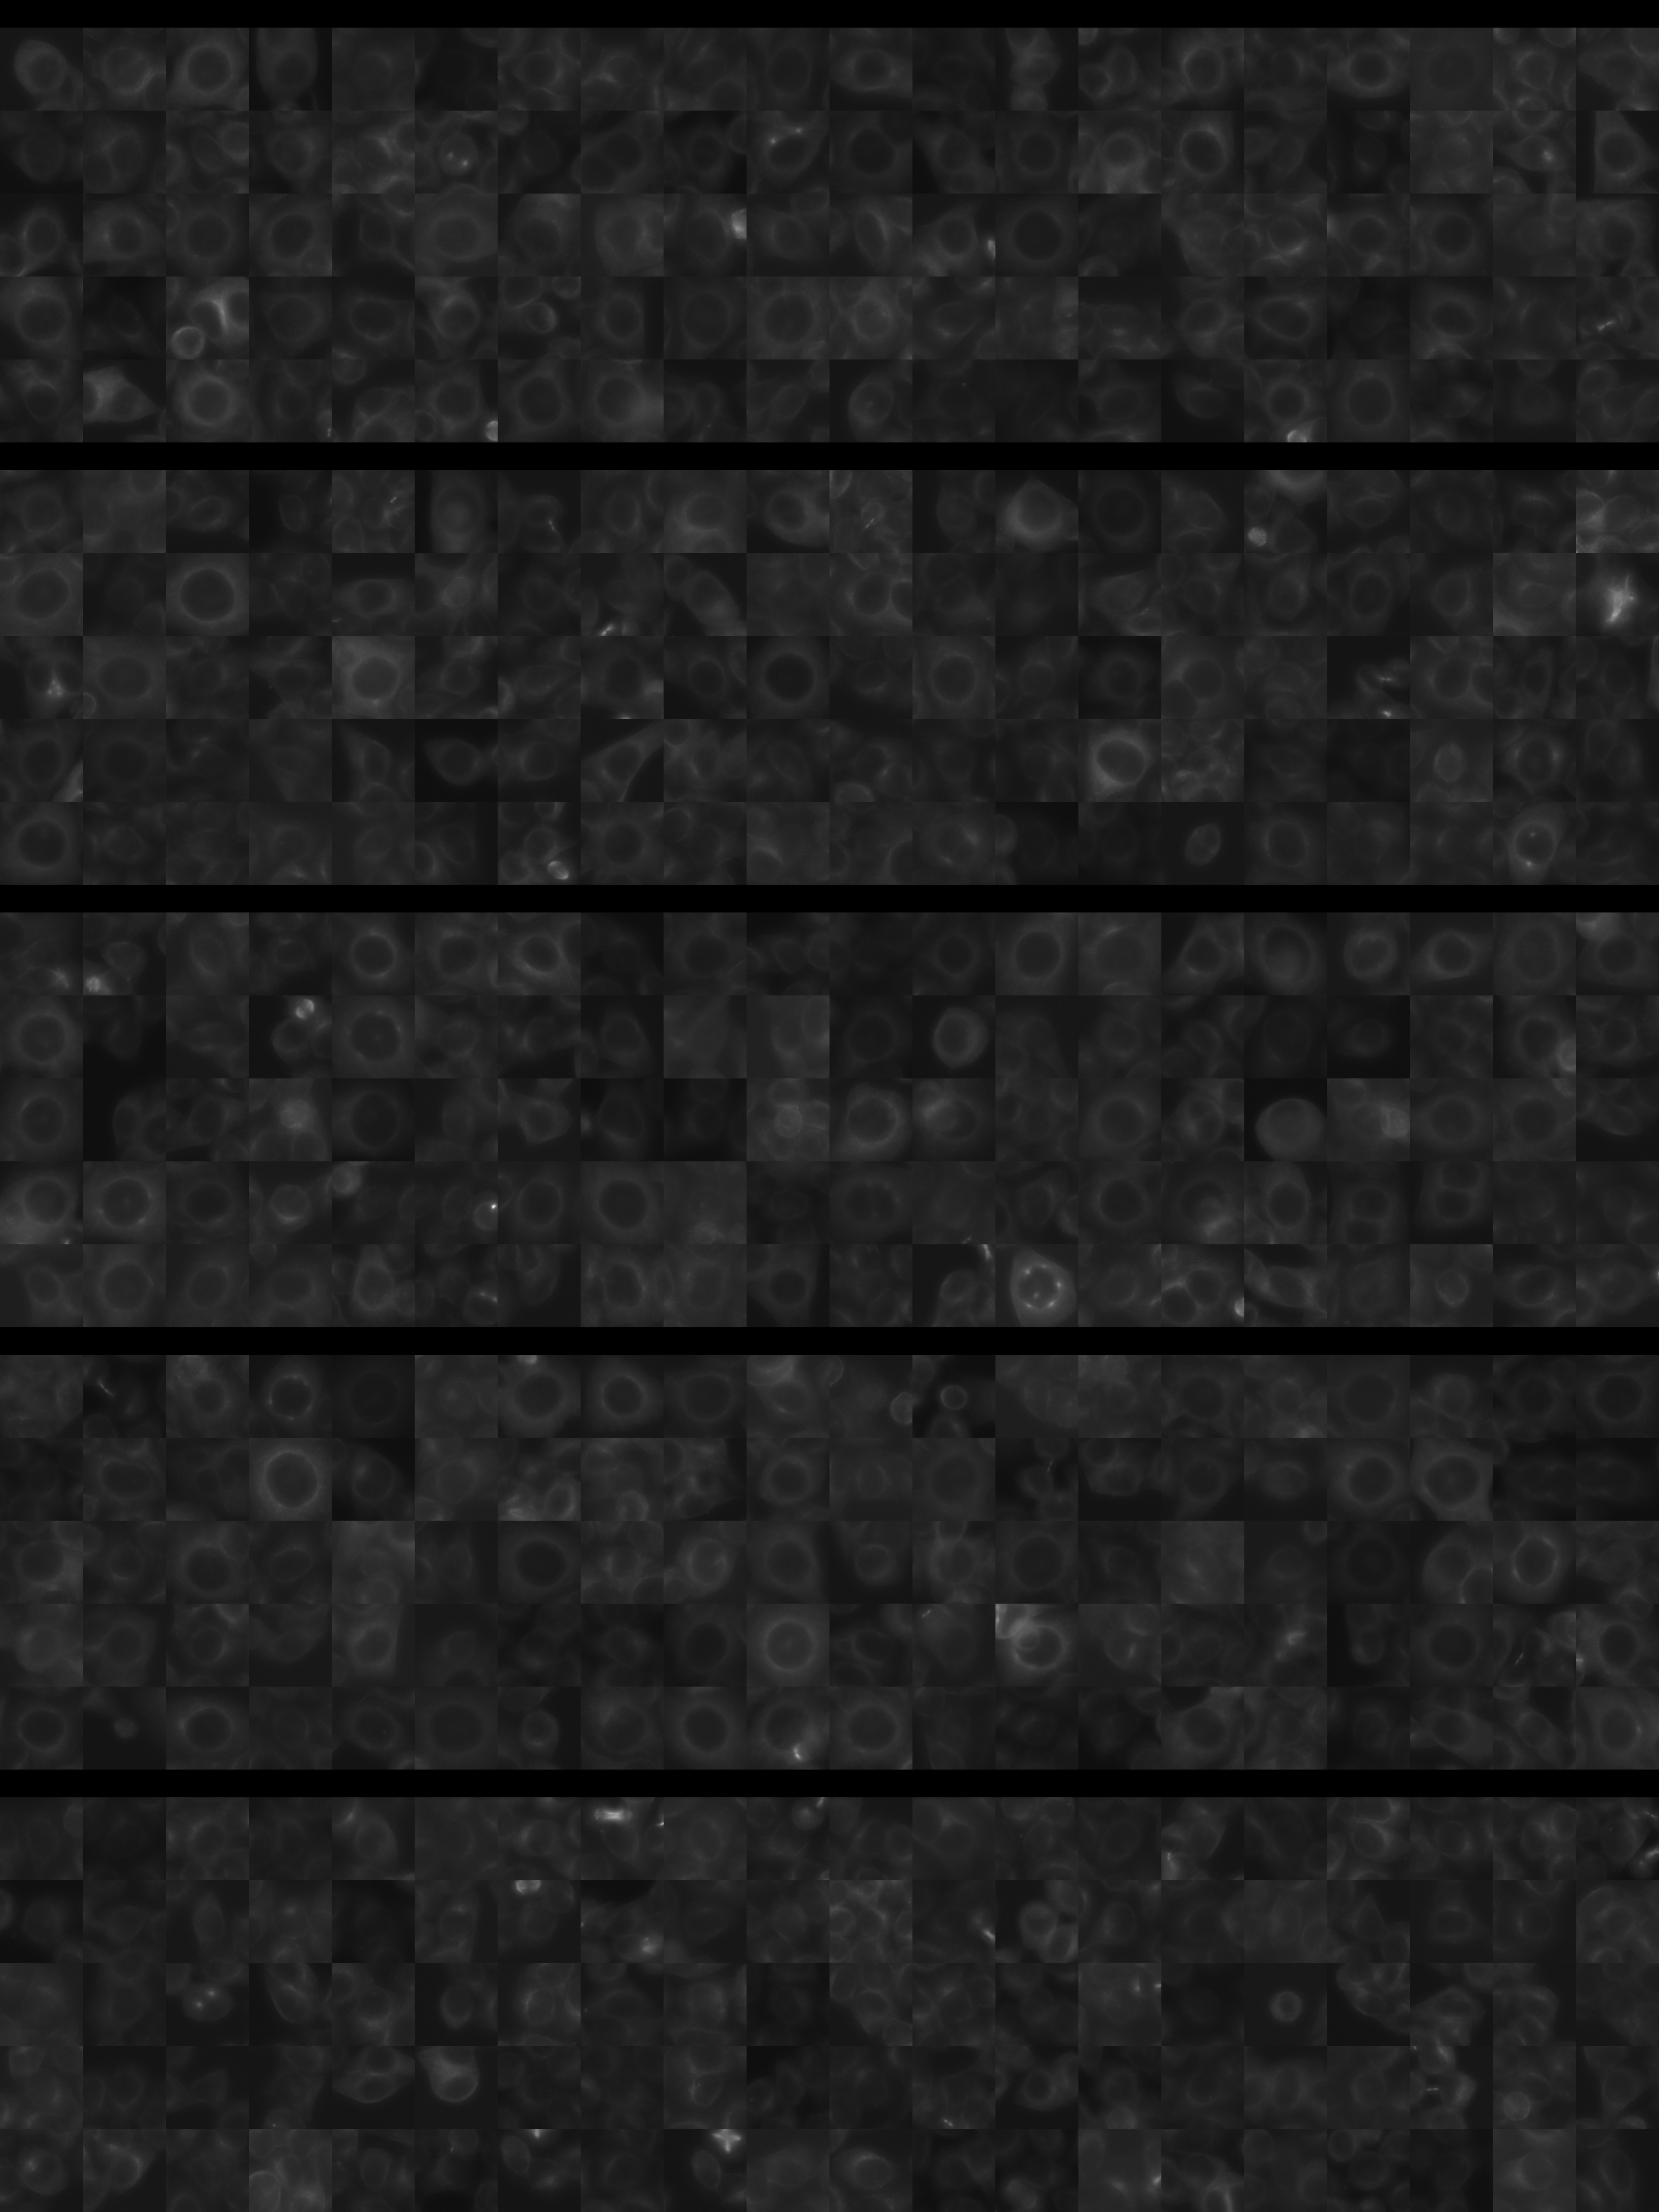
Each montage below shows randomly selected individual cell images for the same target gene separated by sgRNA, along with an example montage of cells expressing a non-targeting negative control sgRNA at the bottom. sgRNA labels in the montages correspond to the numbered sgRNA sequences in the gene info table above. The DNA (blue) and tubulin (green) channels are displayed by default, with gH2AX (grayscale) and actin (yellow) available using the check boxes. Channel brightness, contrast, and opacity are adjustable by clicking the arrow next to the channel name. When only one channel is selected, the display defaults to grayscale. Click the “Zoom” checkbox above the channel controls to enable image zooming (via scrolling) and panning (via click-and-drag).

The cell boxes displayed for this gene are square, 36.43 μm per side for the interphase montage and 30.36 μm per side for the mitotic montage.
Features

Interphase Score Rank FDR q-value
Nucleus DNA Integrated 5.939 1 of 5322 5.407e-04
Nucleus DNA Mean 0.692 66 of 5322 1.505e-04
Nucleus gH2AX Mean 2.234 4 of 5322 1.367e-04
Nucleus DNA - gH2AX Correlation -2.877e-01 5267 of 5322 1.021e-04
Nucleus Shape Area 1.665 2 of 5322 1.633e-04
Nucleus Shape Eccentricity -2.430e-01 5288 of 5322 4.529e-04
Nucleus Shape Form Factor 0.143 6 of 5322 2.872e-04
Nucleus Shape Solidity 0.446 1 of 5322 1.903e-04
Cell DNA Mass Displacement 0.331 8 of 5322 0.001
Cell Tubulin Mean 0.407 53 of 5322 2.141e-04
Cell Tubulin Mass Displacement 0.198 47 of 5322 3.984e-04
Cell Actin Mean 0.218 242 of 5322 1.723e-04
Cell Tubulin - Actin Correlation 0.112 482 of 5322 0.010
Cell DNA - Tubulin Correlation -5.365e-01 5321 of 5322 1.948e-04
Cell Shape Area 1.391 2 of 5322 1.651e-04
Cell Shape Eccentricity 0.050 586 of 5322 0.522
Mitotic Score Rank FDR q-value
Nucleus DNA Integrated 0.126 2112 of 5322 0.965
Nucleus DNA Mean -1.247e-01 4526 of 5322 1.000
Nucleus DNA Mass Displacement 0.441 47 of 5322 0.999
Nucleus DNA Mean Frac 3 0.021 2778 of 5322 1.000
Nucleus gH2AX Mean 0.942 17 of 5322 0.068
Nucleus gH2AX Mean Frac 0 0.096 1008 of 5322 1.000
Nucleus Tubulin Mean Frac 0 0.487 94 of 5322 0.696
Nucleus Tubulin Mean Edge 0.363 157 of 5322 0.898
Nucleus Tubulin Std Edge -1.704e-01 4471 of 5322 0.999
Nucleus Shape Area 0.260 1014 of 5322 0.907
Nucleus Shape Eccentricity -1.435e-01 4073 of 5322 1.000
Nucleus Shape Form Factor -3.531e-01 4987 of 5322 0.971
Cell Tubulin Mean 0.404 180 of 5322 0.848
Cell Tubulin Mean Frac 3 -1.927e-01 3992 of 5322 0.999
Cell Actin Mean 0.360 221 of 5322 0.997
Cell Shape Area 0.889 29 of 5322 0.020
( Reset Zoom )
Brightness
Contrast
Opacity
Brightness
Contrast
Opacity
Brightness
Contrast
Opacity
Brightness
Contrast
Opacity
Brightness
Contrast
Opacity

( Reset Zoom )
Brightness
Contrast
Opacity
Brightness
Contrast
Opacity
Brightness
Contrast
Opacity
Brightness
Contrast
Opacity
Brightness
Contrast
Opacity

Day 3

Day 4

MIT Central Accessability