DNAJC11

Gene symbol: DNAJC11
Gene: 55735
Uniprot Function: Required for mitochondrial inner membrane organization. Seems to function through its association with the MICOS complex and the mitochondrial outer membrane sorting assembly machinery (SAM) complex.
Mitotic Index 0.0219
Interphase Cluster: #89 (25 genes)
Mitotic Cluster: #25 (36 genes)
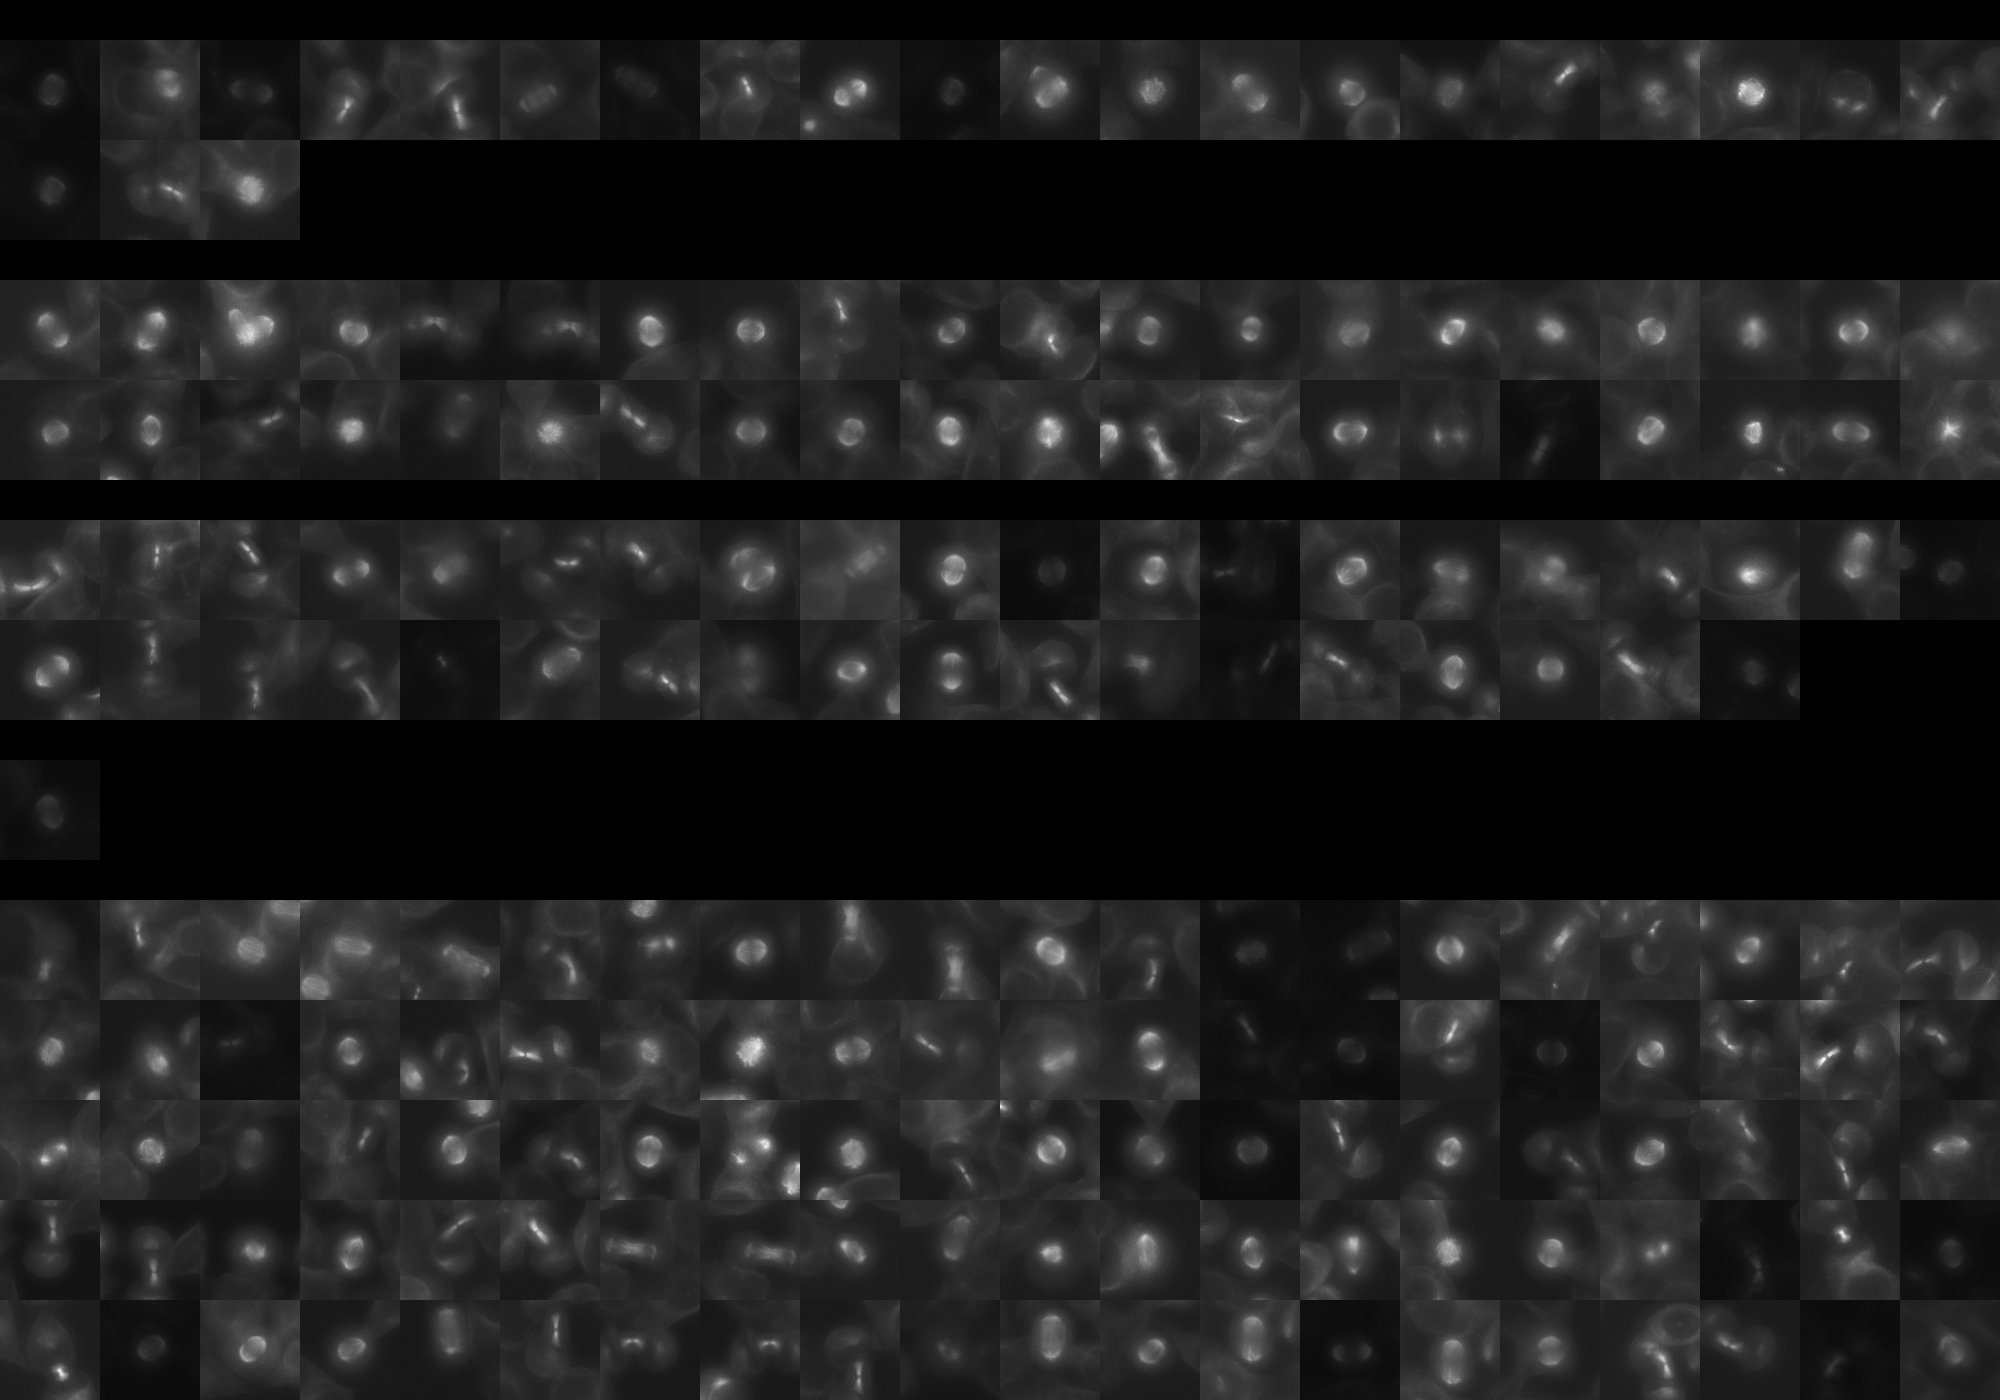
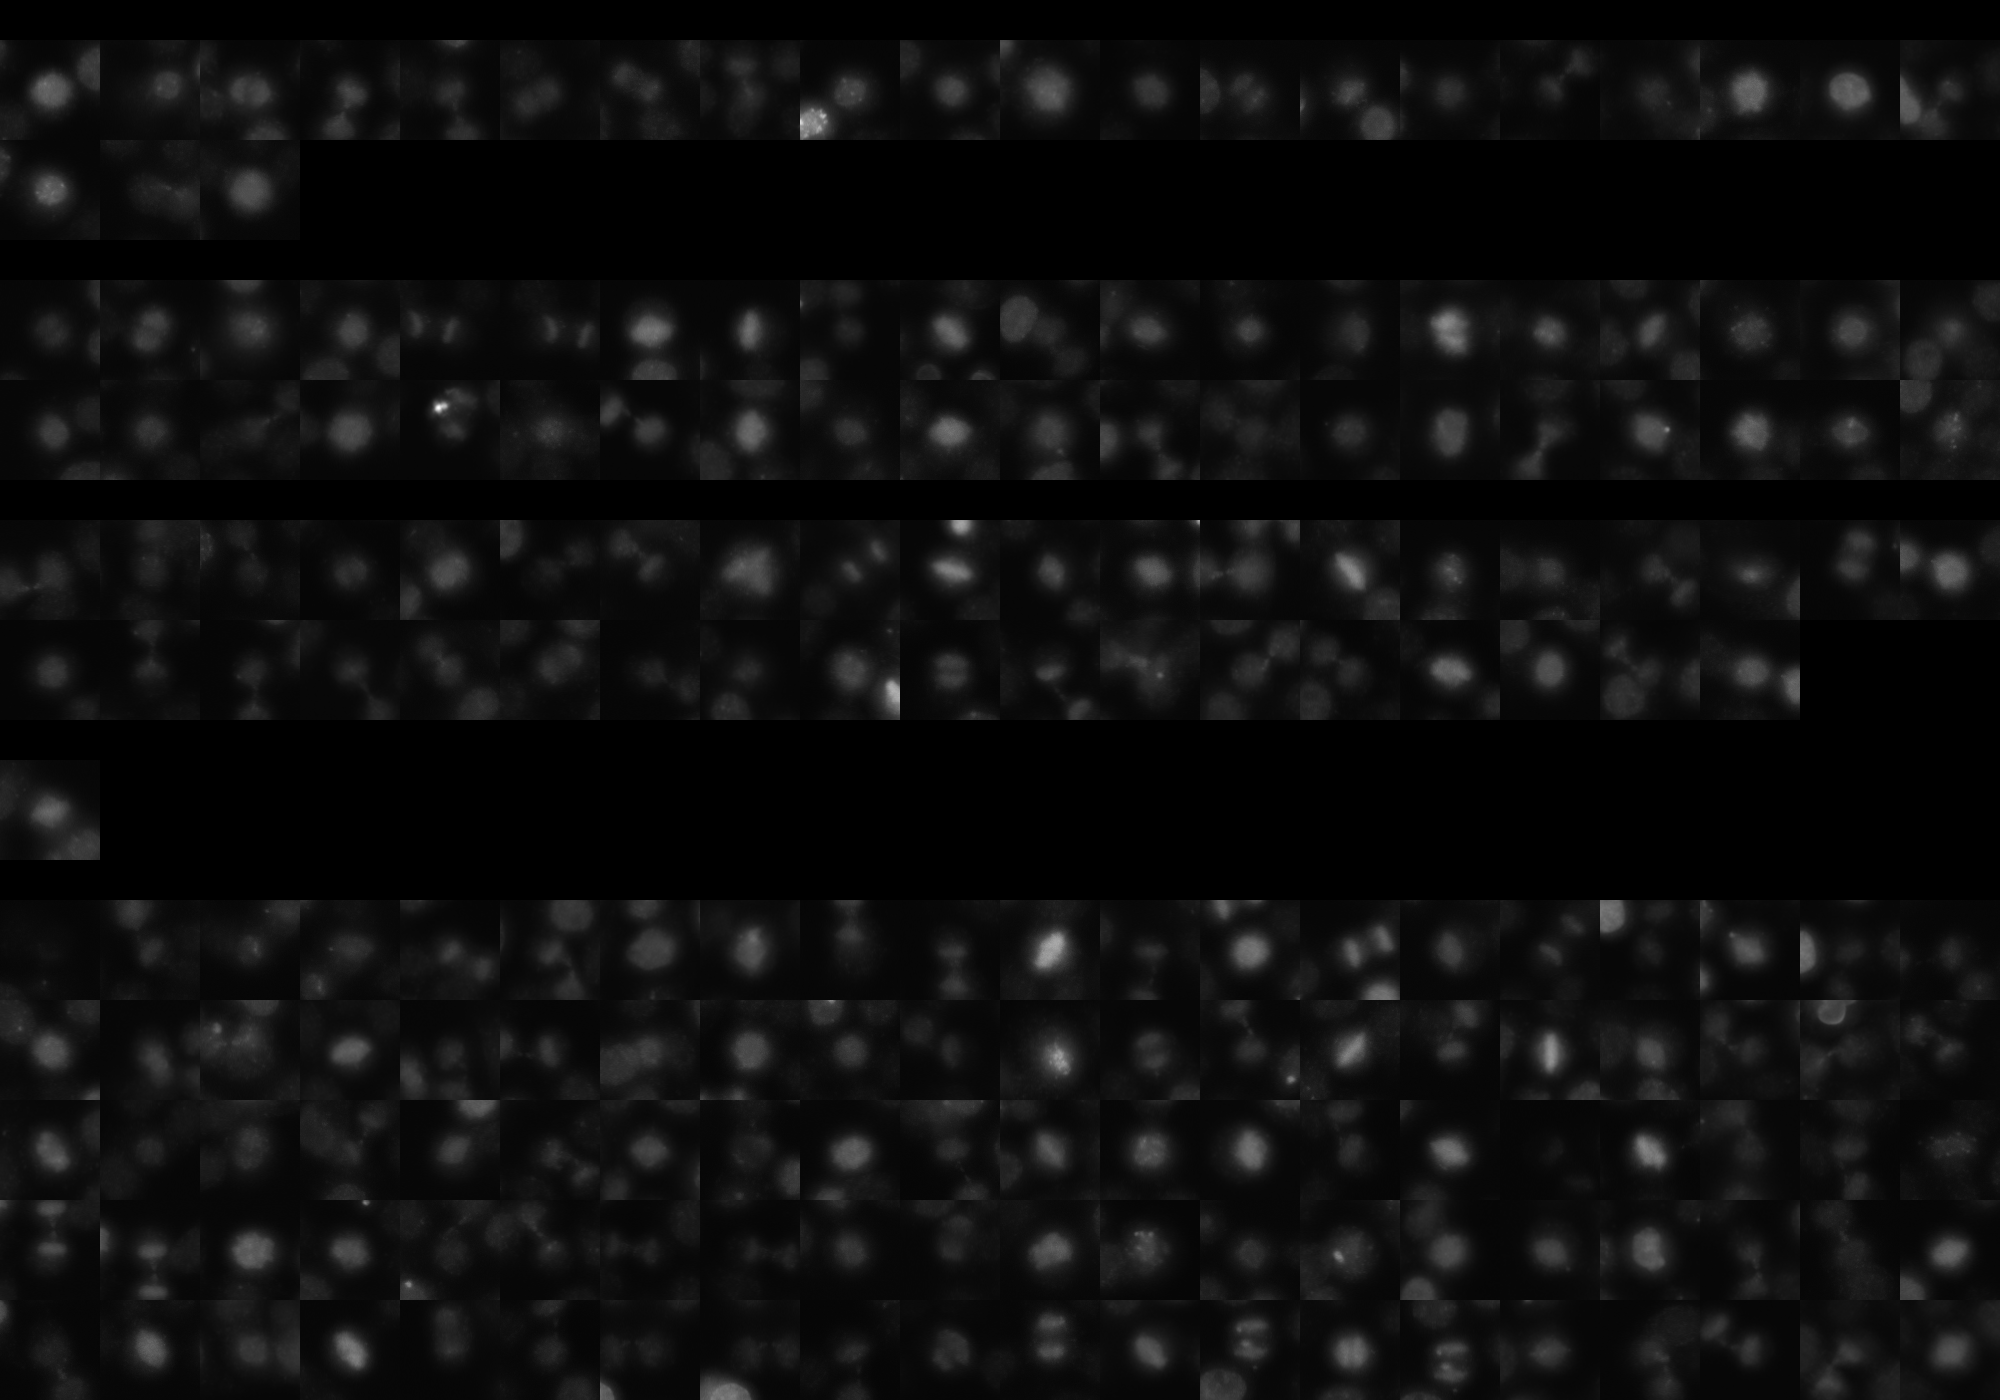
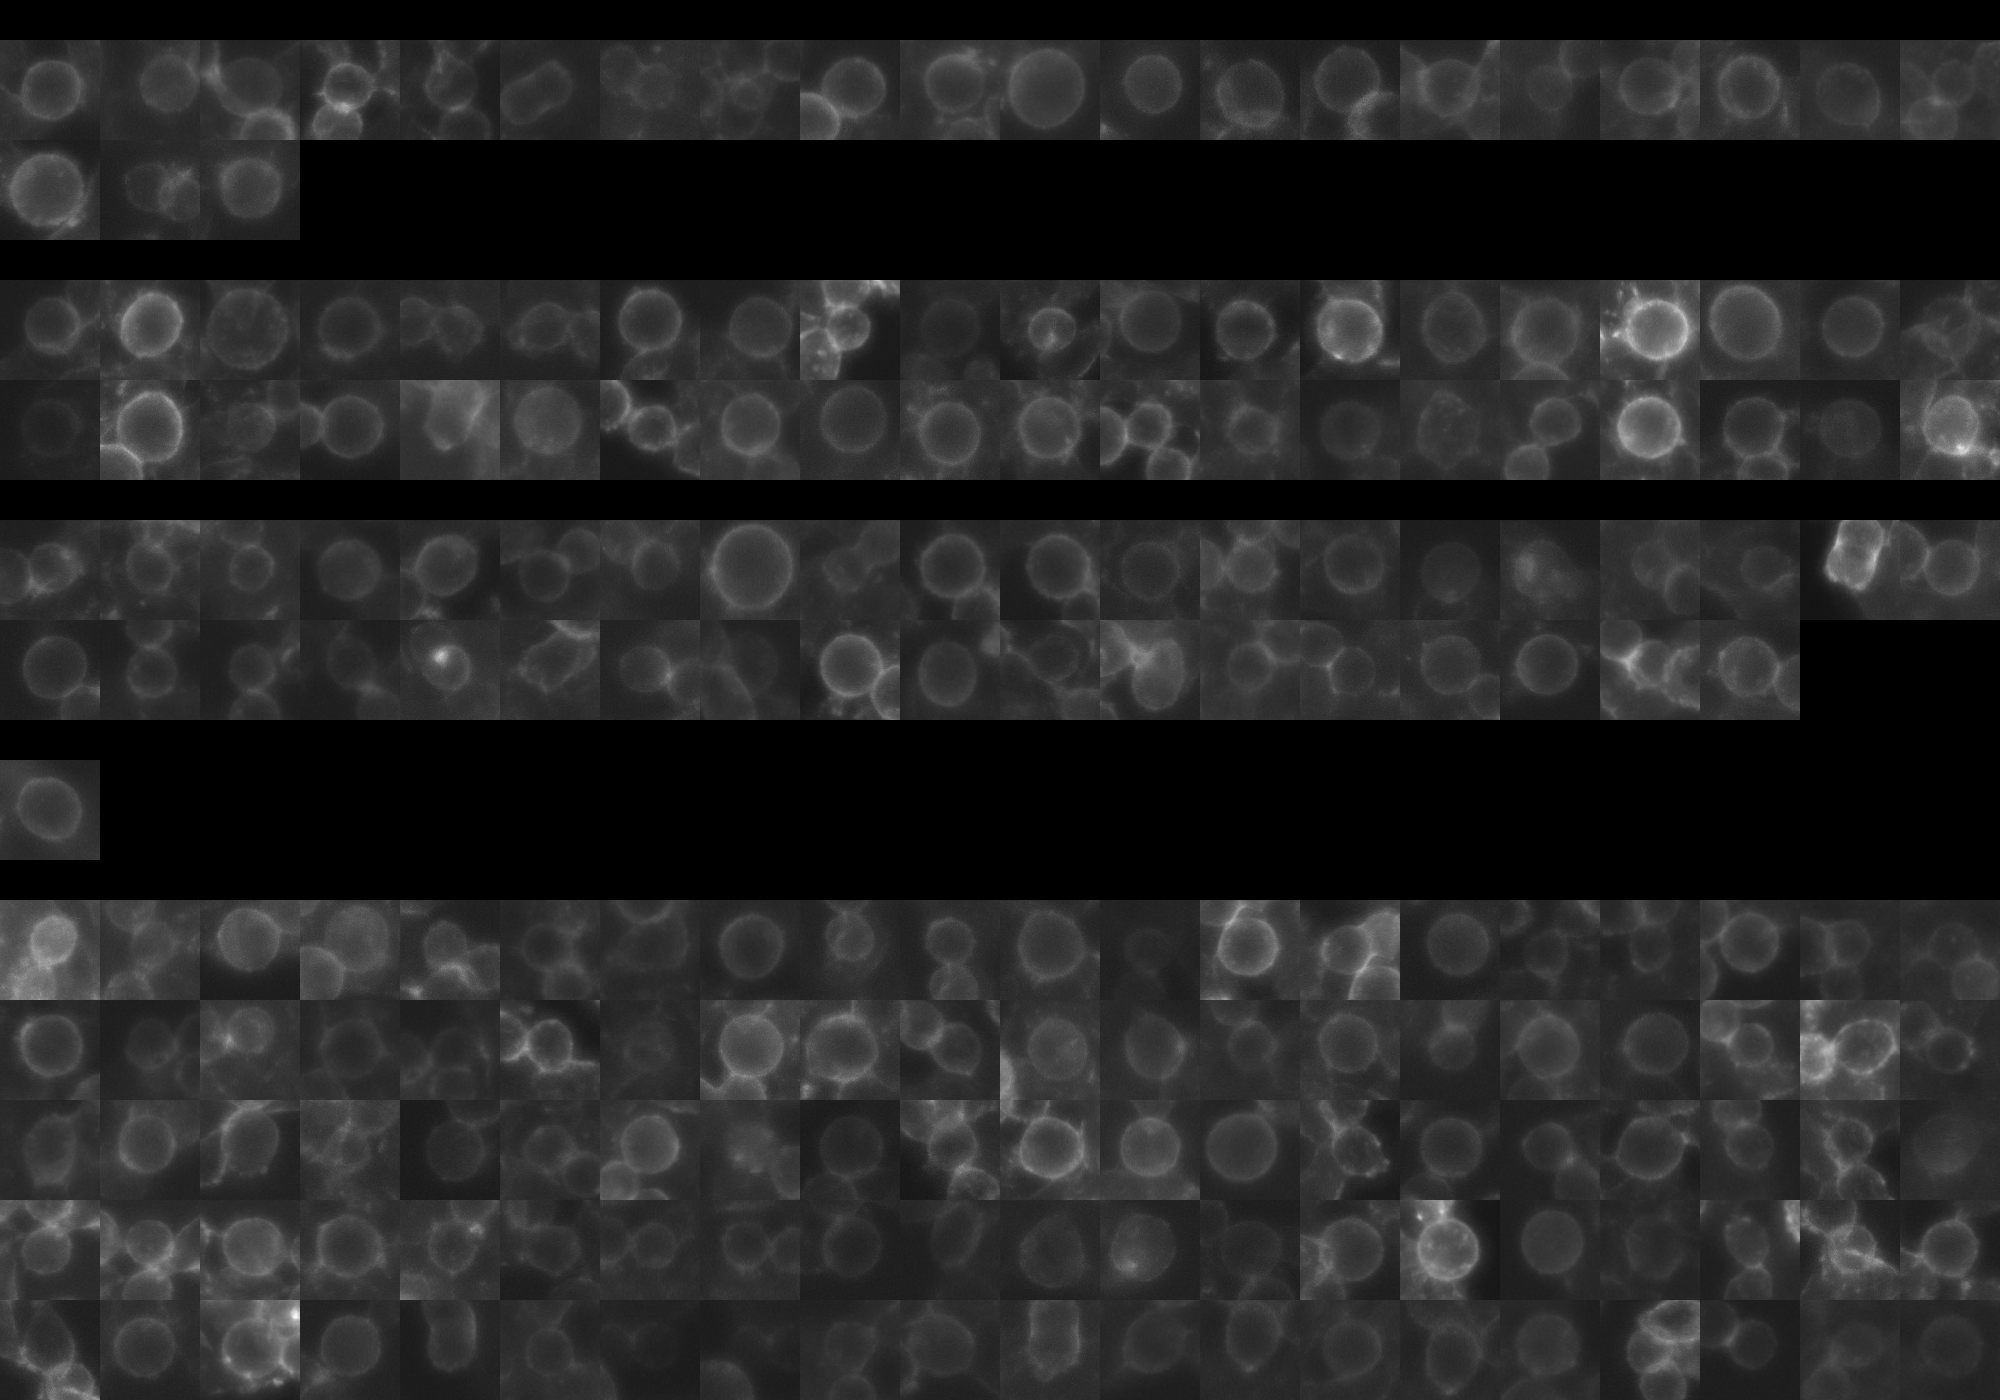
sgRNA 1: AAAGGTTGCGAAGATGGCGA (interphase cells: 1020, mitotic cells: 23)
sgRNA 2: AACAGCTTGAGACCGAACAA (interphase cells: 1878, mitotic cells: 40)
sgRNA 3: AGCTGAAAGCTGCCTACCGG (interphase cells: 1523, mitotic cells: 38)
sgRNA 4: GAACCTAGACAAGAACACCG (interphase cells: 138, mitotic cells: 1)

Interphase Cluster

Mitotic Cluster

Overview

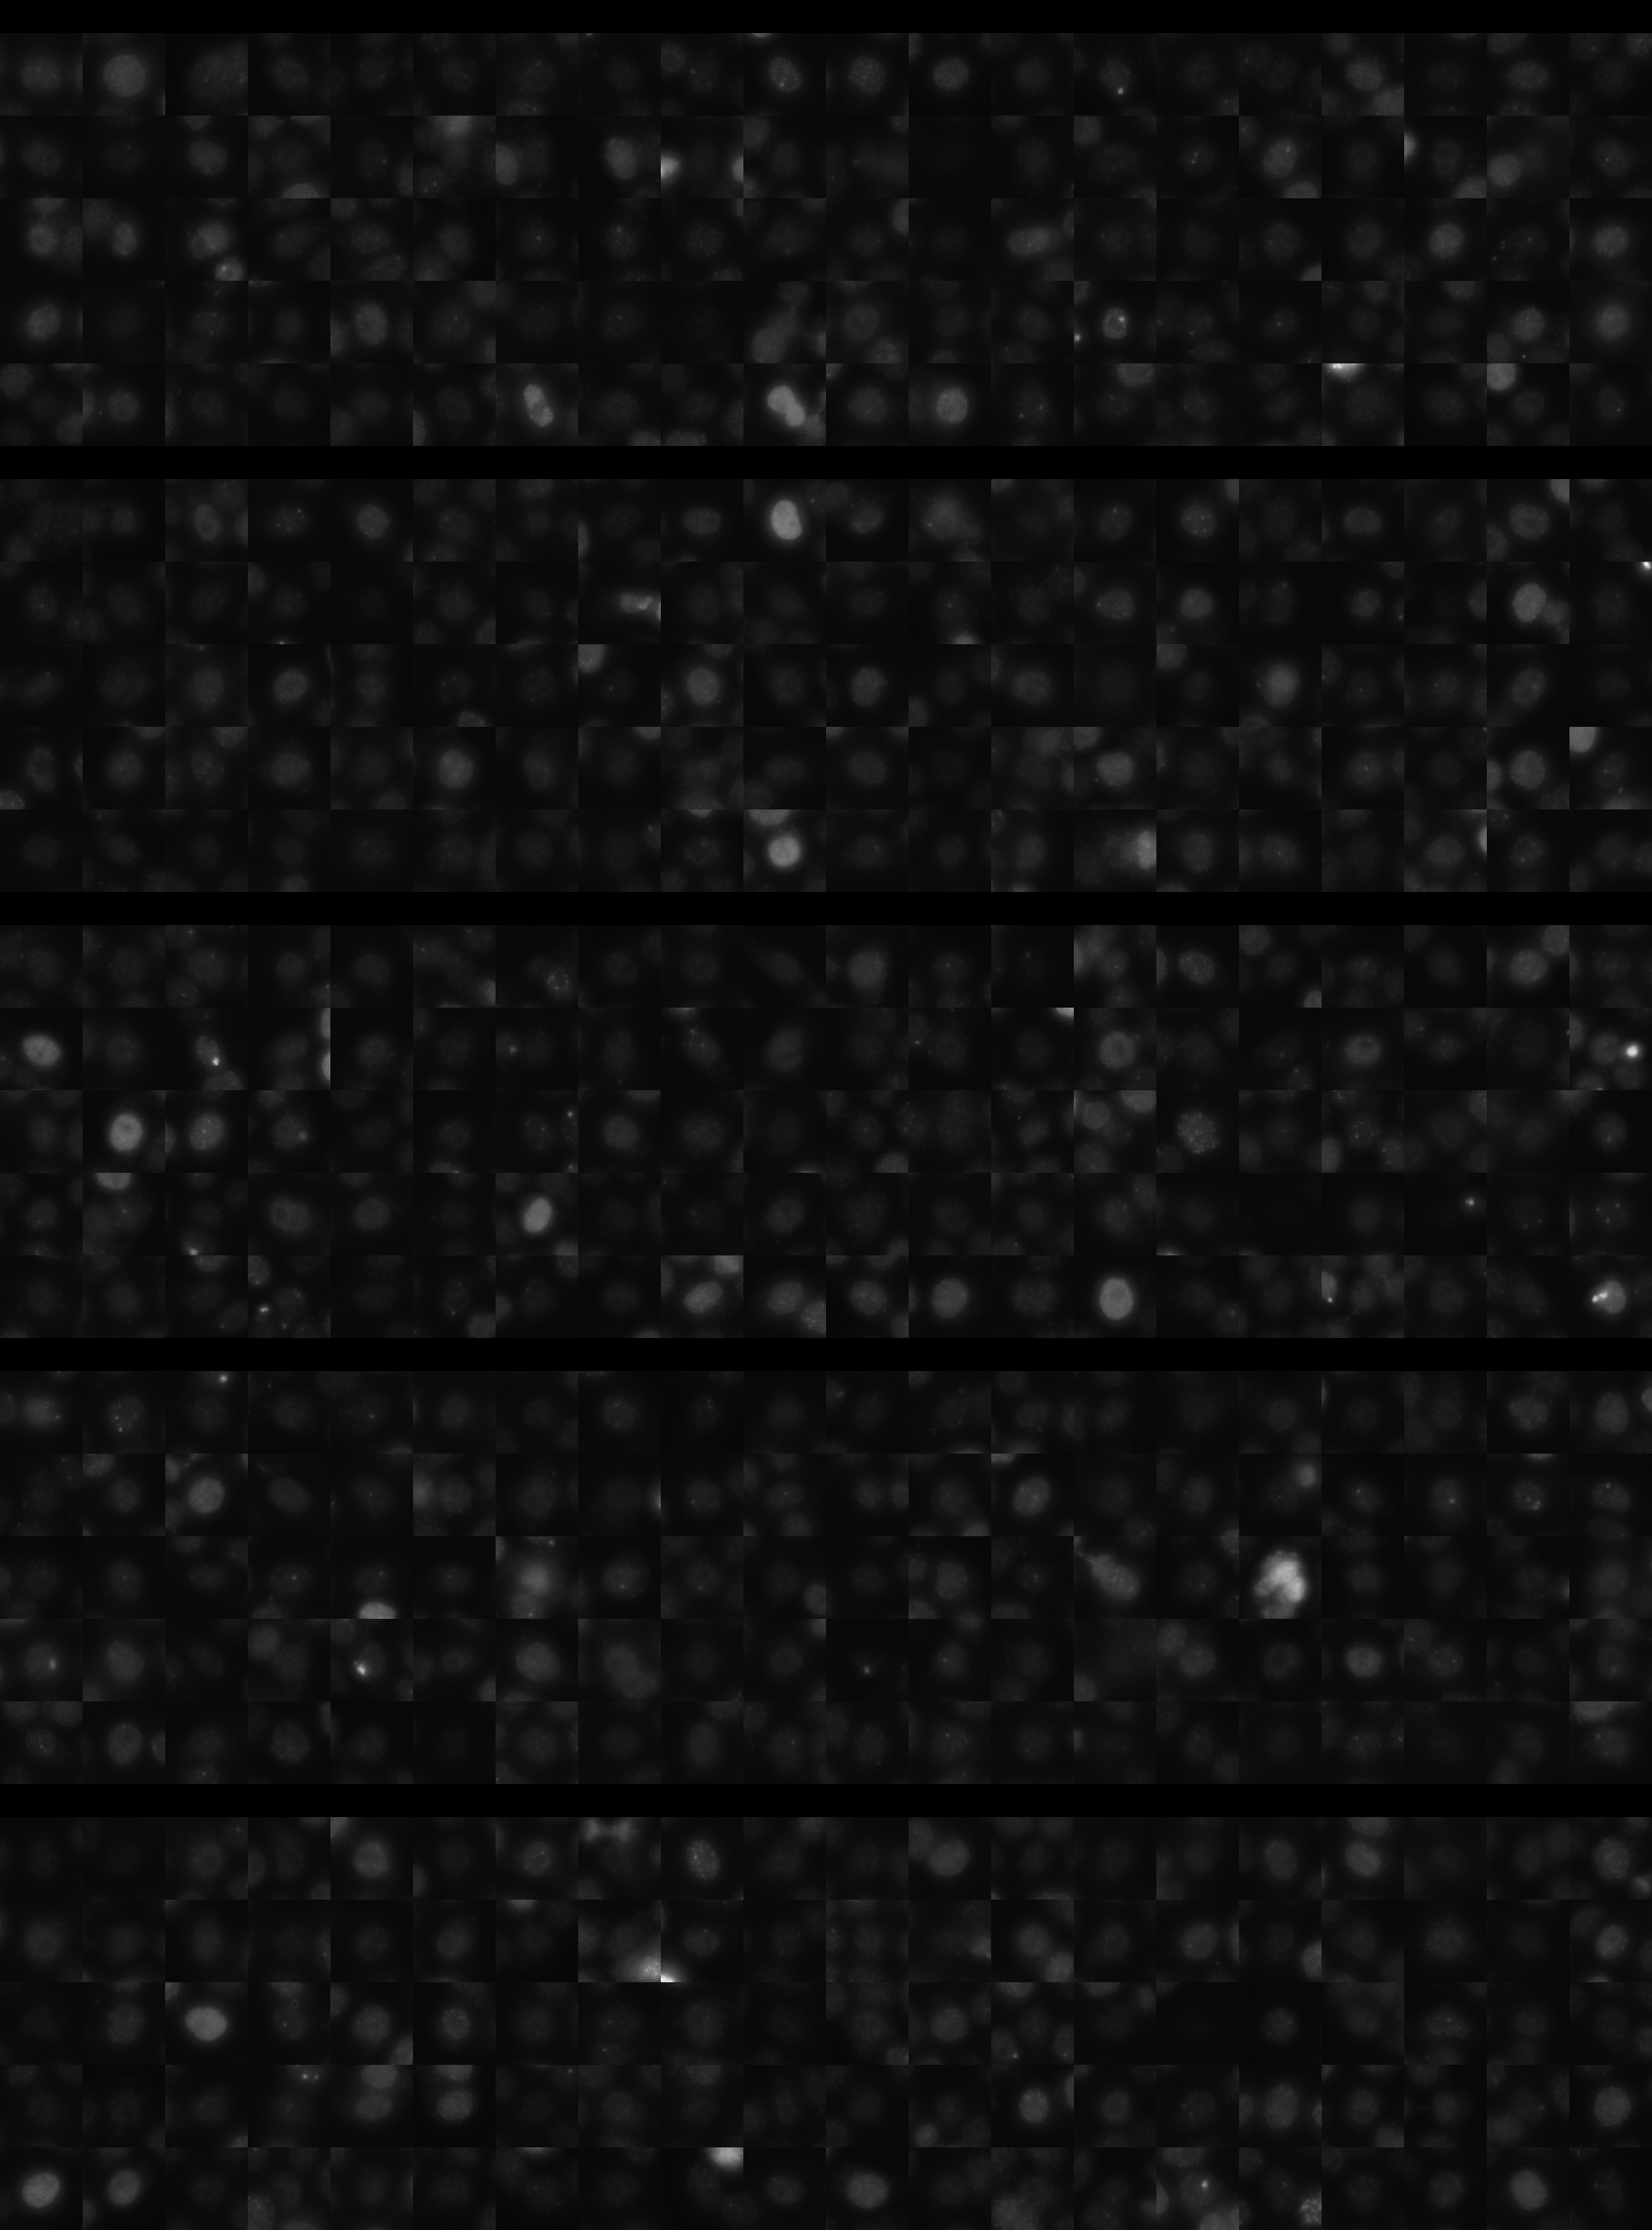
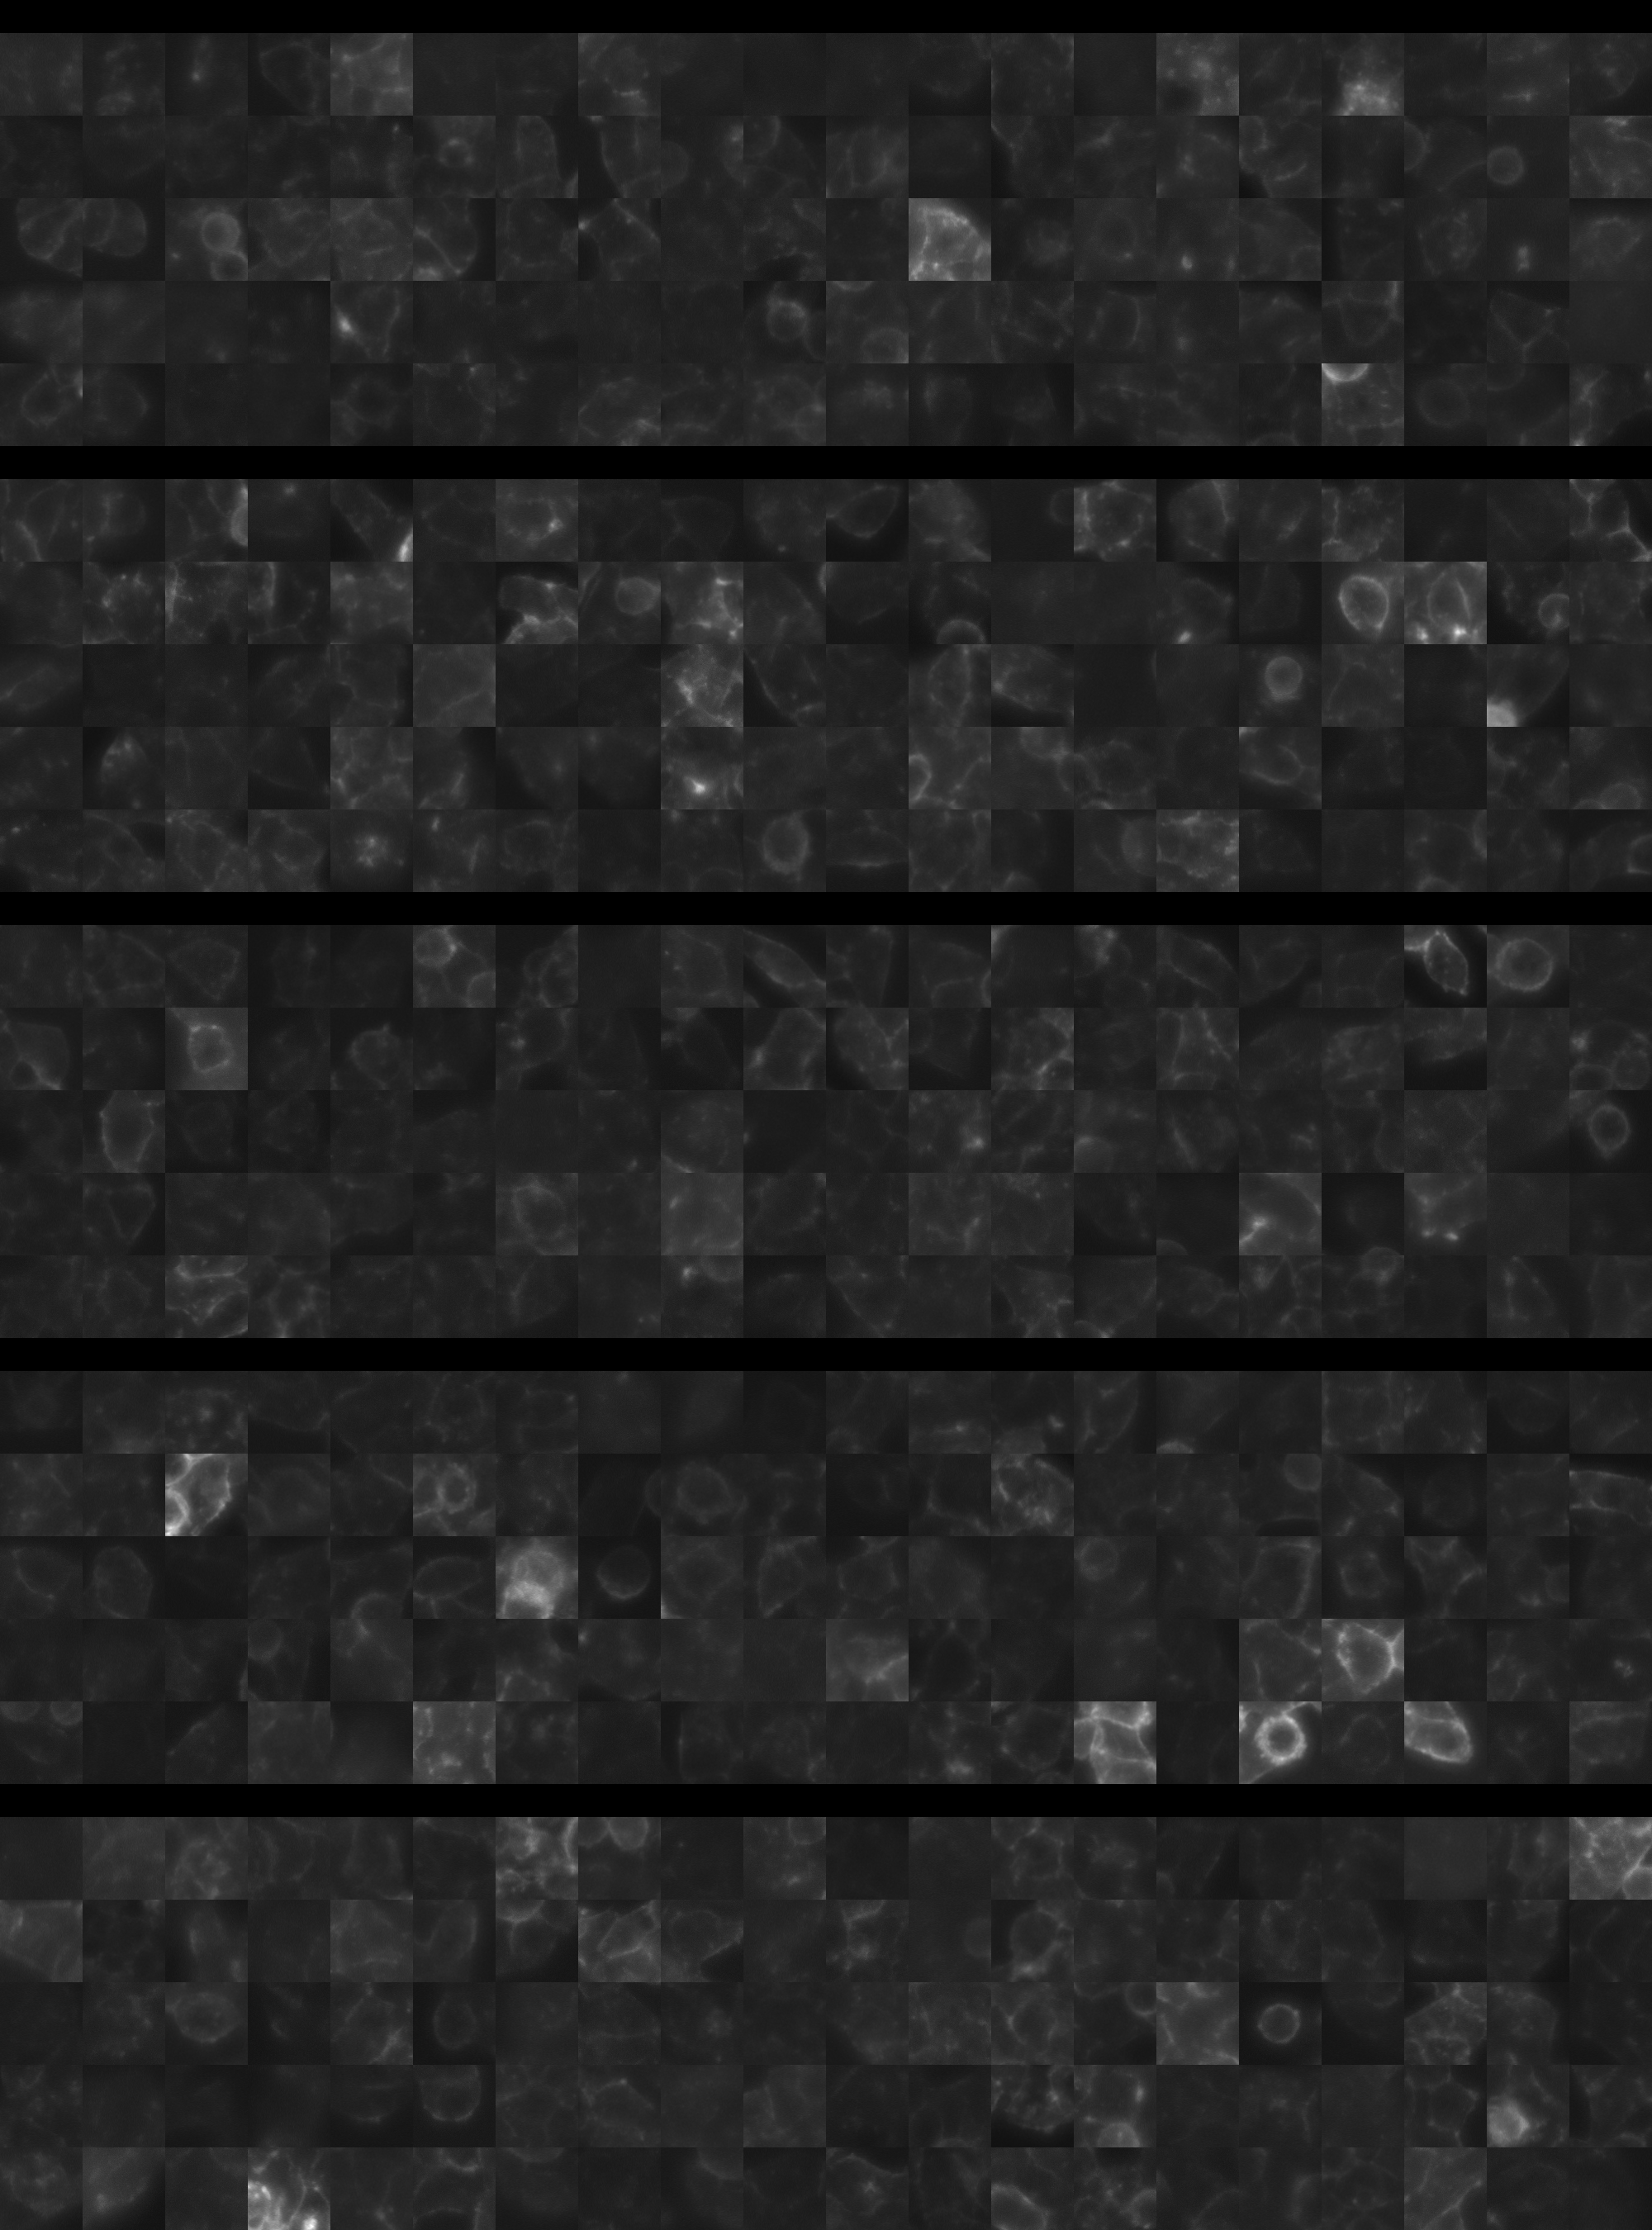
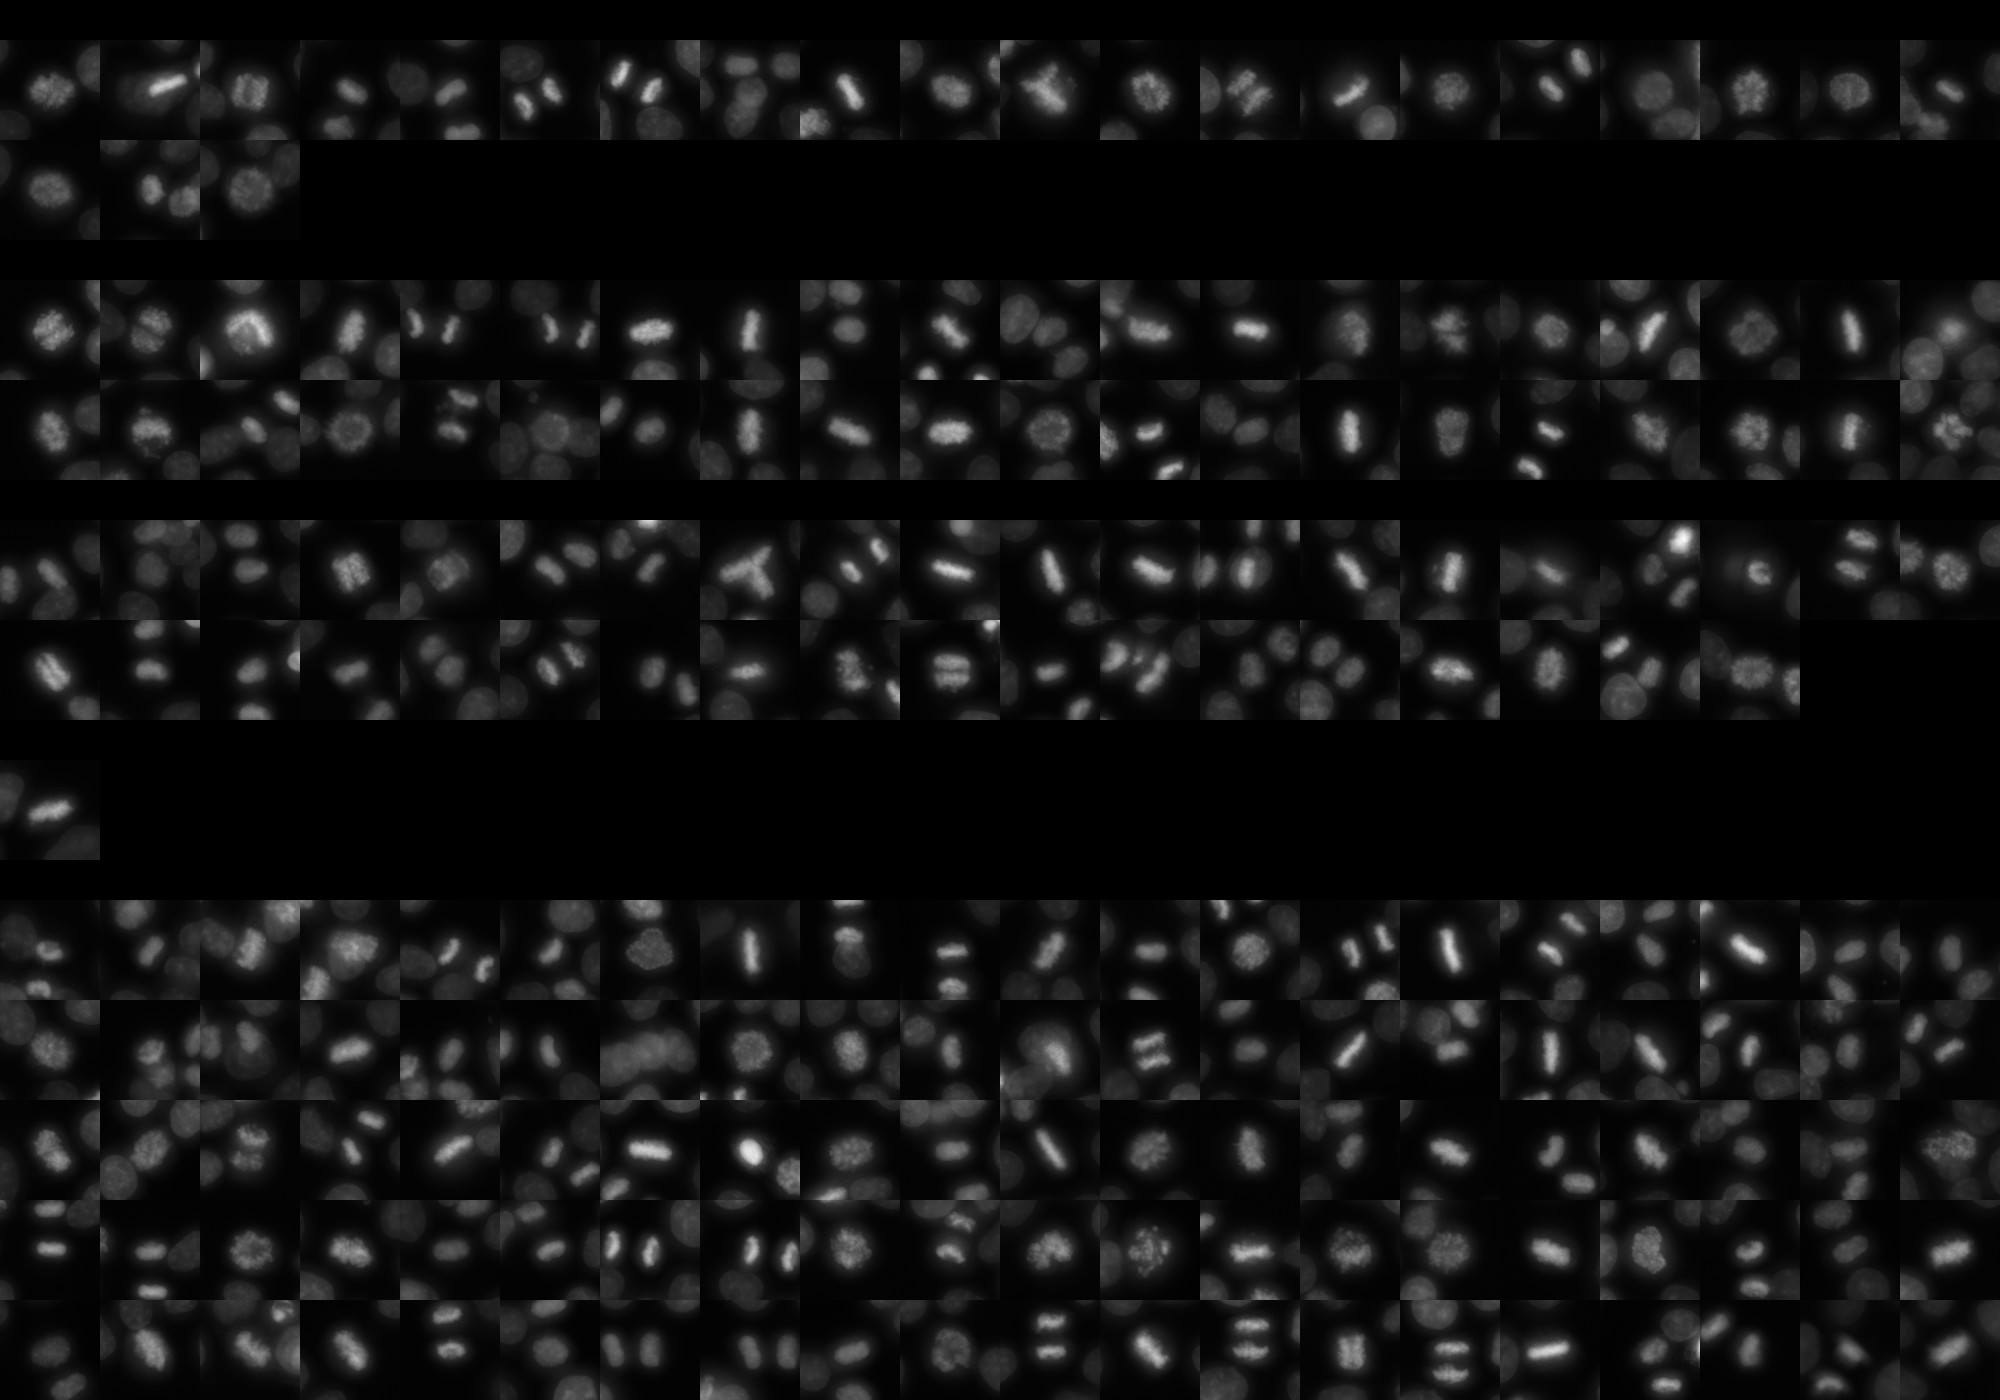
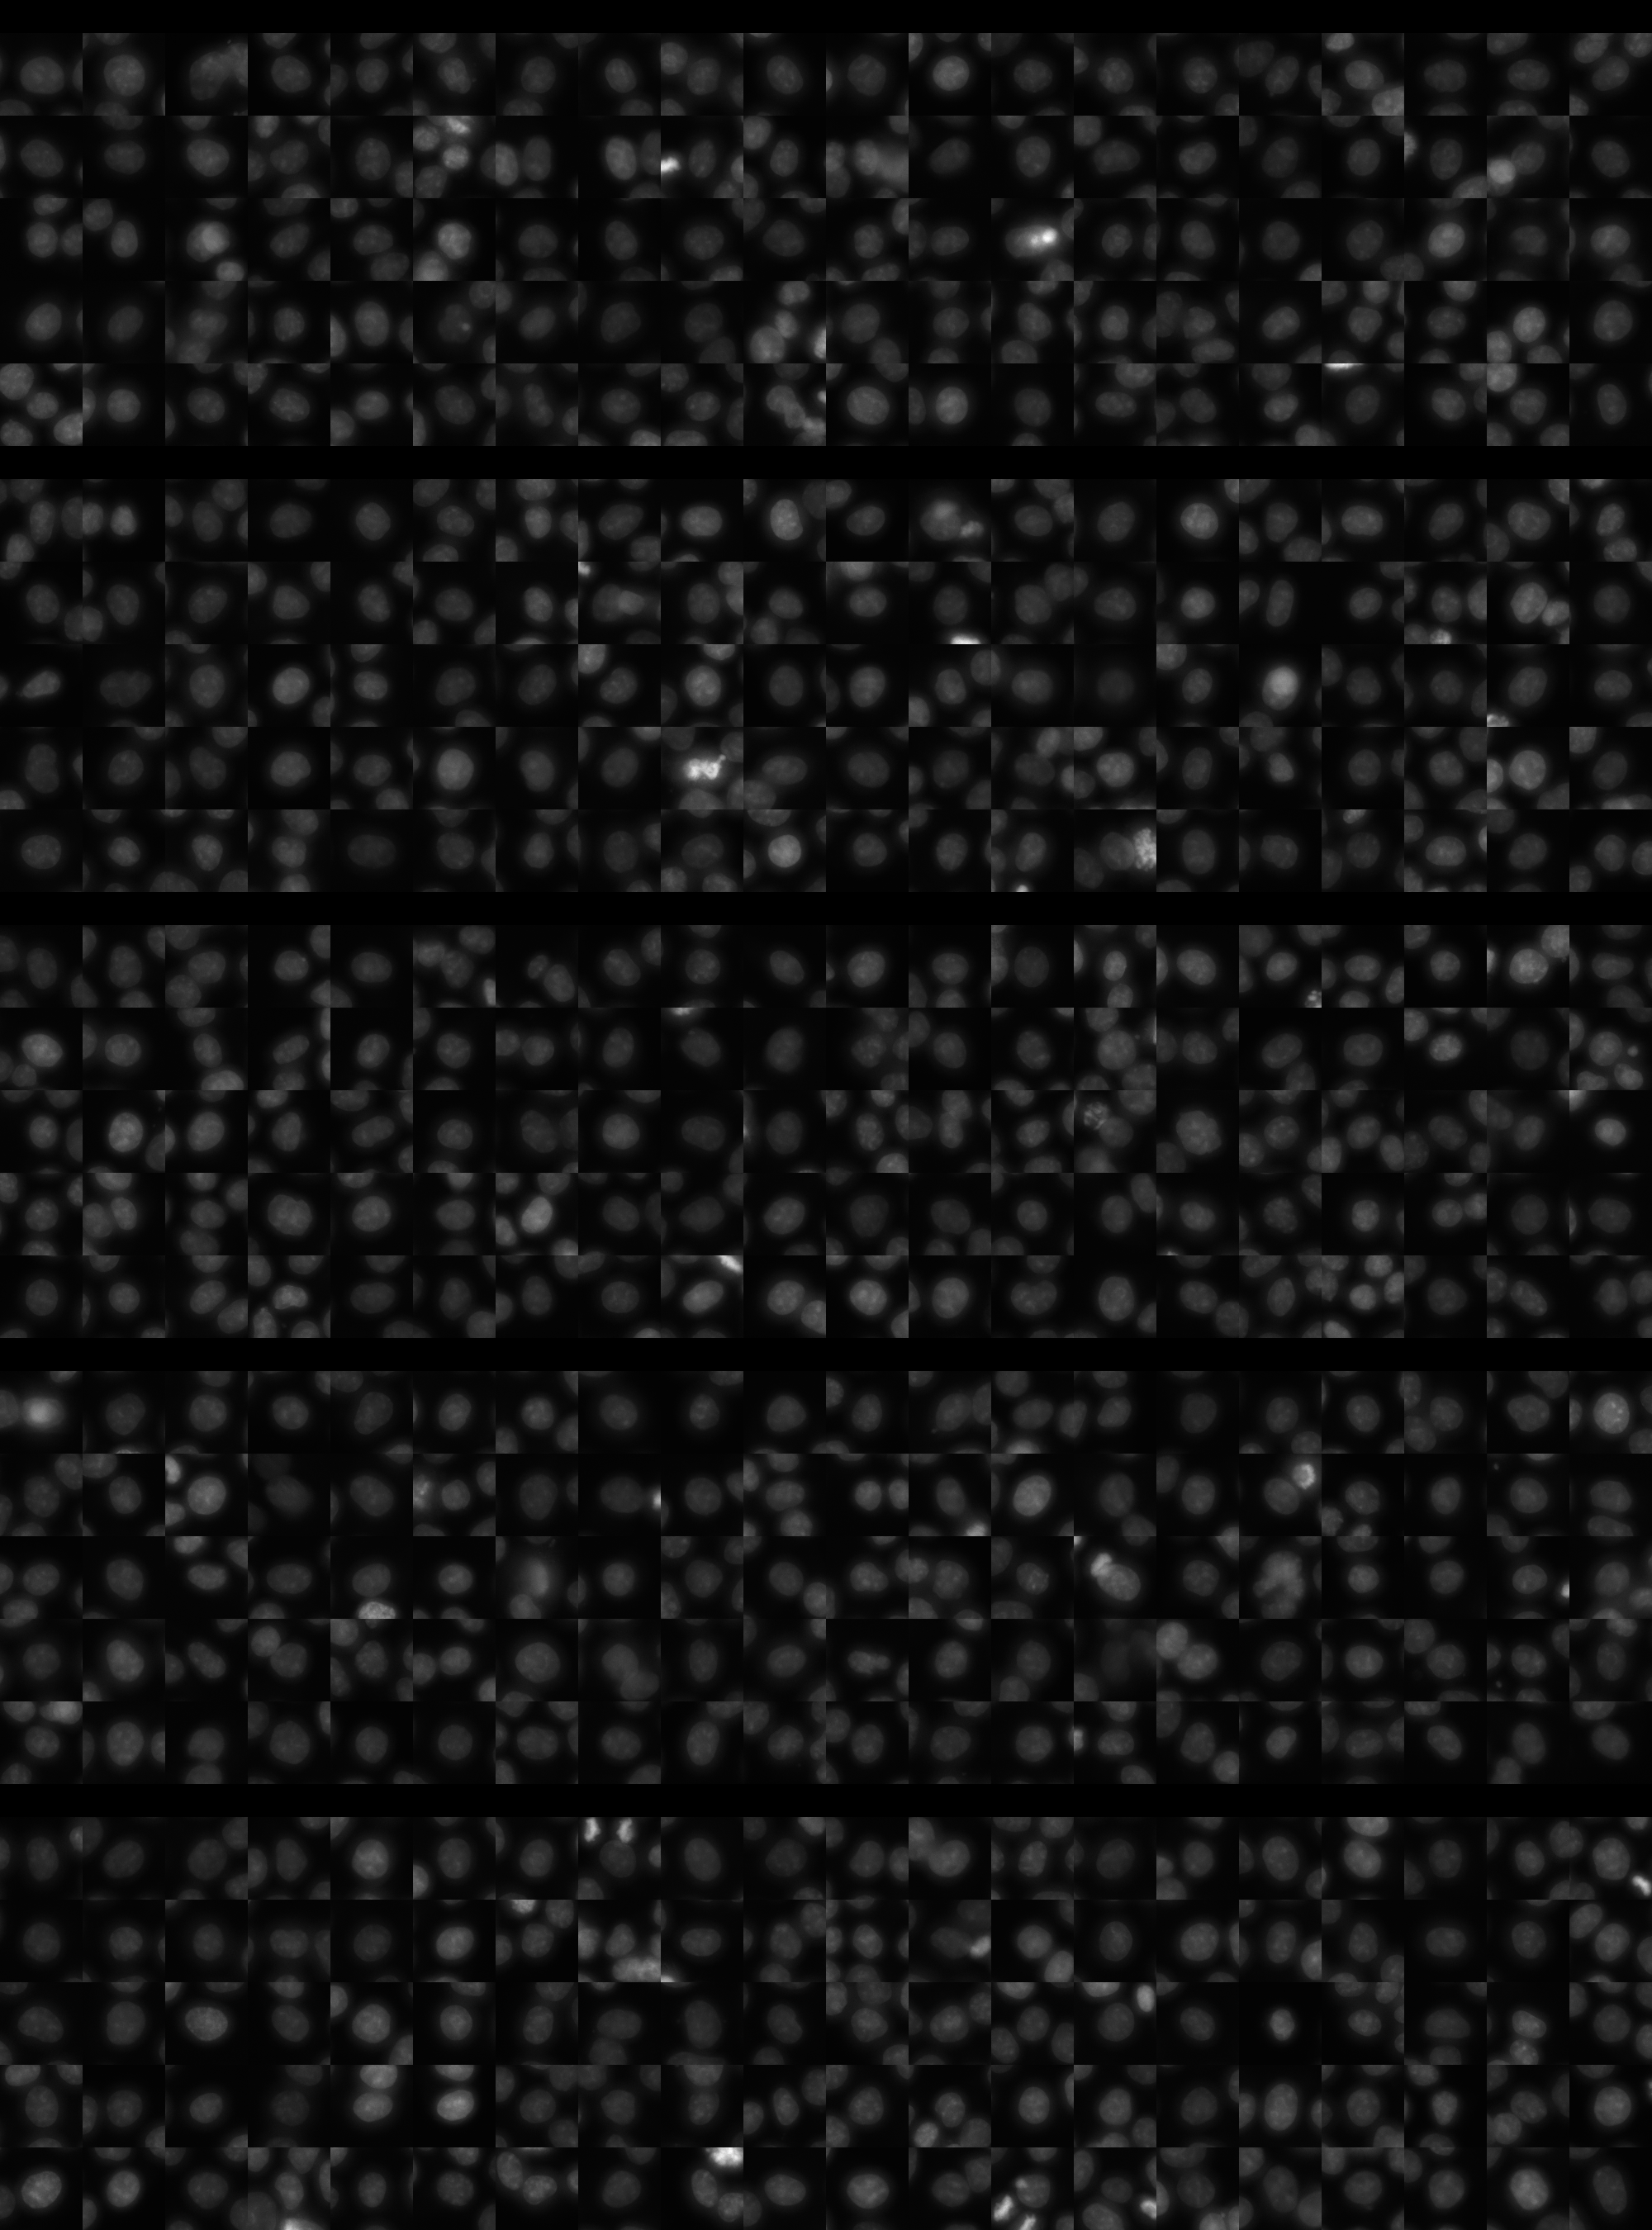
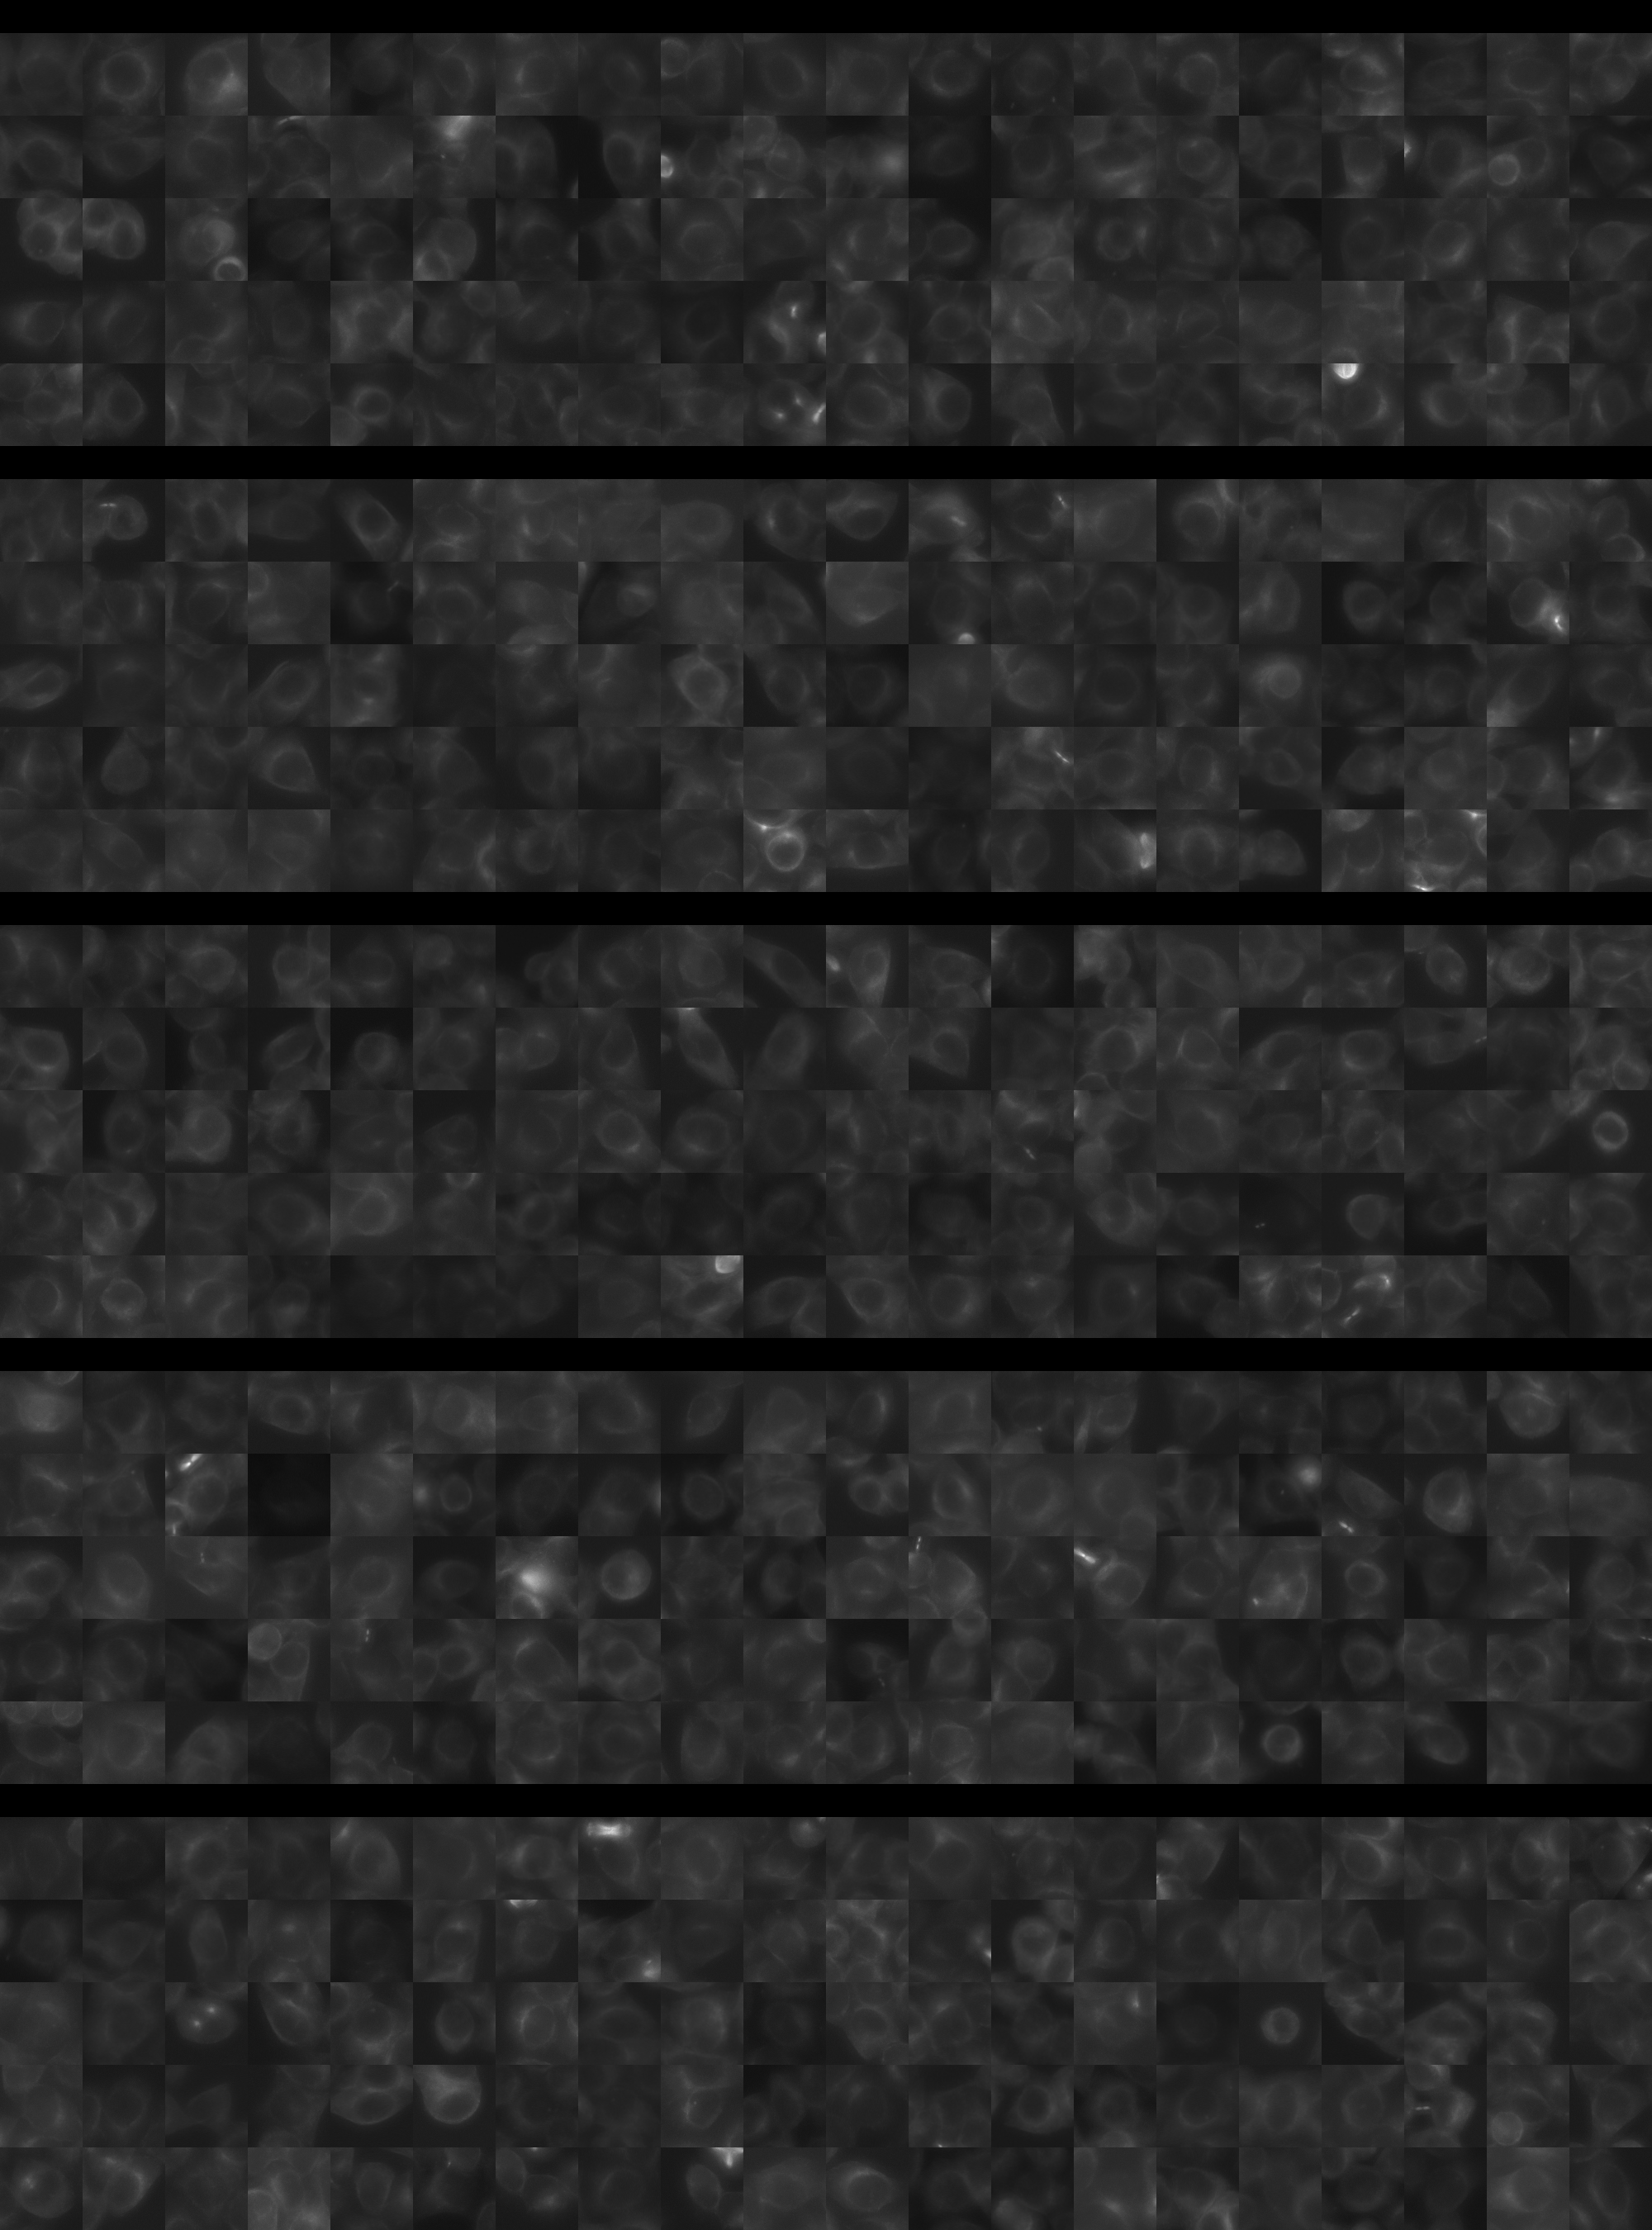
Each montage below shows randomly selected individual cell images for the same target gene separated by sgRNA, along with an example montage of cells expressing a non-targeting negative control sgRNA at the bottom. sgRNA labels in the montages correspond to the numbered sgRNA sequences in the gene info table above. The DNA (blue) and tubulin (green) channels are displayed by default, with gH2AX (grayscale) and actin (yellow) available using the check boxes. Channel brightness, contrast, and opacity are adjustable by clicking the arrow next to the channel name. When only one channel is selected, the display defaults to grayscale. Click the “Zoom” checkbox above the channel controls to enable image zooming (via scrolling) and panning (via click-and-drag).

The cell boxes displayed for this gene are square, 30.36 μm per side for the interphase montage and 30.36 μm per side for the mitotic montage.
Features

Interphase Score Rank FDR q-value
Nucleus DNA Integrated -1.909e-02 3995 of 5322 0.799
Nucleus DNA Mean -4.347e-02 3398 of 5322 0.429
Nucleus gH2AX Mean 0.077 2590 of 5322 0.095
Nucleus DNA - gH2AX Correlation -2.906e-02 1682 of 5322 0.394
Nucleus Shape Area 0.022 2532 of 5322 0.845
Nucleus Shape Eccentricity 0.045 1116 of 5322 0.369
Nucleus Shape Form Factor -5.897e-02 3104 of 5322 0.211
Nucleus Shape Solidity -5.771e-02 3057 of 5322 0.160
Cell DNA Mass Displacement 0.047 1301 of 5322 0.508
Cell Tubulin Mean -7.290e-02 4688 of 5322 0.175
Cell Tubulin Mass Displacement 0.042 801 of 5322 0.491
Cell Actin Mean -3.502e-02 4032 of 5322 0.607
Cell Tubulin - Actin Correlation -7.629e-02 5187 of 5322 0.099
Cell DNA - Tubulin Correlation -1.089e-02 4200 of 5322 0.840
Cell Shape Area 0.019 2542 of 5322 0.921
Cell Shape Eccentricity 0.015 2508 of 5322 0.903
Mitotic Score Rank FDR q-value
Nucleus DNA Integrated 0.265 738 of 5322 0.847
Nucleus DNA Mean -4.059e-02 3587 of 5322 1.000
Nucleus DNA Mass Displacement -2.187e-02 3850 of 5322 0.999
Nucleus DNA Mean Frac 3 0.147 1023 of 5322 1.000
Nucleus gH2AX Mean -1.289e-01 4481 of 5322 1.000
Nucleus gH2AX Mean Frac 0 0.066 1334 of 5322 1.000
Nucleus Tubulin Mean Frac 0 0.375 174 of 5322 0.999
Nucleus Tubulin Mean Edge 0.077 2162 of 5322 0.999
Nucleus Tubulin Std Edge -1.034e-01 3927 of 5322 0.999
Nucleus Shape Area 0.404 445 of 5322 0.565
Nucleus Shape Eccentricity -5.219e-01 5220 of 5322 0.914
Nucleus Shape Form Factor 0.093 451 of 5322 0.998
Cell Tubulin Mean 0.138 1576 of 5322 0.997
Cell Tubulin Mean Frac 3 -4.452e-01 5119 of 5322 0.689
Cell Actin Mean -6.812e-02 4067 of 5322 0.997
Cell Shape Area 0.436 289 of 5322 0.807
( Reset Zoom )
Brightness
Contrast
Opacity
Brightness
Contrast
Opacity
Brightness
Contrast
Opacity
Brightness
Contrast
Opacity
Brightness
Contrast
Opacity

( Reset Zoom )
Brightness
Contrast
Opacity
Brightness
Contrast
Opacity
Brightness
Contrast
Opacity
Brightness
Contrast
Opacity
Brightness
Contrast
Opacity

MIT Central Accessability