DEK

Gene symbol: DEK
Gene: 7913
Uniprot Function: Involved in chromatin organization.
Mitotic Index 0.0222
Interphase Cluster: #89 (25 genes)
Mitotic Cluster: #66 (27 genes)
sgRNA 1: CAAAGCCTTCTGGCAAAGTG (interphase cells: 1579, mitotic cells: 53)
sgRNA 2: CGAAATGCCCGGTCCCAGAG (interphase cells: 1294, mitotic cells: 26)
sgRNA 3: TCCCAGAGAGGAGAGCGAGG (interphase cells: 721, mitotic cells: 6)
sgRNA 4: TCTAGAAAAGAGTCTCATCG (interphase cells: 1820, mitotic cells: 38)

Interphase Cluster

Mitotic Cluster

Overview

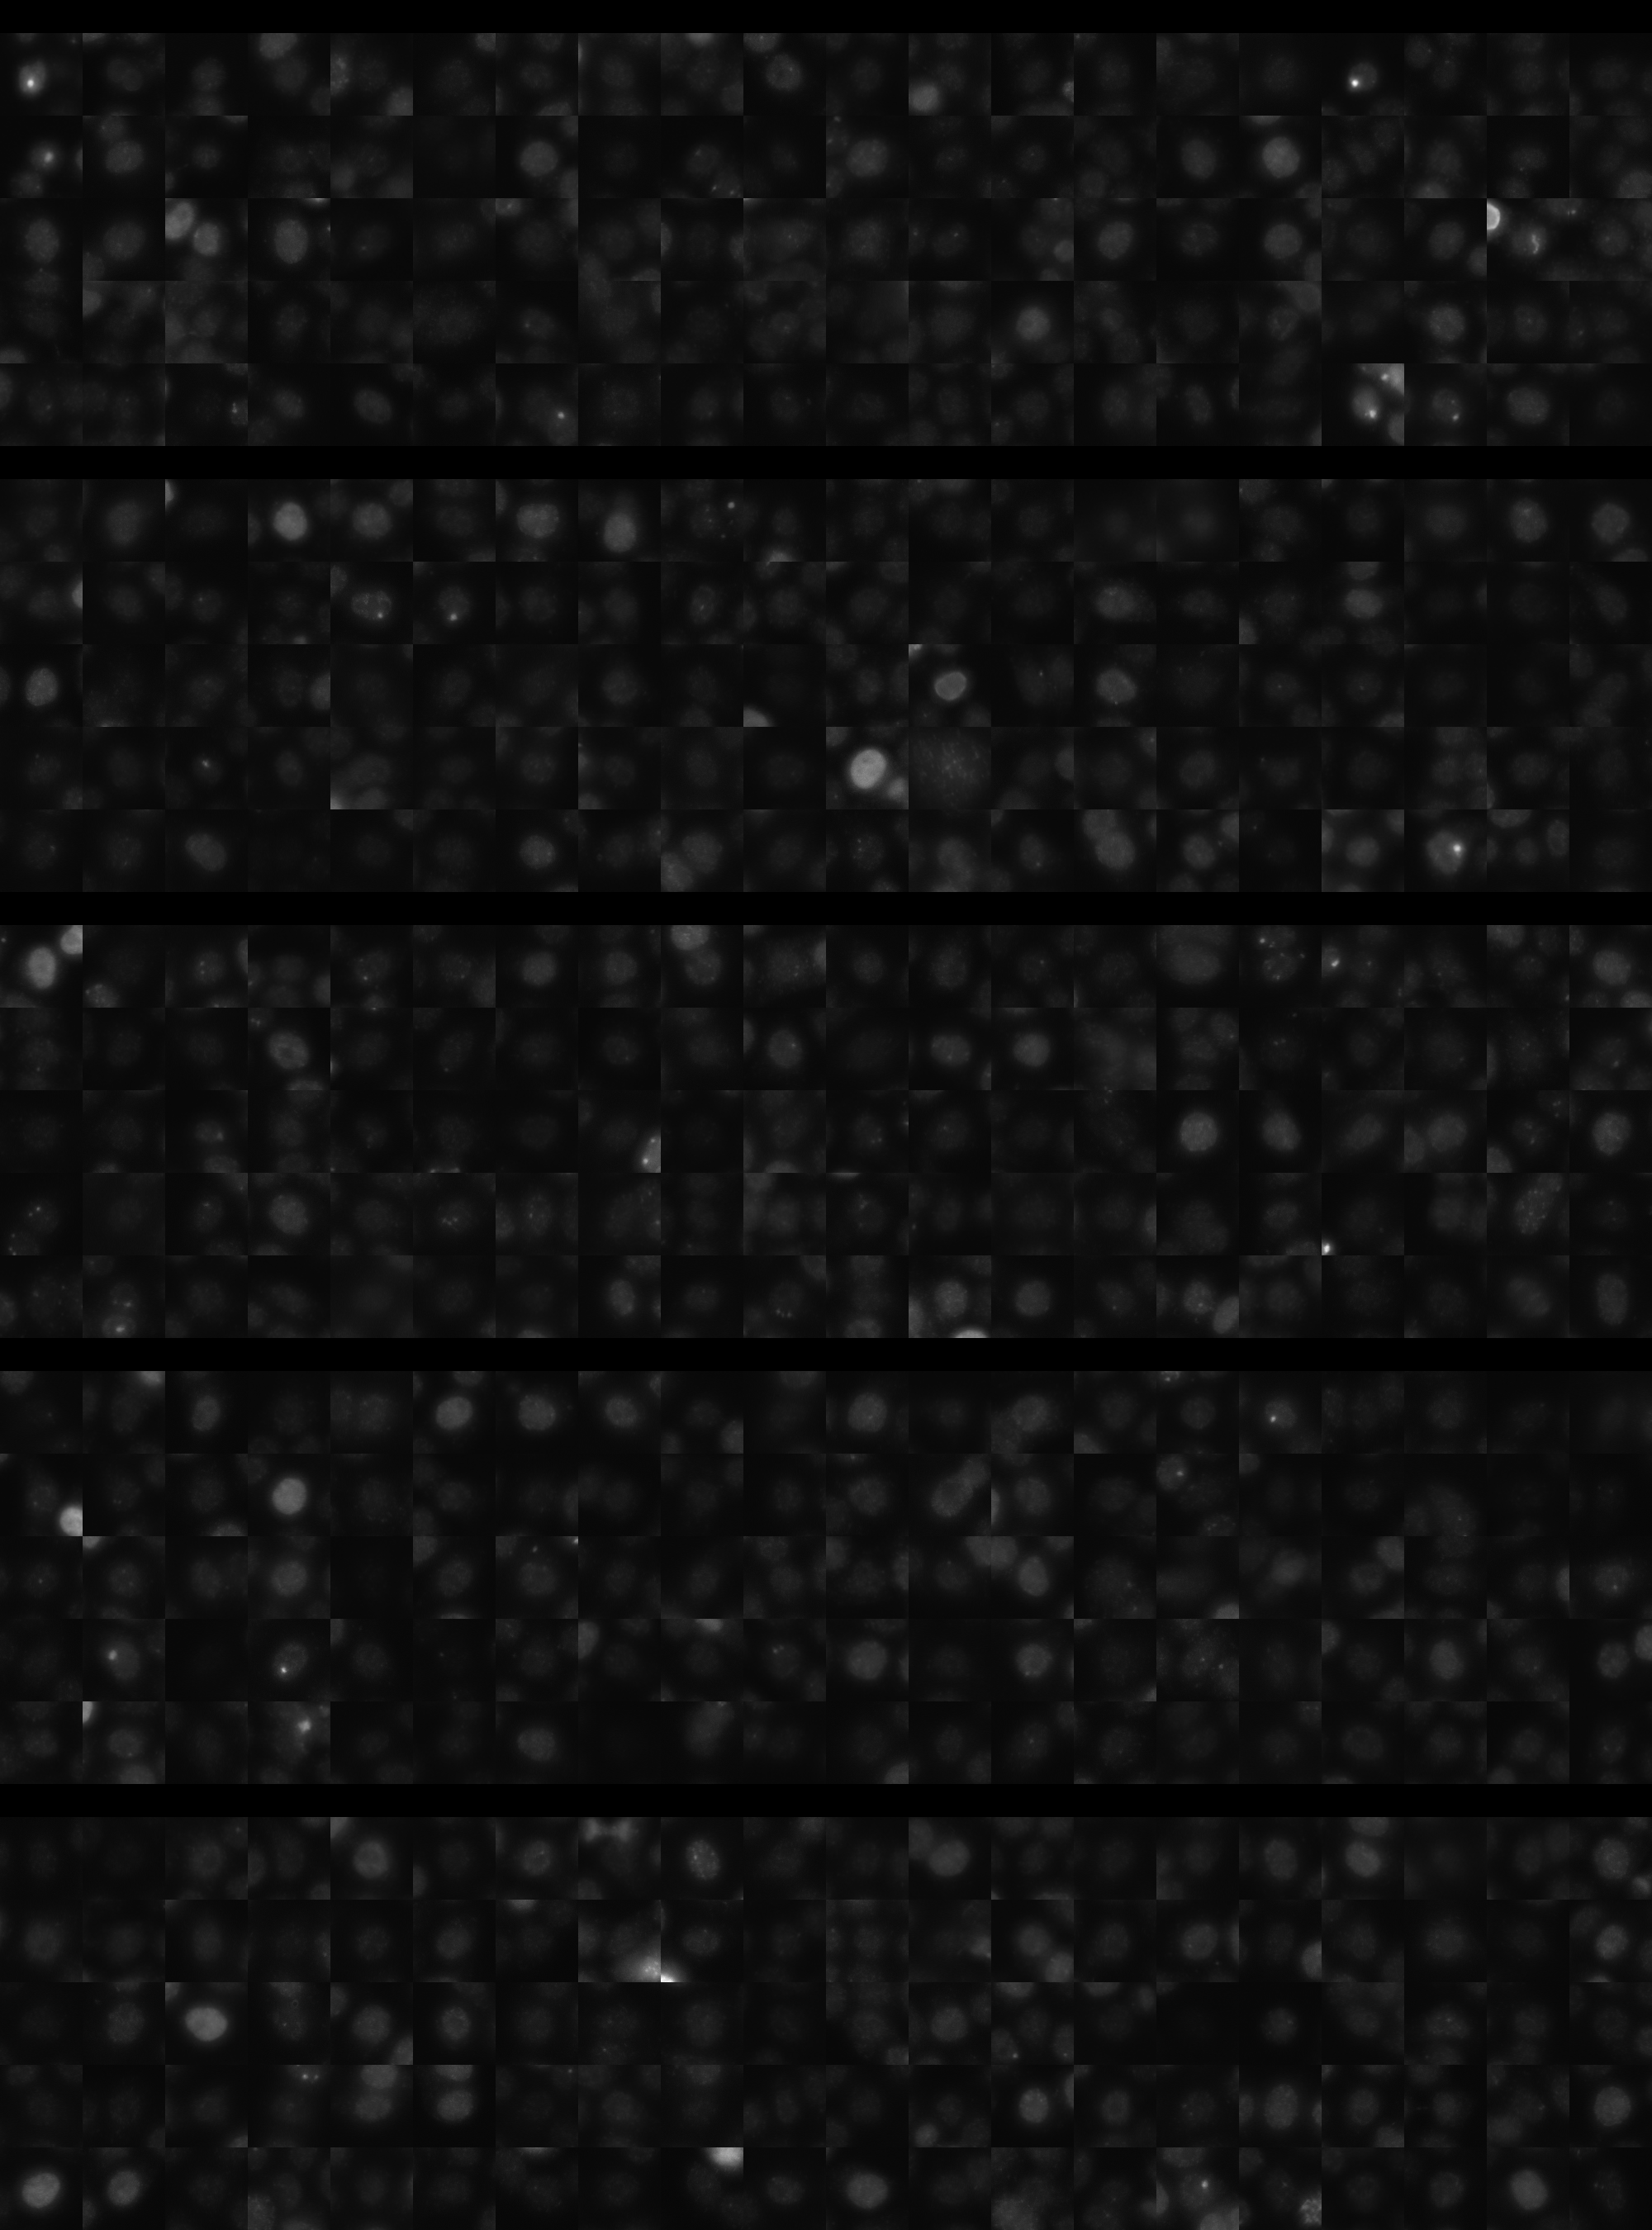
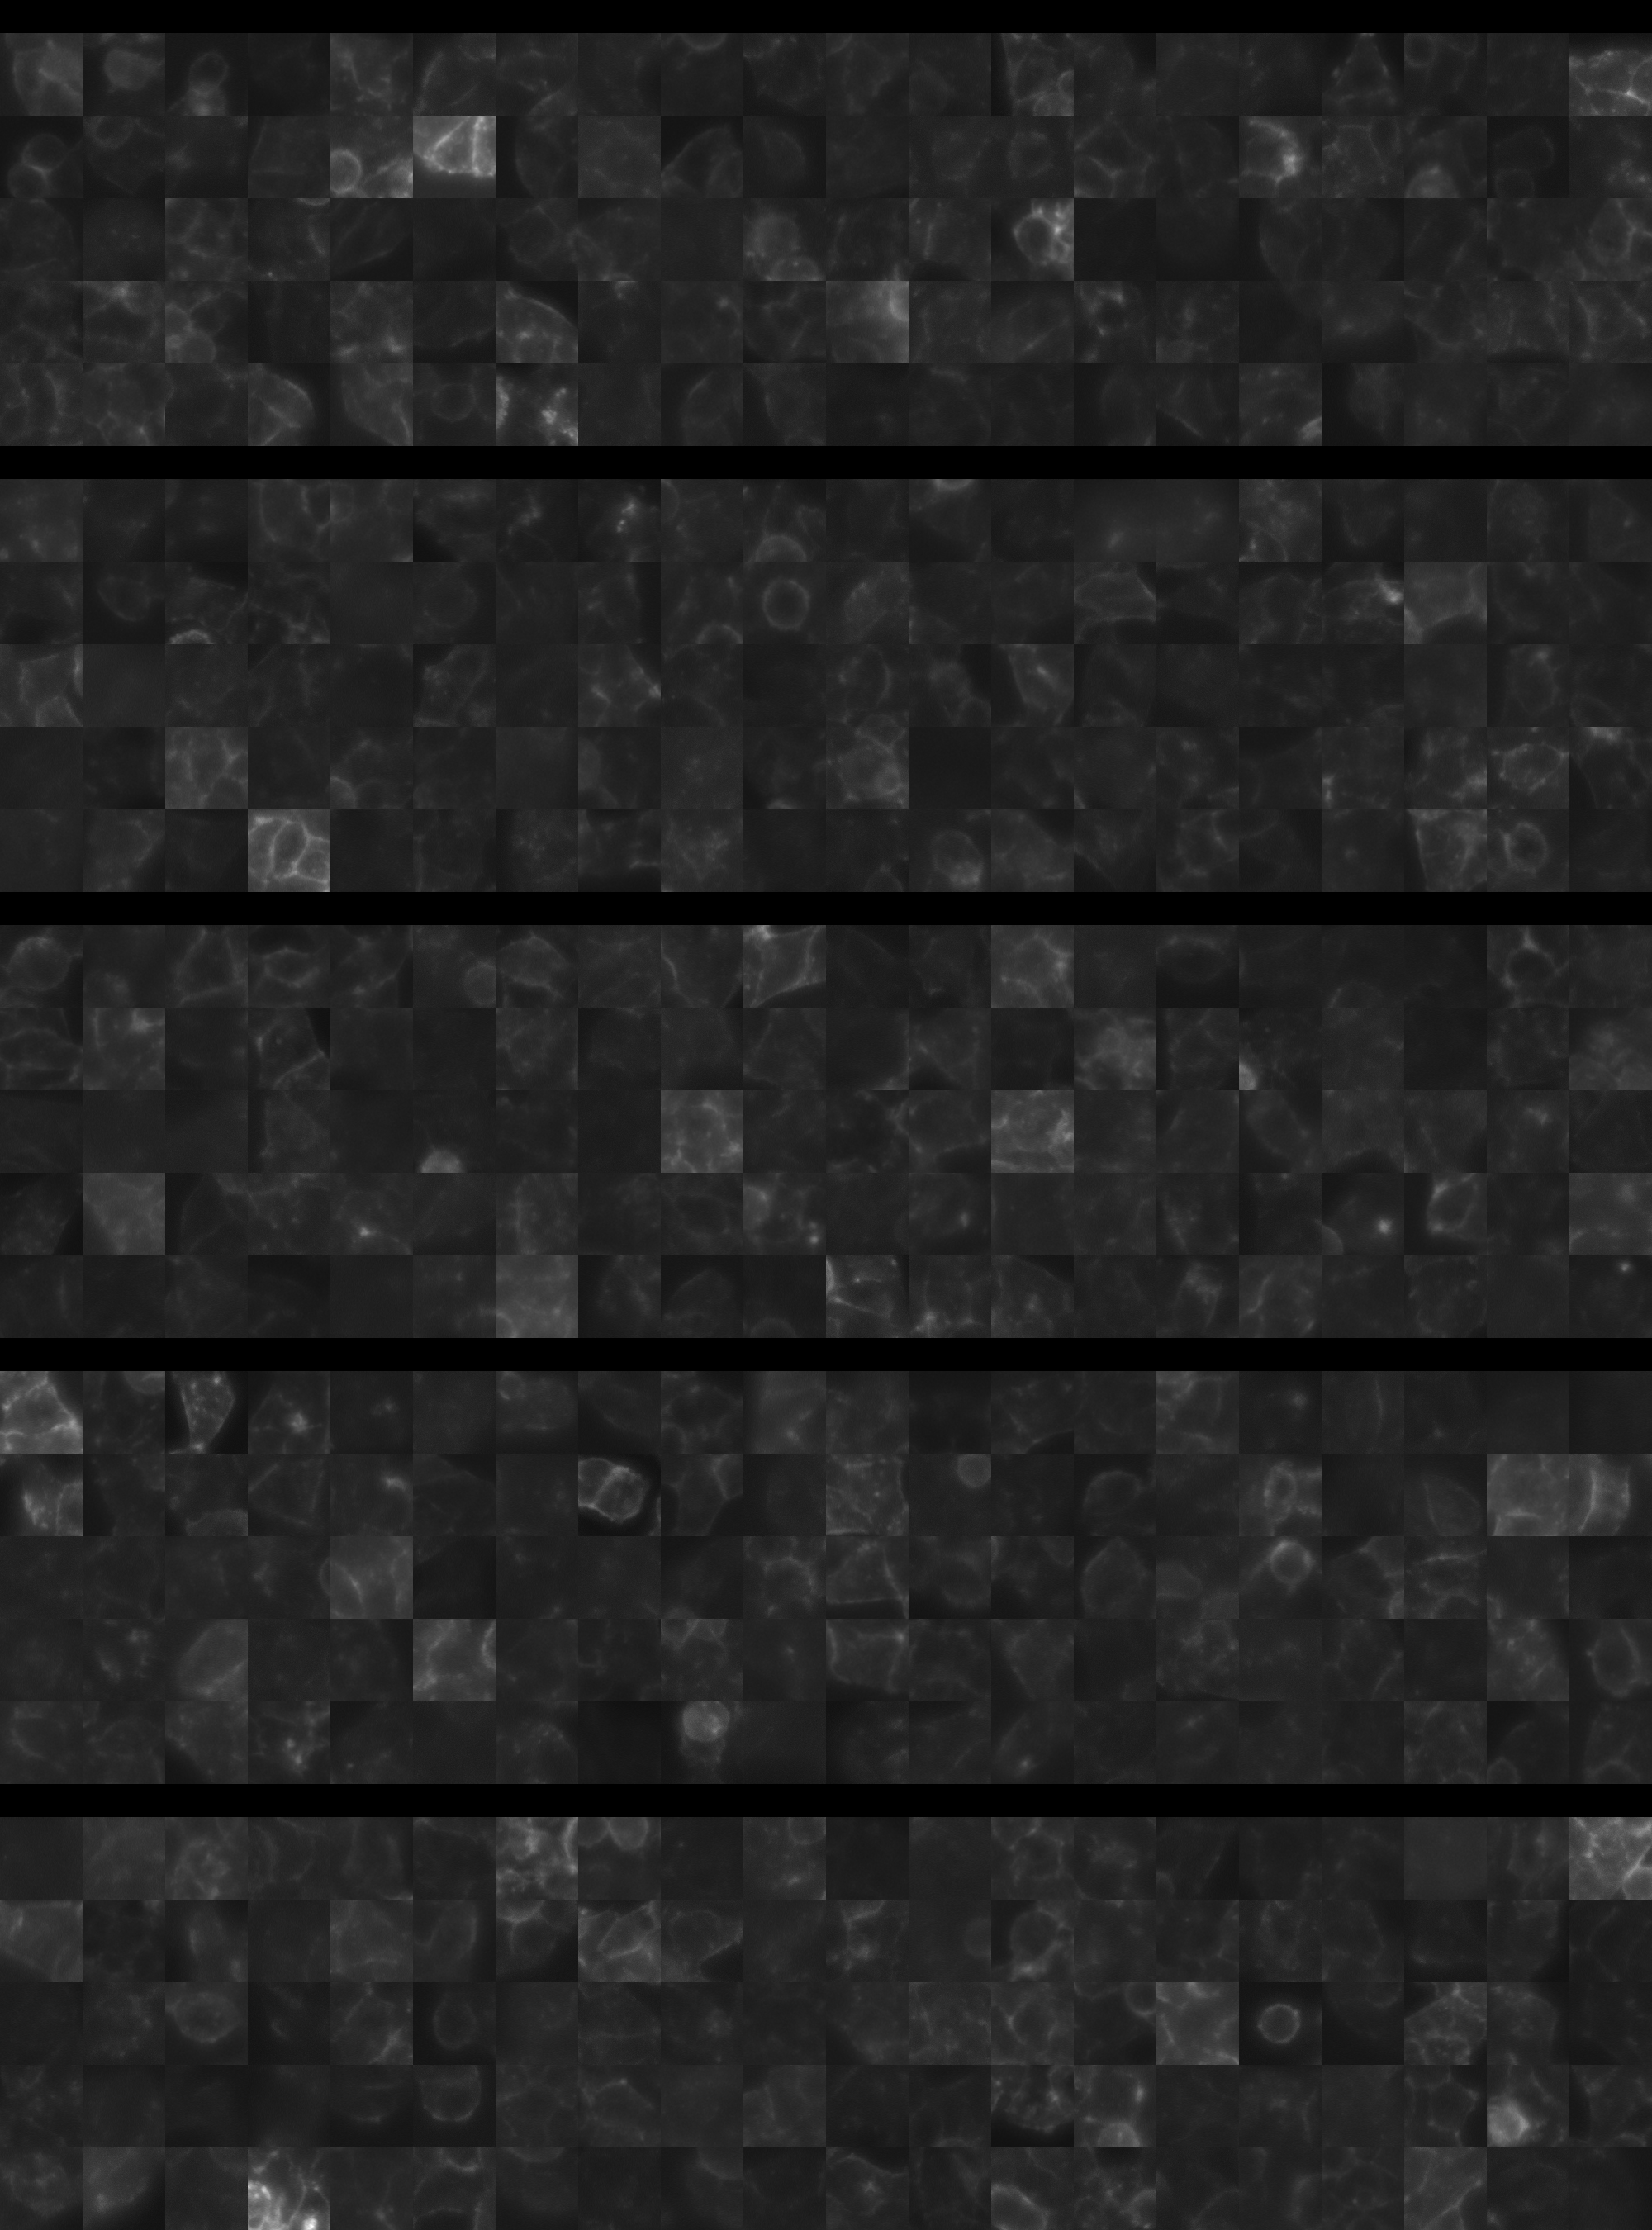
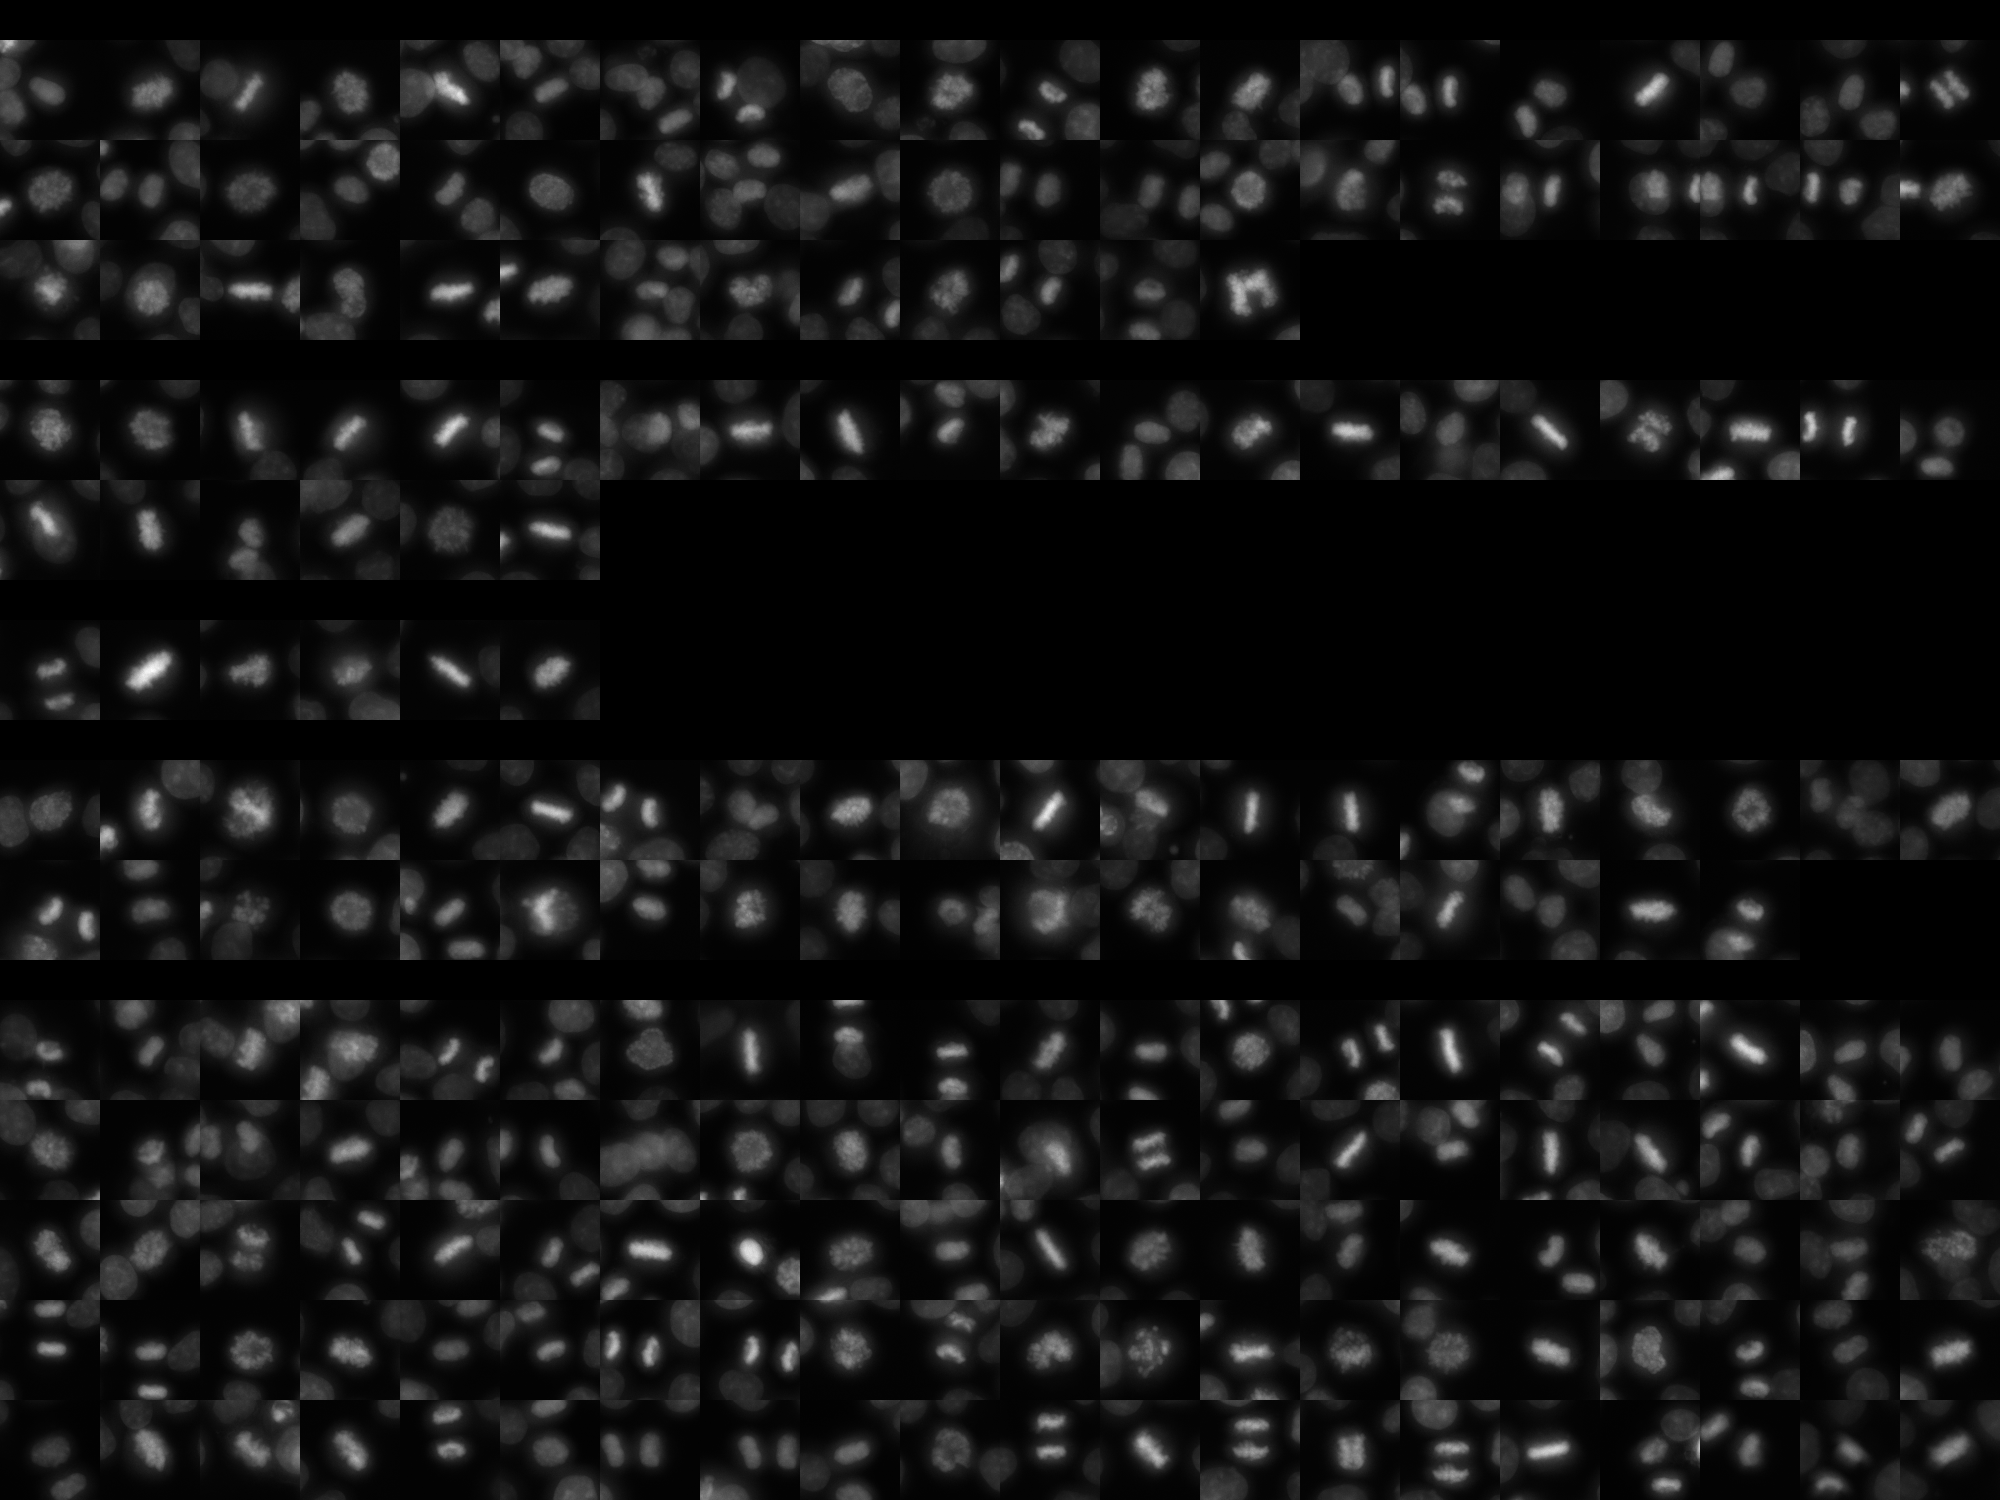
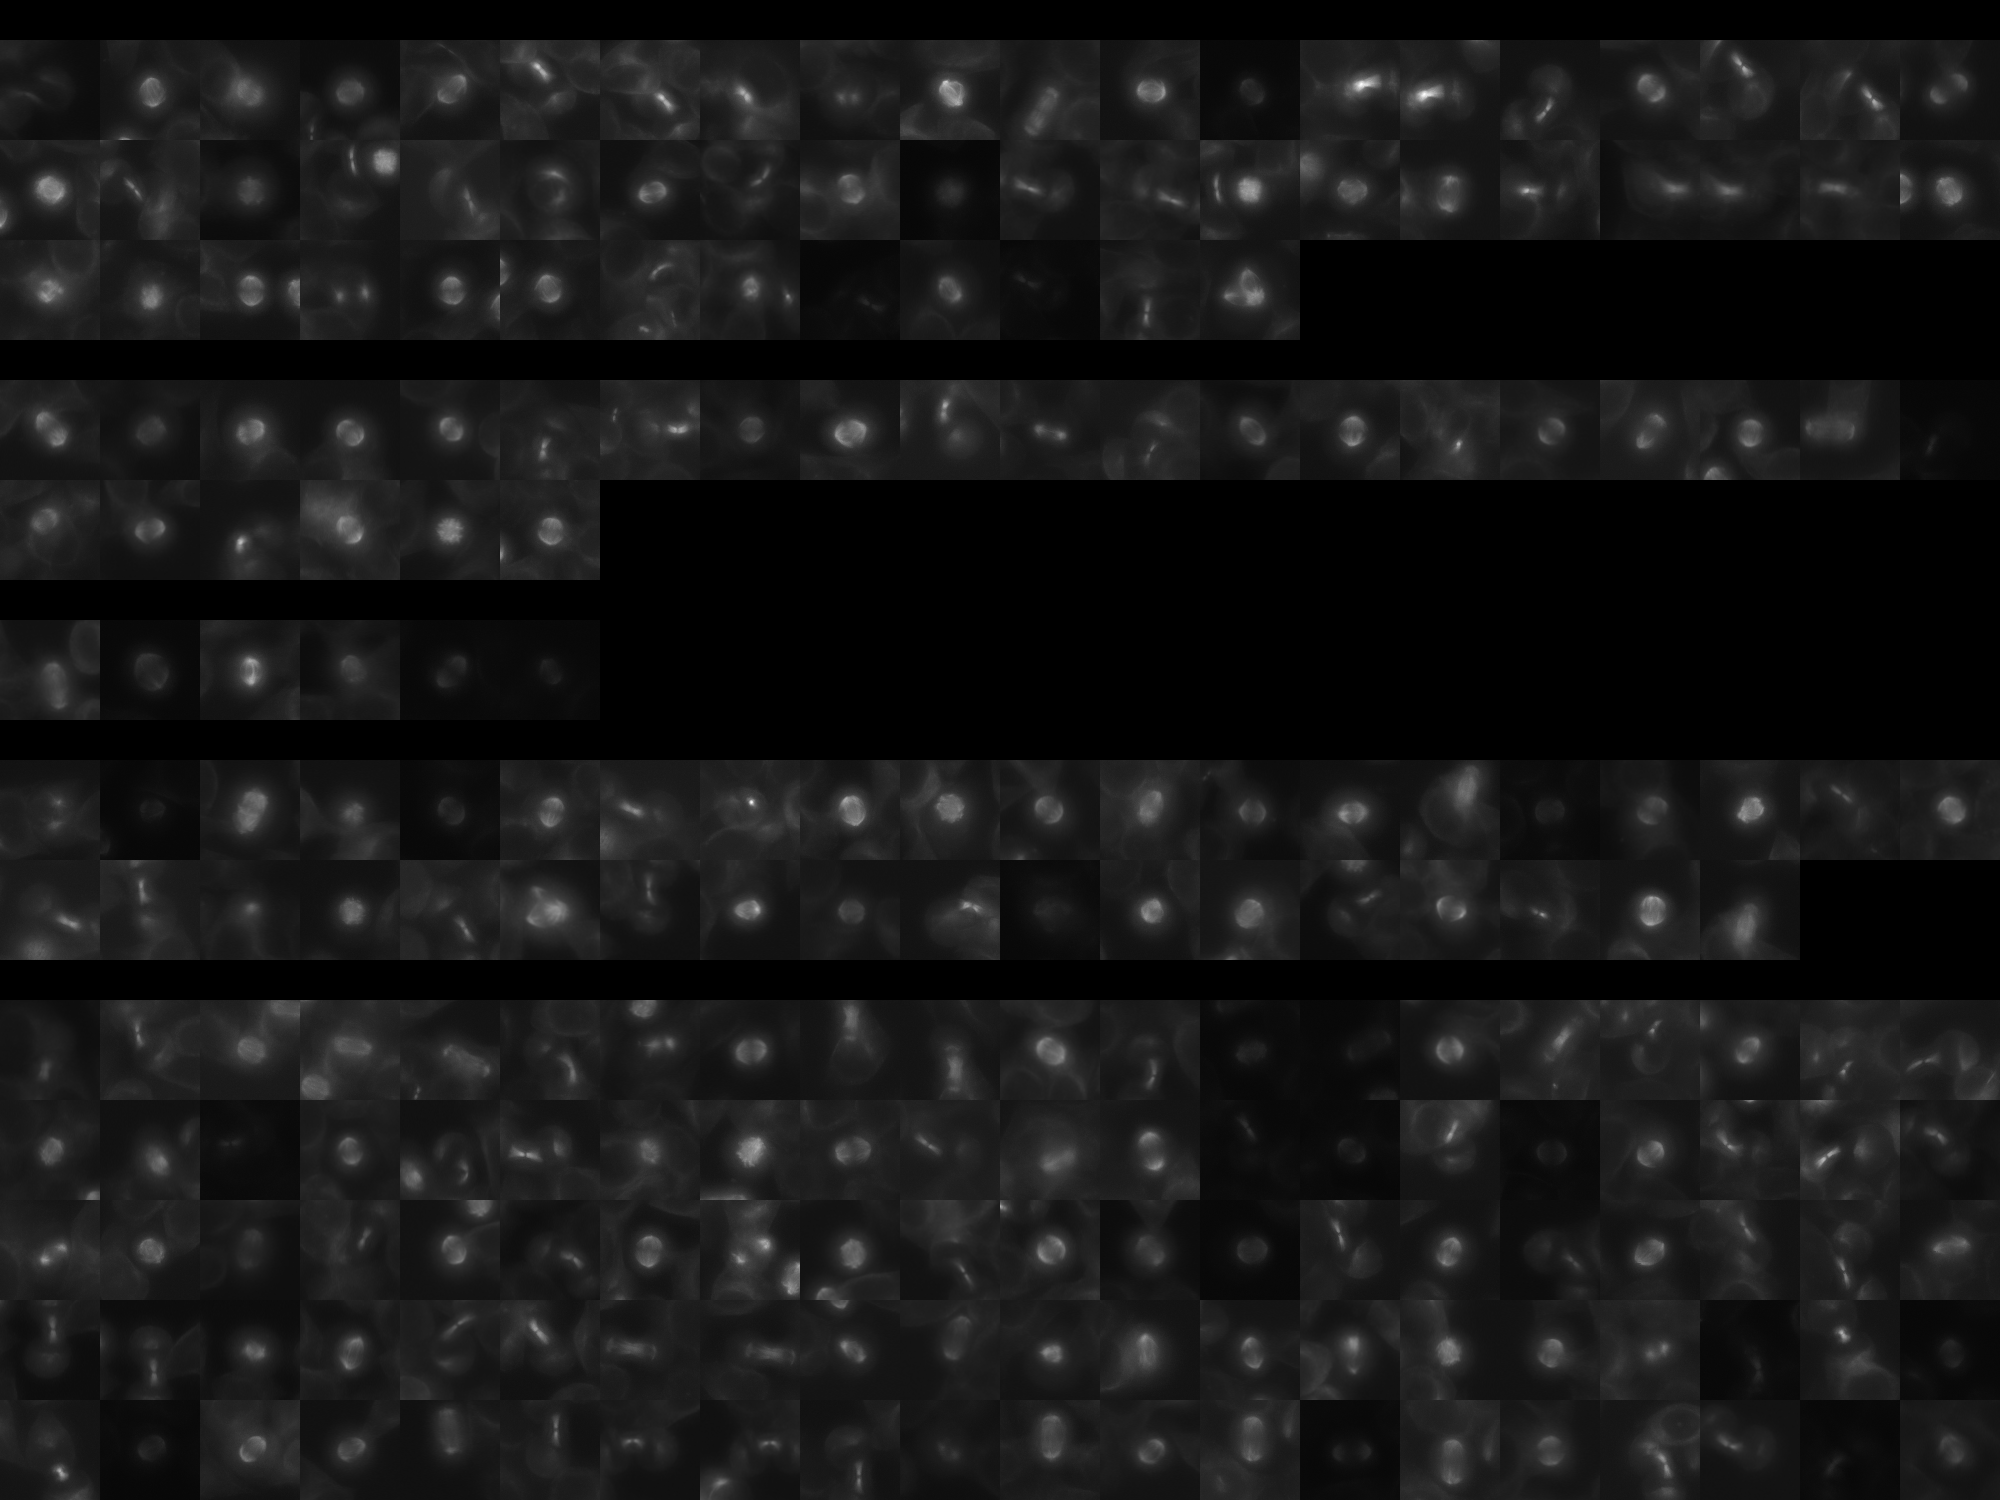
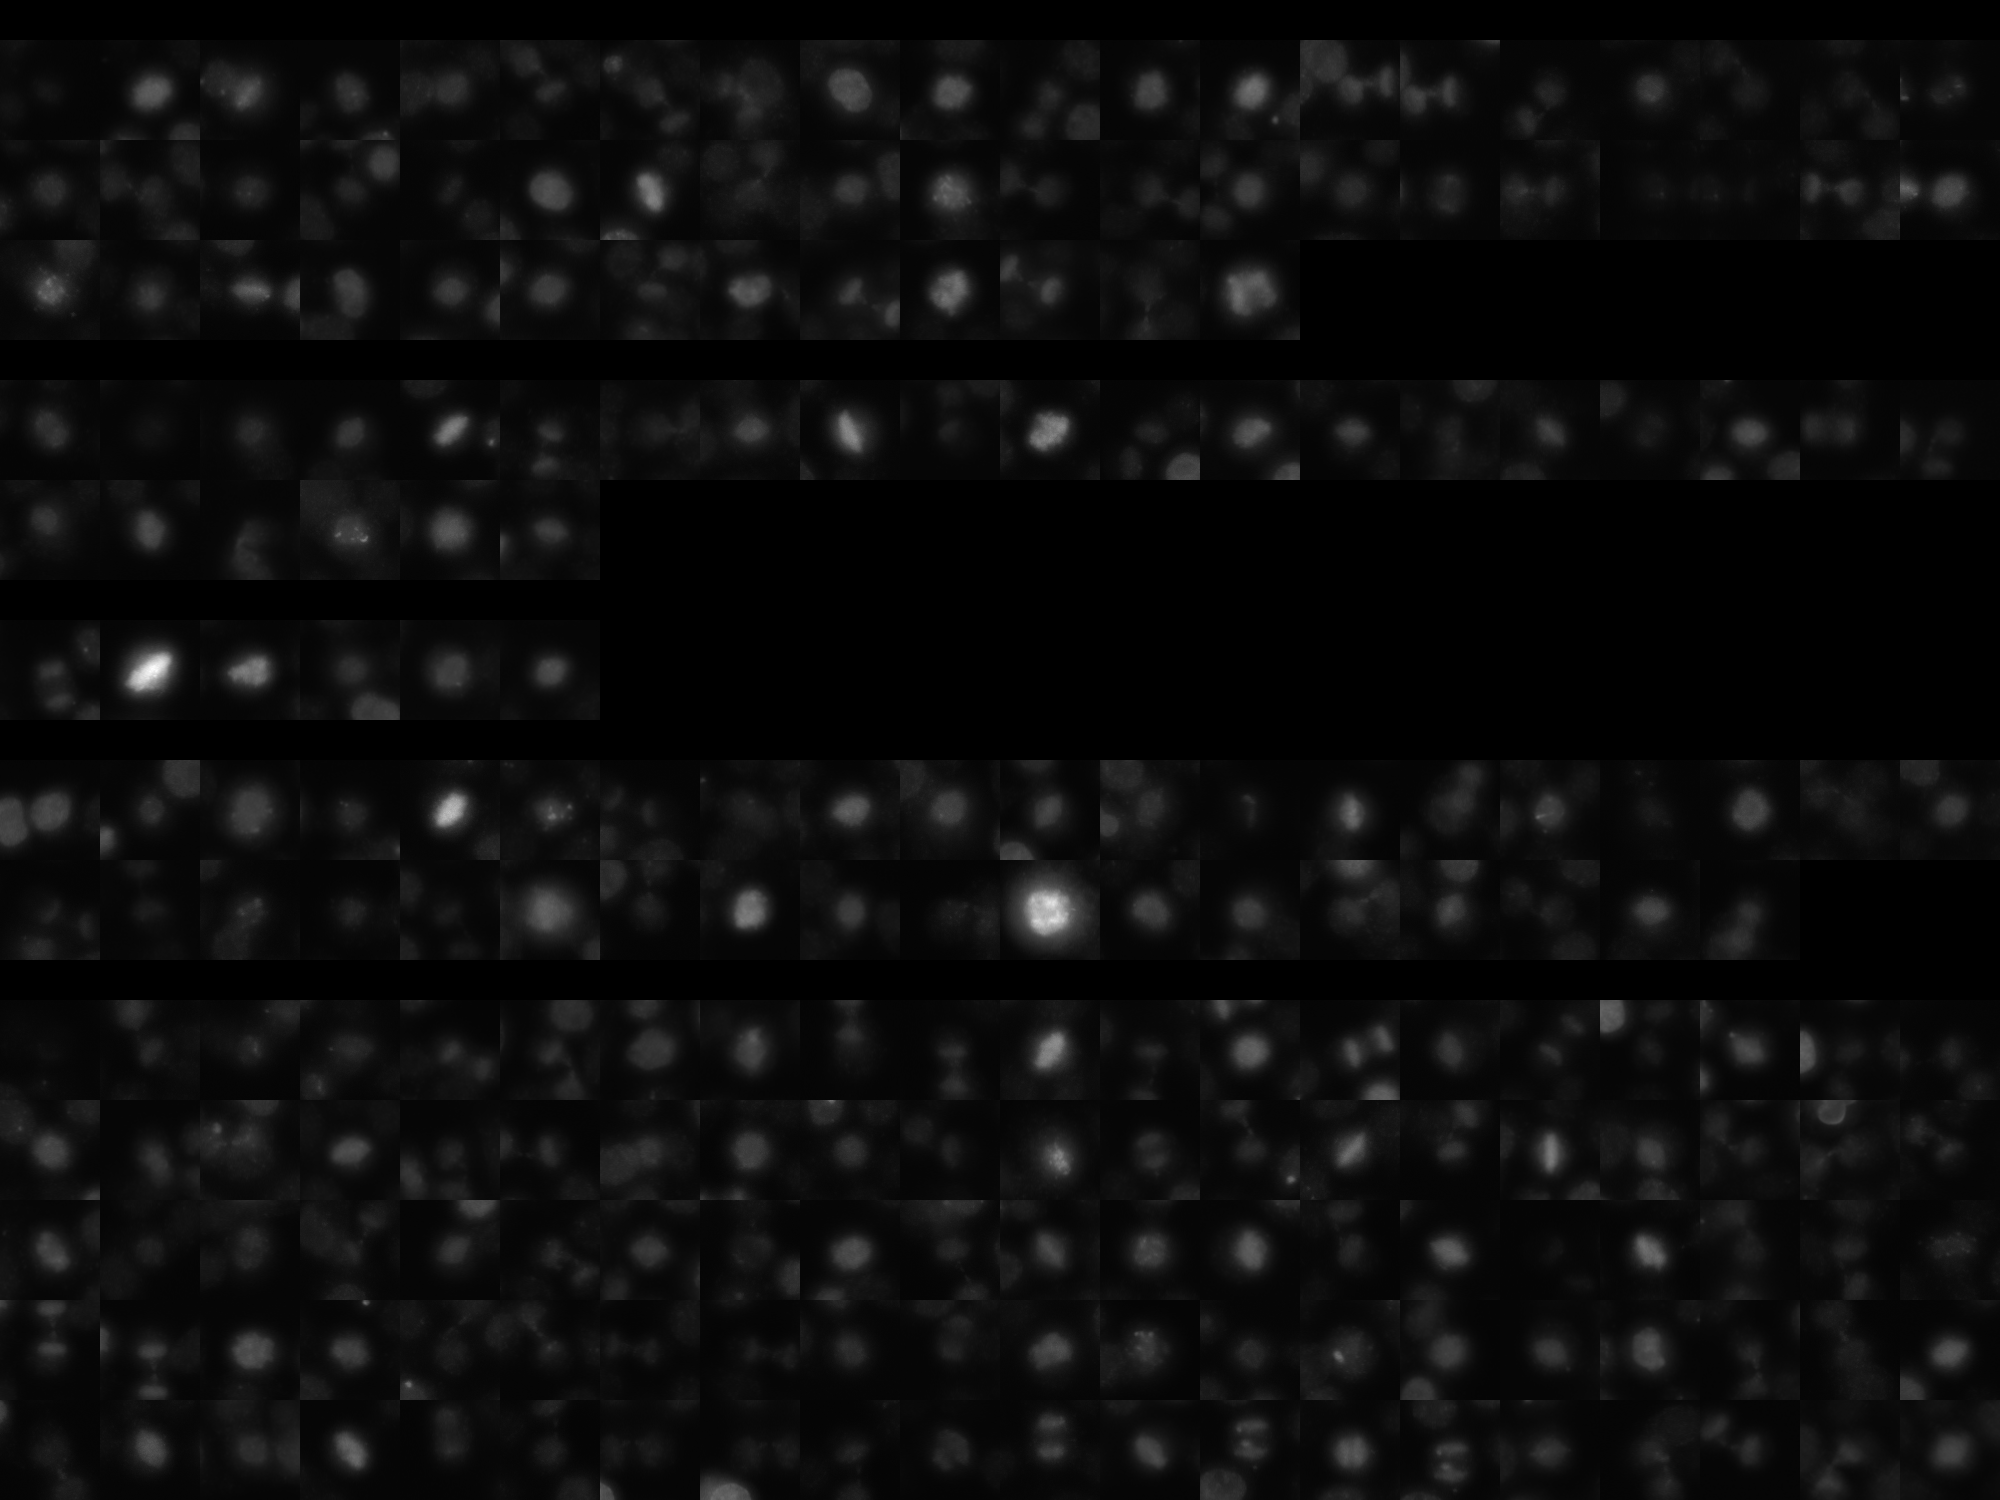
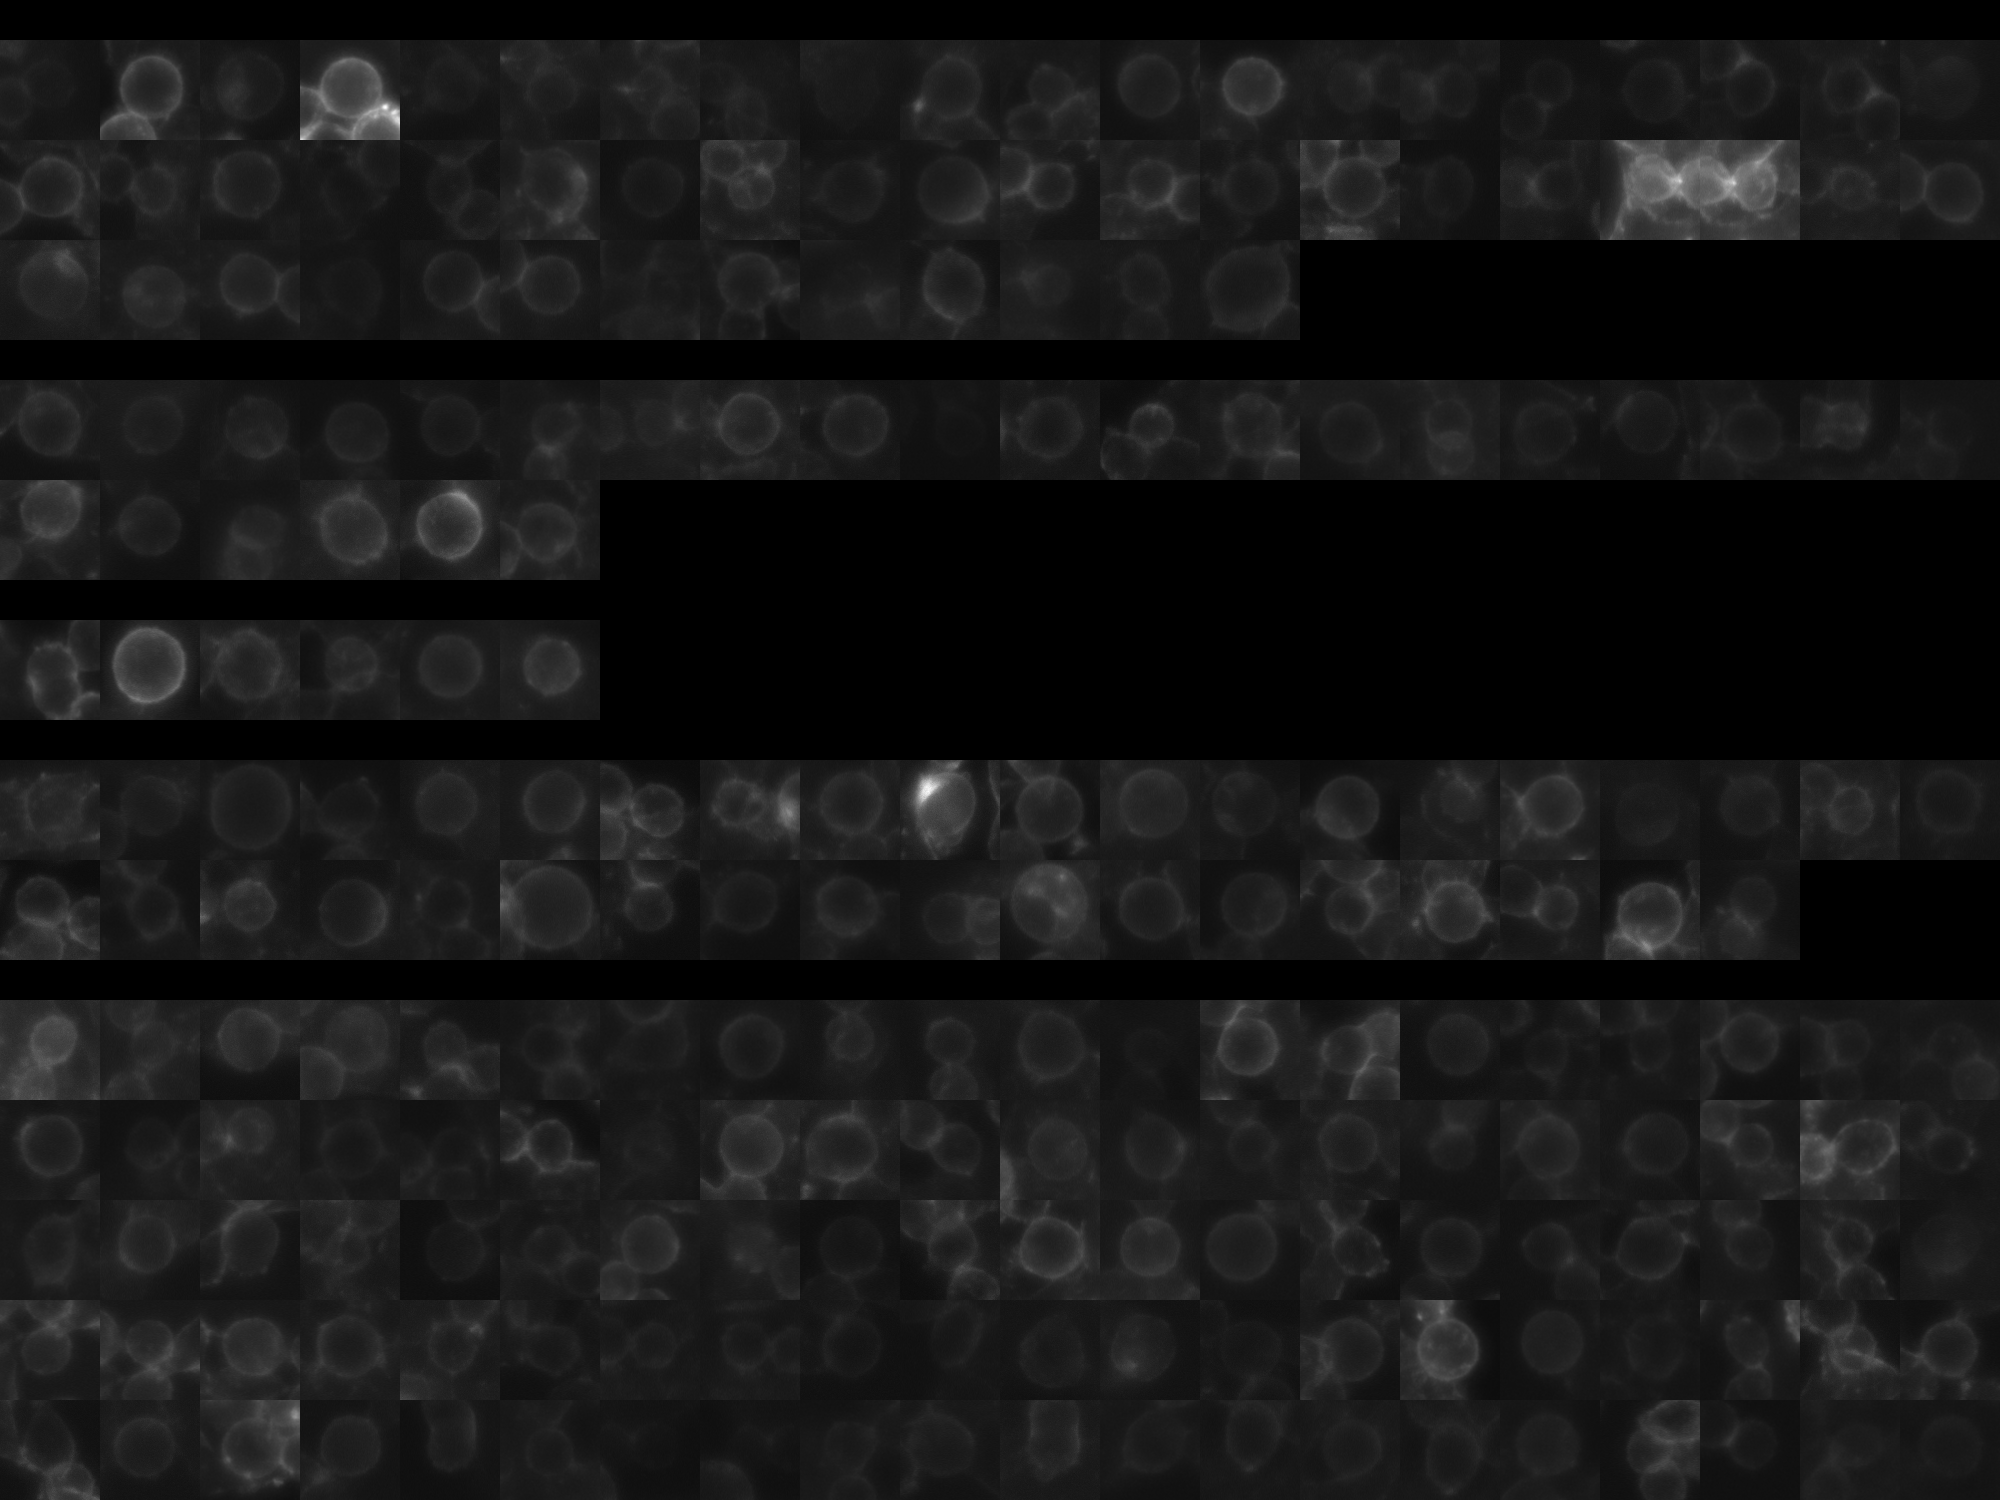
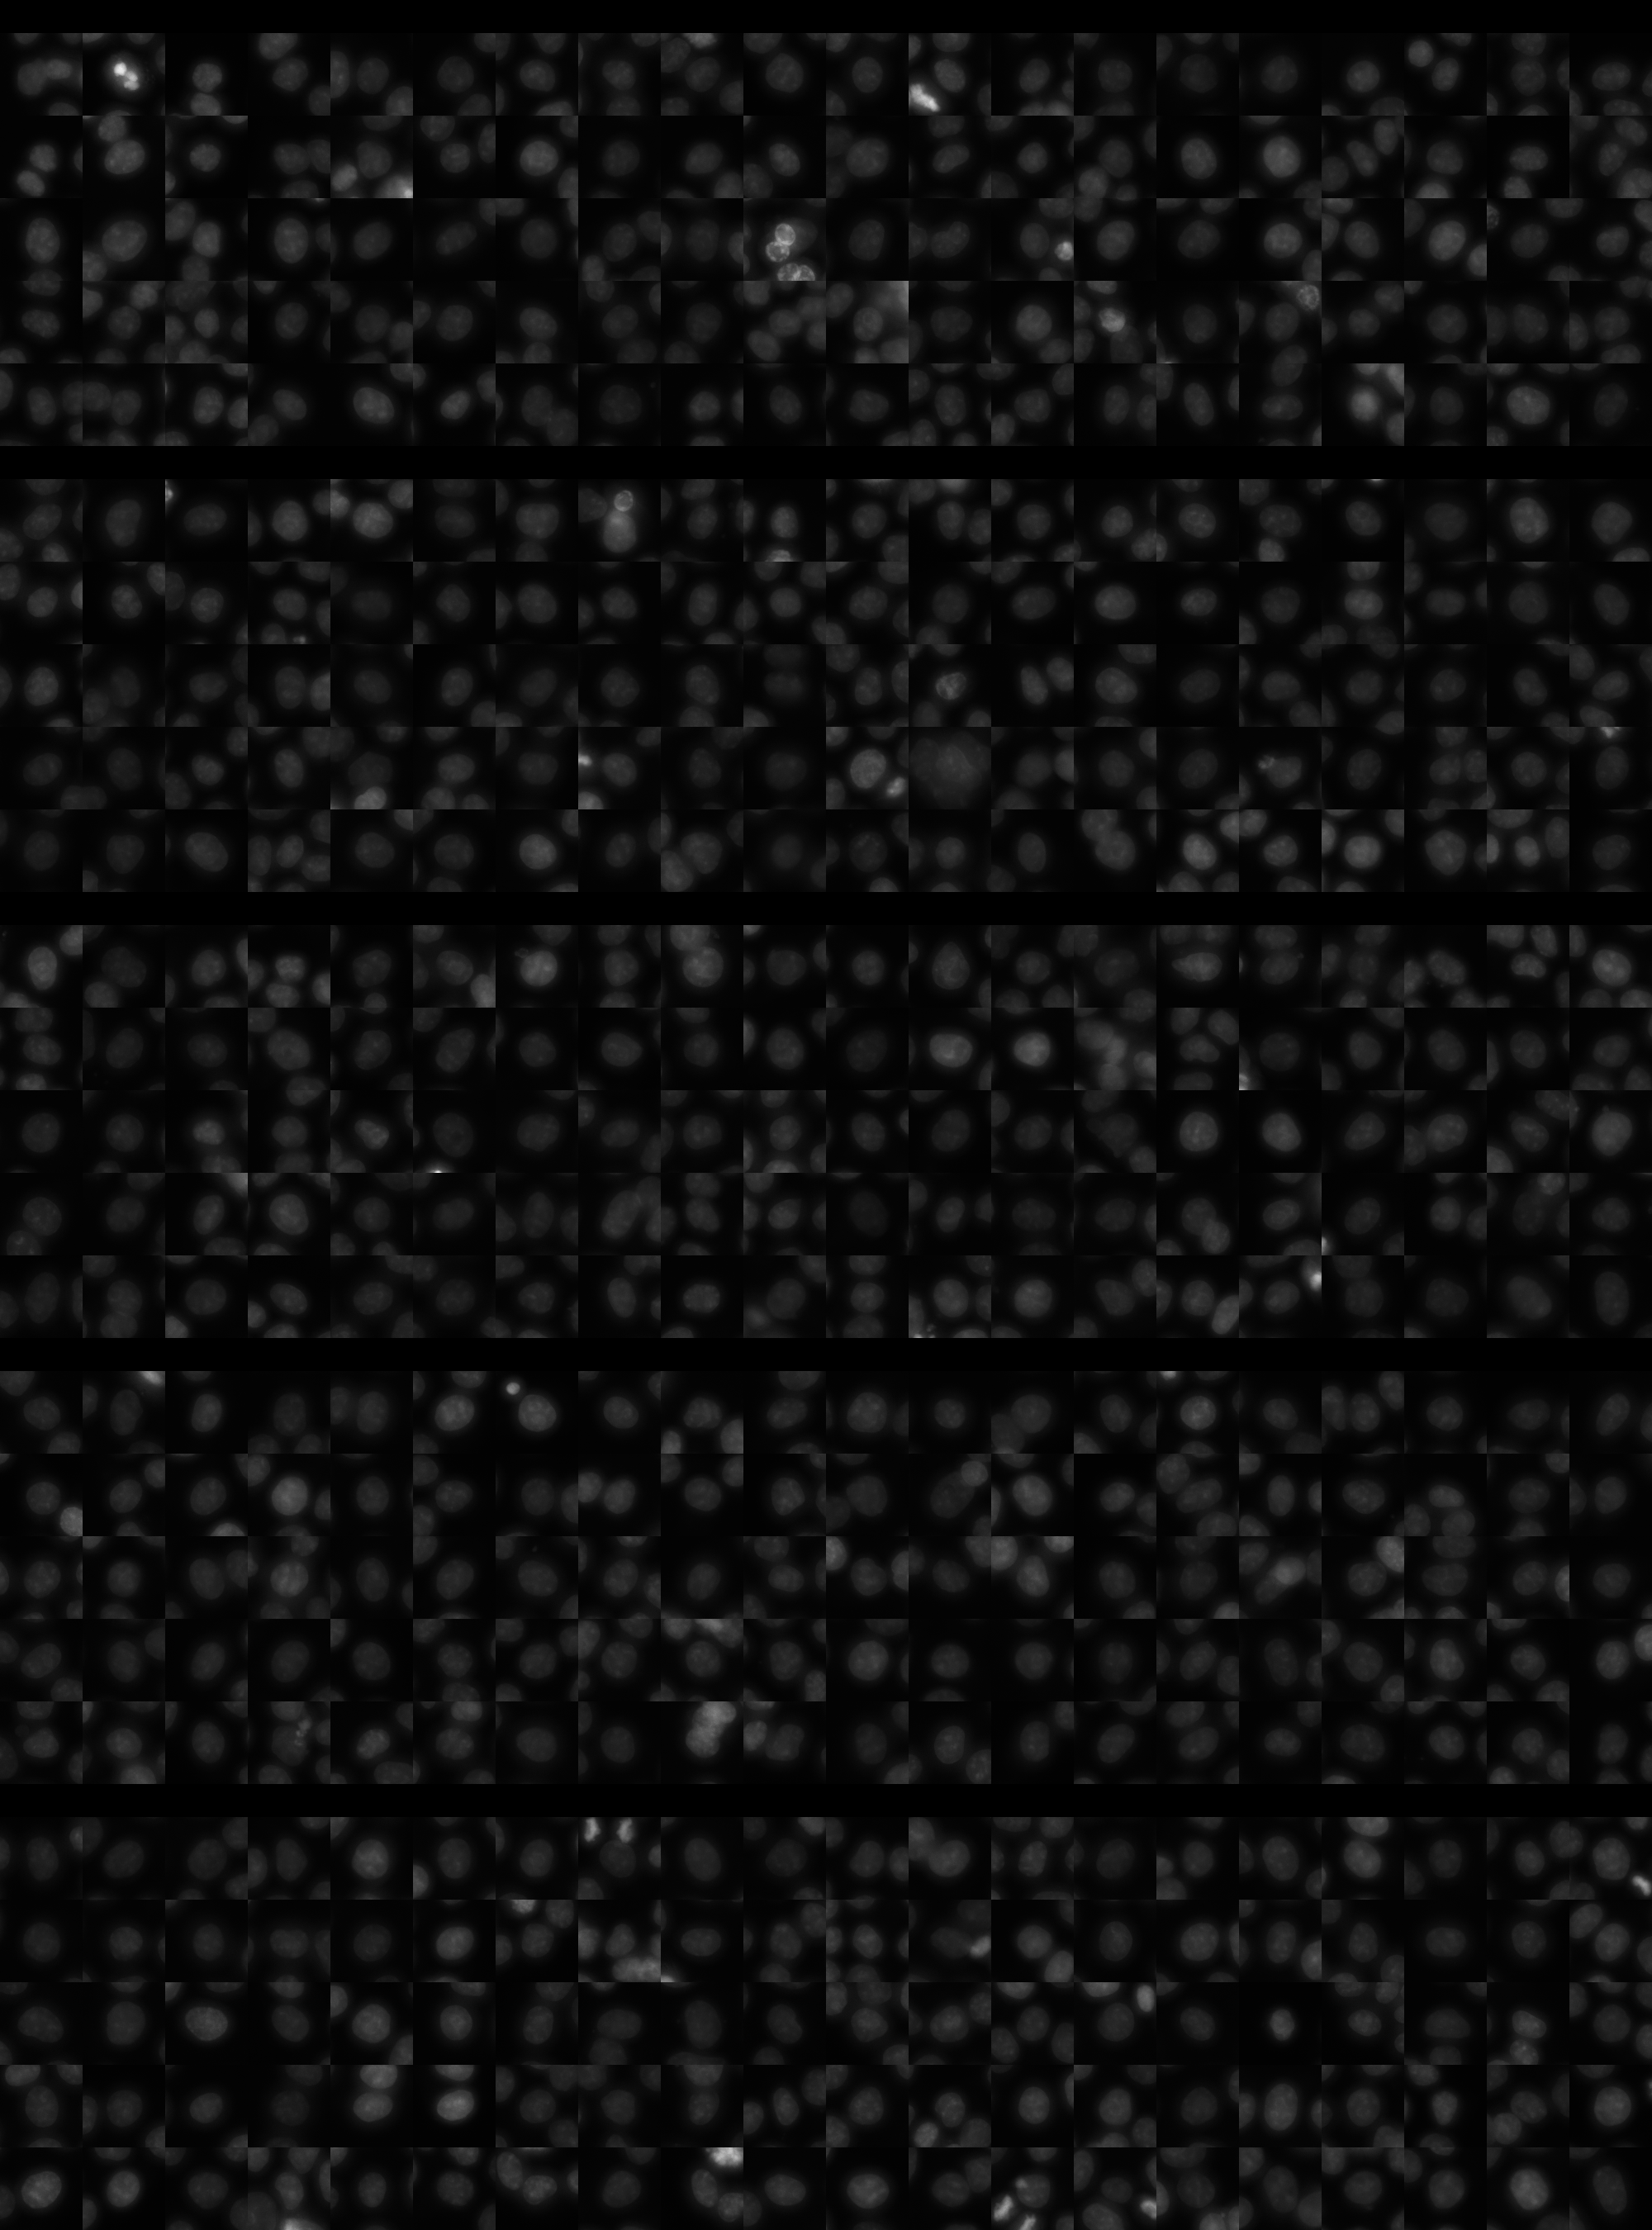
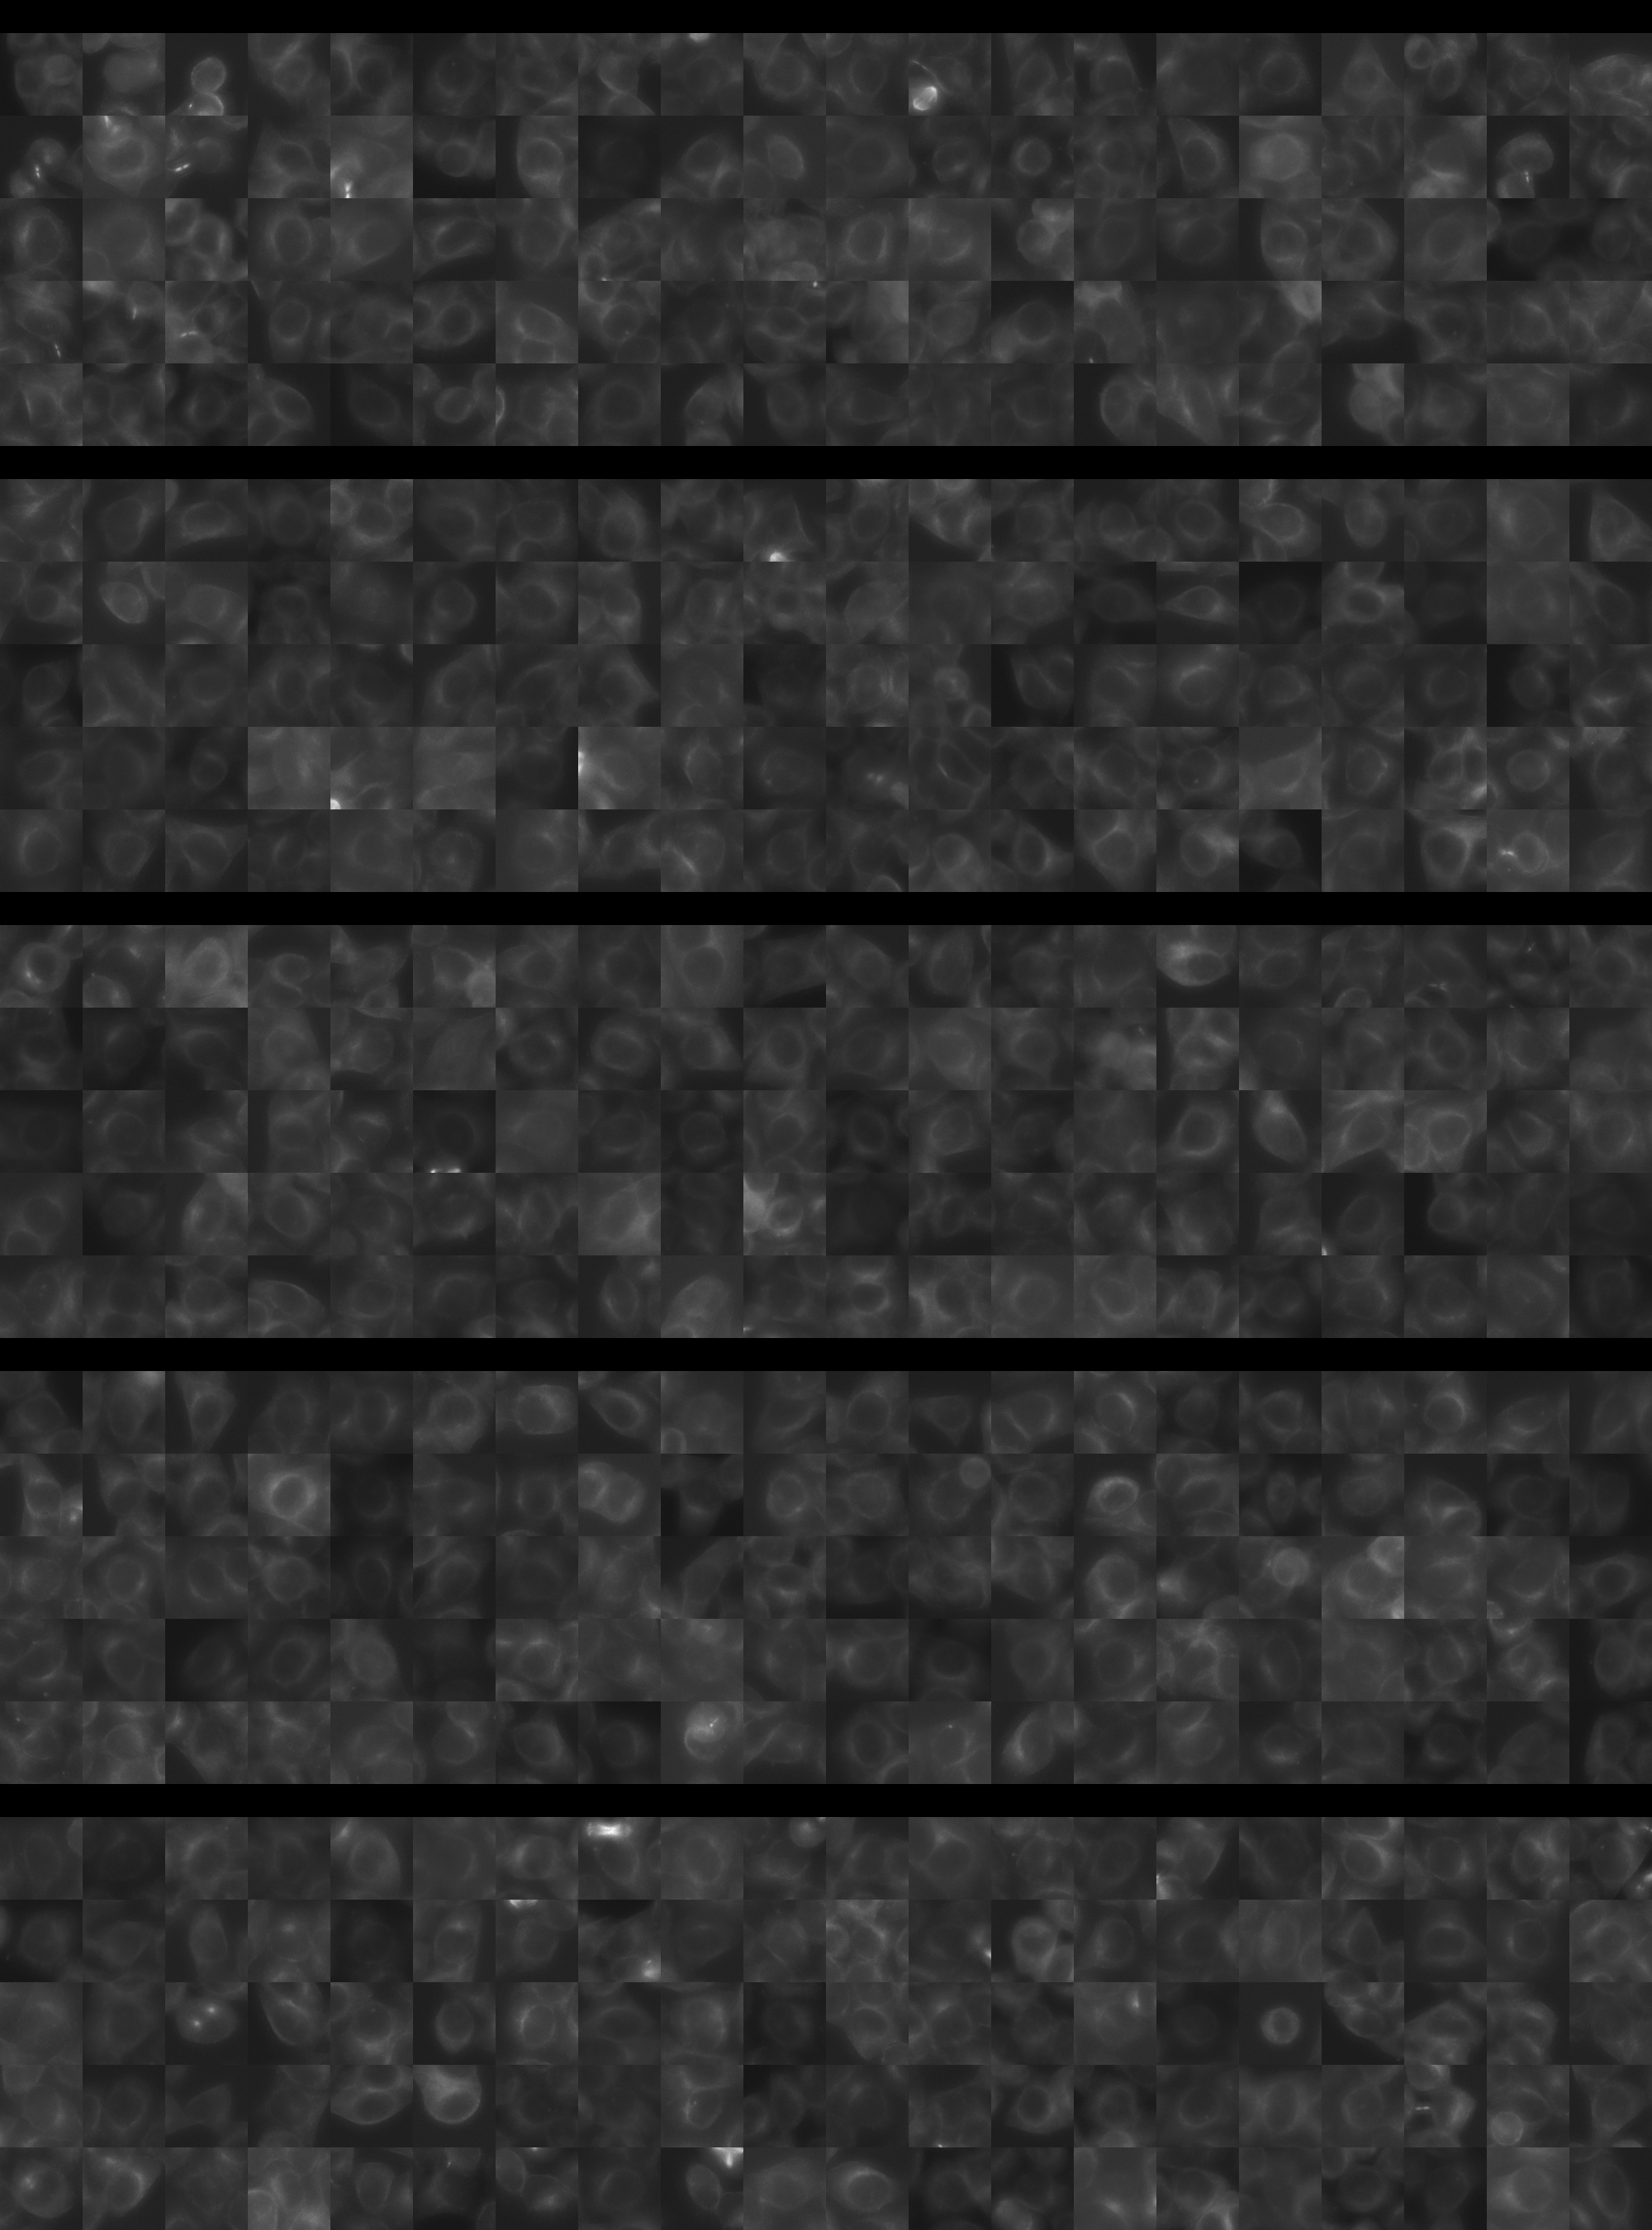
Each montage below shows randomly selected individual cell images for the same target gene separated by sgRNA, along with an example montage of cells expressing a non-targeting negative control sgRNA at the bottom. sgRNA labels in the montages correspond to the numbered sgRNA sequences in the gene info table above. The DNA (blue) and tubulin (green) channels are displayed by default, with gH2AX (grayscale) and actin (yellow) available using the check boxes. Channel brightness, contrast, and opacity are adjustable by clicking the arrow next to the channel name. When only one channel is selected, the display defaults to grayscale. Click the “Zoom” checkbox above the channel controls to enable image zooming (via scrolling) and panning (via click-and-drag).

The cell boxes displayed for this gene are square, 30.36 μm per side for the interphase montage and 30.36 μm per side for the mitotic montage.
Features

Interphase Score Rank FDR q-value
Nucleus DNA Integrated -1.784e-02 3929 of 5322 0.779
Nucleus DNA Mean -3.245e-02 3050 of 5322 0.518
Nucleus gH2AX Mean 0.088 2262 of 5322 0.030
Nucleus DNA - gH2AX Correlation -2.419e-02 1526 of 5322 0.410
Nucleus Shape Area 0.027 2374 of 5322 0.748
Nucleus Shape Eccentricity 0.054 845 of 5322 0.165
Nucleus Shape Form Factor -4.954e-02 2658 of 5322 0.224
Nucleus Shape Solidity -5.078e-02 2746 of 5322 0.148
Cell DNA Mass Displacement 0.038 1765 of 5322 0.543
Cell Tubulin Mean -5.356e-02 4393 of 5322 0.269
Cell Tubulin Mass Displacement 0.037 957 of 5322 0.466
Cell Actin Mean -5.136e-02 4379 of 5322 0.321
Cell Tubulin - Actin Correlation -1.968e-02 4480 of 5322 0.721
Cell DNA - Tubulin Correlation 0.002 3749 of 5322 0.979
Cell Shape Area 0.046 1649 of 5322 0.538
Cell Shape Eccentricity 0.048 635 of 5322 0.408
Mitotic Score Rank FDR q-value
Nucleus DNA Integrated 0.378 314 of 5322 0.555
Nucleus DNA Mean -1.825e-02 3239 of 5322 1.000
Nucleus DNA Mass Displacement -7.010e-02 4406 of 5322 0.999
Nucleus DNA Mean Frac 3 0.074 1943 of 5322 1.000
Nucleus gH2AX Mean 0.054 2195 of 5322 1.000
Nucleus gH2AX Mean Frac 0 -5.140e-02 3104 of 5322 1.000
Nucleus Tubulin Mean Frac 0 0.157 1251 of 5322 0.999
Nucleus Tubulin Mean Edge 0.087 2035 of 5322 0.999
Nucleus Tubulin Std Edge -6.436e-03 2670 of 5322 0.999
Nucleus Shape Area 0.336 633 of 5322 0.641
Nucleus Shape Eccentricity -1.468e-01 4096 of 5322 1.000
Nucleus Shape Form Factor -2.865e-01 4732 of 5322 0.976
Cell Tubulin Mean 0.285 485 of 5322 0.944
Cell Tubulin Mean Frac 3 -4.215e-01 5077 of 5322 0.586
Cell Actin Mean 0.157 1232 of 5322 0.997
Cell Shape Area 0.165 1778 of 5322 0.998
( Reset Zoom )
Brightness
Contrast
Opacity
Brightness
Contrast
Opacity
Brightness
Contrast
Opacity
Brightness
Contrast
Opacity
Brightness
Contrast
Opacity

( Reset Zoom )
Brightness
Contrast
Opacity
Brightness
Contrast
Opacity
Brightness
Contrast
Opacity
Brightness
Contrast
Opacity
Brightness
Contrast
Opacity

MIT Central Accessability