CTU2

Gene symbol: CTU2
Gene: 348180
Uniprot Function: Plays a central role in 2-thiolation of mcm(5)S(2)U at tRNA wobble positions of tRNA(Lys), tRNA(Glu) and tRNA(Gln). May act by forming a heterodimer with CTU1/ATPBD3 that ligates sulfur from thiocarboxylated URM1 onto the uridine of tRNAs at wobble position.
Mitotic Index 0.0208
Interphase Cluster: #14 (41 genes)
Mitotic Cluster: #116 (23 genes)
sgRNA 1: CGCAGGGCTTCTCGGATGAG (interphase cells: 1784, mitotic cells: 35)
sgRNA 2: GCCAGCTCTTACCTGGGCCG (interphase cells: 928, mitotic cells: 28)
sgRNA 3: GCTCATCTTTCCAGGCGAGA (interphase cells: 923, mitotic cells: 16)
sgRNA 4: TCCGGCTCGTATCACCACAA (interphase cells: 1792, mitotic cells: 36)

Interphase Cluster

Mitotic Cluster

Overview

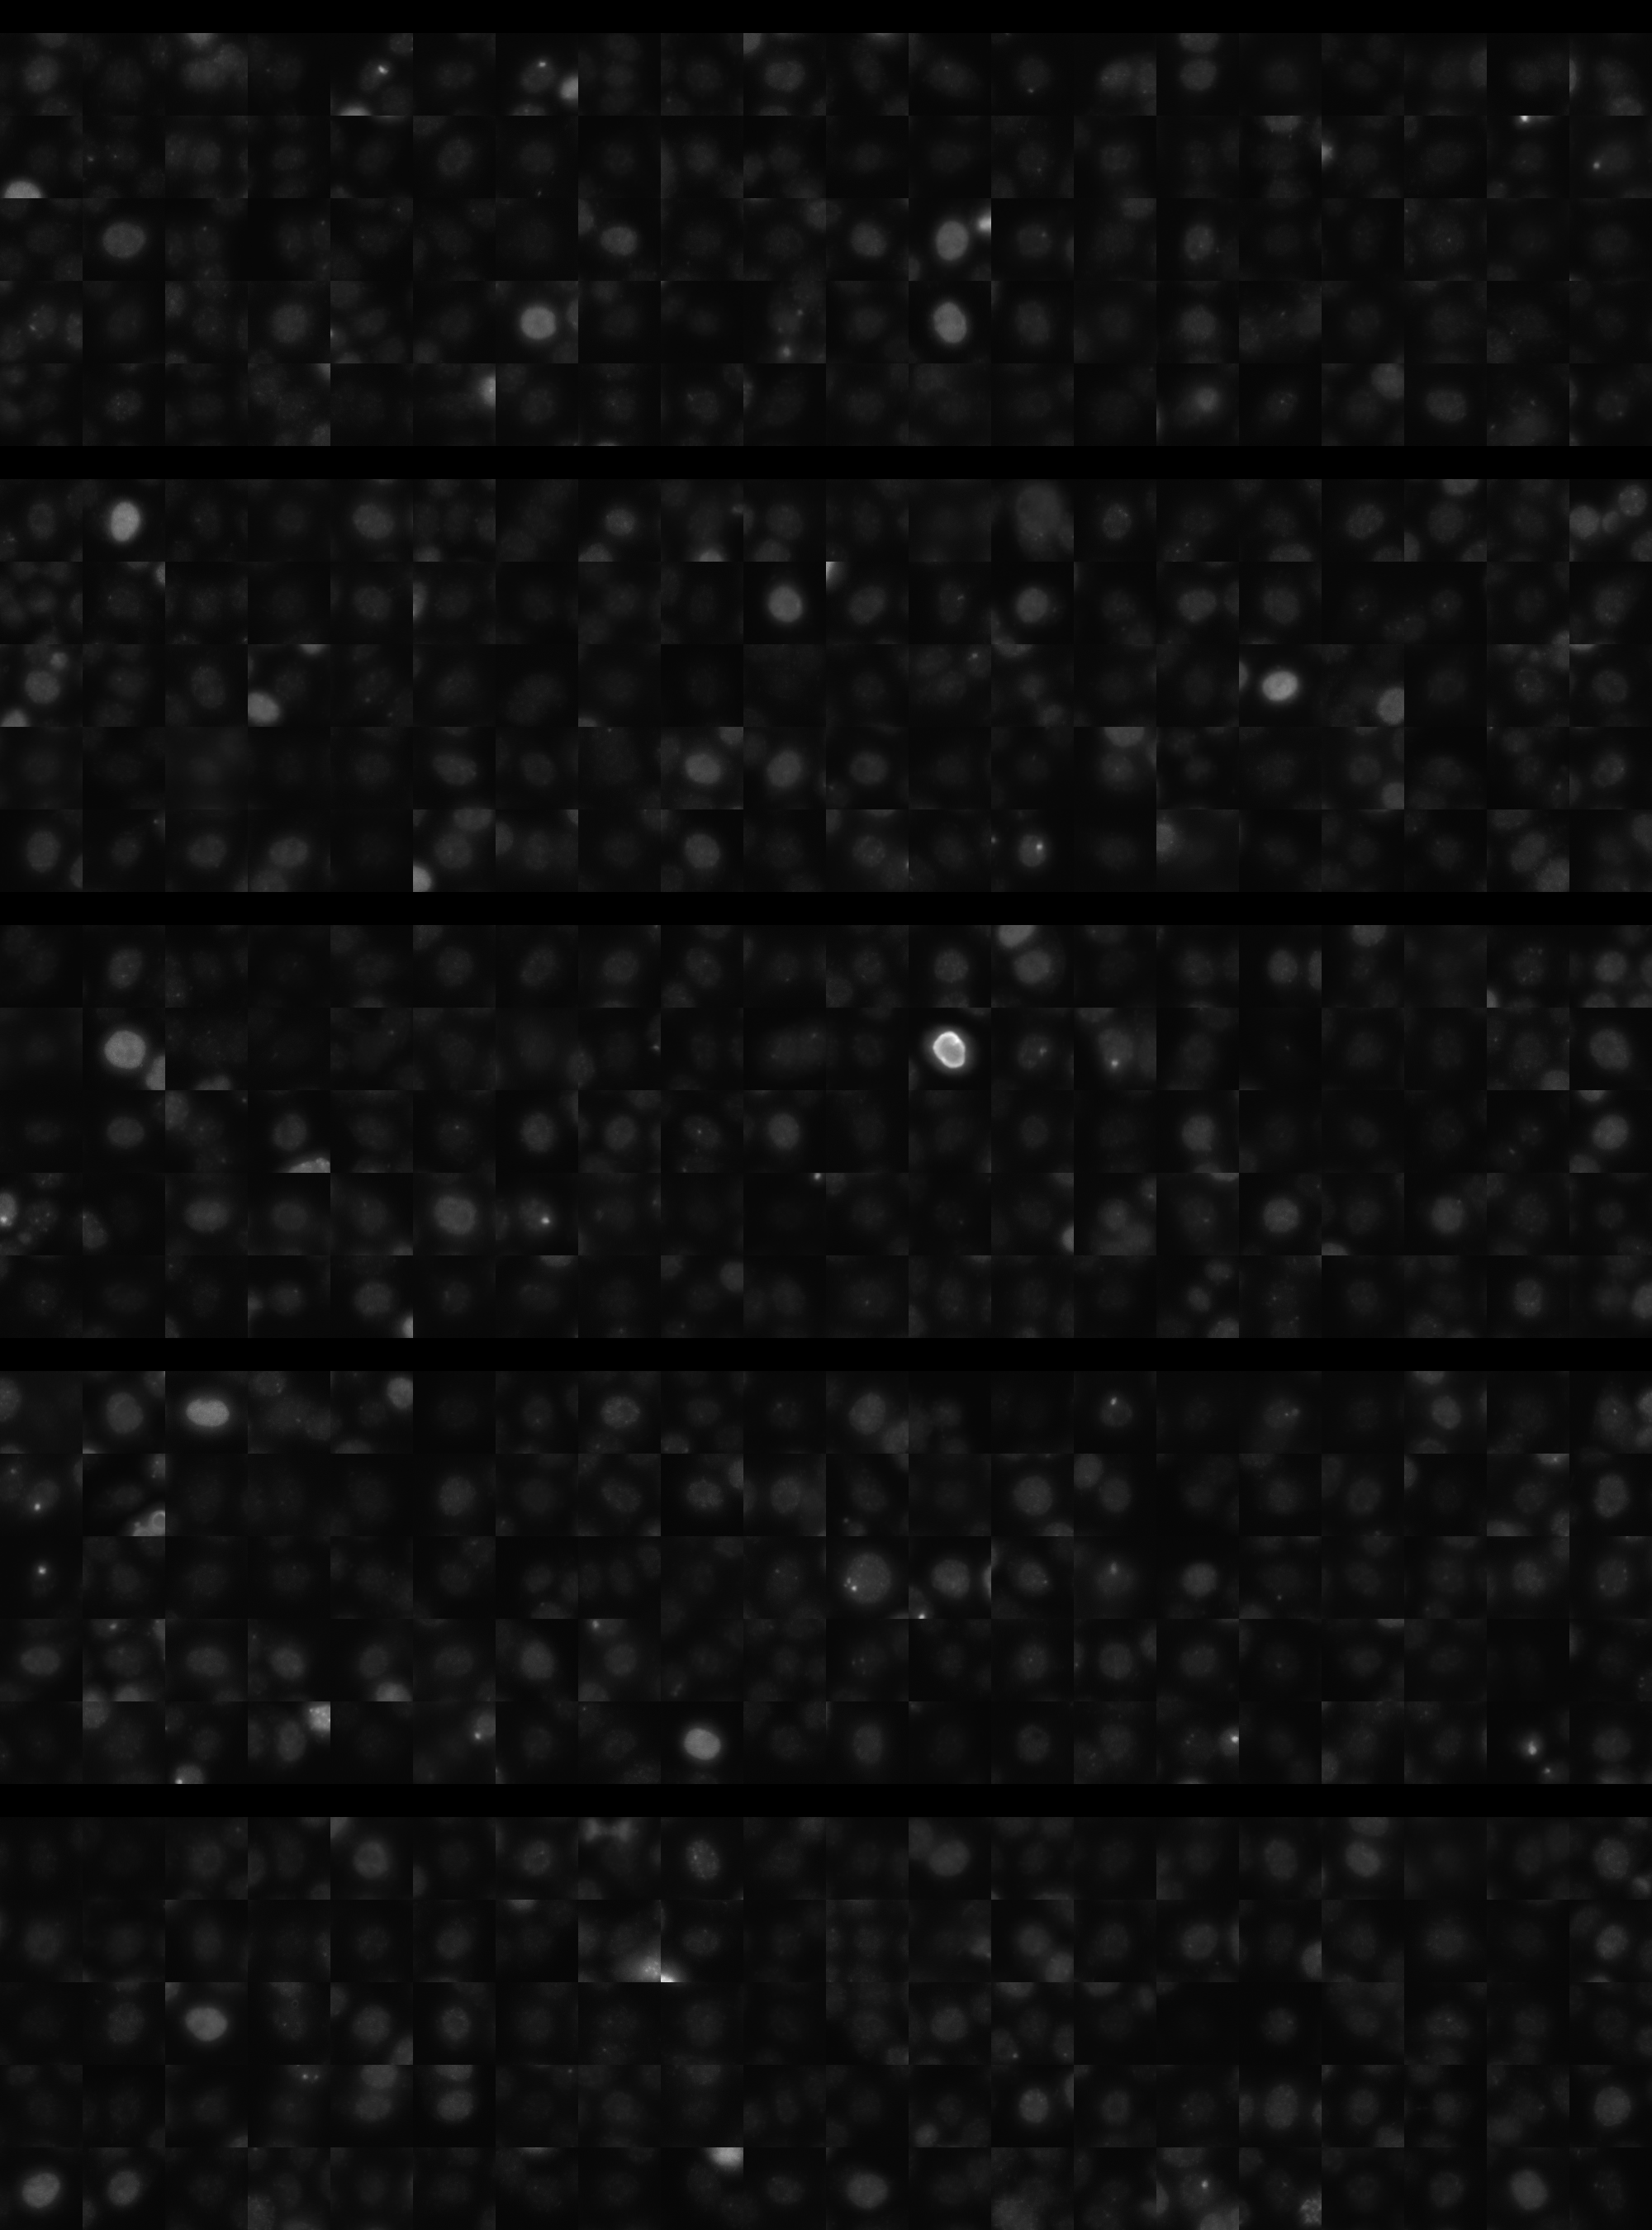
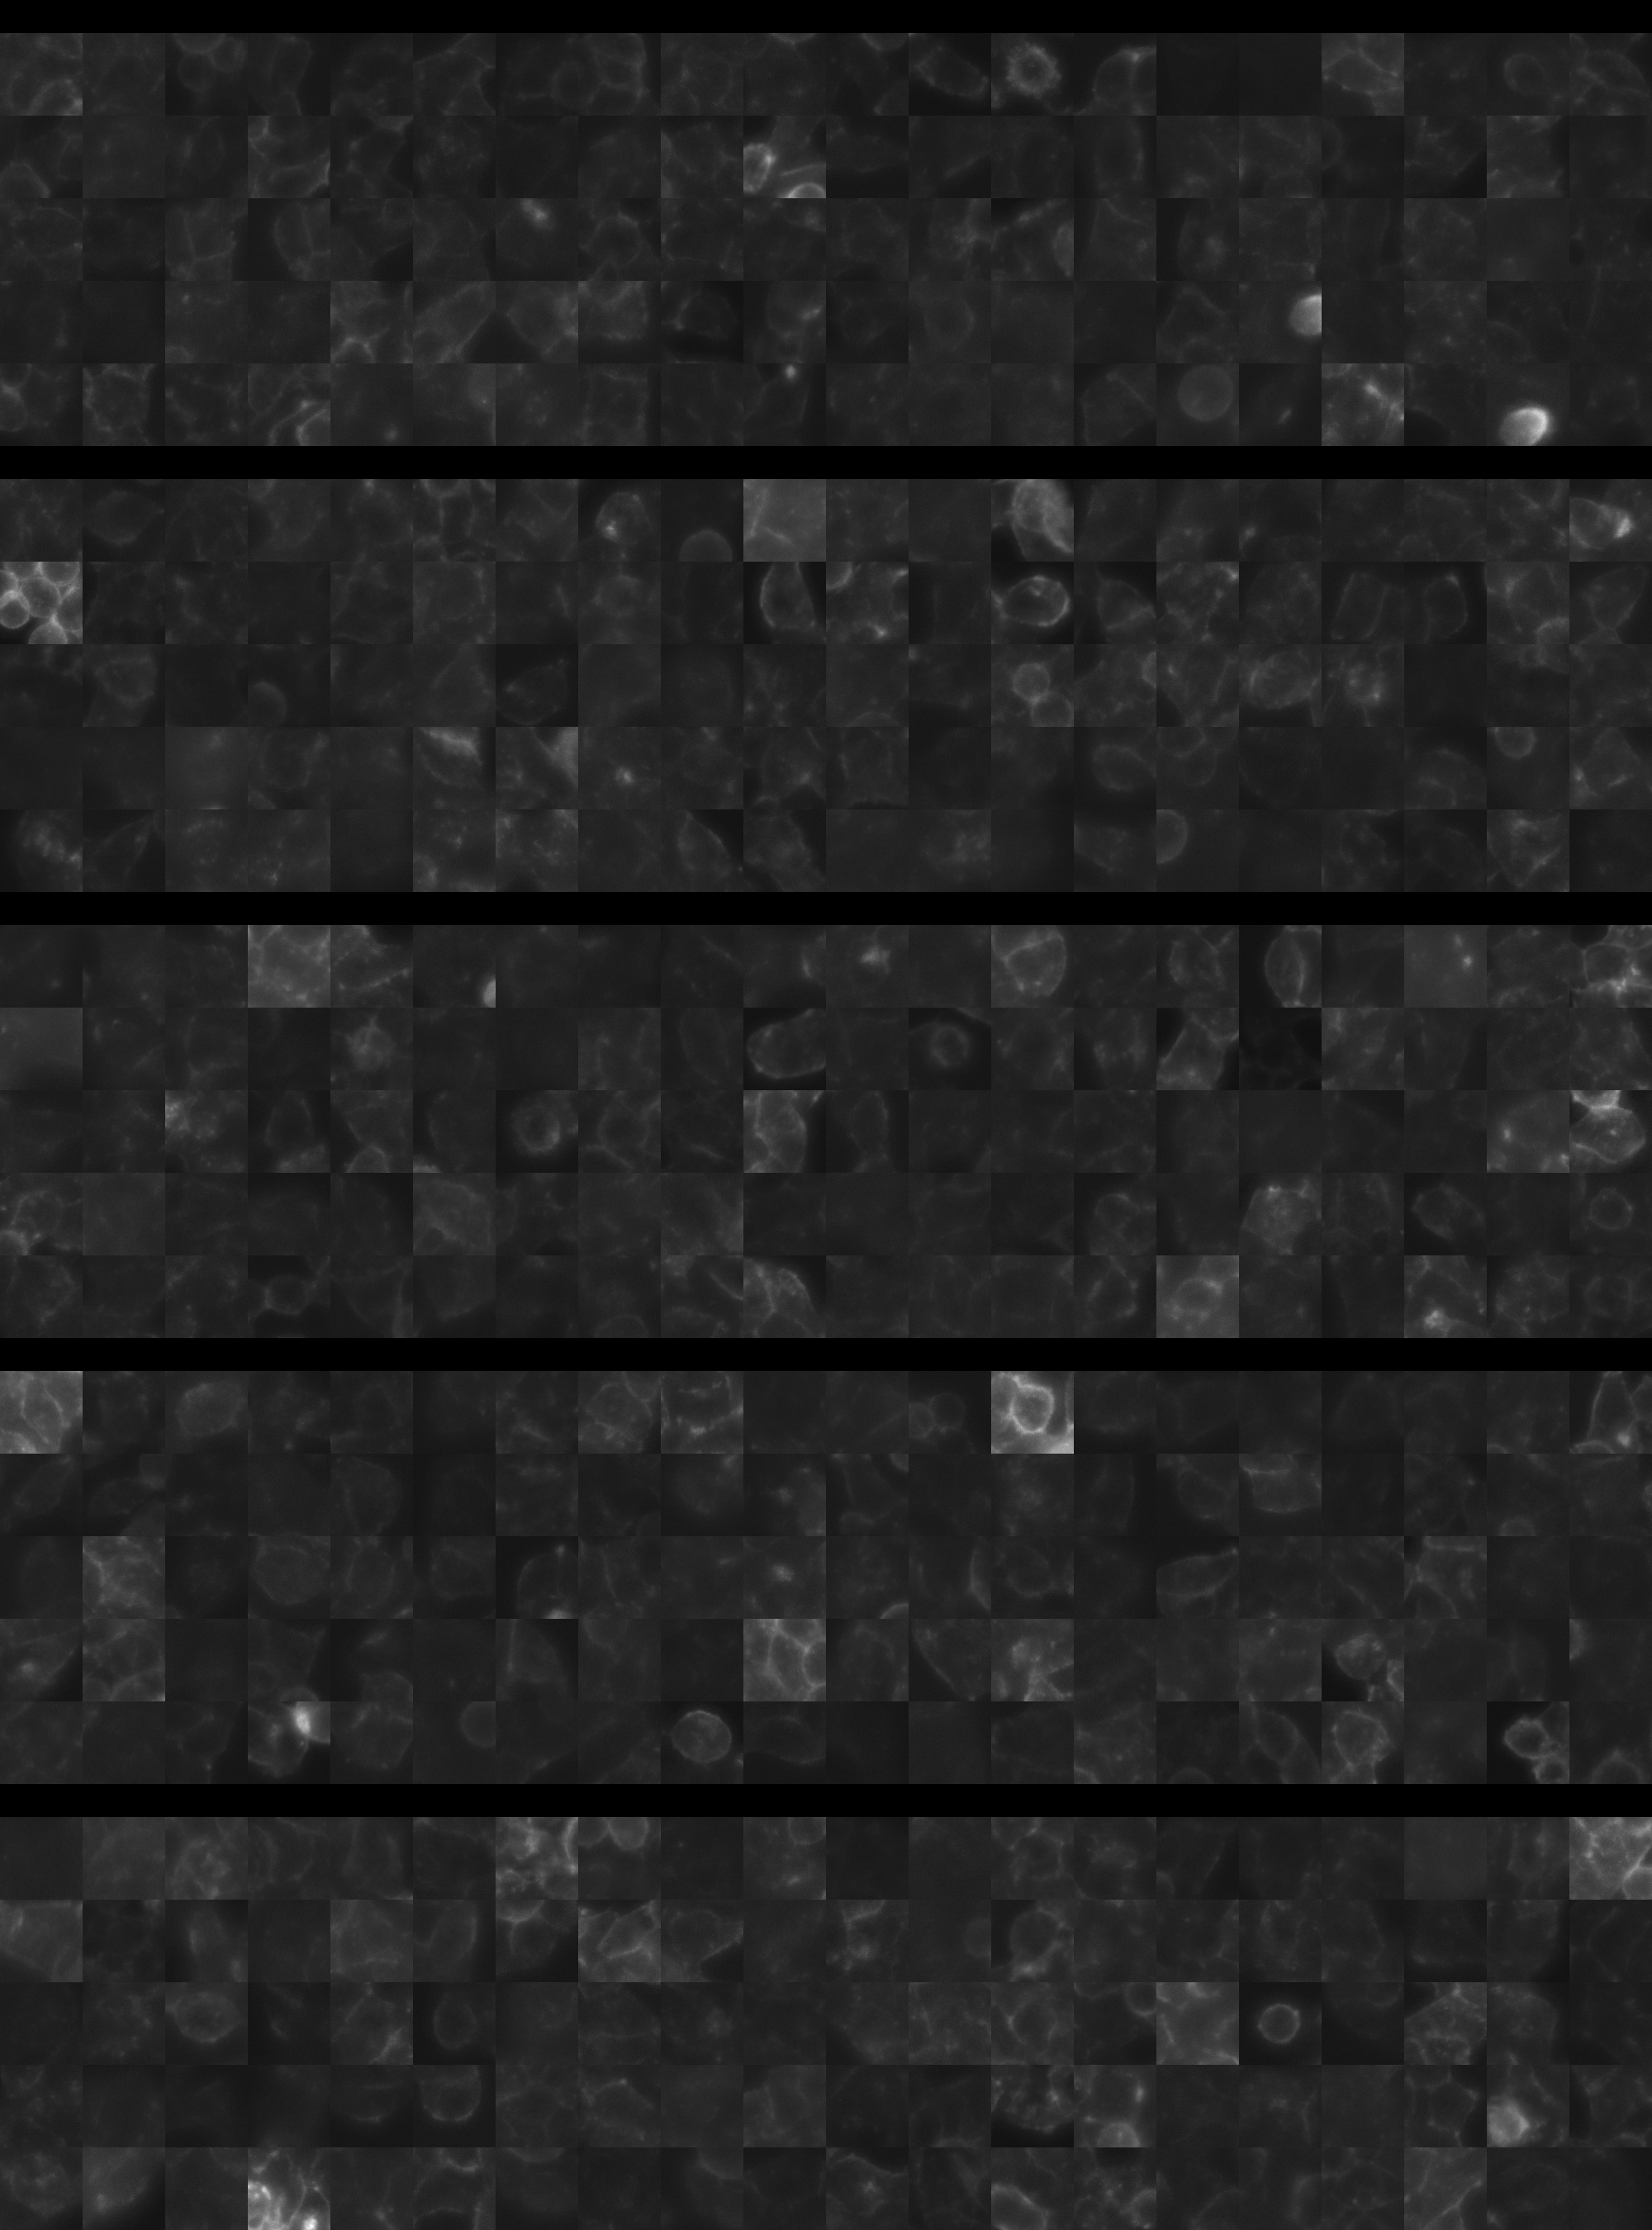
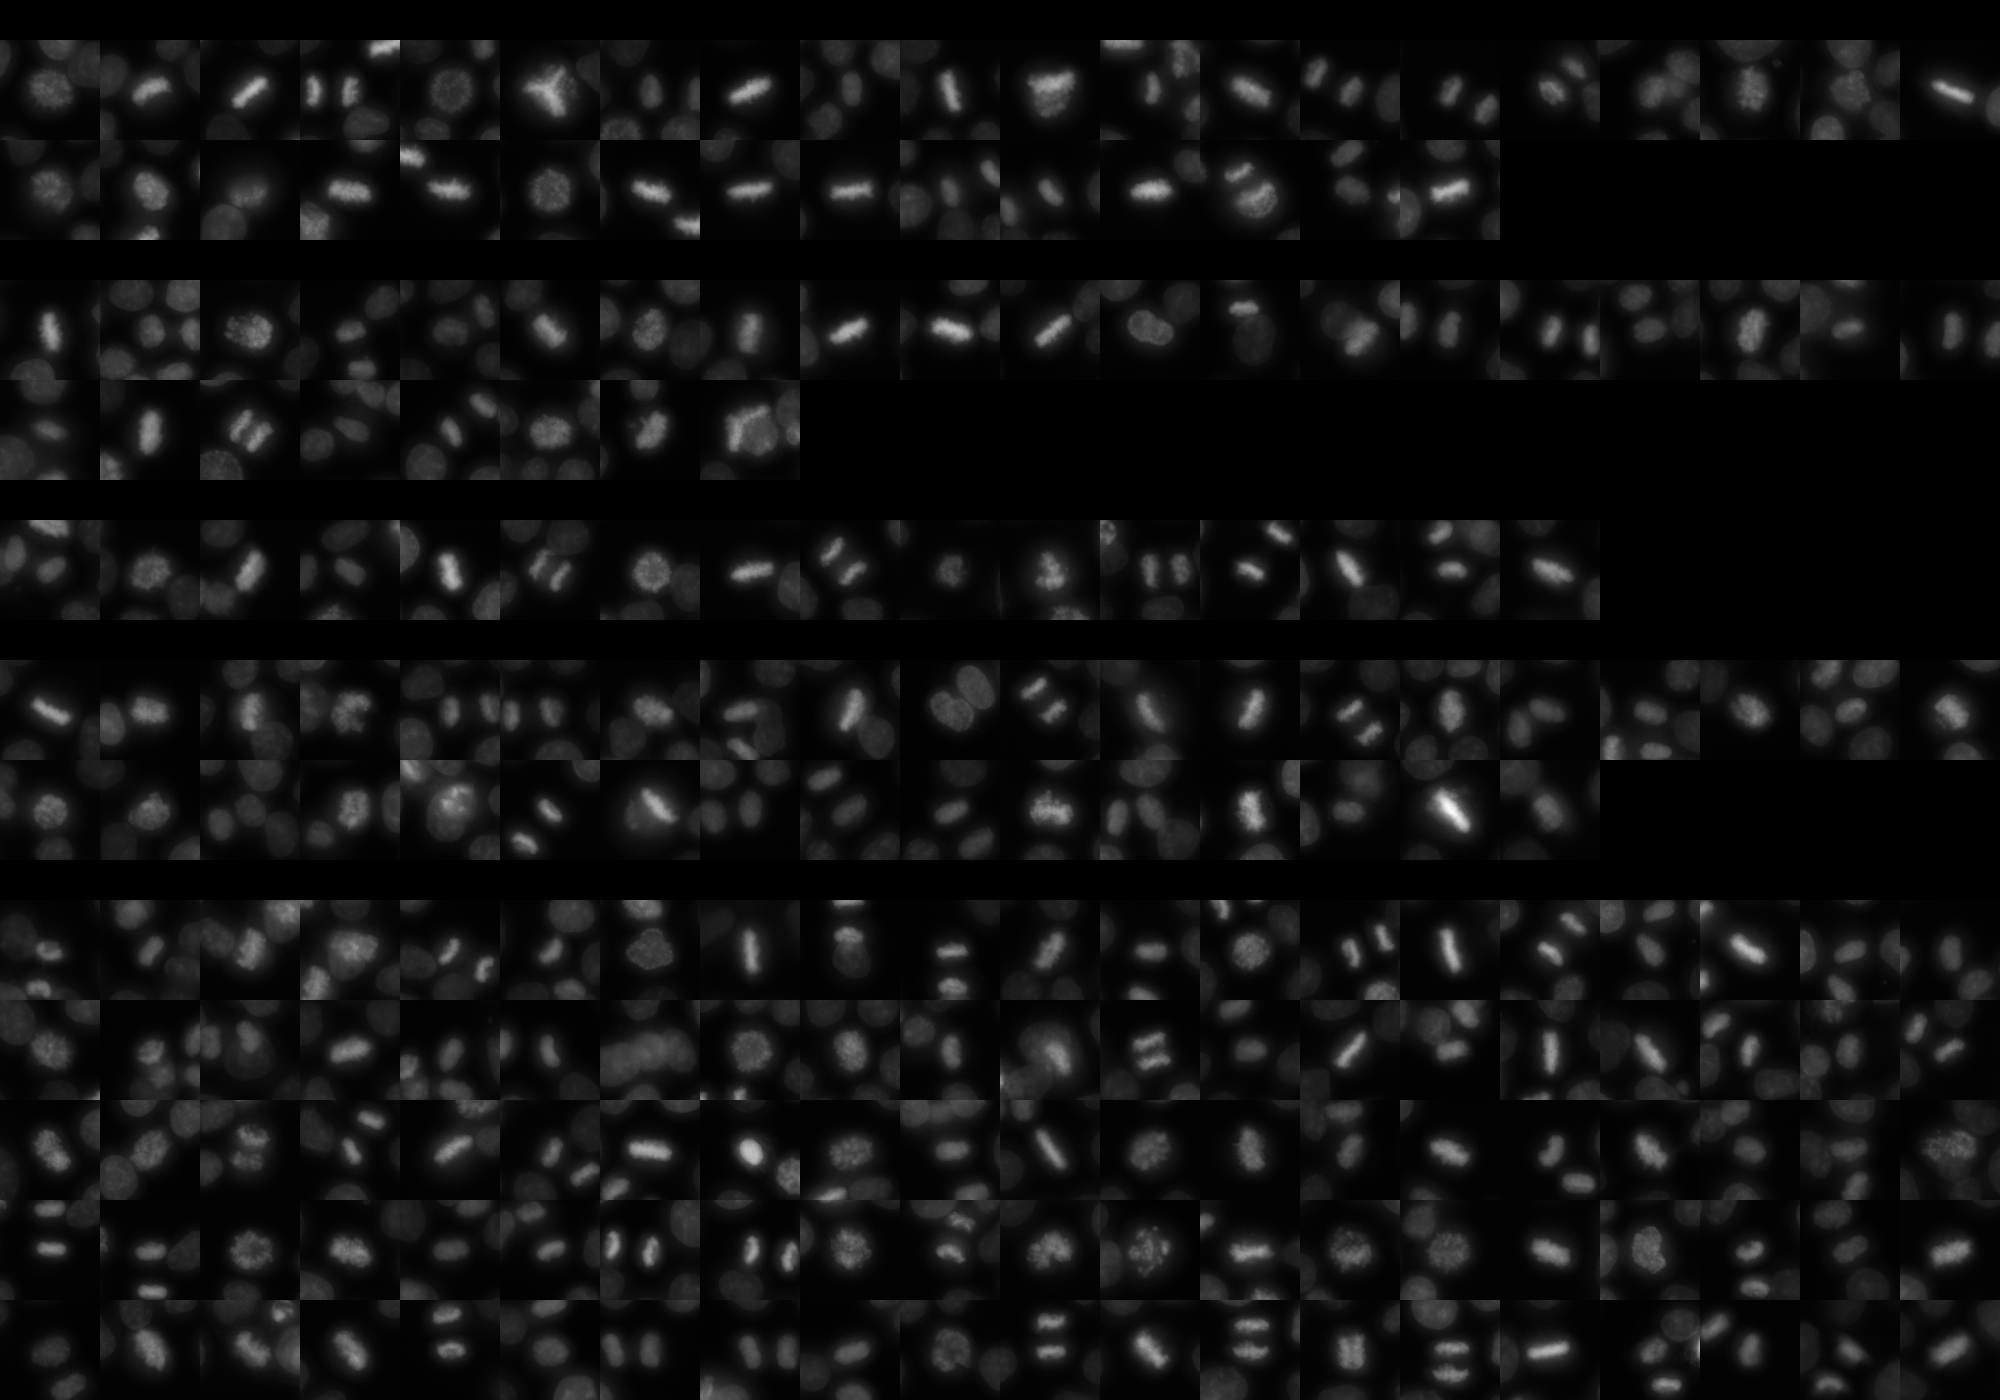
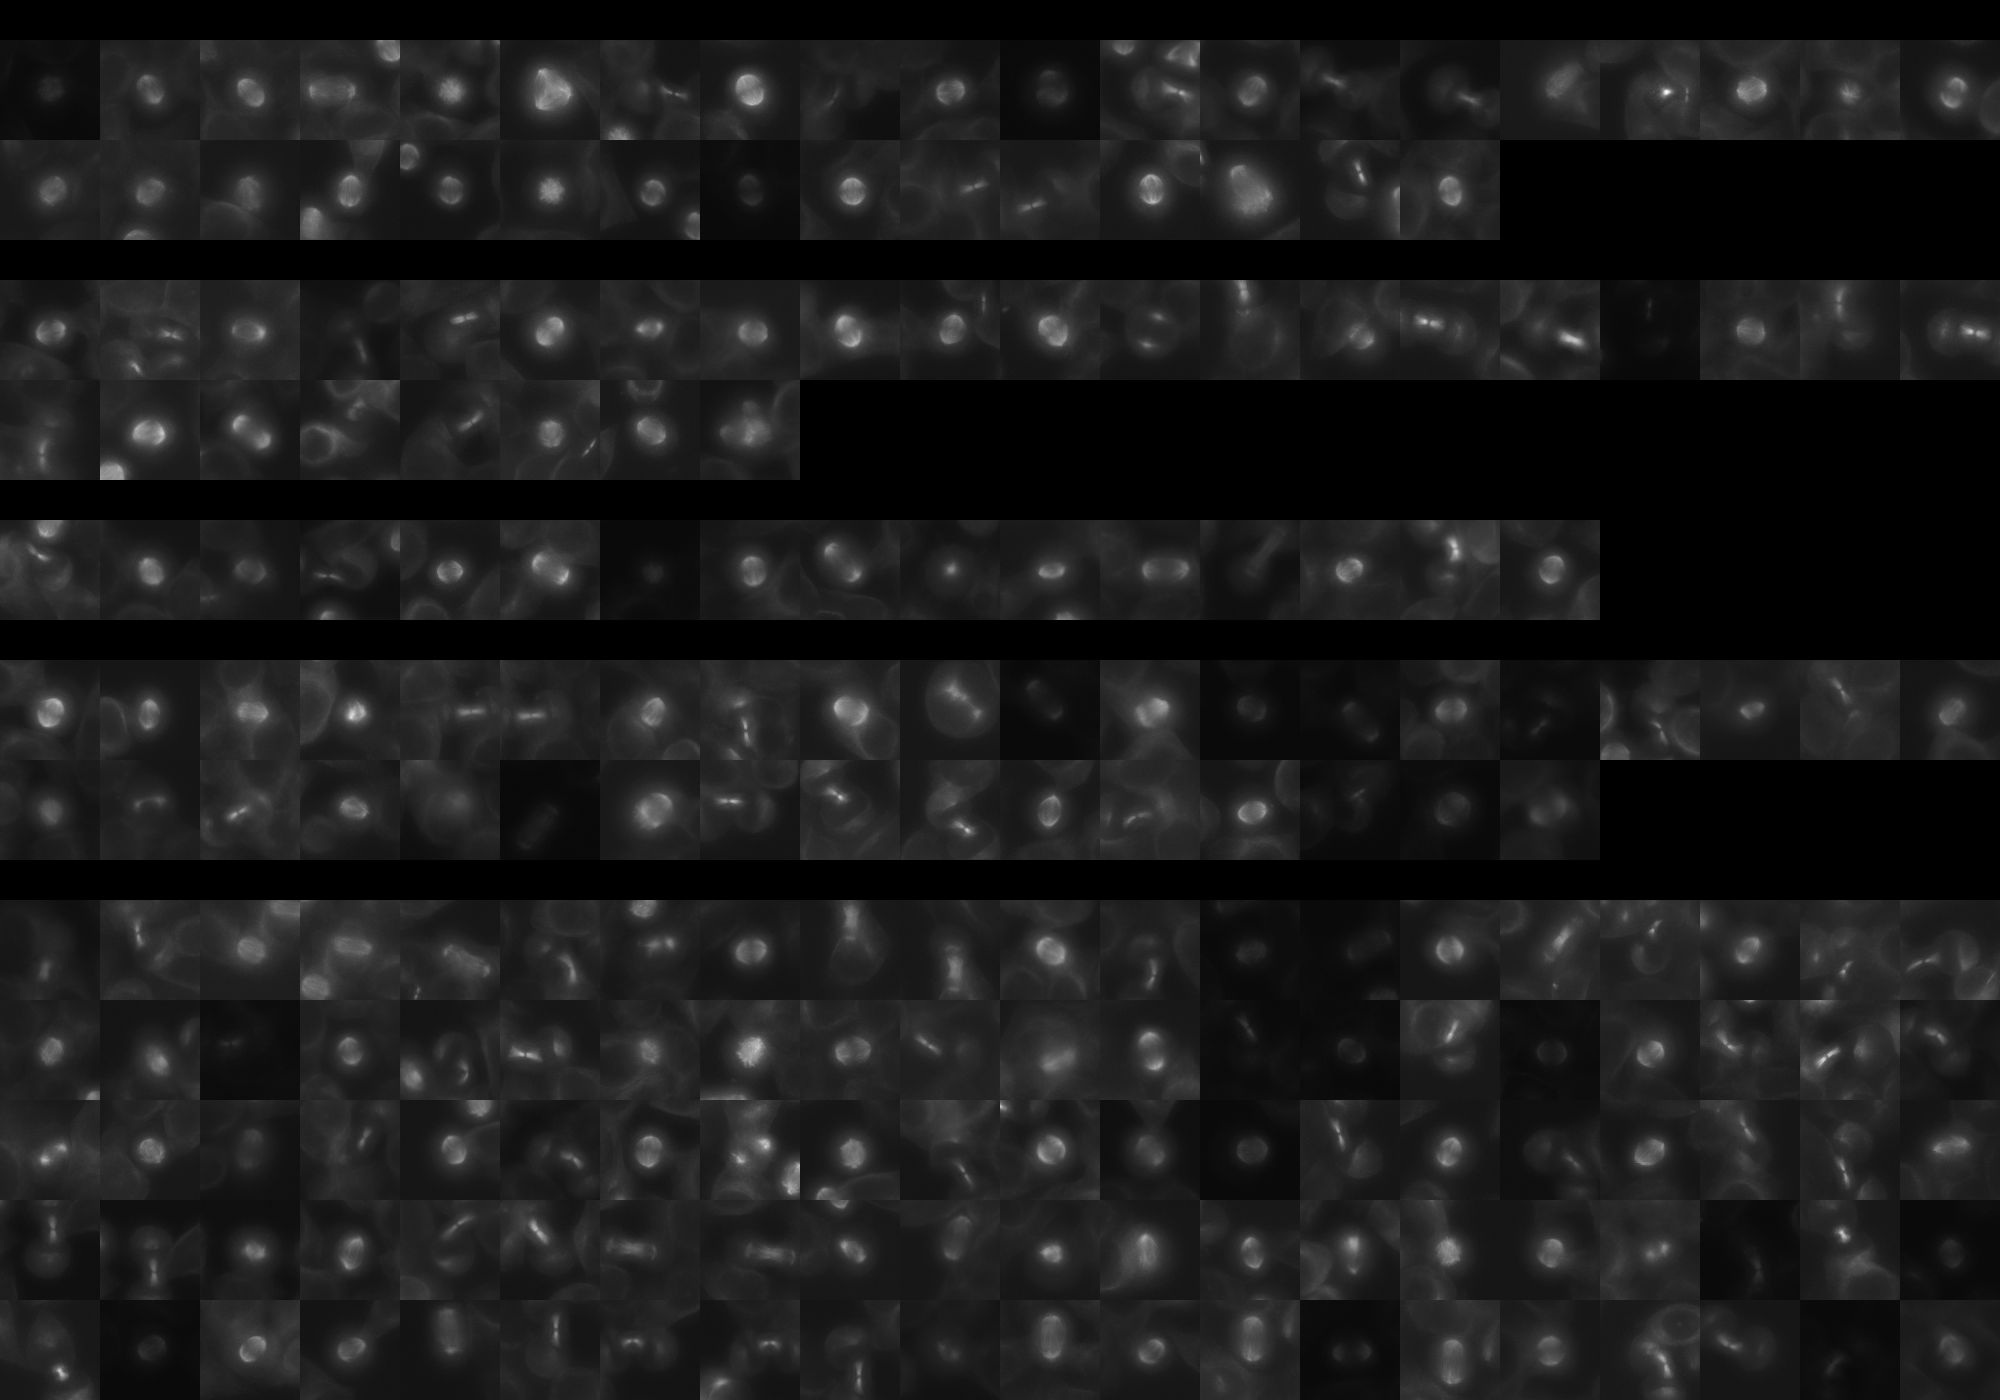
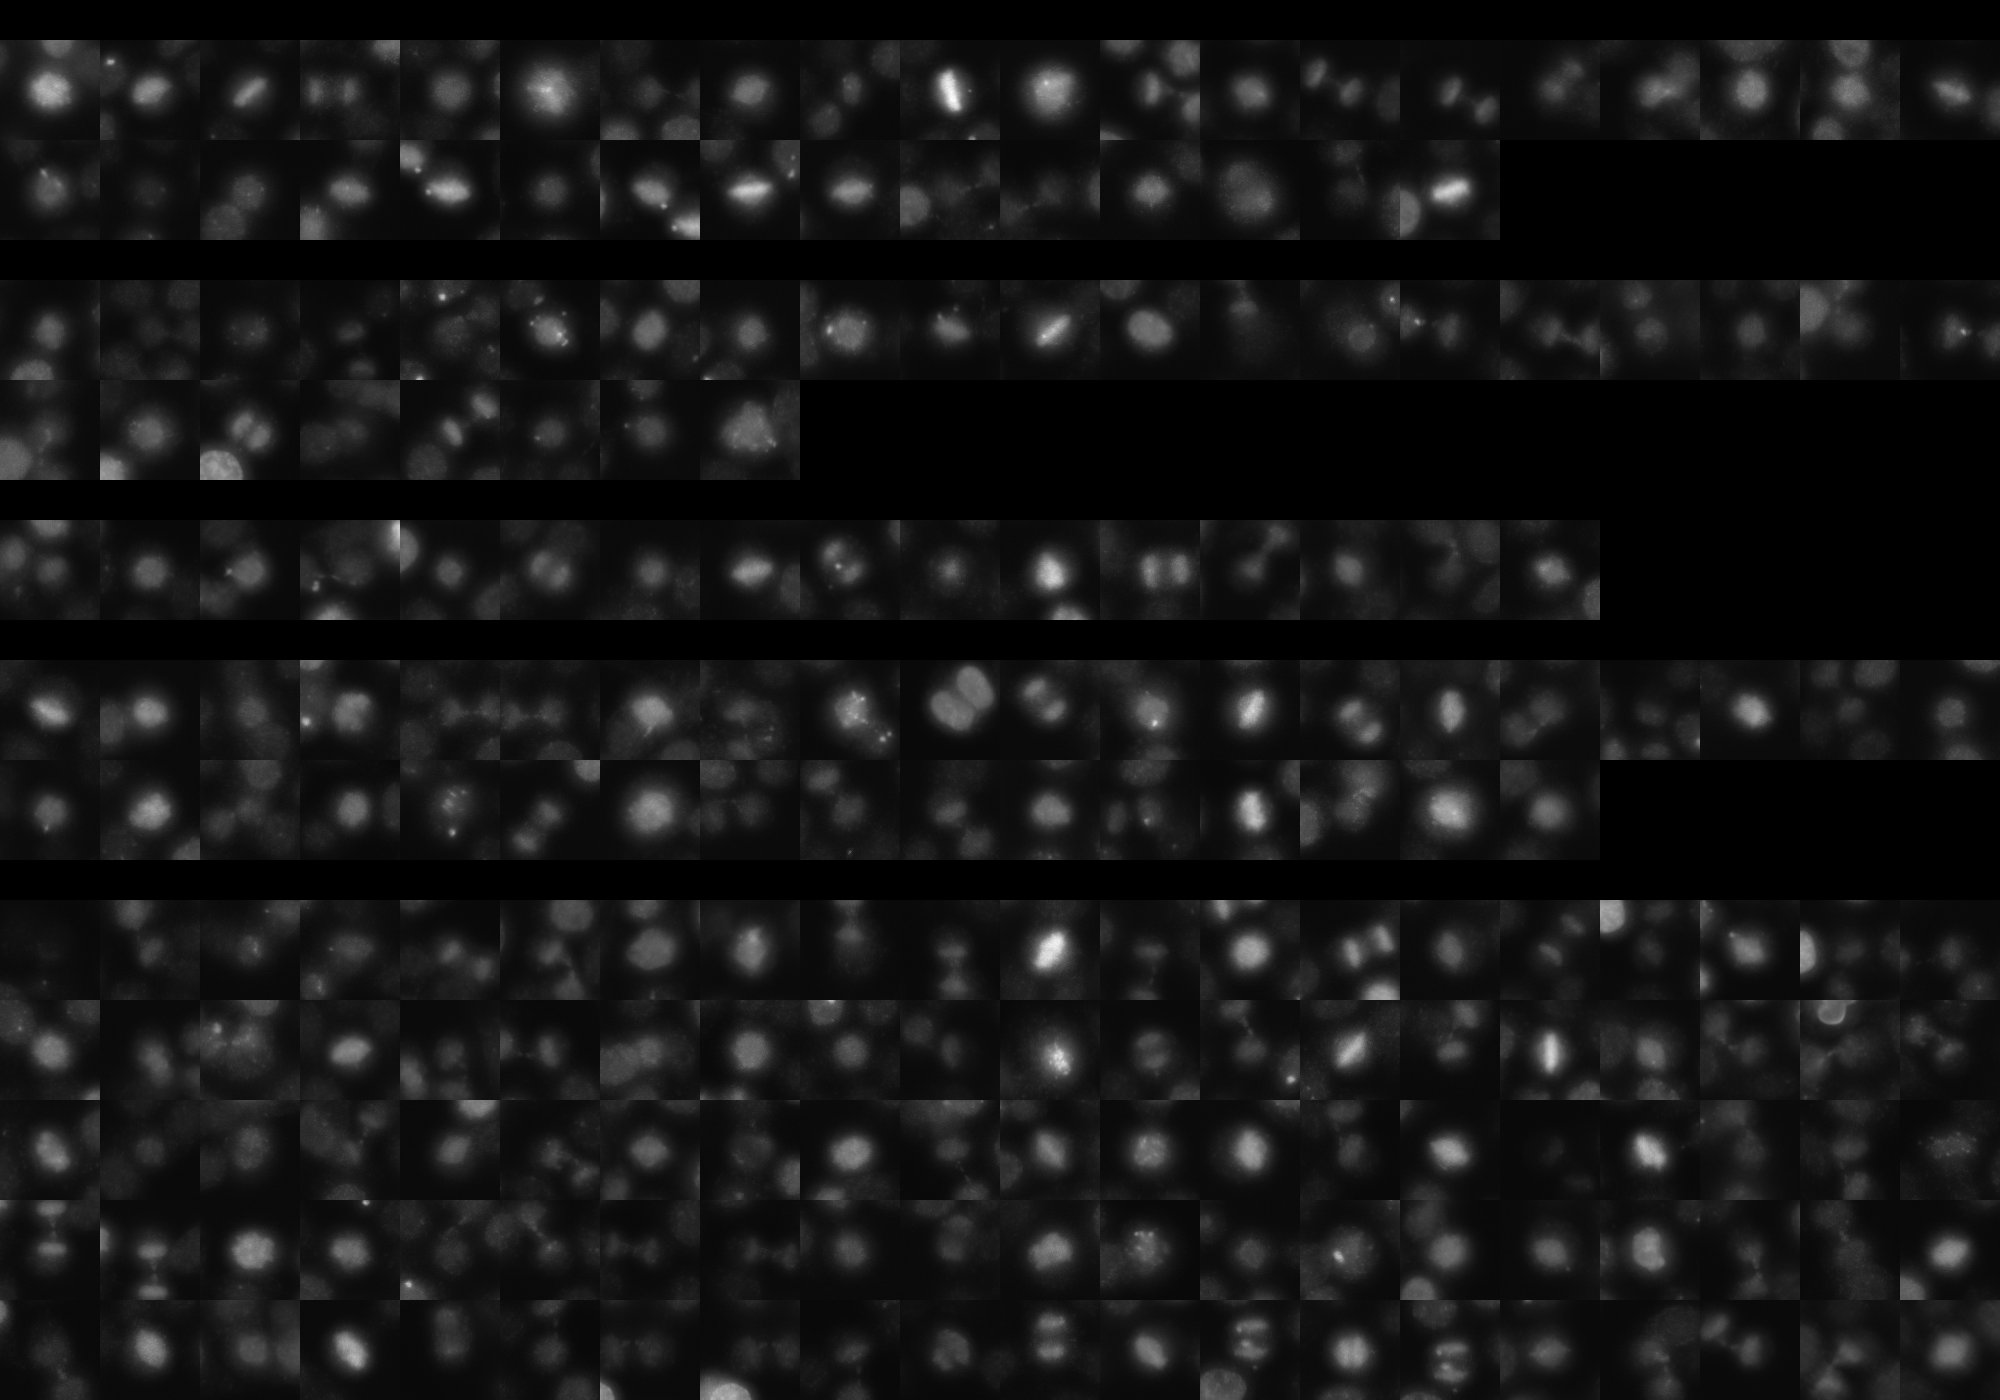
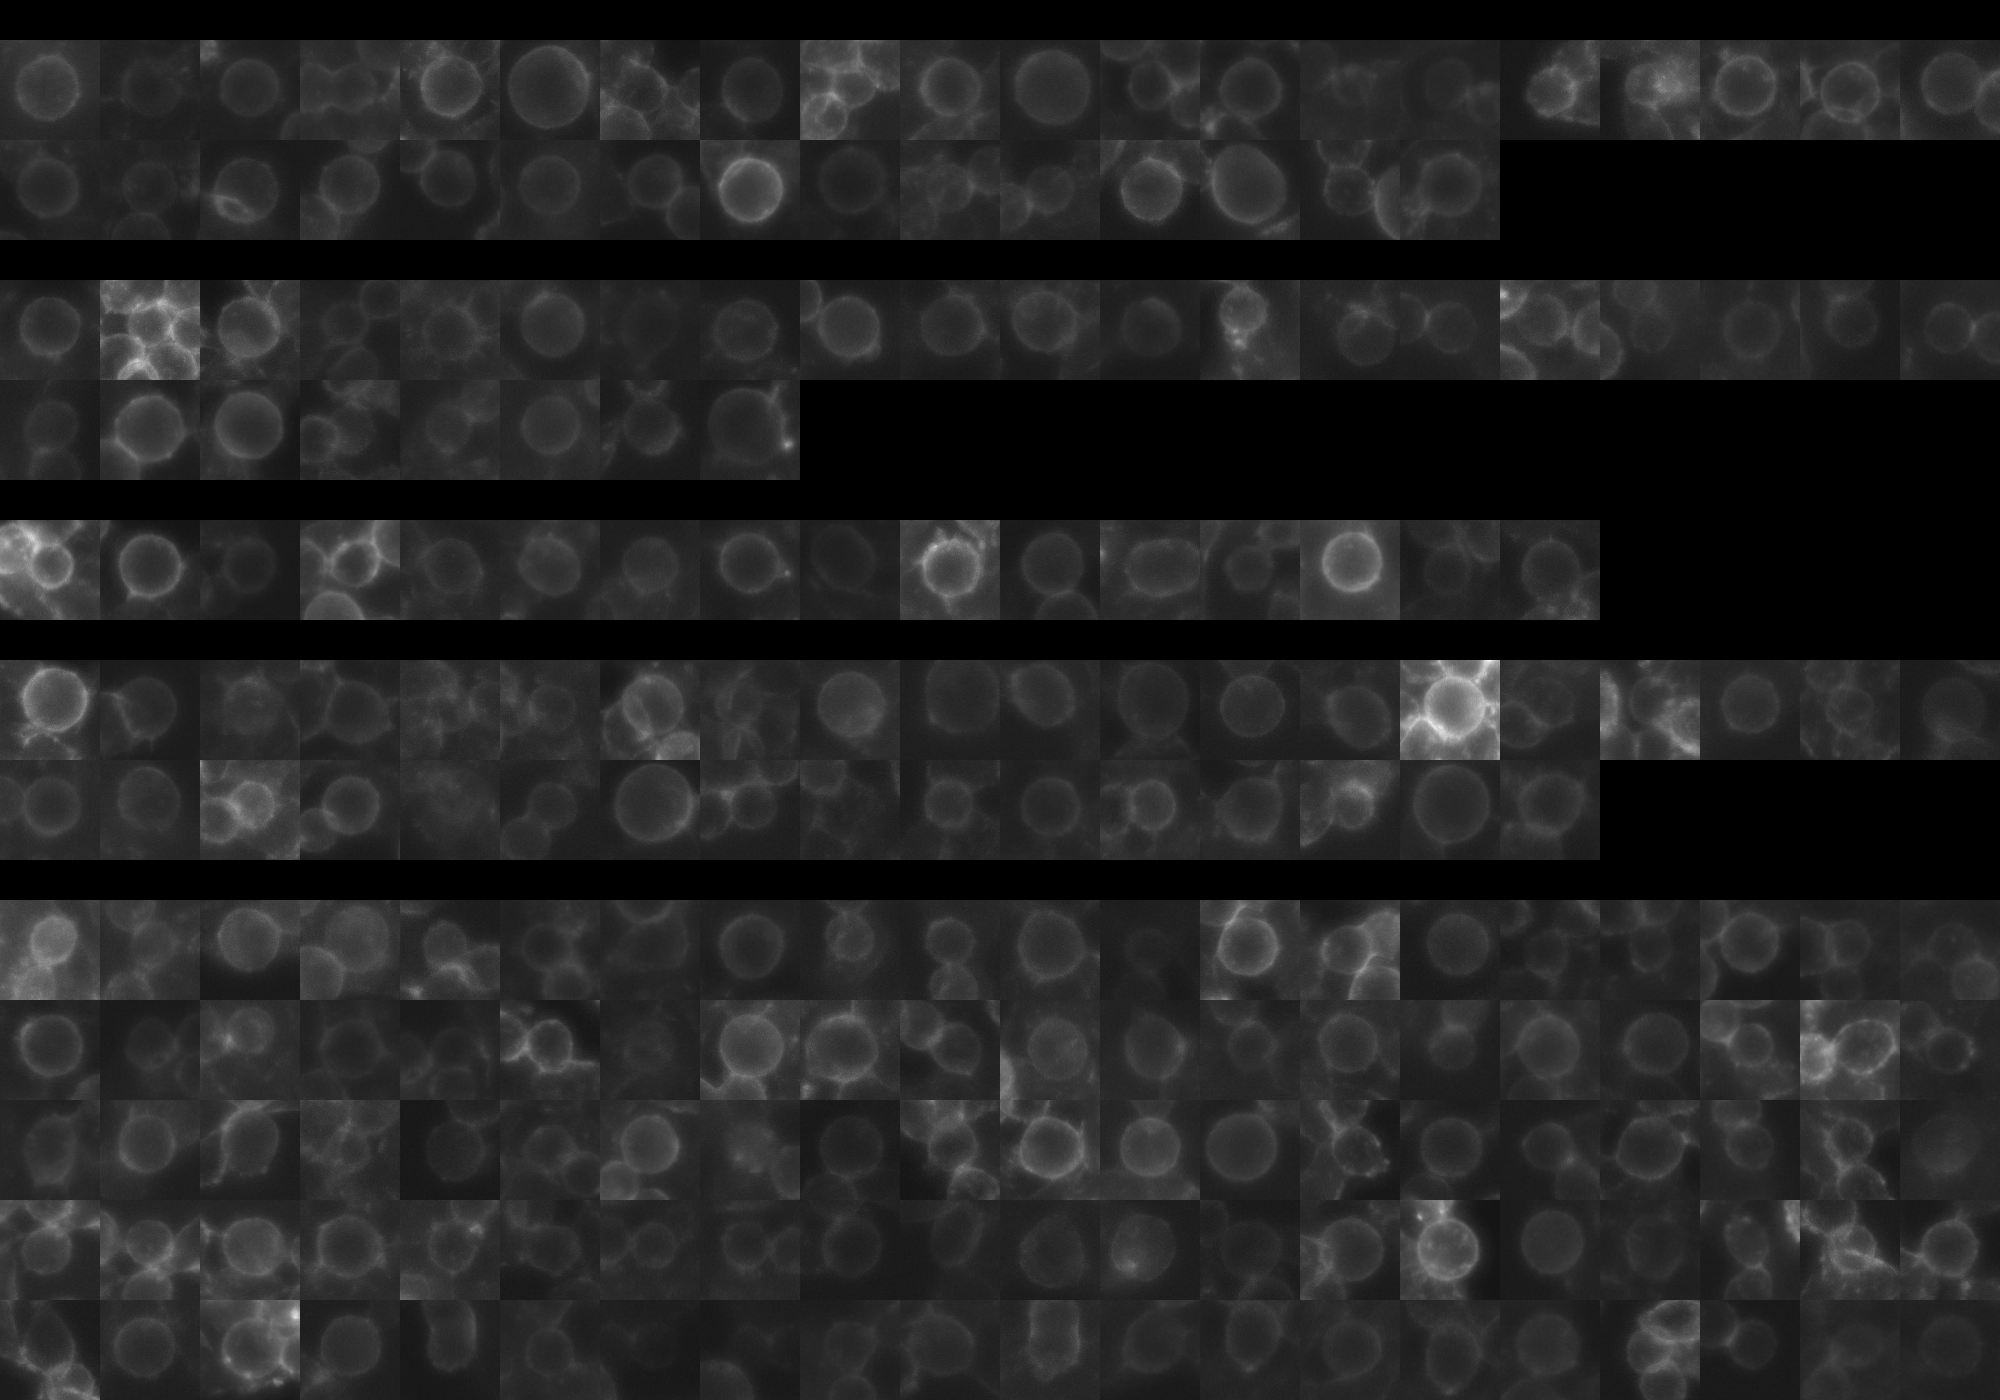
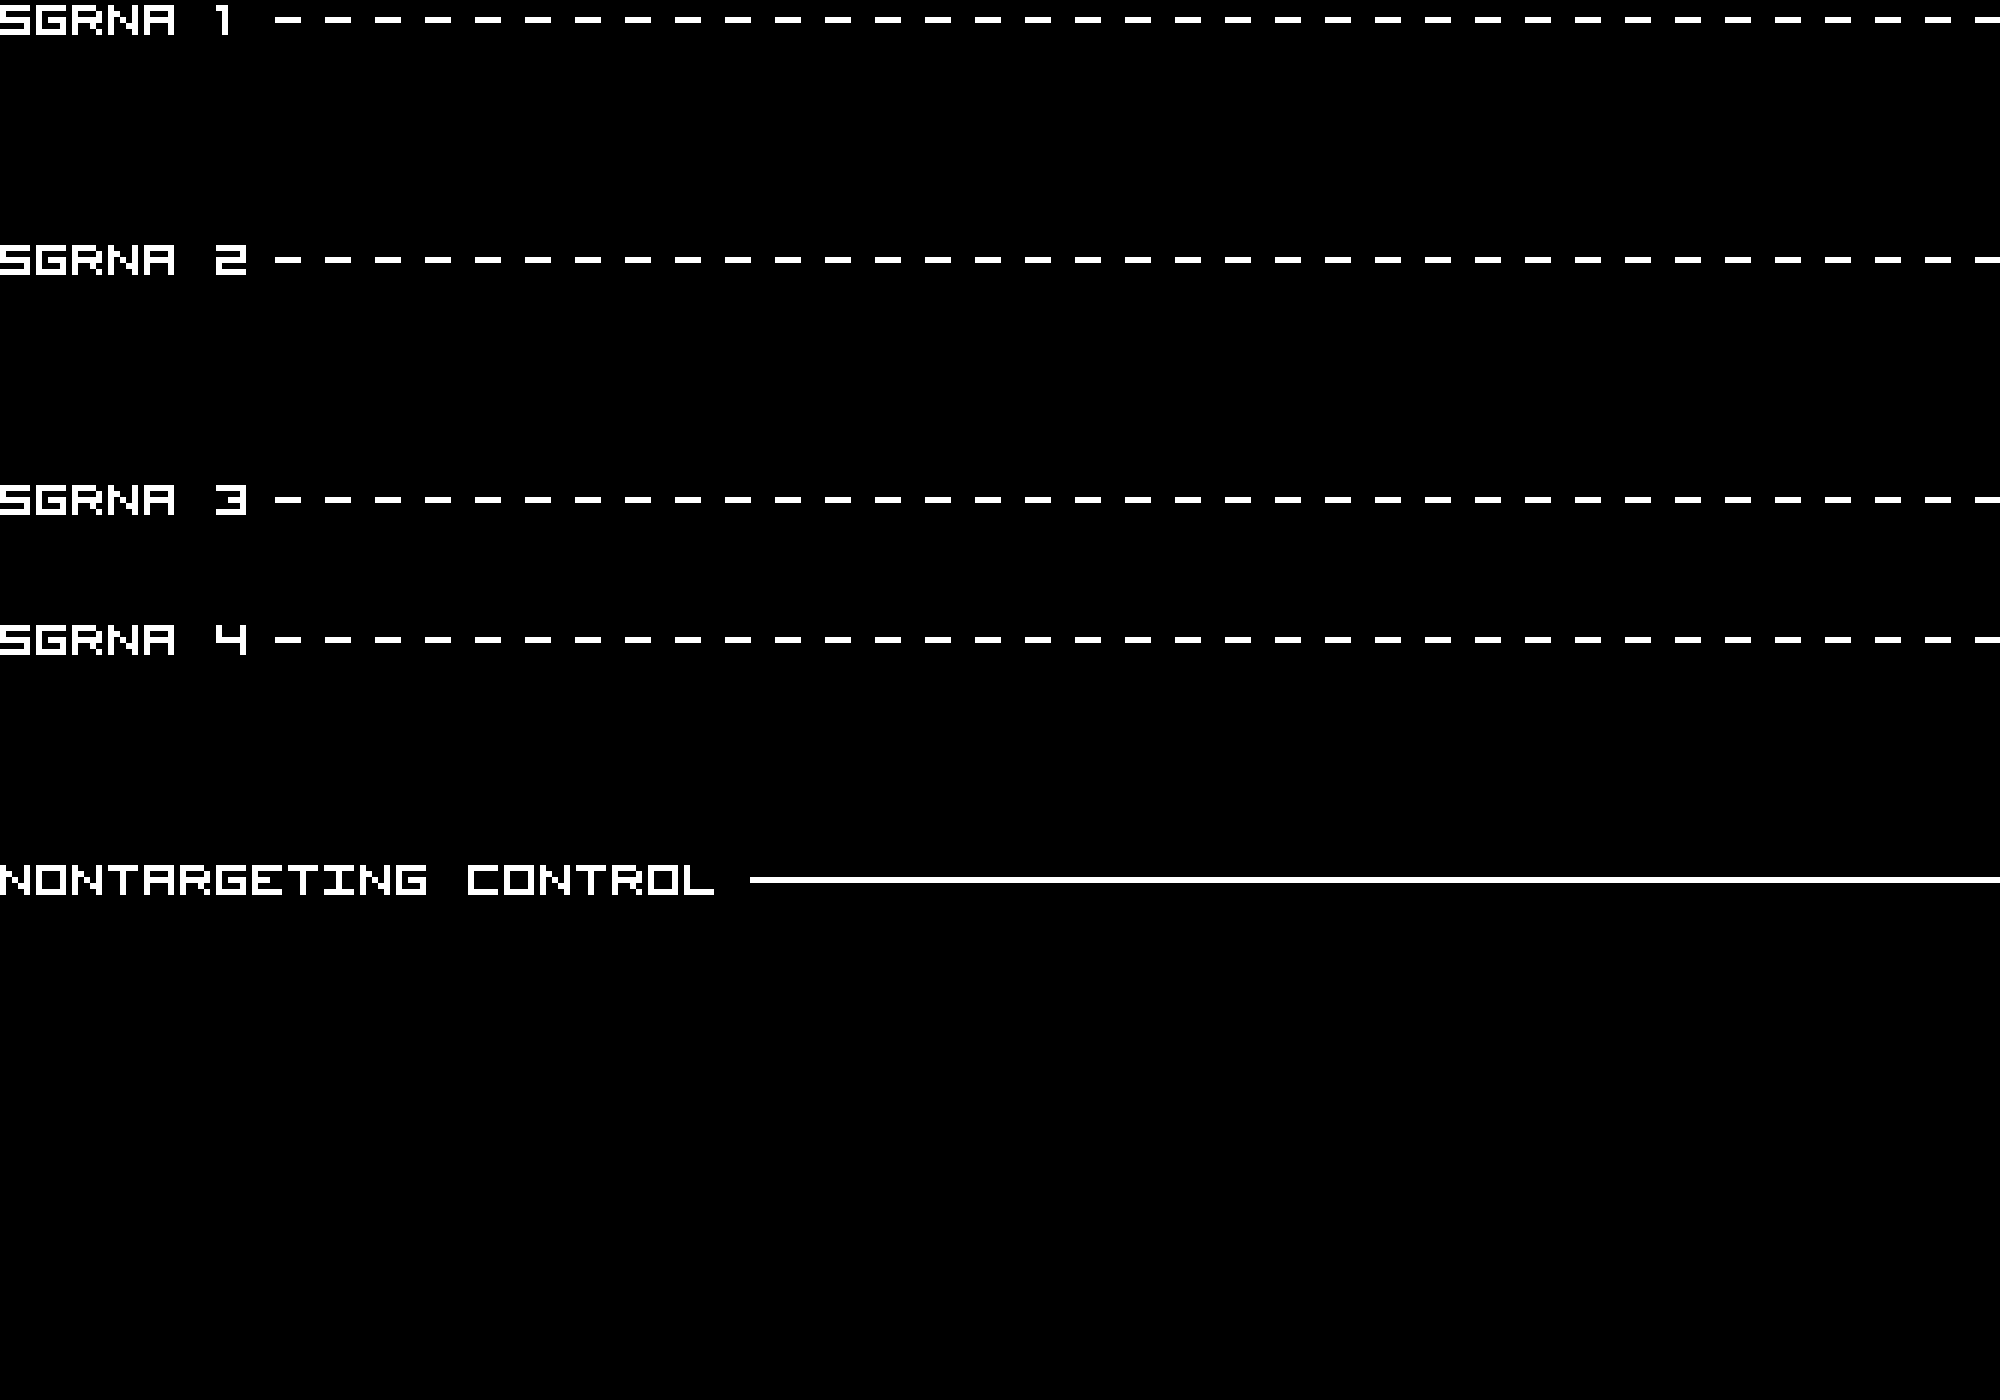
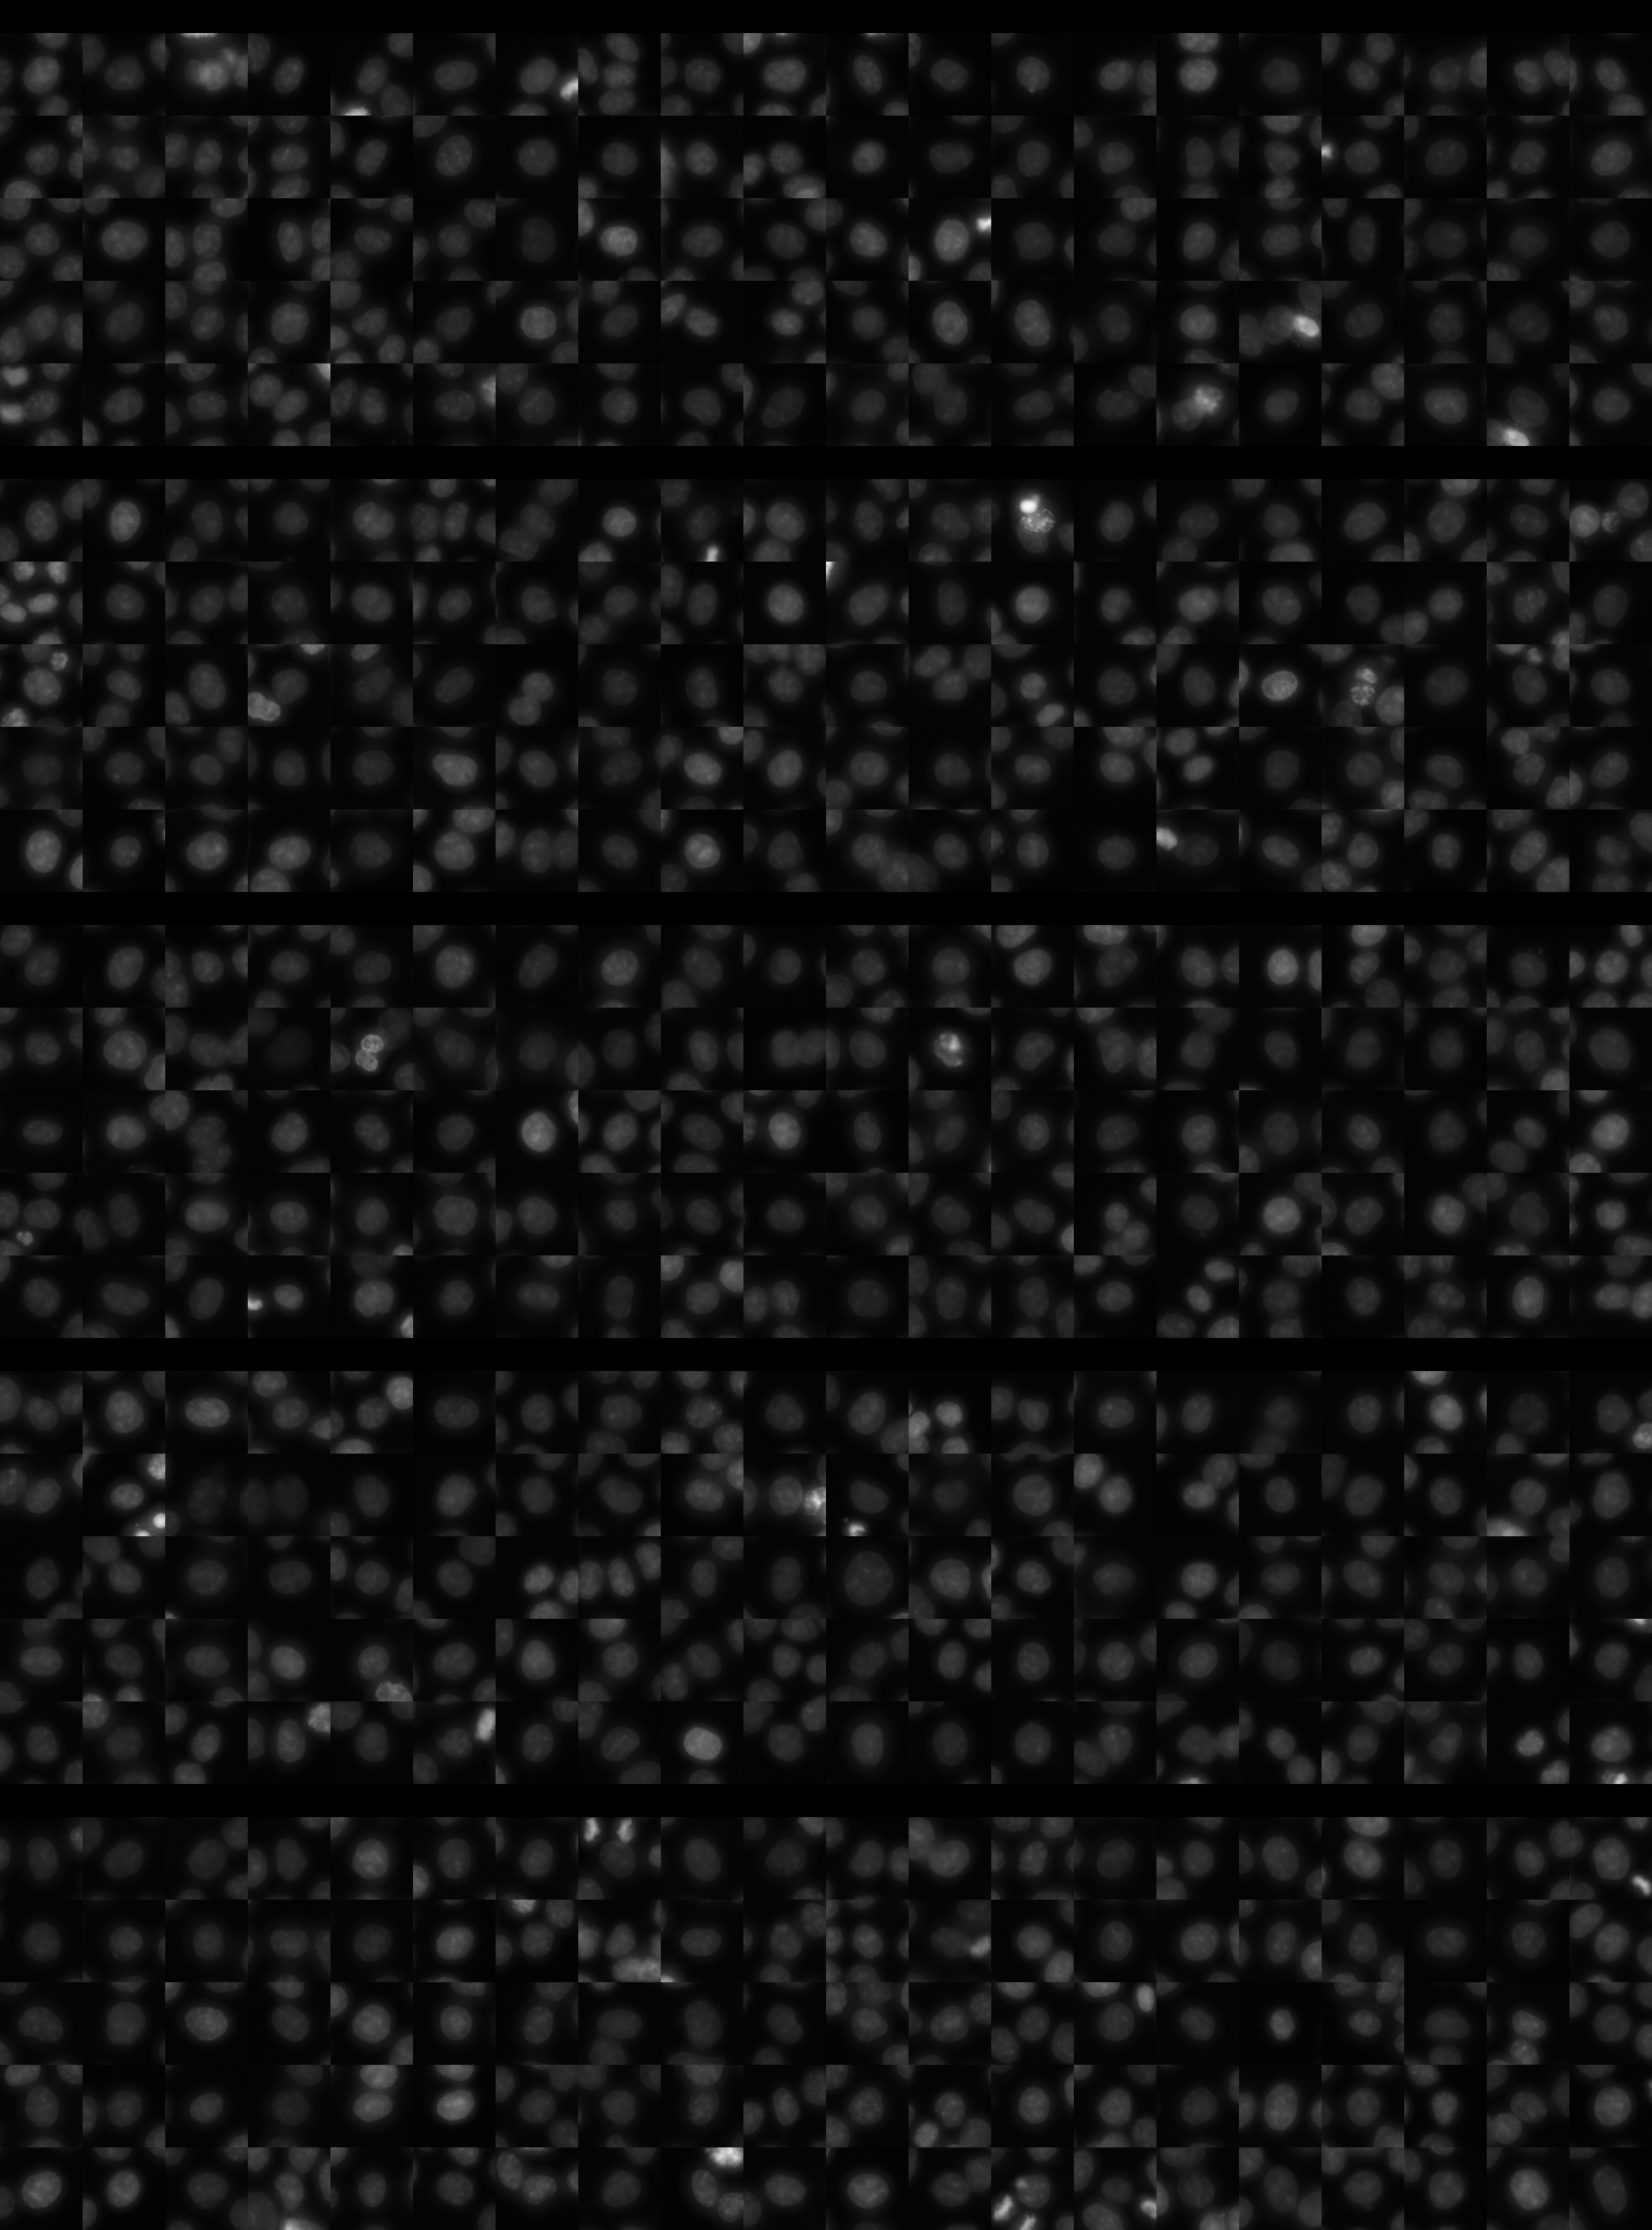
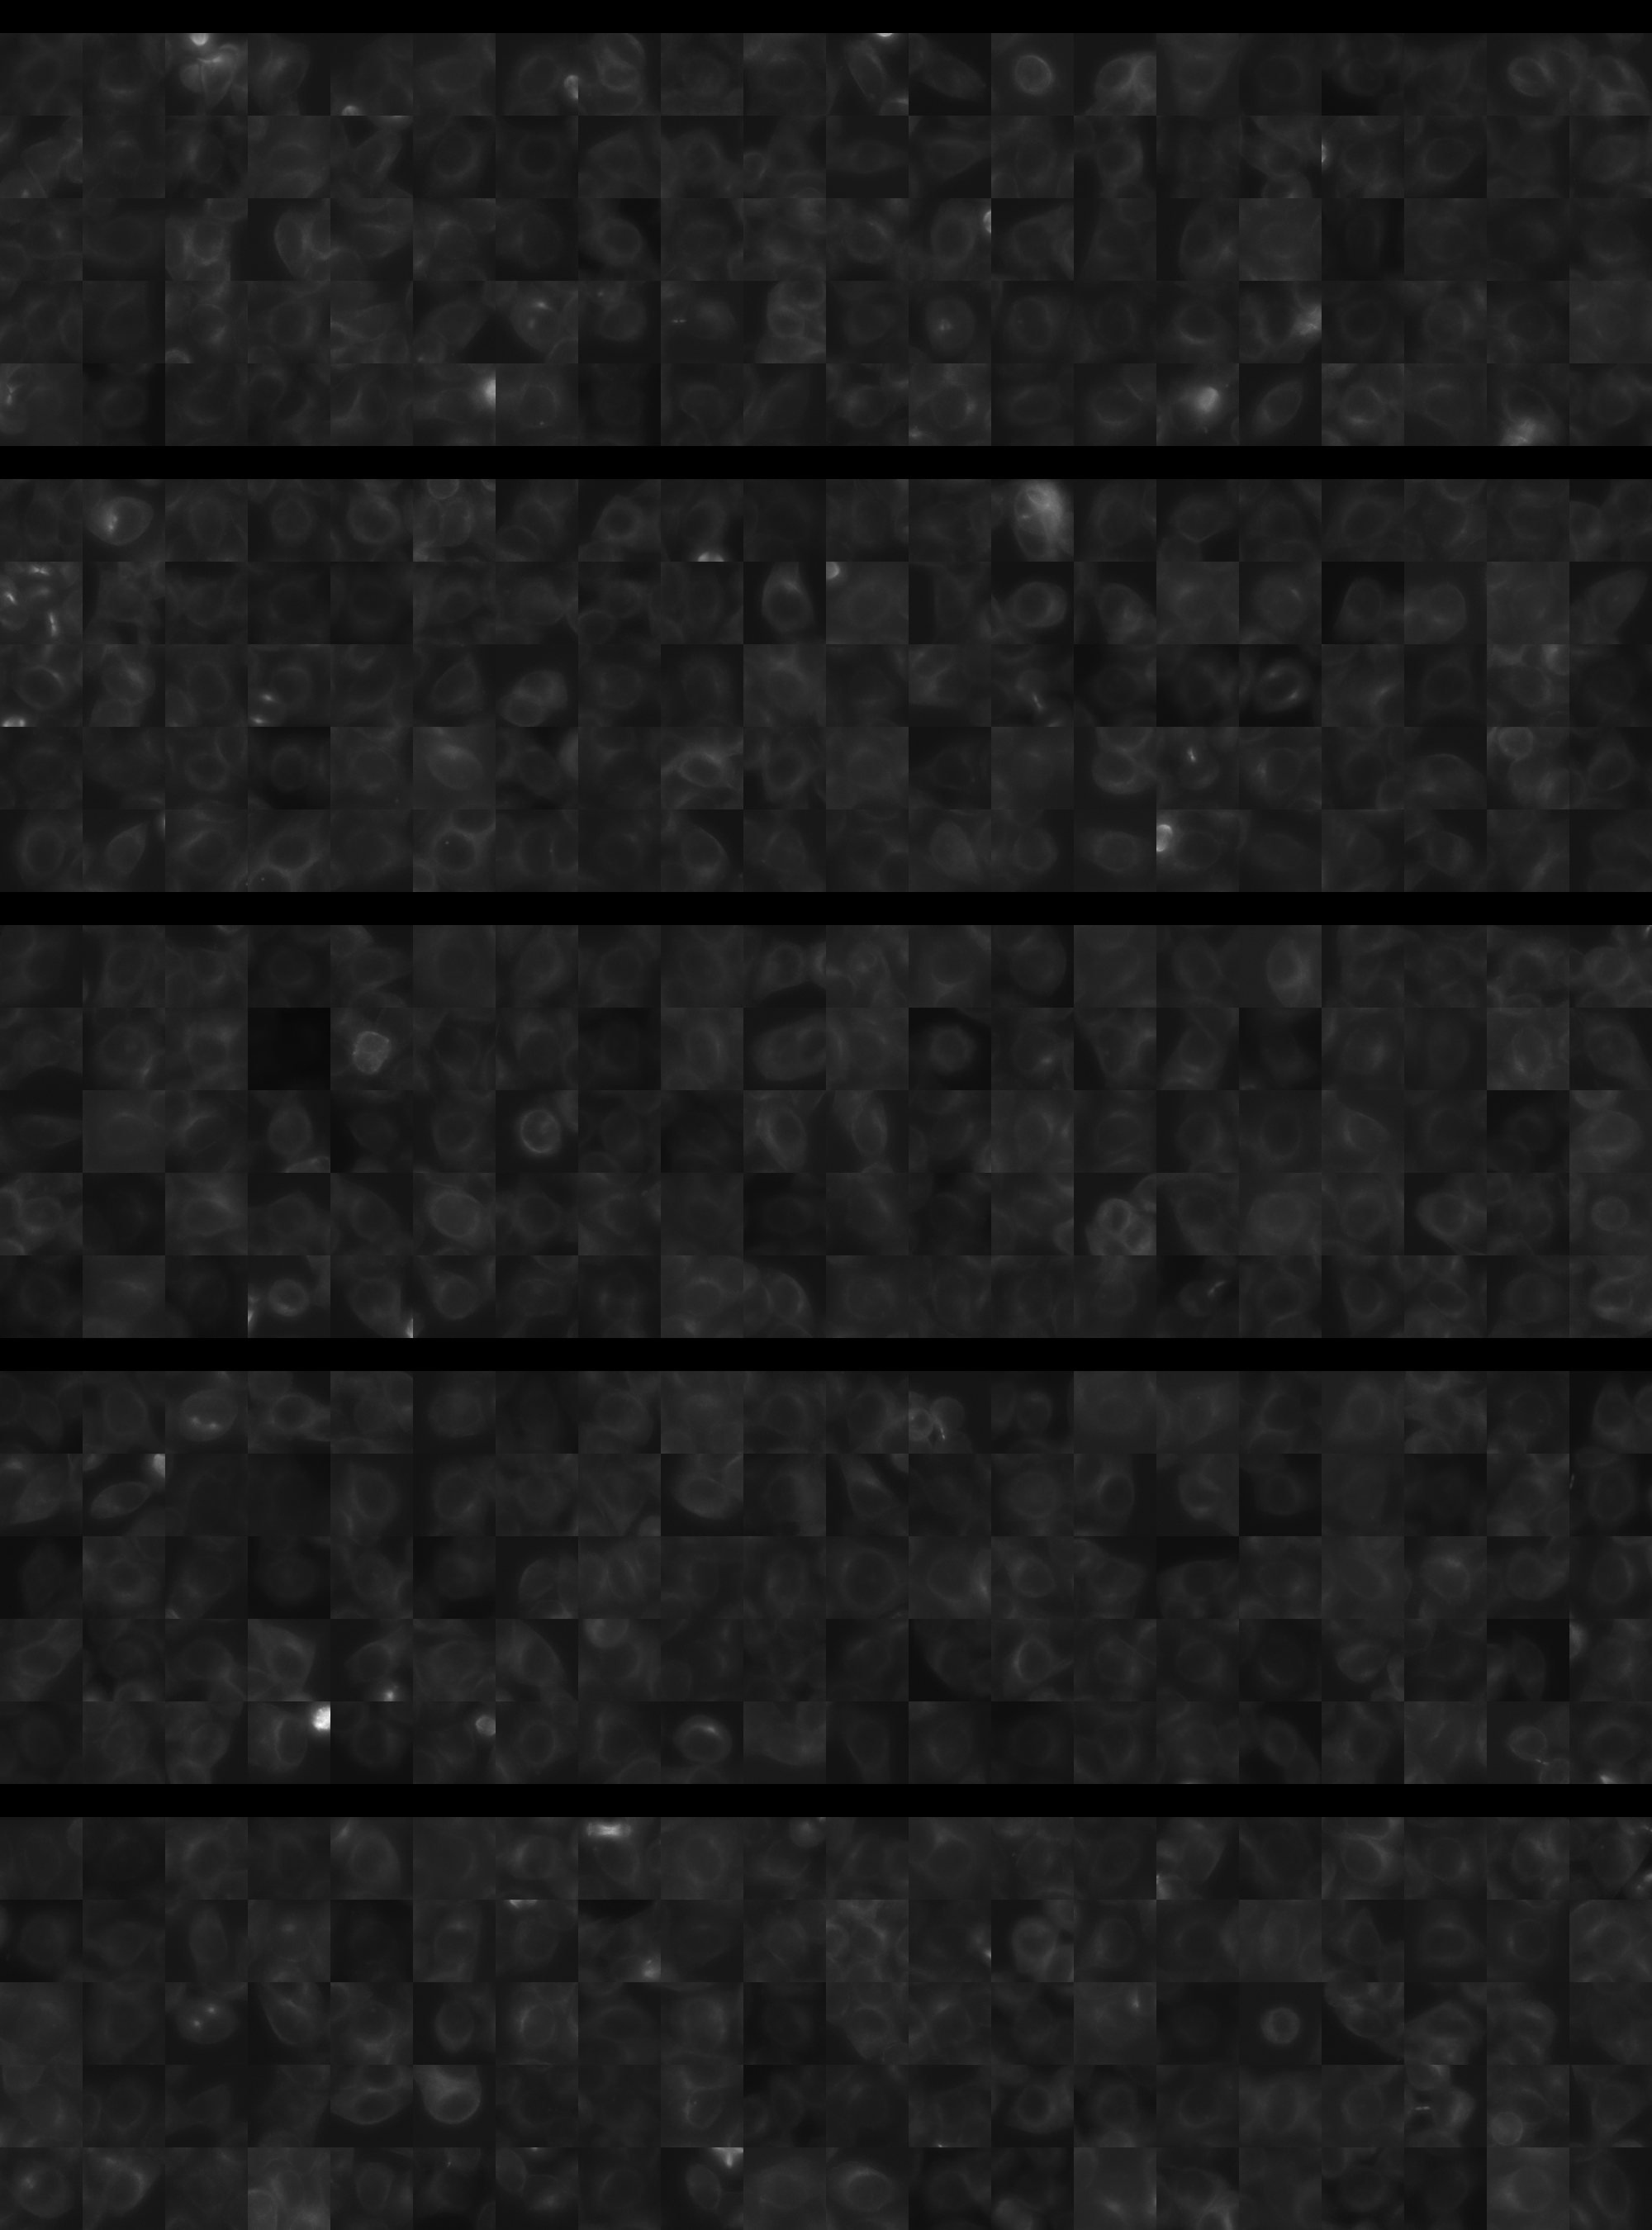
Each montage below shows randomly selected individual cell images for the same target gene separated by sgRNA, along with an example montage of cells expressing a non-targeting negative control sgRNA at the bottom. sgRNA labels in the montages correspond to the numbered sgRNA sequences in the gene info table above. The DNA (blue) and tubulin (green) channels are displayed by default, with gH2AX (grayscale) and actin (yellow) available using the check boxes. Channel brightness, contrast, and opacity are adjustable by clicking the arrow next to the channel name. When only one channel is selected, the display defaults to grayscale. Click the “Zoom” checkbox above the channel controls to enable image zooming (via scrolling) and panning (via click-and-drag).

The cell boxes displayed for this gene are square, 30.36 μm per side for the interphase montage and 30.36 μm per side for the mitotic montage.
Features

Interphase Score Rank FDR q-value
Nucleus DNA Integrated -2.979e-02 4394 of 5322 0.624
Nucleus DNA Mean 0.035 1054 of 5322 0.424
Nucleus gH2AX Mean 0.057 3290 of 5322 0.150
Nucleus DNA - gH2AX Correlation 0.049 352 of 5322 0.157
Nucleus Shape Area -4.546e-02 4412 of 5322 0.293
Nucleus Shape Eccentricity 0.037 1387 of 5322 0.371
Nucleus Shape Form Factor -8.395e-02 4021 of 5322 0.039
Nucleus Shape Solidity -5.376e-02 2881 of 5322 0.119
Cell DNA Mass Displacement 0.002 4264 of 5322 0.993
Cell Tubulin Mean -2.095e-02 3547 of 5322 0.748
Cell Tubulin Mass Displacement 0.027 1411 of 5322 0.646
Cell Actin Mean -6.389e-02 4582 of 5322 0.197
Cell Tubulin - Actin Correlation 0.002 3603 of 5322 0.967
Cell DNA - Tubulin Correlation 0.062 1612 of 5322 0.096
Cell Shape Area -5.269e-02 4415 of 5322 0.225
Cell Shape Eccentricity 0.045 749 of 5322 0.452
Mitotic Score Rank FDR q-value
Nucleus DNA Integrated 0.006 3847 of 5322 0.996
Nucleus DNA Mean 0.173 768 of 5322 1.000
Nucleus DNA Mass Displacement 0.100 1921 of 5322 0.999
Nucleus DNA Mean Frac 3 0.150 991 of 5322 1.000
Nucleus gH2AX Mean 0.147 1150 of 5322 1.000
Nucleus gH2AX Mean Frac 0 -5.486e-03 2362 of 5322 1.000
Nucleus Tubulin Mean Frac 0 0.054 2677 of 5322 0.999
Nucleus Tubulin Mean Edge -2.221e-02 3473 of 5322 0.999
Nucleus Tubulin Std Edge -1.247e-01 4136 of 5322 0.999
Nucleus Shape Area -5.312e-02 4492 of 5322 0.990
Nucleus Shape Eccentricity 0.061 1233 of 5322 1.000
Nucleus Shape Form Factor -6.105e-02 2291 of 5322 0.998
Cell Tubulin Mean 0.059 2655 of 5322 0.997
Cell Tubulin Mean Frac 3 0.030 1353 of 5322 0.999
Cell Actin Mean -8.474e-02 4248 of 5322 0.997
Cell Shape Area -8.635e-02 4689 of 5322 0.998
( Reset Zoom )
Brightness
Contrast
Opacity
Brightness
Contrast
Opacity
Brightness
Contrast
Opacity
Brightness
Contrast
Opacity
Brightness
Contrast
Opacity

( Reset Zoom )
Brightness
Contrast
Opacity
Brightness
Contrast
Opacity
Brightness
Contrast
Opacity
Brightness
Contrast
Opacity
Brightness
Contrast
Opacity

MIT Central Accessability