CNOT11

Gene symbol: CNOT11
Gene: 55571
Uniprot Function: Component of the CCR4-NOT complex which is one of the major cellular mRNA deadenylases and is linked to various cellular processes including bulk mRNA degradation, miRNA-mediated repression, translational repression during translational initiation and general transcription regulation. Additional complex functions may be a consequence of its influence on mRNA expression. Is required for the association of CNOT10 with the CCR4-NOT complex. Seems not to be required for complex deadenylase function.
Mitotic Index 0.0279
Interphase Cluster: #157 (18 genes)
Mitotic Cluster: #18 (40 genes)
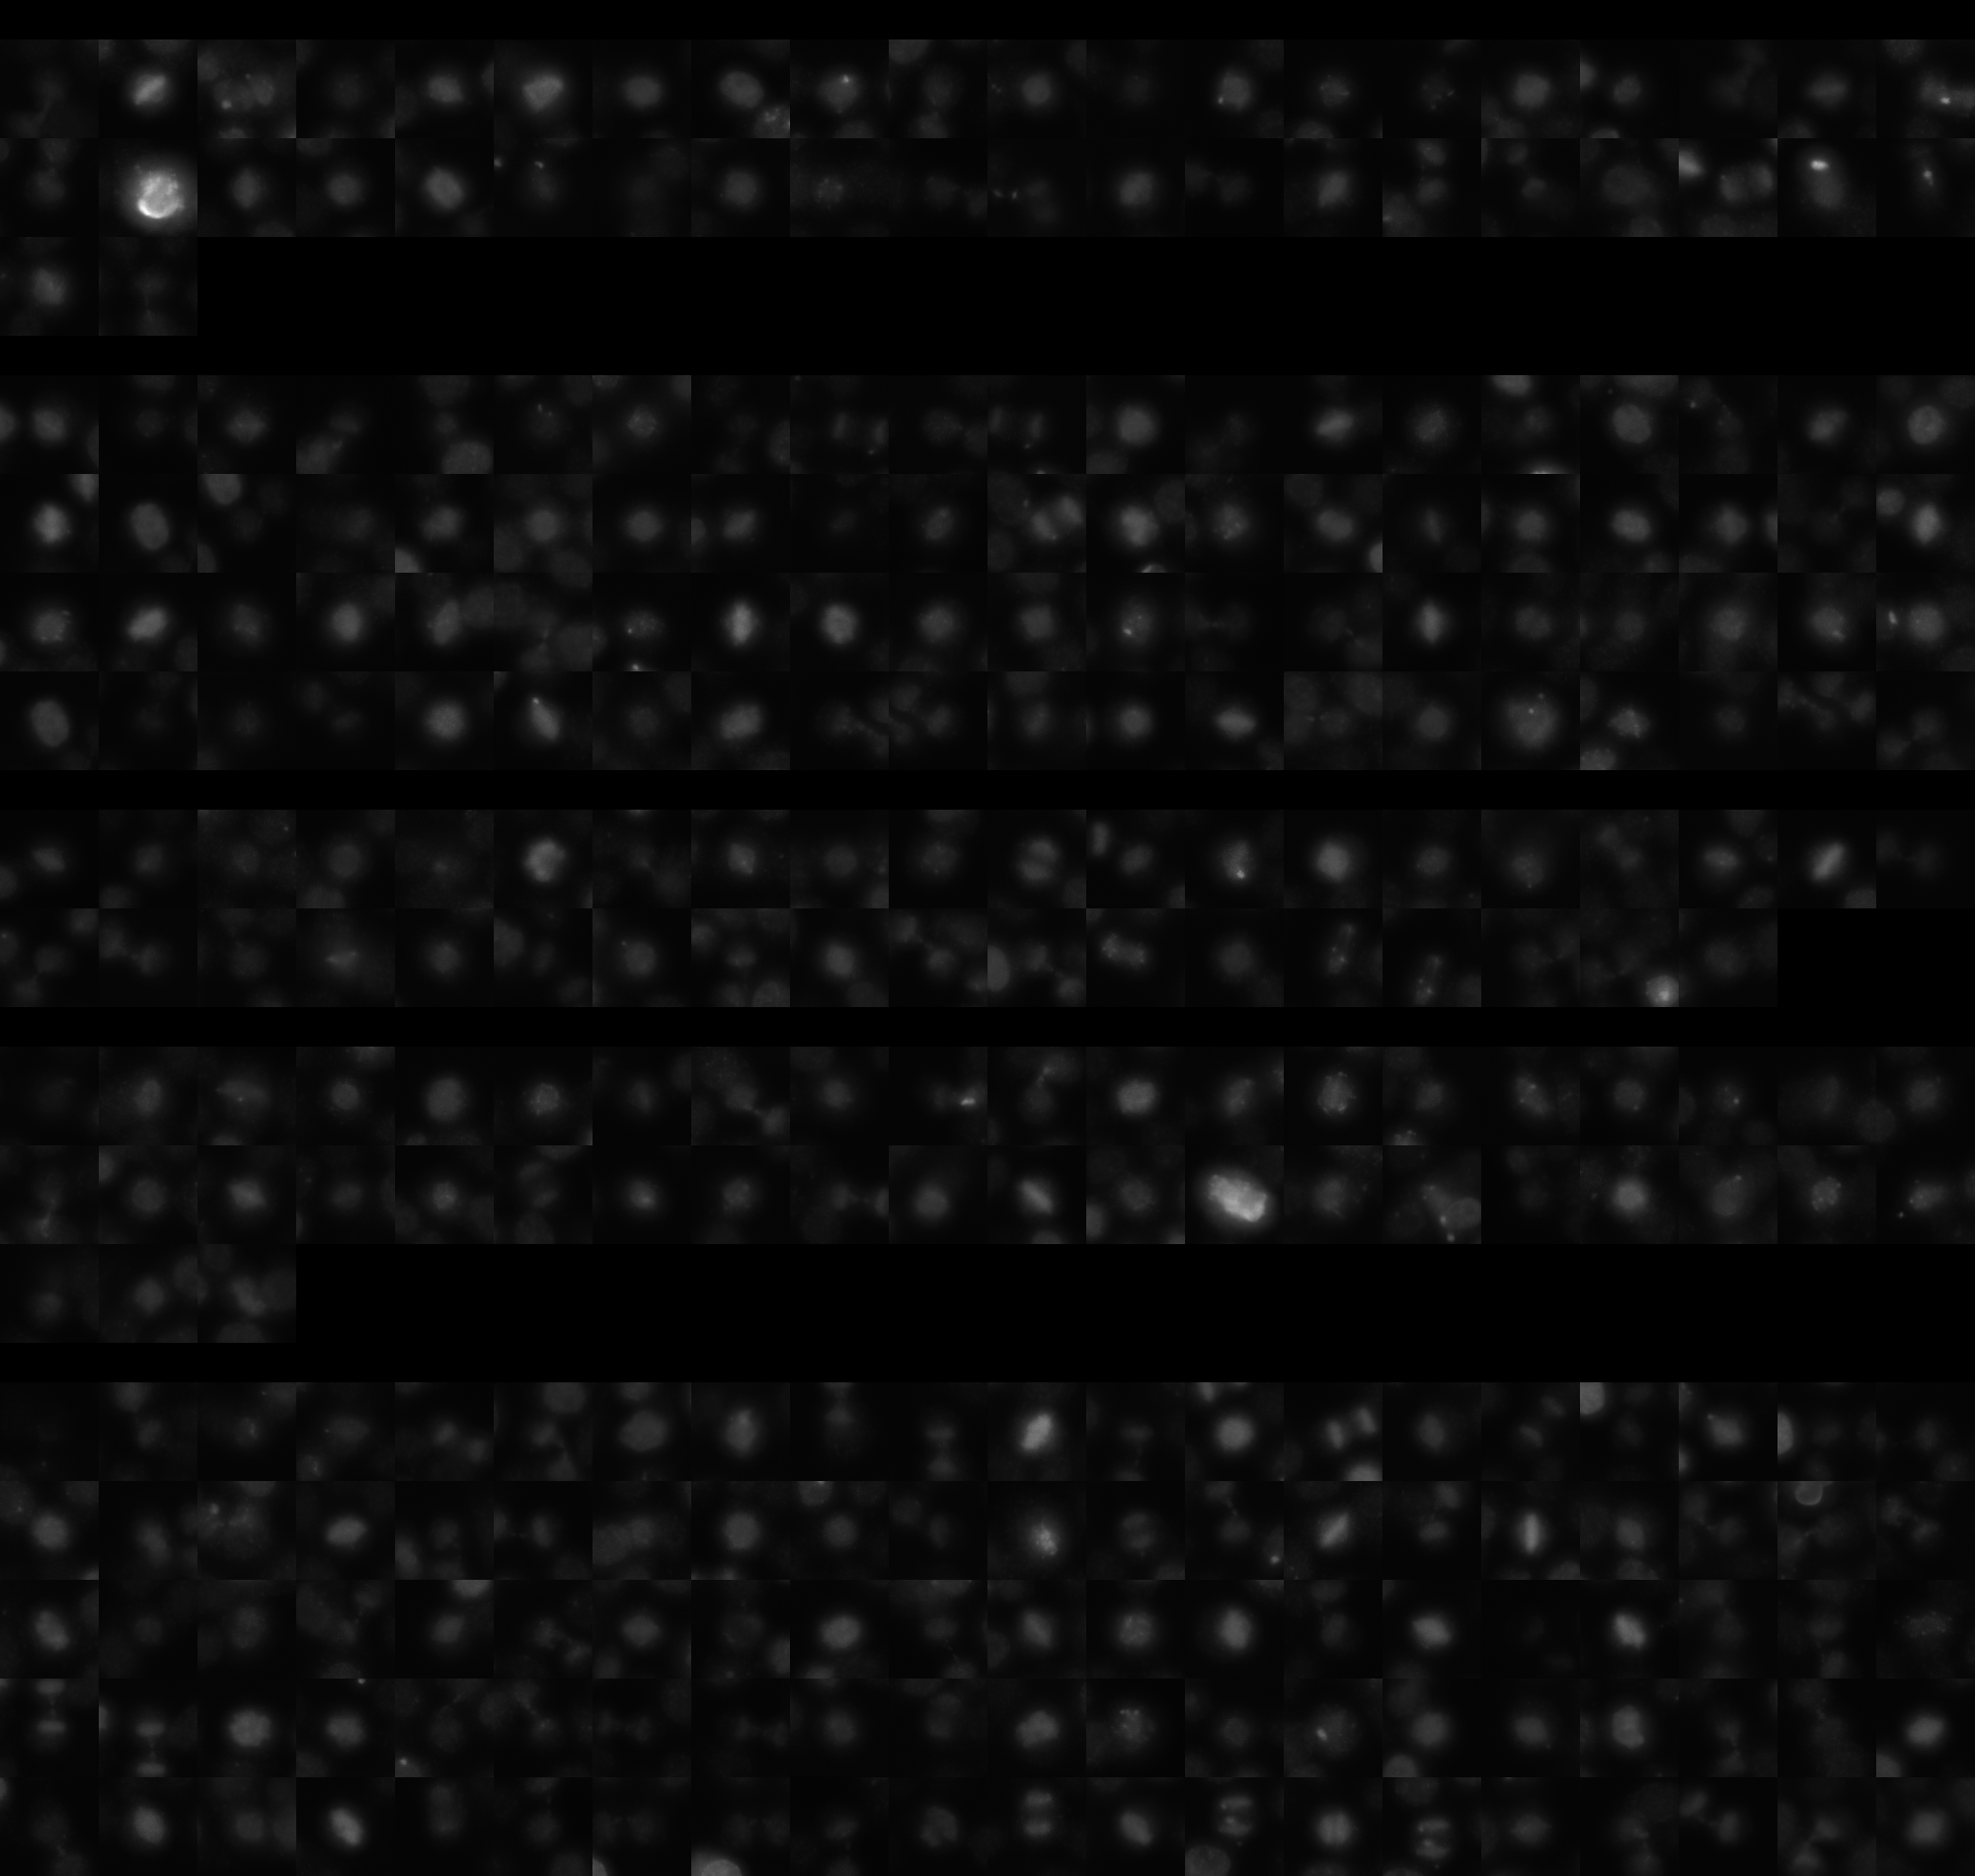
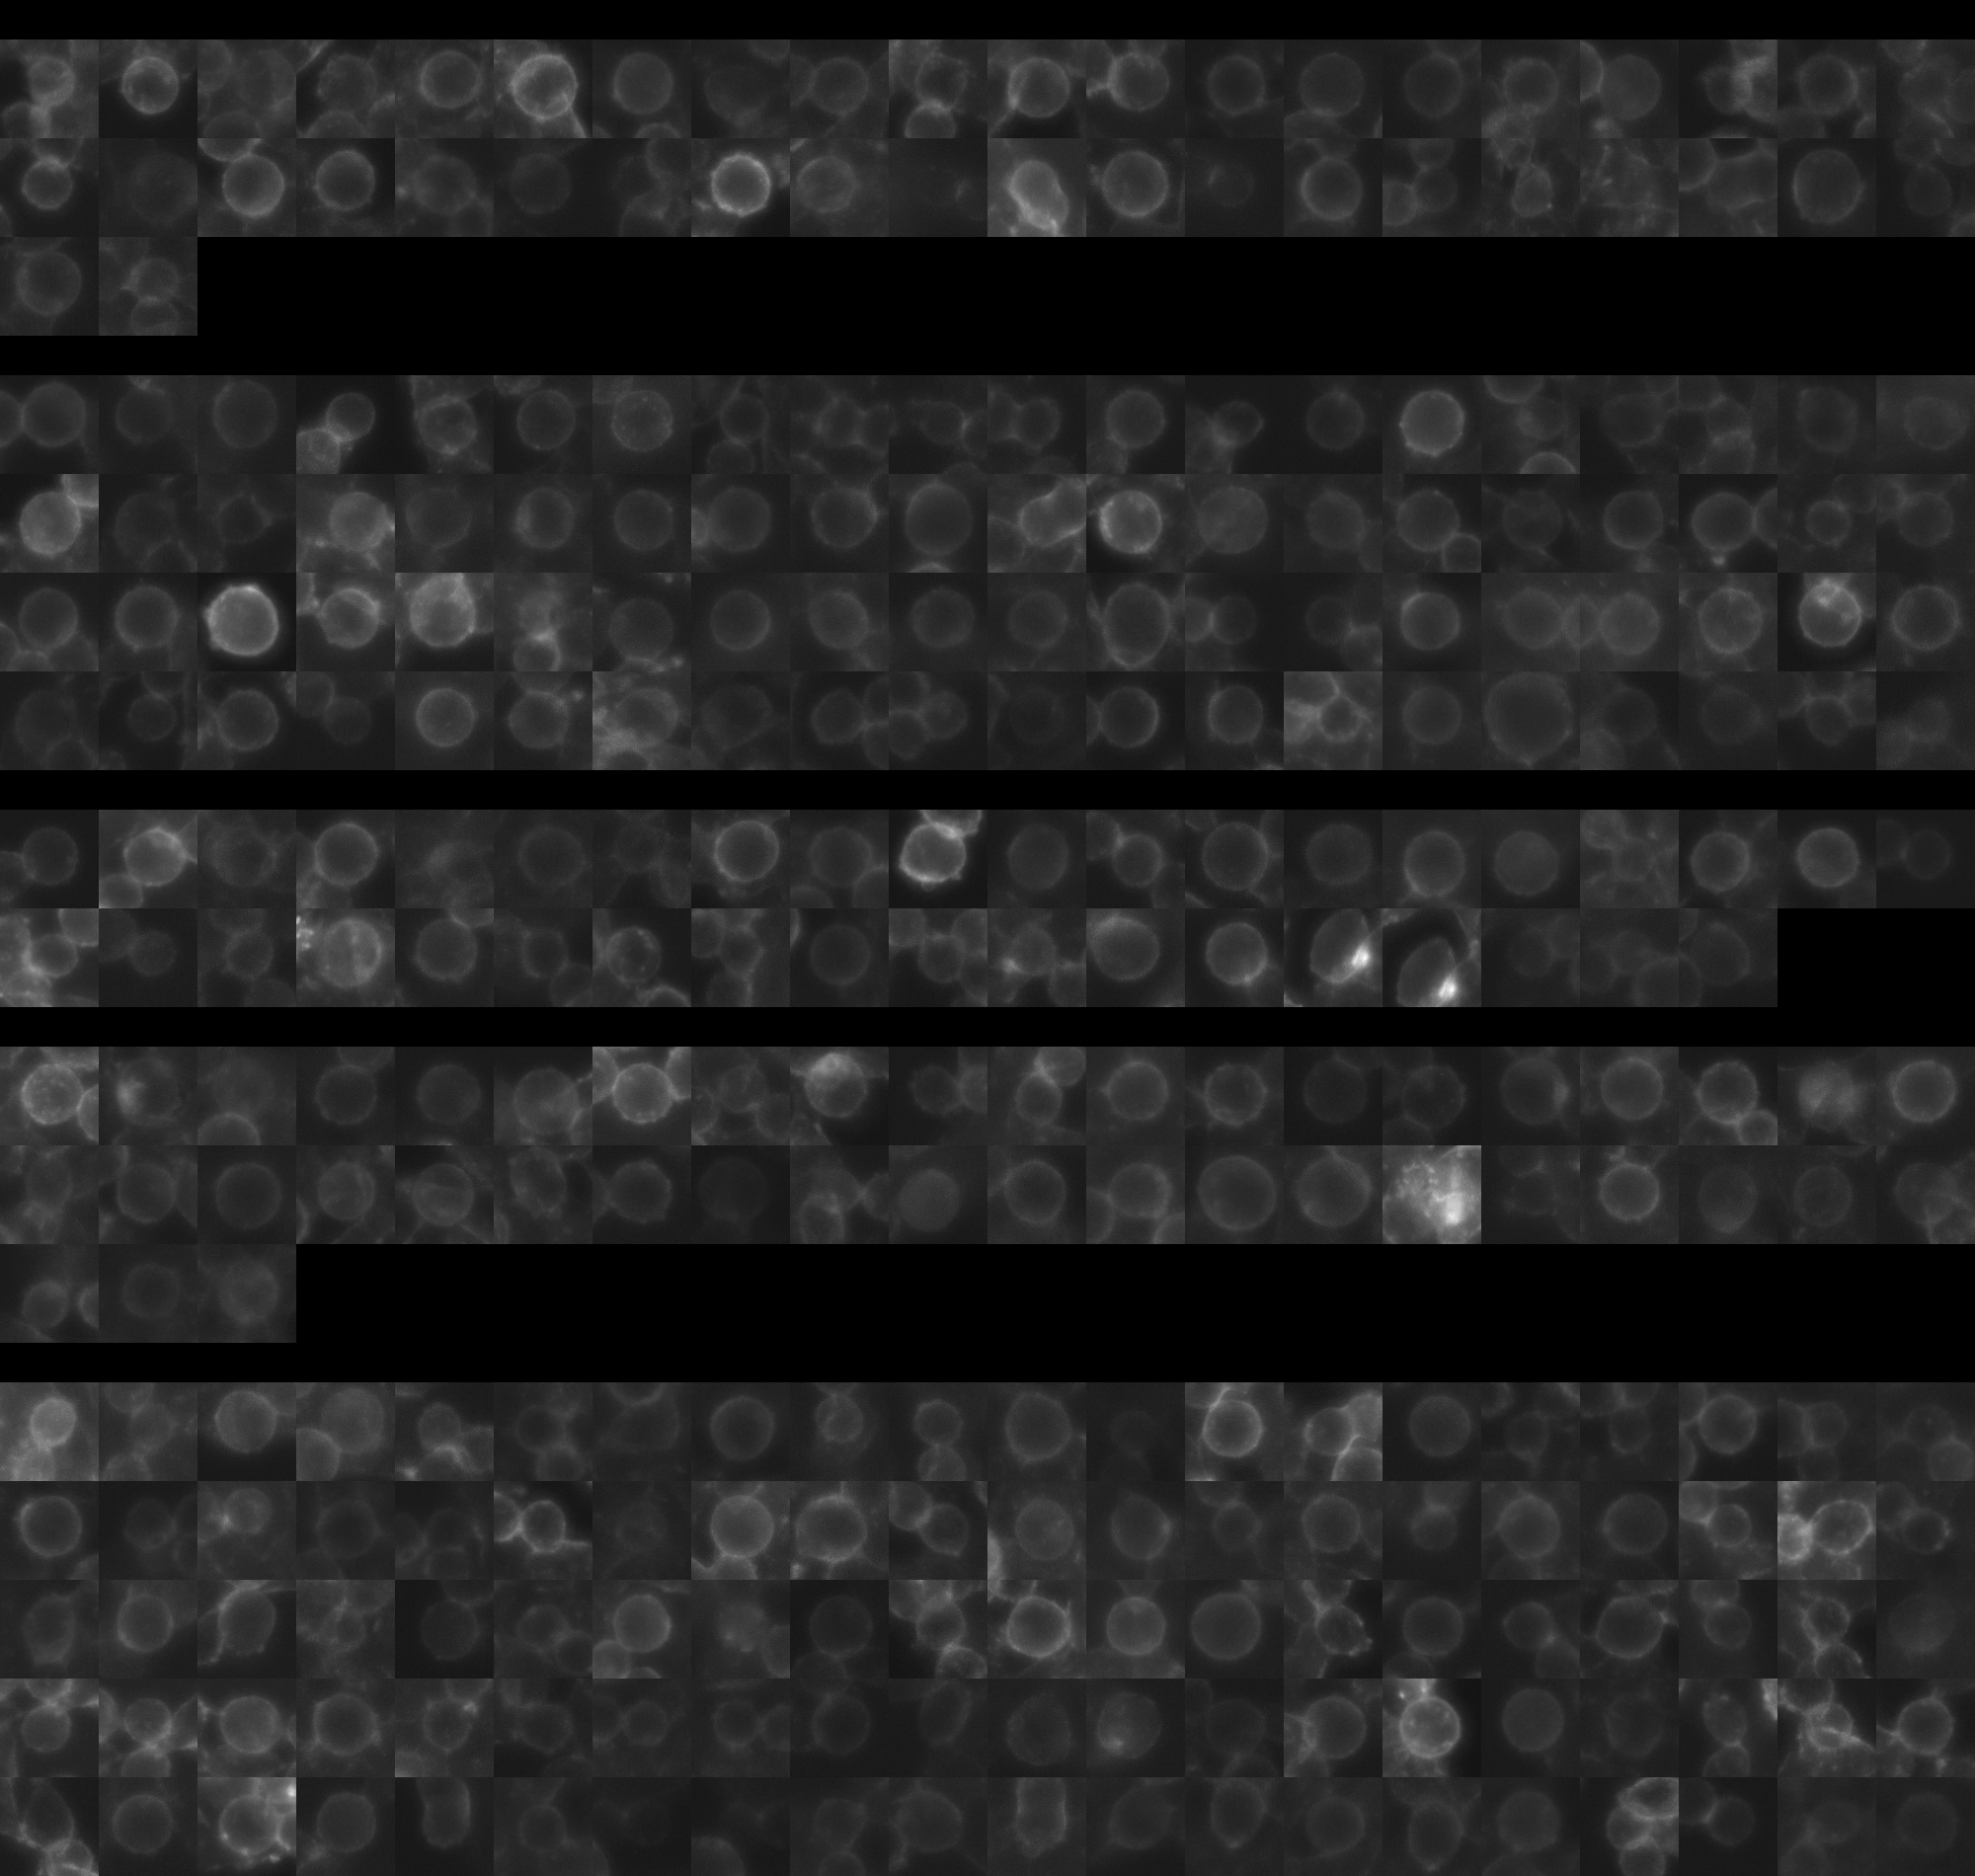
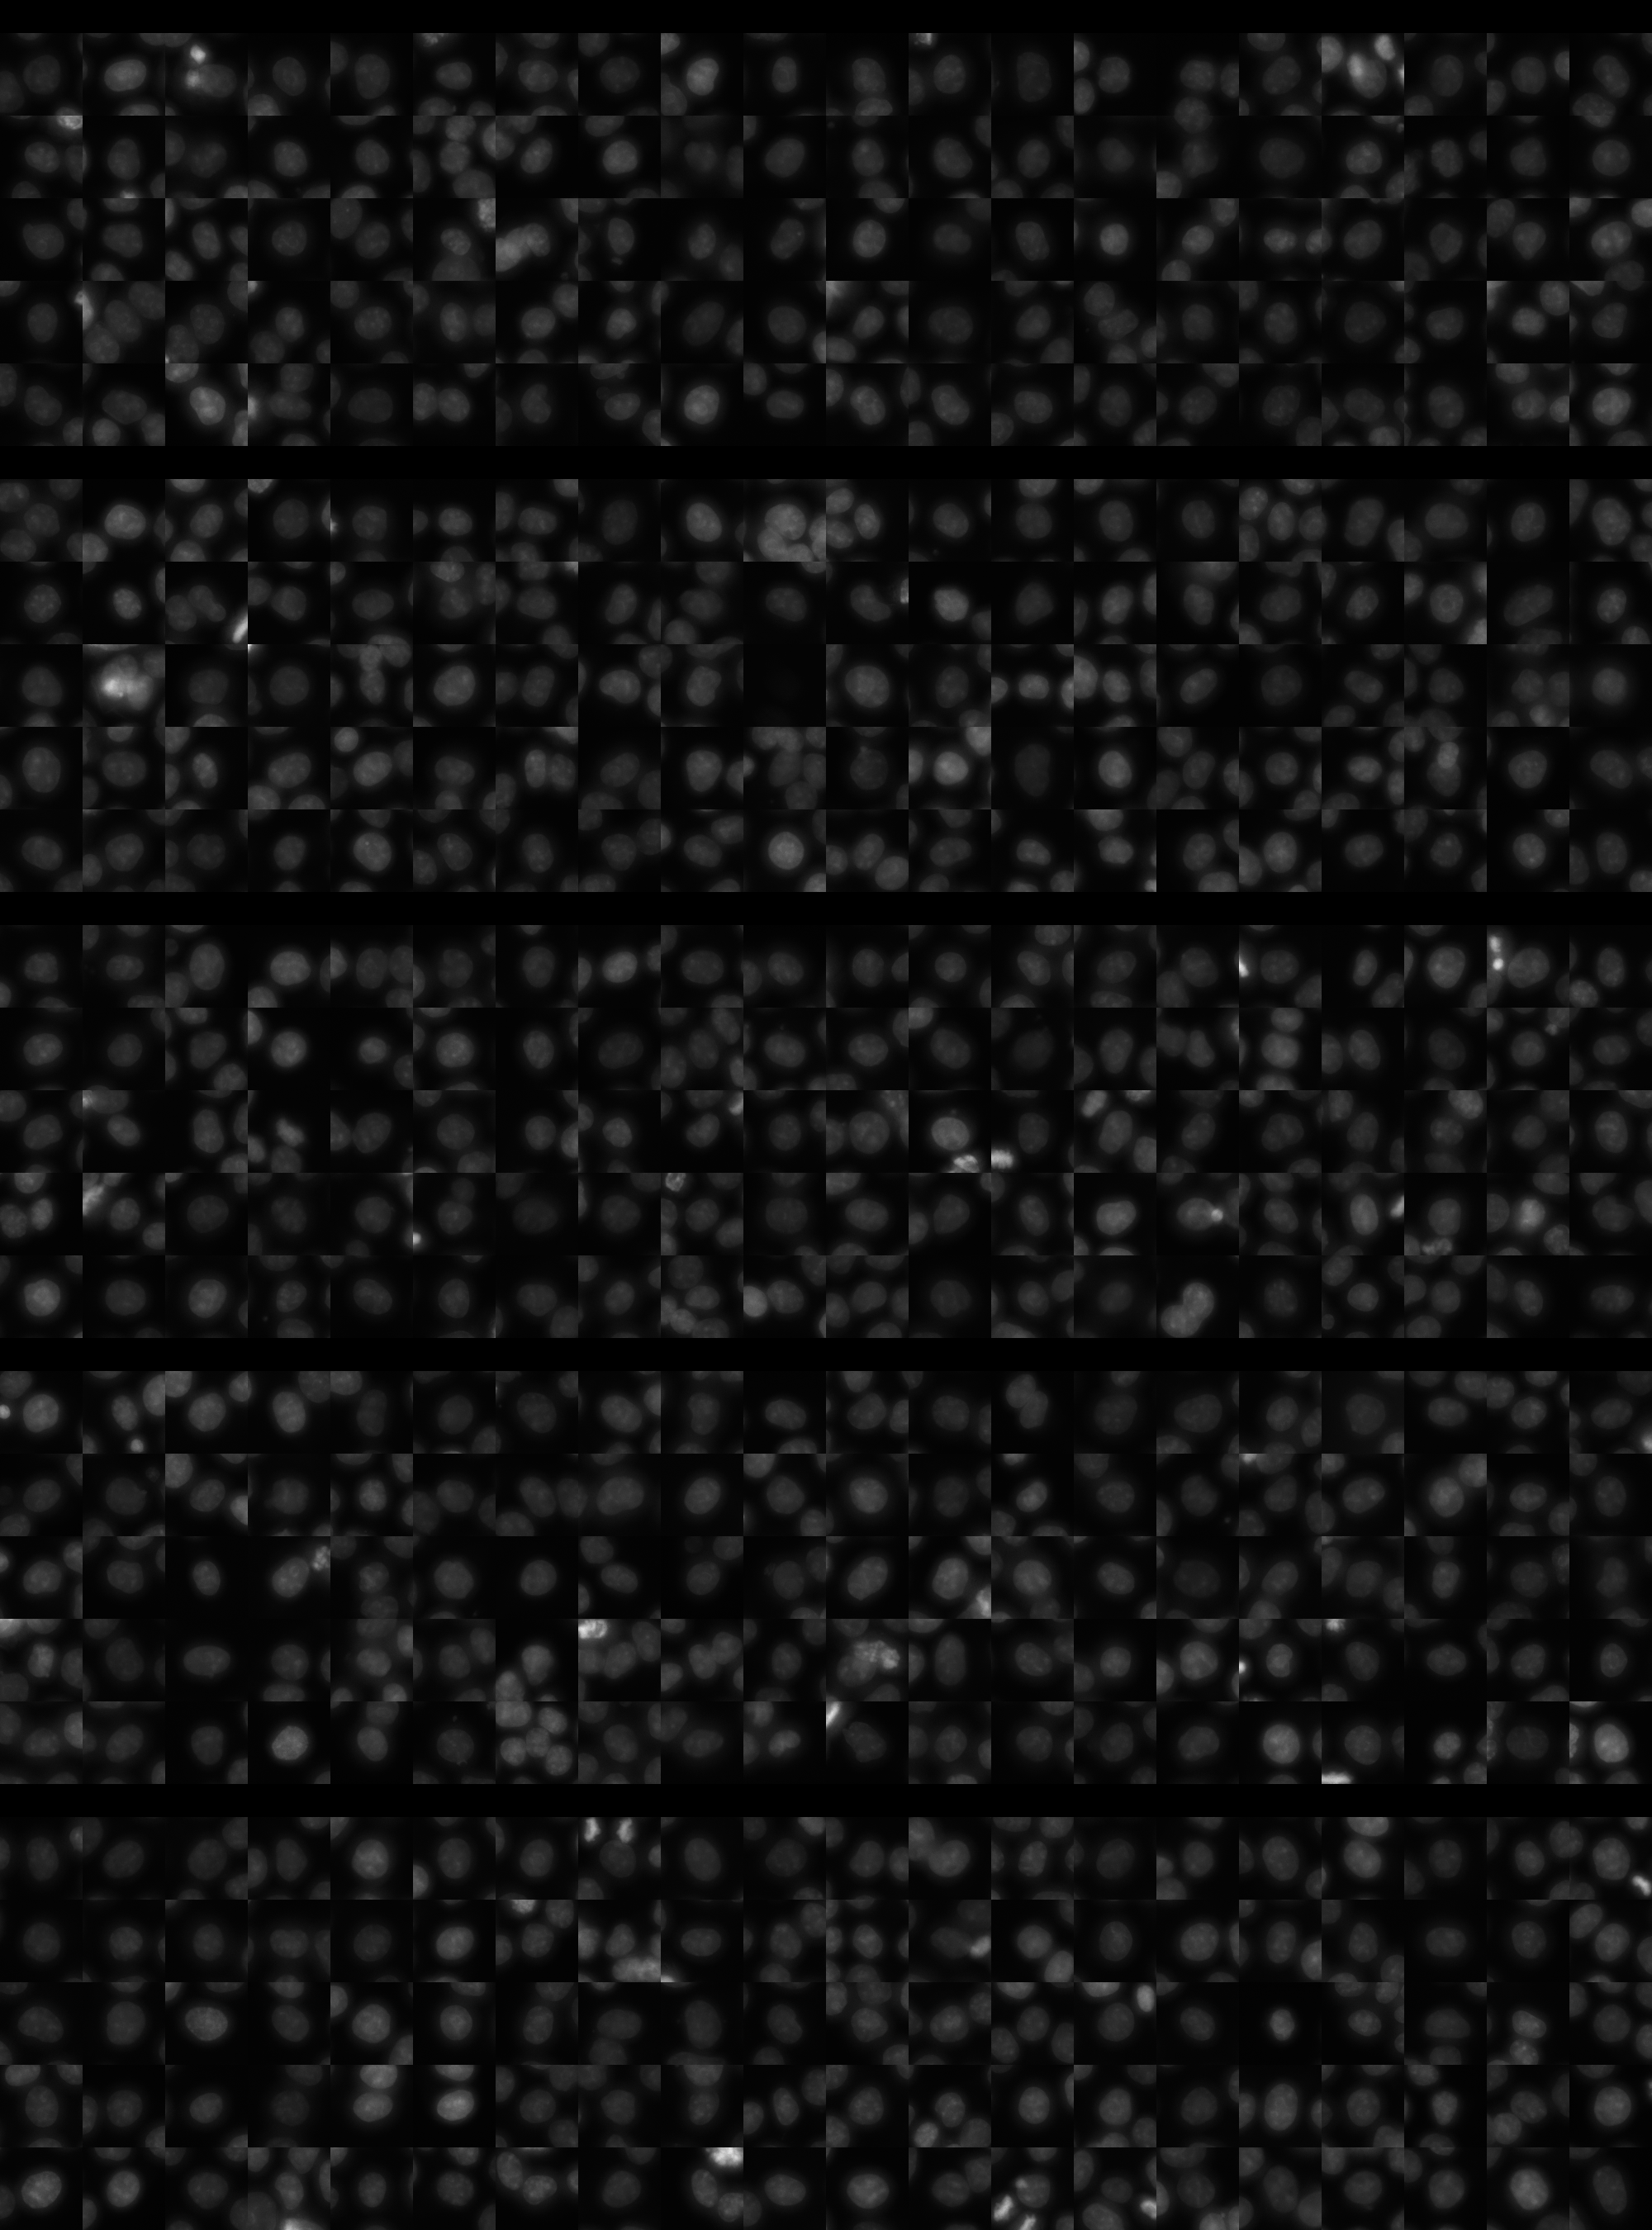
sgRNA 1: CAAATGTGGAGTGGAGGCGG (interphase cells: 1690, mitotic cells: 42)
sgRNA 2: CCTGCTGAGCATCATATCGG (interphase cells: 2388, mitotic cells: 80)
sgRNA 3: GCGTCCAGGAGCGGCTTCGG (interphase cells: 1504, mitotic cells: 38)
sgRNA 4: TCCATCAGTGCAATCTGGCG (interphase cells: 1491, mitotic cells: 43)

Interphase Cluster

Mitotic Cluster

Overview

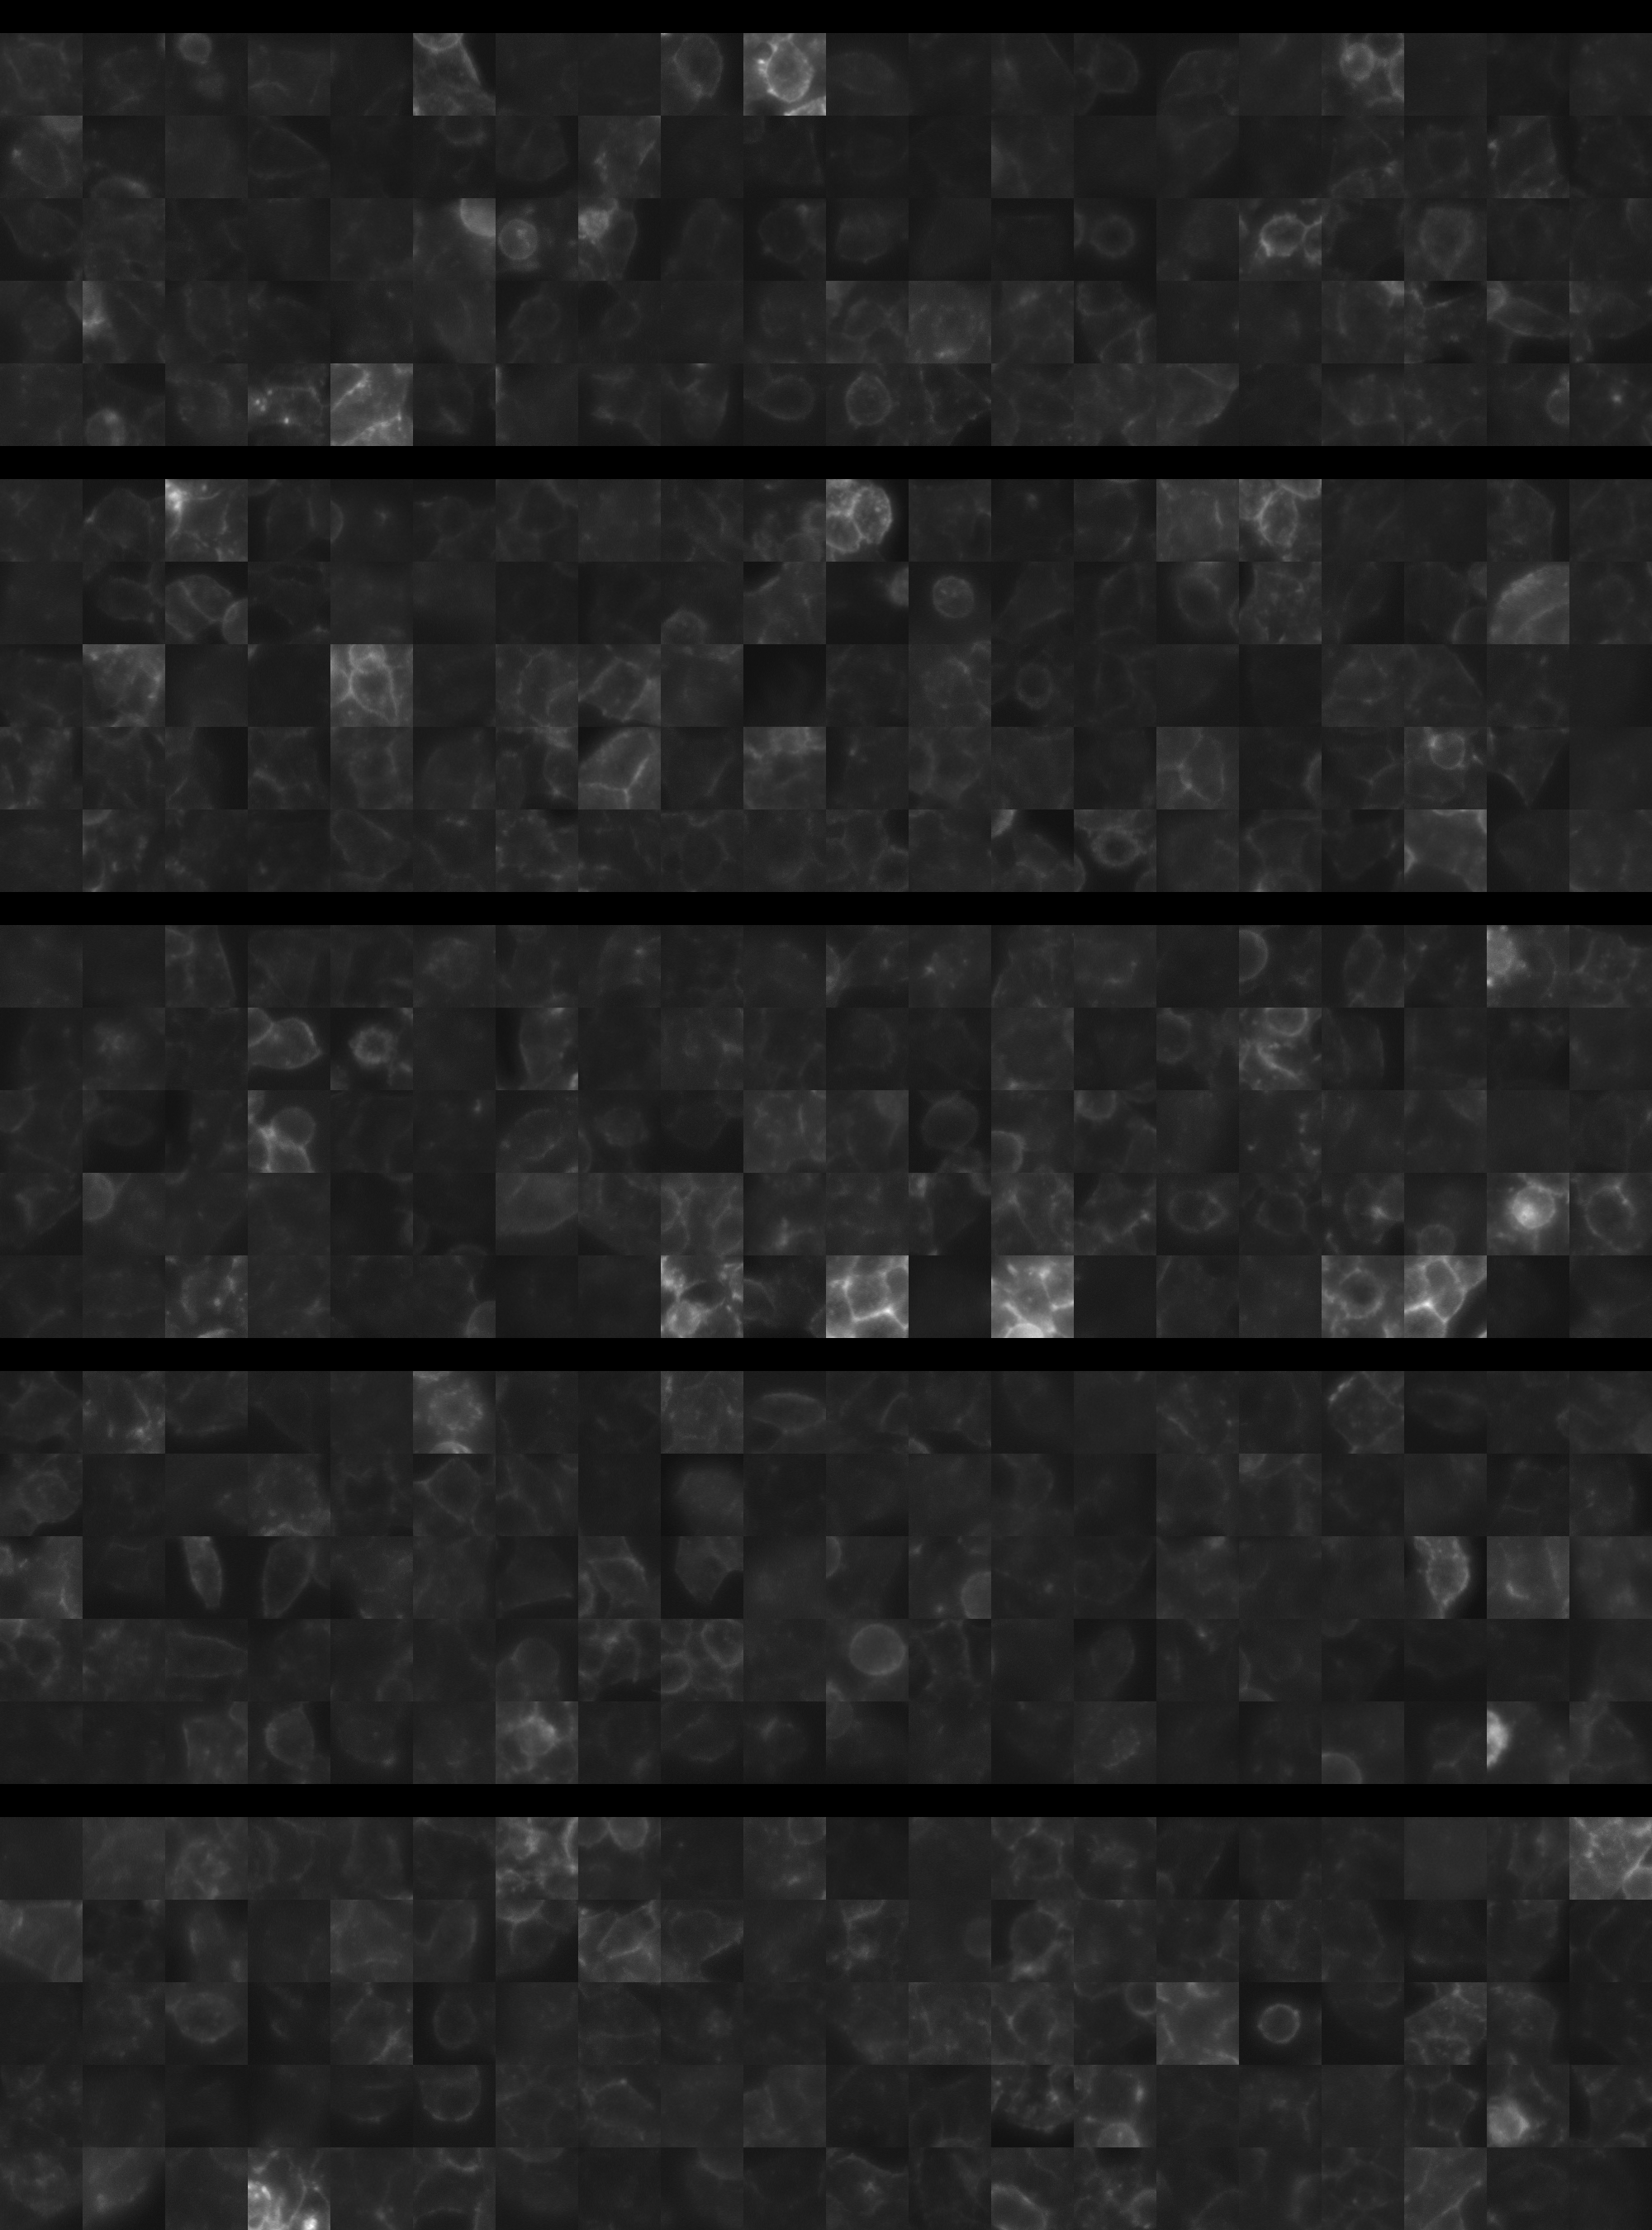
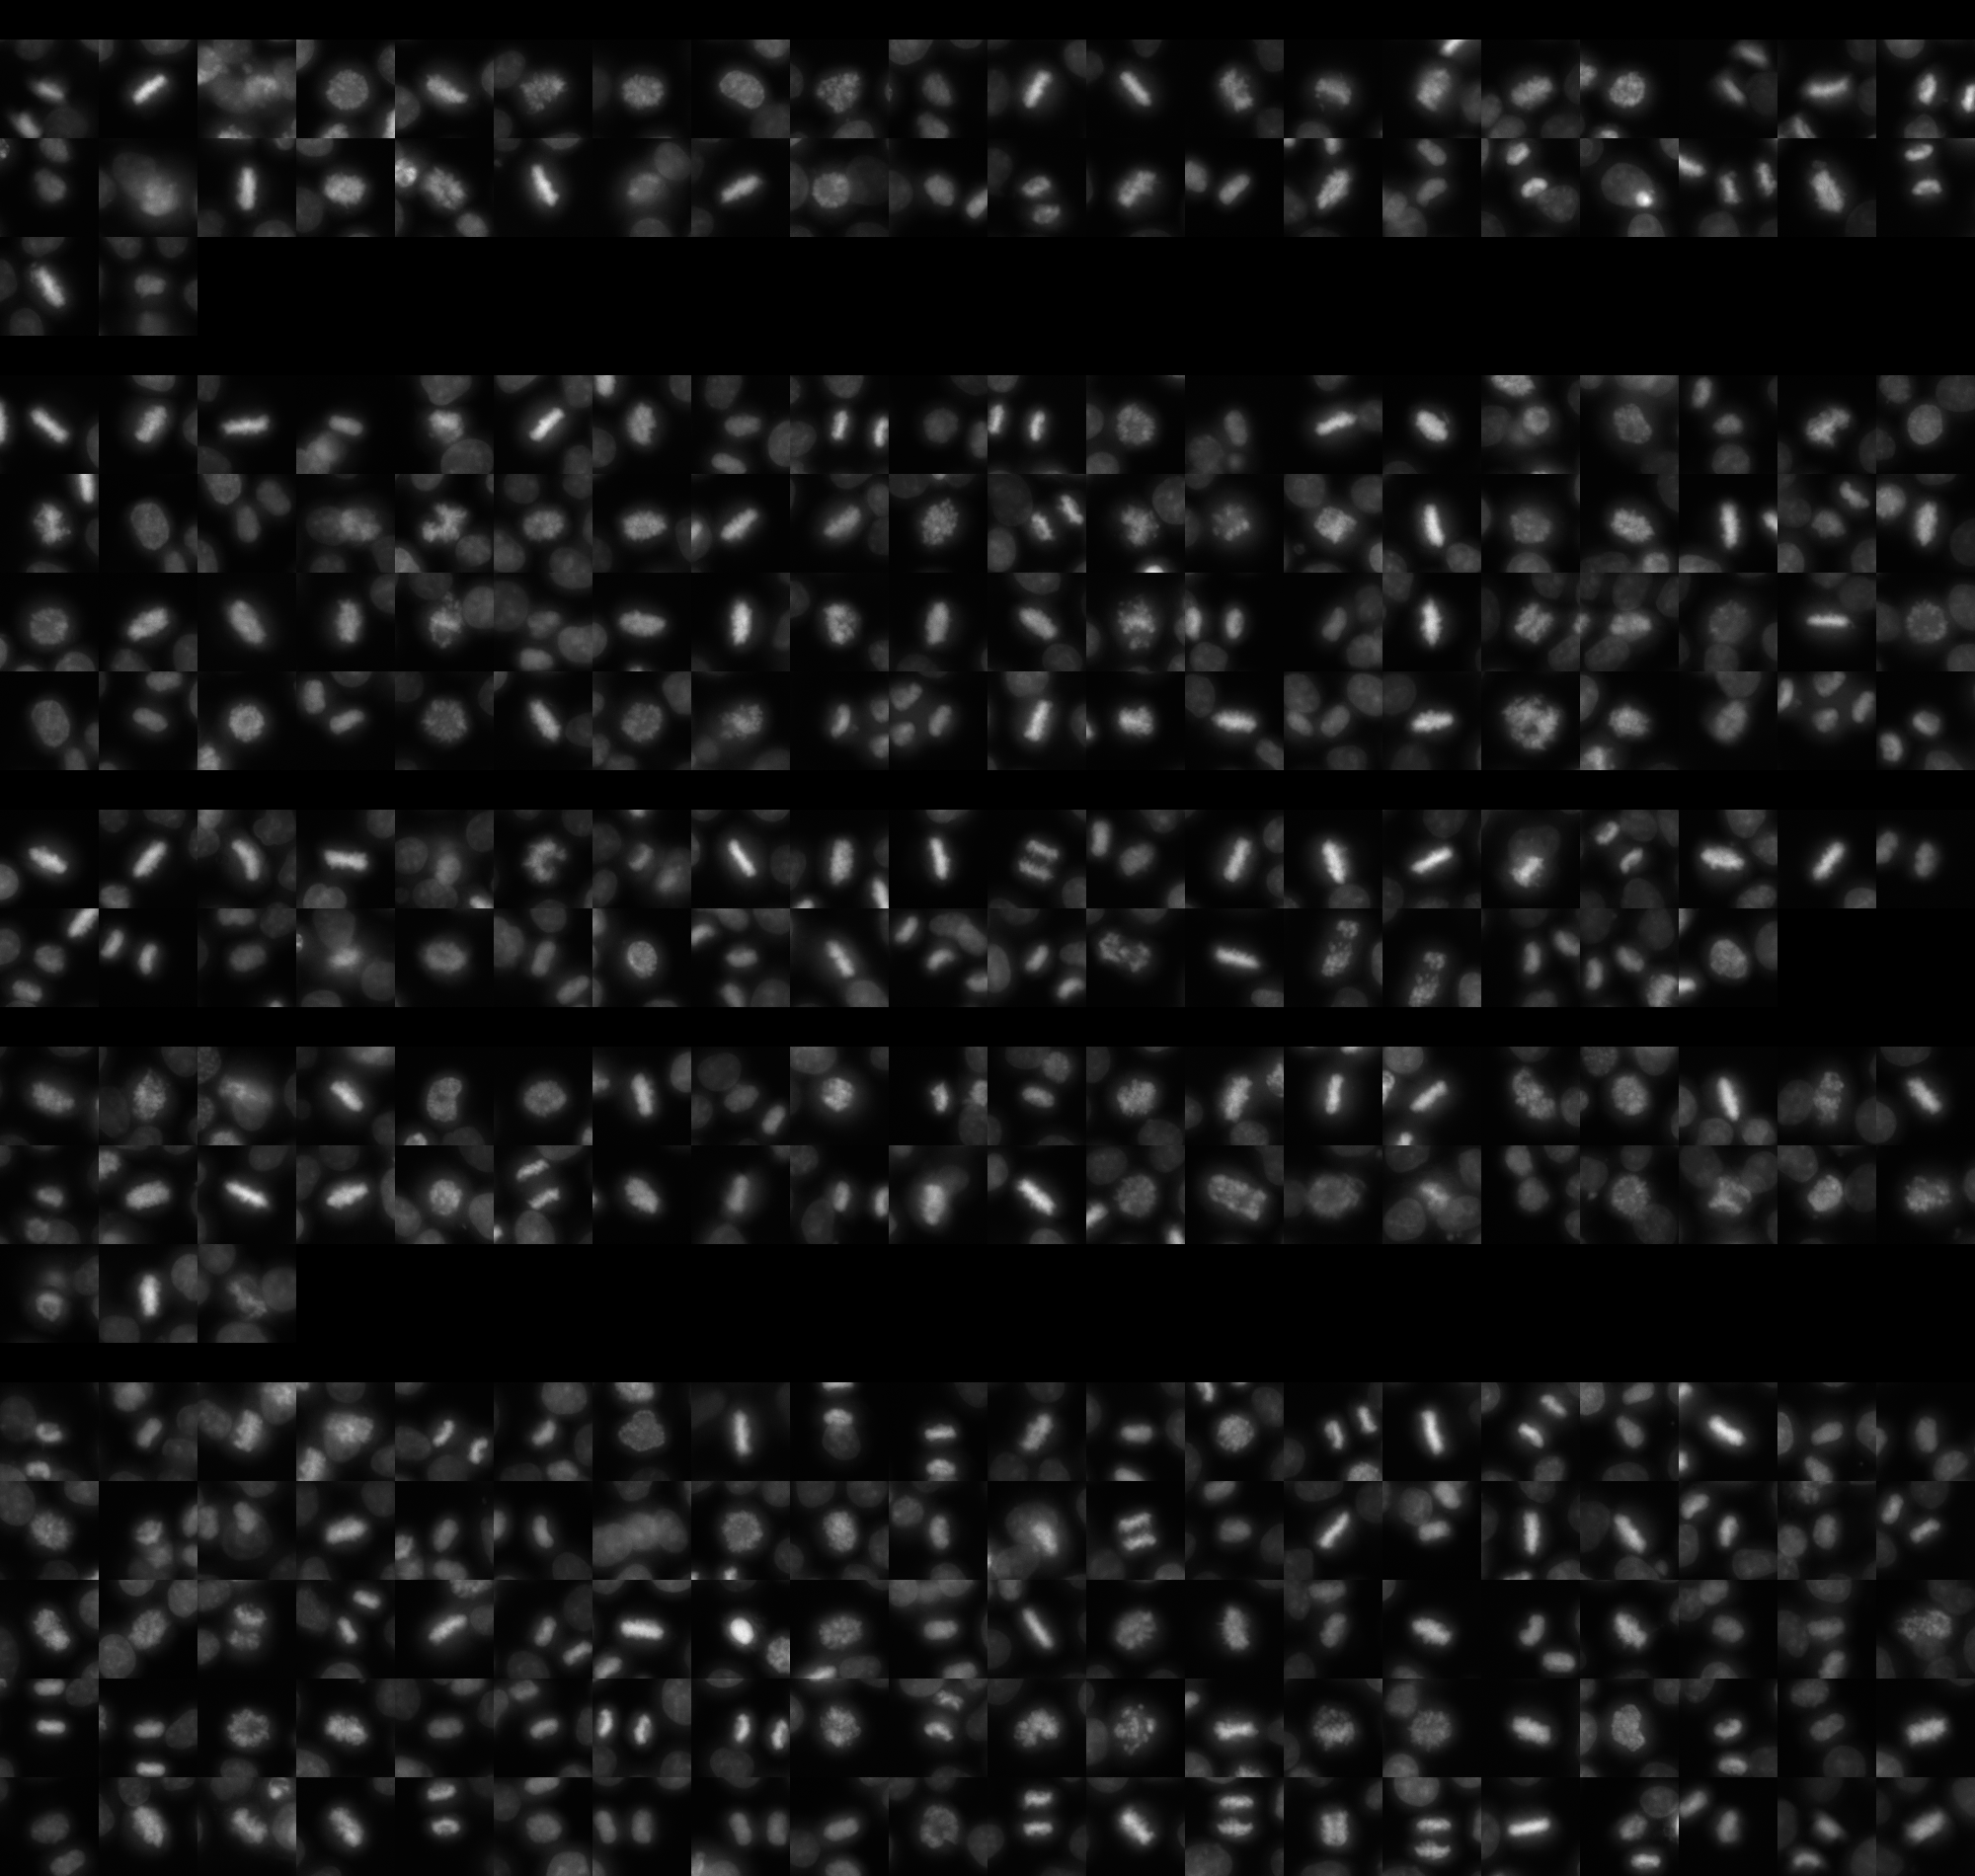
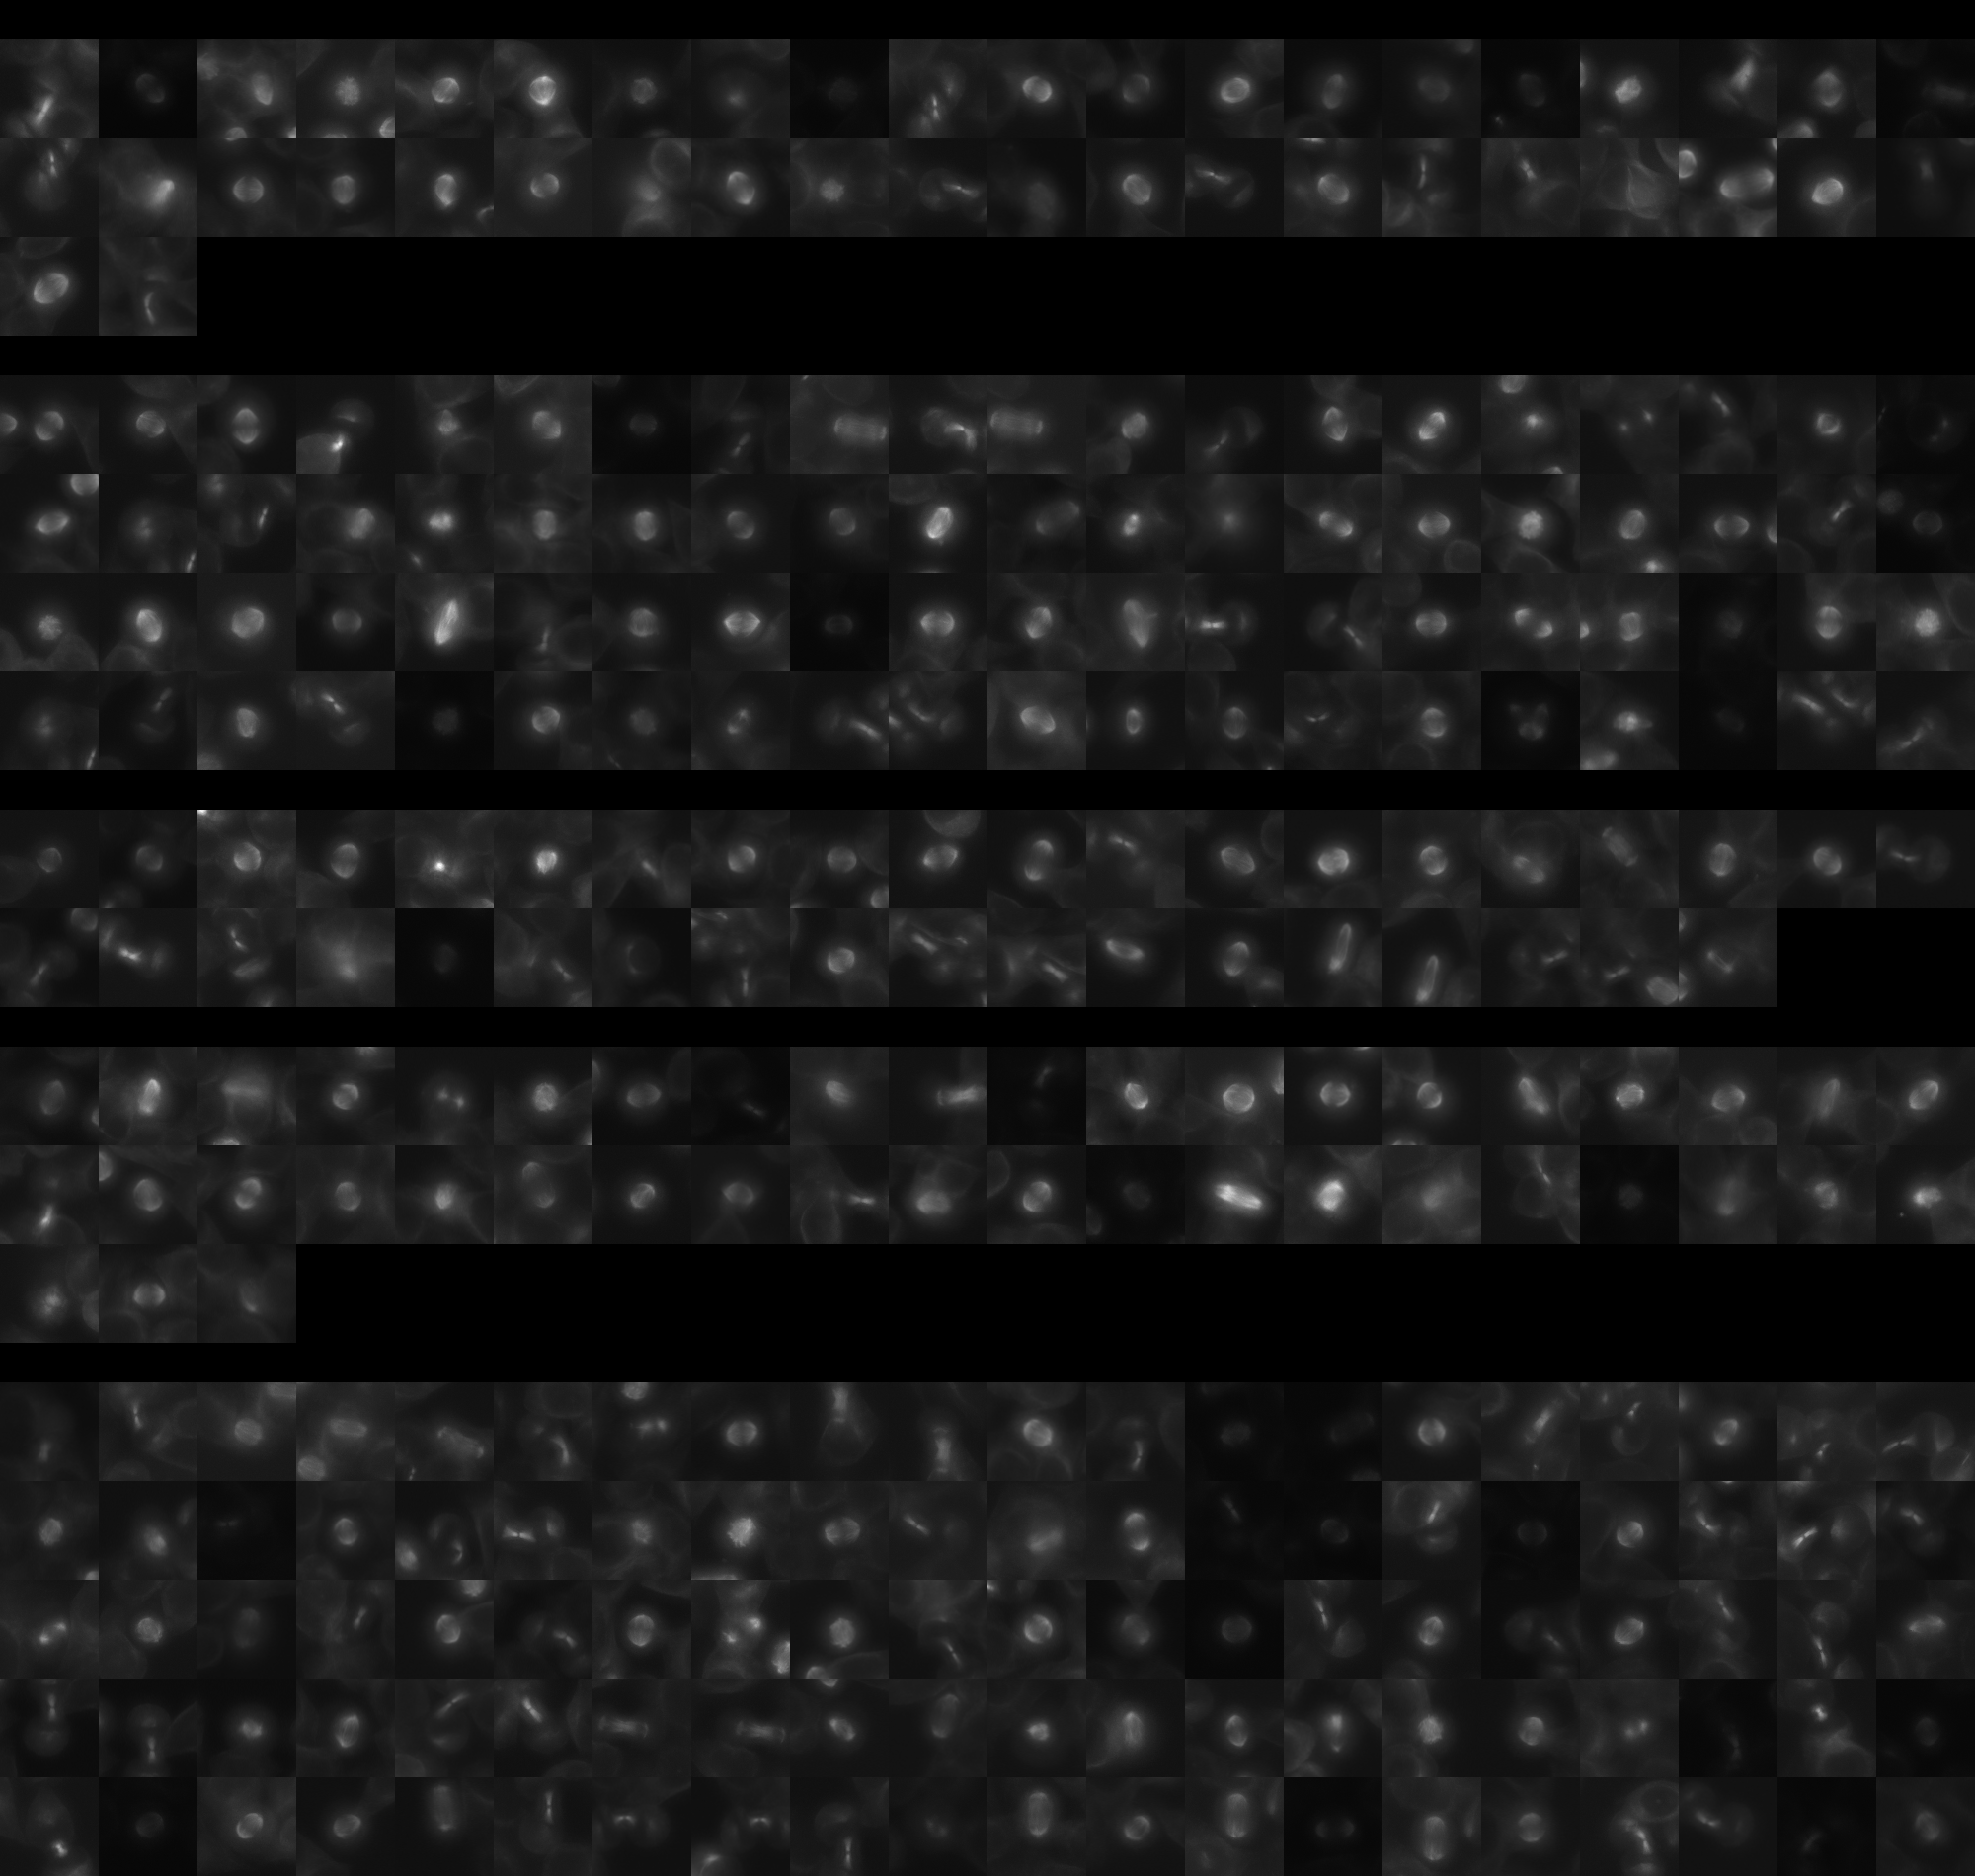
Each montage below shows randomly selected individual cell images for the same target gene separated by sgRNA, along with an example montage of cells expressing a non-targeting negative control sgRNA at the bottom. sgRNA labels in the montages correspond to the numbered sgRNA sequences in the gene info table above. The DNA (blue) and tubulin (green) channels are displayed by default, with gH2AX (grayscale) and actin (yellow) available using the check boxes. Channel brightness, contrast, and opacity are adjustable by clicking the arrow next to the channel name. When only one channel is selected, the display defaults to grayscale. Click the “Zoom” checkbox above the channel controls to enable image zooming (via scrolling) and panning (via click-and-drag).

The cell boxes displayed for this gene are square, 30.36 μm per side for the interphase montage and 30.36 μm per side for the mitotic montage.
Features

Interphase Score Rank FDR q-value
Nucleus DNA Integrated -8.914e-03 3558 of 5322 0.884
Nucleus DNA Mean 0.016 1504 of 5322 0.699
Nucleus gH2AX Mean 0.252 393 of 5322 1.367e-04
Nucleus DNA - gH2AX Correlation -3.345e-01 5289 of 5322 1.021e-04
Nucleus Shape Area -3.386e-02 4206 of 5322 0.400
Nucleus Shape Eccentricity 0.076 409 of 5322 0.028
Nucleus Shape Form Factor -8.645e-02 4087 of 5322 0.022
Nucleus Shape Solidity -1.183e-01 4583 of 5322 0.001
Cell DNA Mass Displacement -6.834e-04 4403 of 5322 0.966
Cell Tubulin Mean 0.897 5 of 5322 2.141e-04
Cell Tubulin Mass Displacement 0.367 9 of 5322 3.984e-04
Cell Actin Mean 0.125 615 of 5322 0.003
Cell Tubulin - Actin Correlation 0.088 692 of 5322 0.017
Cell DNA - Tubulin Correlation 0.088 1123 of 5322 0.011
Cell Shape Area -1.200e-01 4859 of 5322 7.581e-04
Cell Shape Eccentricity -2.500e-03 3874 of 5322 0.990
Mitotic Score Rank FDR q-value
Nucleus DNA Integrated 0.185 1420 of 5322 0.872
Nucleus DNA Mean -4.458e-02 3643 of 5322 1.000
Nucleus DNA Mass Displacement 0.260 416 of 5322 0.999
Nucleus DNA Mean Frac 3 0.132 1174 of 5322 1.000
Nucleus gH2AX Mean 0.009 2831 of 5322 1.000
Nucleus gH2AX Mean Frac 0 -1.463e-01 4345 of 5322 1.000
Nucleus Tubulin Mean Frac 0 0.443 113 of 5322 0.221
Nucleus Tubulin Mean Edge 0.440 76 of 5322 0.275
Nucleus Tubulin Std Edge 0.188 528 of 5322 0.999
Nucleus Shape Area 0.352 576 of 5322 0.367
Nucleus Shape Eccentricity 0.077 1084 of 5322 1.000
Nucleus Shape Form Factor -2.319e-01 4396 of 5322 0.976
Cell Tubulin Mean 0.614 52 of 5322 0.033
Cell Tubulin Mean Frac 3 -4.445e-01 5117 of 5322 0.230
Cell Actin Mean 0.092 1998 of 5322 0.997
Cell Shape Area 0.241 1043 of 5322 0.961
( Reset Zoom )
Brightness
Contrast
Opacity
Brightness
Contrast
Opacity
Brightness
Contrast
Opacity
Brightness
Contrast
Opacity
Brightness
Contrast
Opacity

( Reset Zoom )
Brightness
Contrast
Opacity
Brightness
Contrast
Opacity
Brightness
Contrast
Opacity
Brightness
Contrast
Opacity
Brightness
Contrast
Opacity

MIT Central Accessability