CFL1

Gene symbol: CFL1
Gene: 1072
Uniprot Function: Binds to F-actin and exhibits pH-sensitive F-actin depolymerizing activity (PubMed:11812157). In conjunction with the subcortical maternal complex (SCMC), plays an essential role for zygotes to progress beyond the first embryonic cell divisions via regulation of actin dynamics (PubMed:15580268). Required for the centralization of the mitotic spindle and symmetric division of zygotes (By similarity). Plays a role in the regulation of cell morphology and cytoskeletal organization in epithelial cells (PubMed:21834987). Required for the up-regulation of atypical chemokine receptor ACKR2 from endosomal compartment to cell membrane, increasing its efficiency in chemokine uptake and degradation (PubMed:23633677). Required for neural tube morphogenesis and neural crest cell migration (By similarity).
Mitotic Index 0.0246
Interphase Cluster: #147 (19 genes)
Mitotic Cluster: #15 (41 genes)
sgRNA 1: GCGTAAGTCTTCAACGCCAG (interphase cells: 893, mitotic cells: 29)
sgRNA 2: TCTTGACAAAGGTGGCGTAG (interphase cells: 1637, mitotic cells: 48)
sgRNA 3: TGATGCAACCTATGAGACCA (interphase cells: 2521, mitotic cells: 60)
sgRNA 4: TTGCATCATAGAGGGCATAG (interphase cells: 1844, mitotic cells: 37)

Interphase Cluster

Mitotic Cluster

Overview

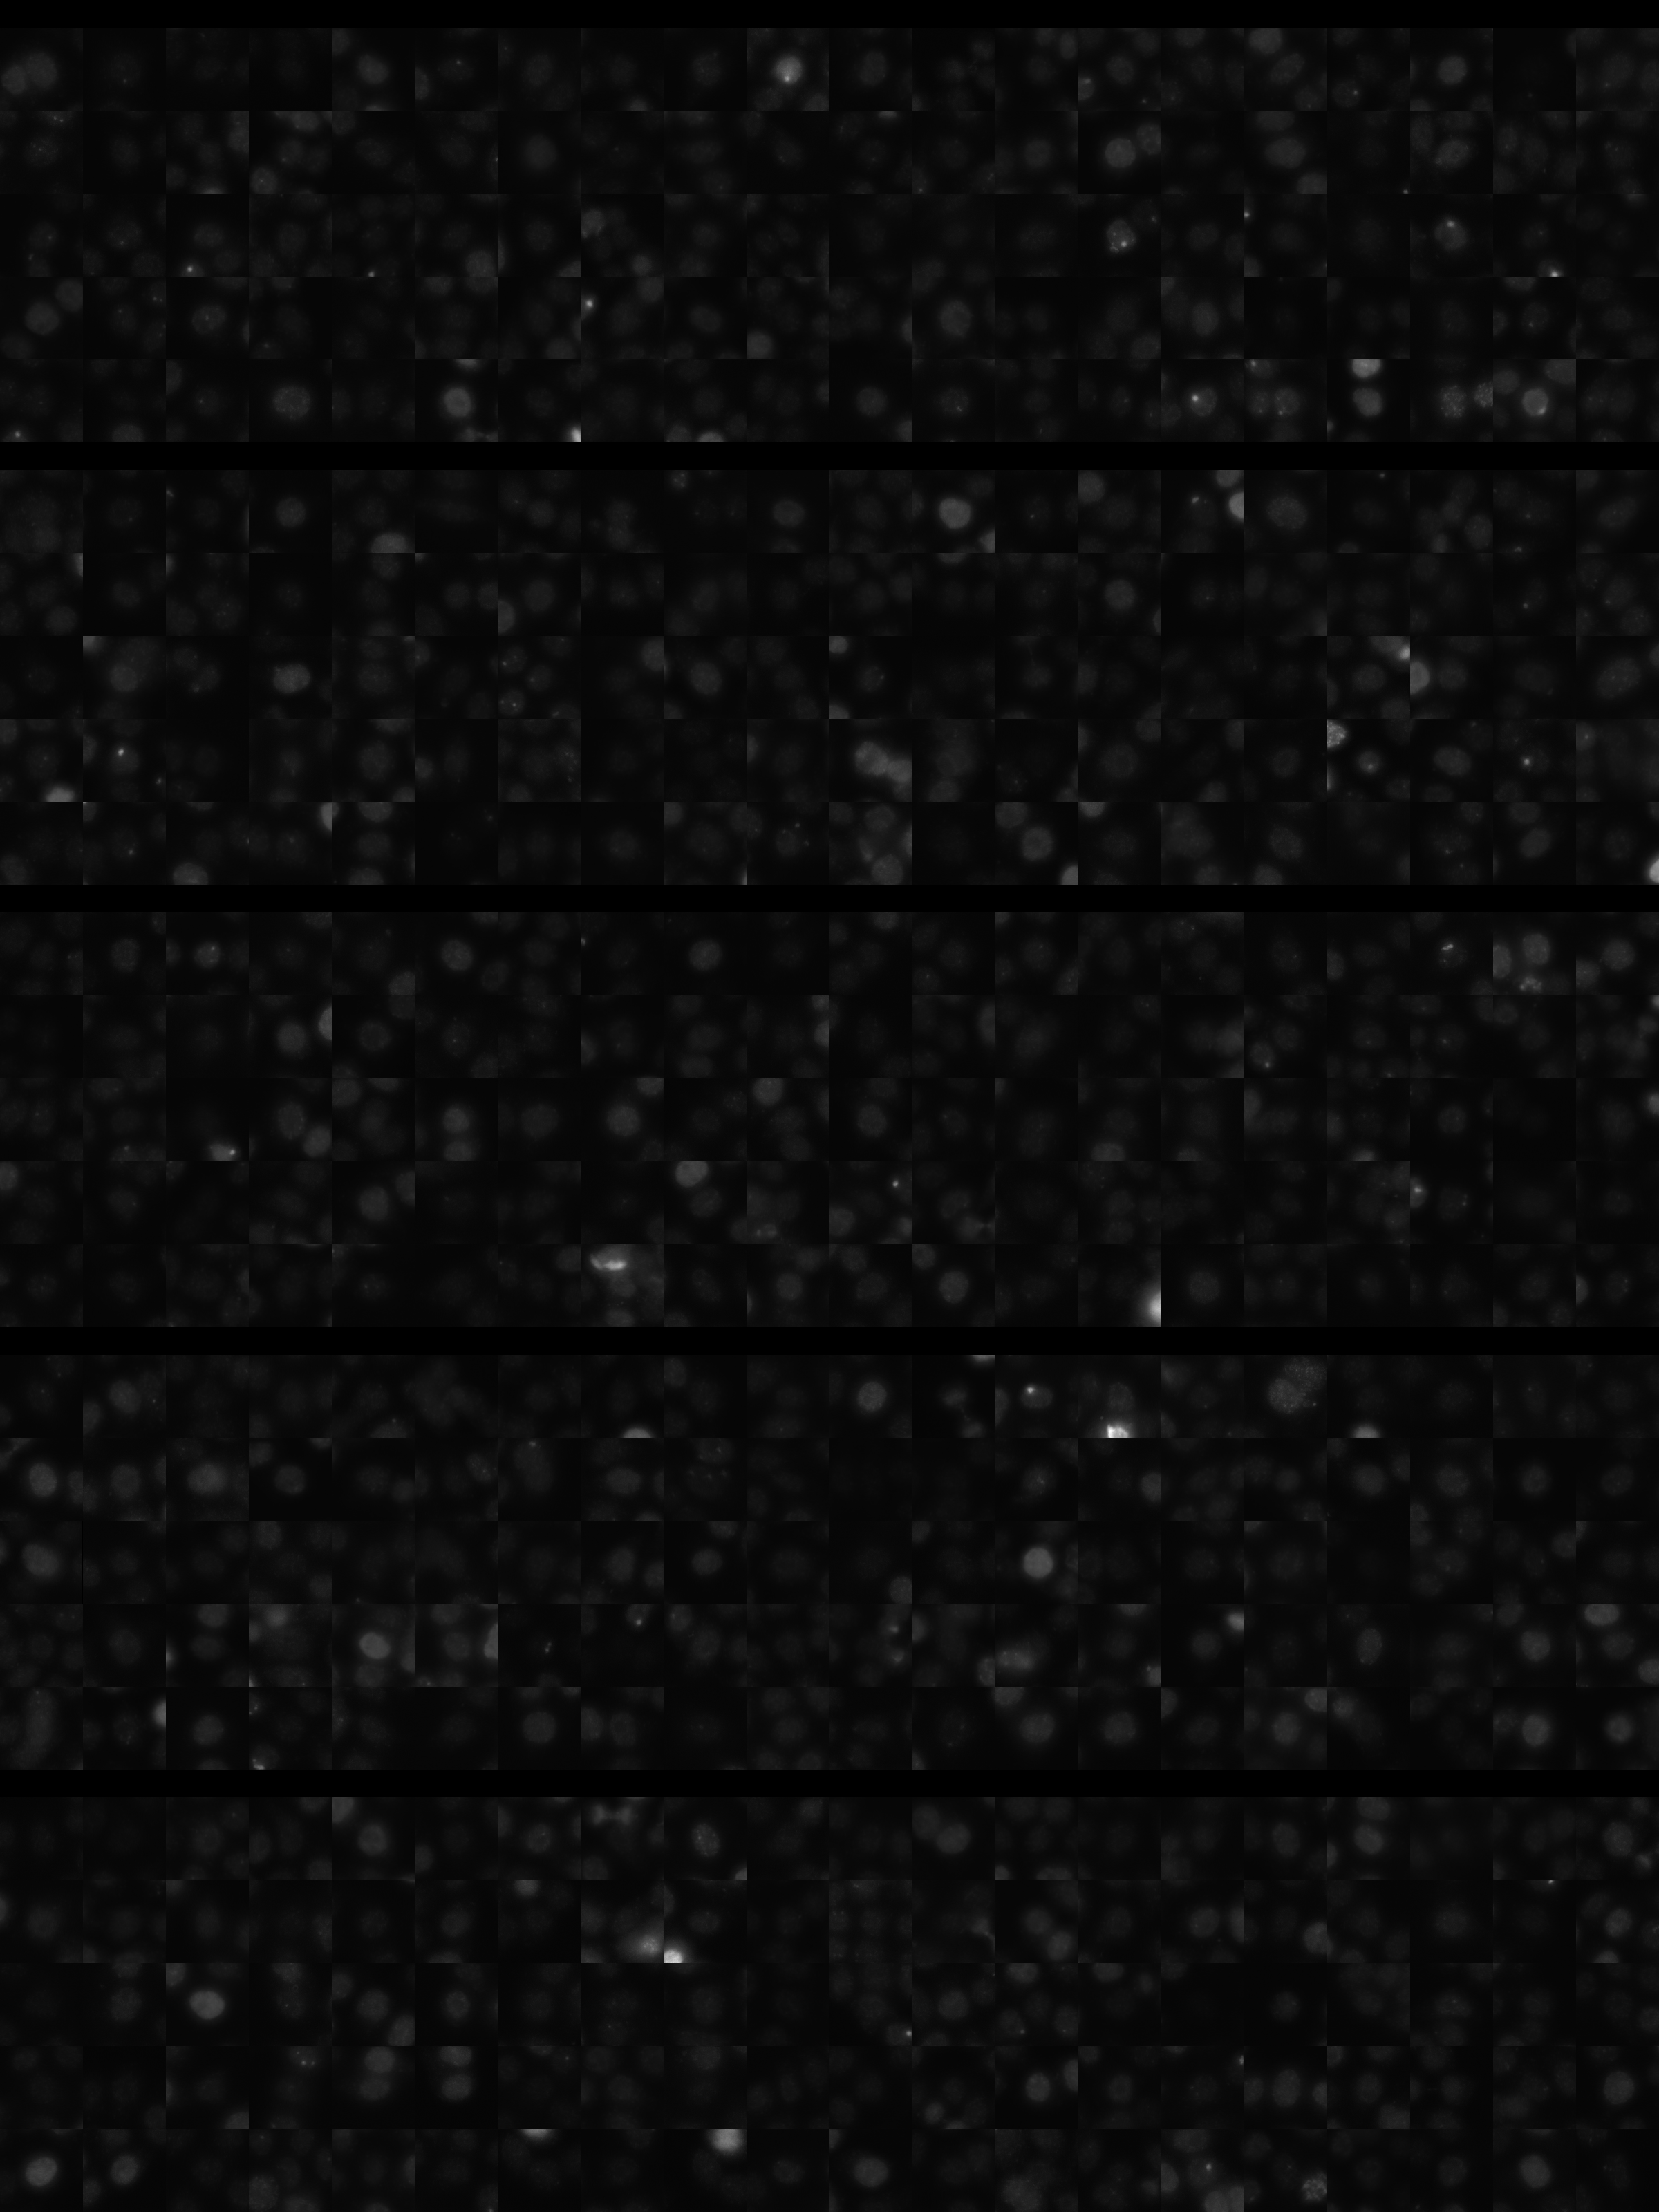
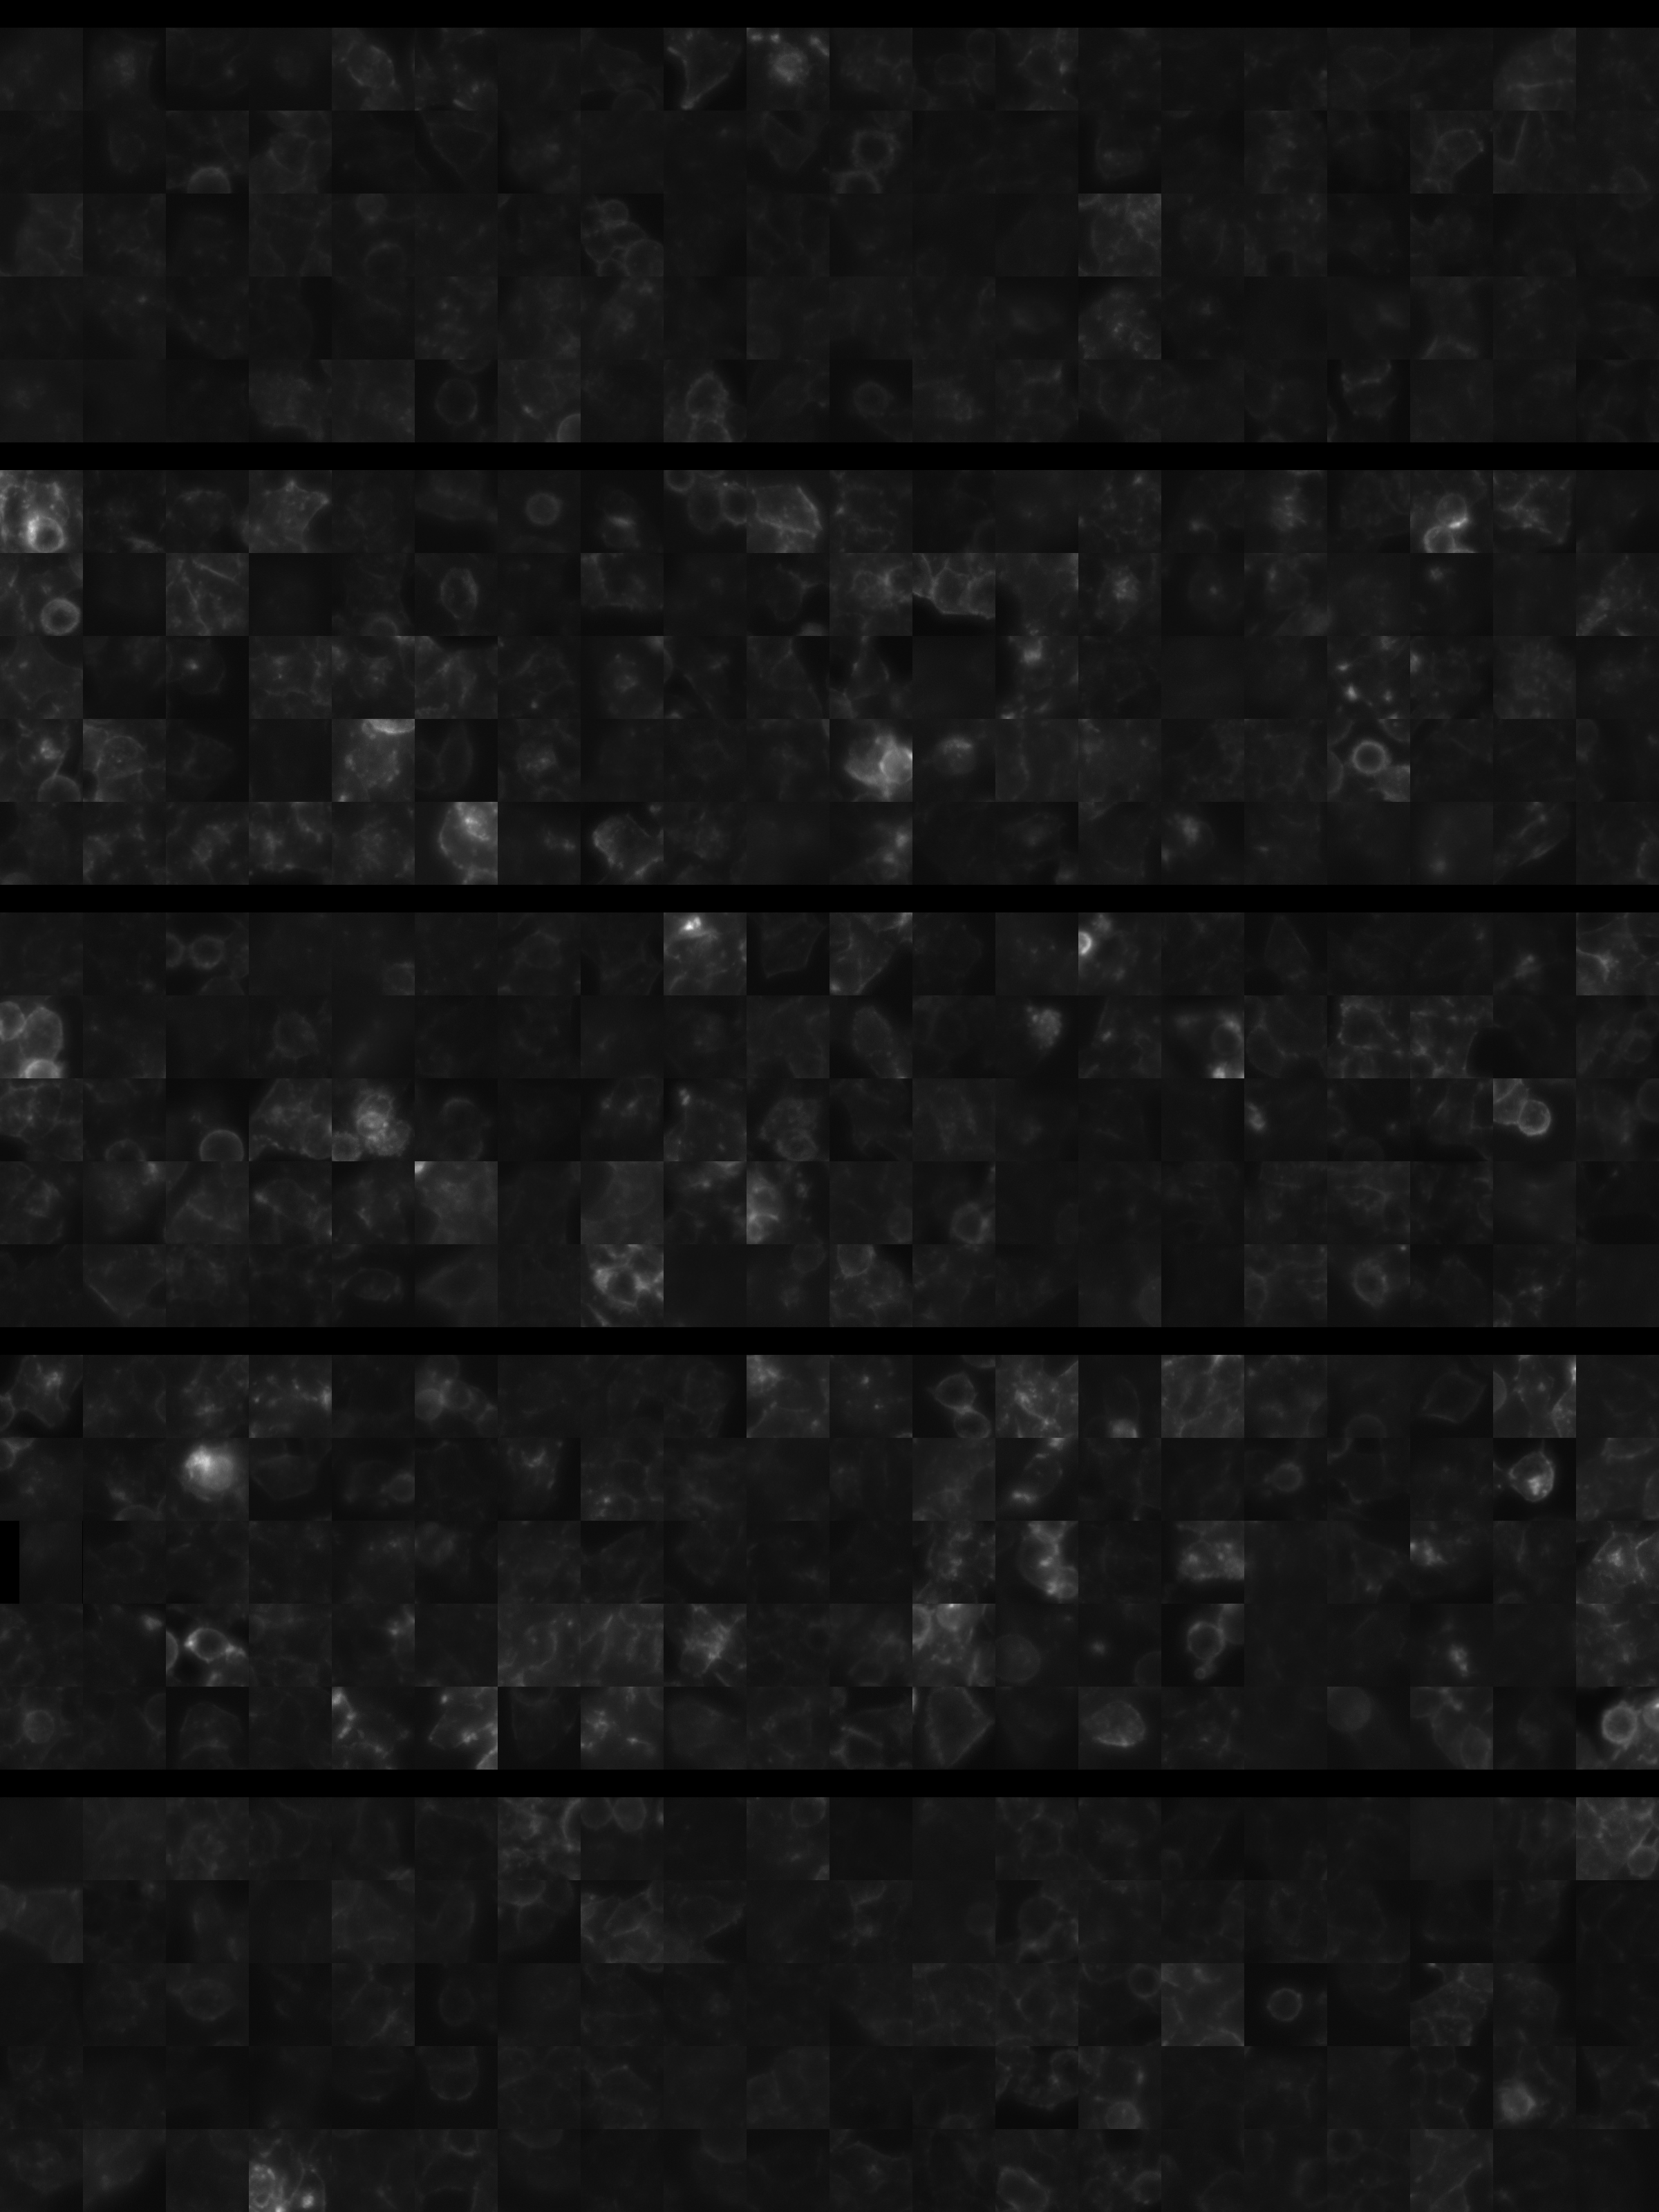
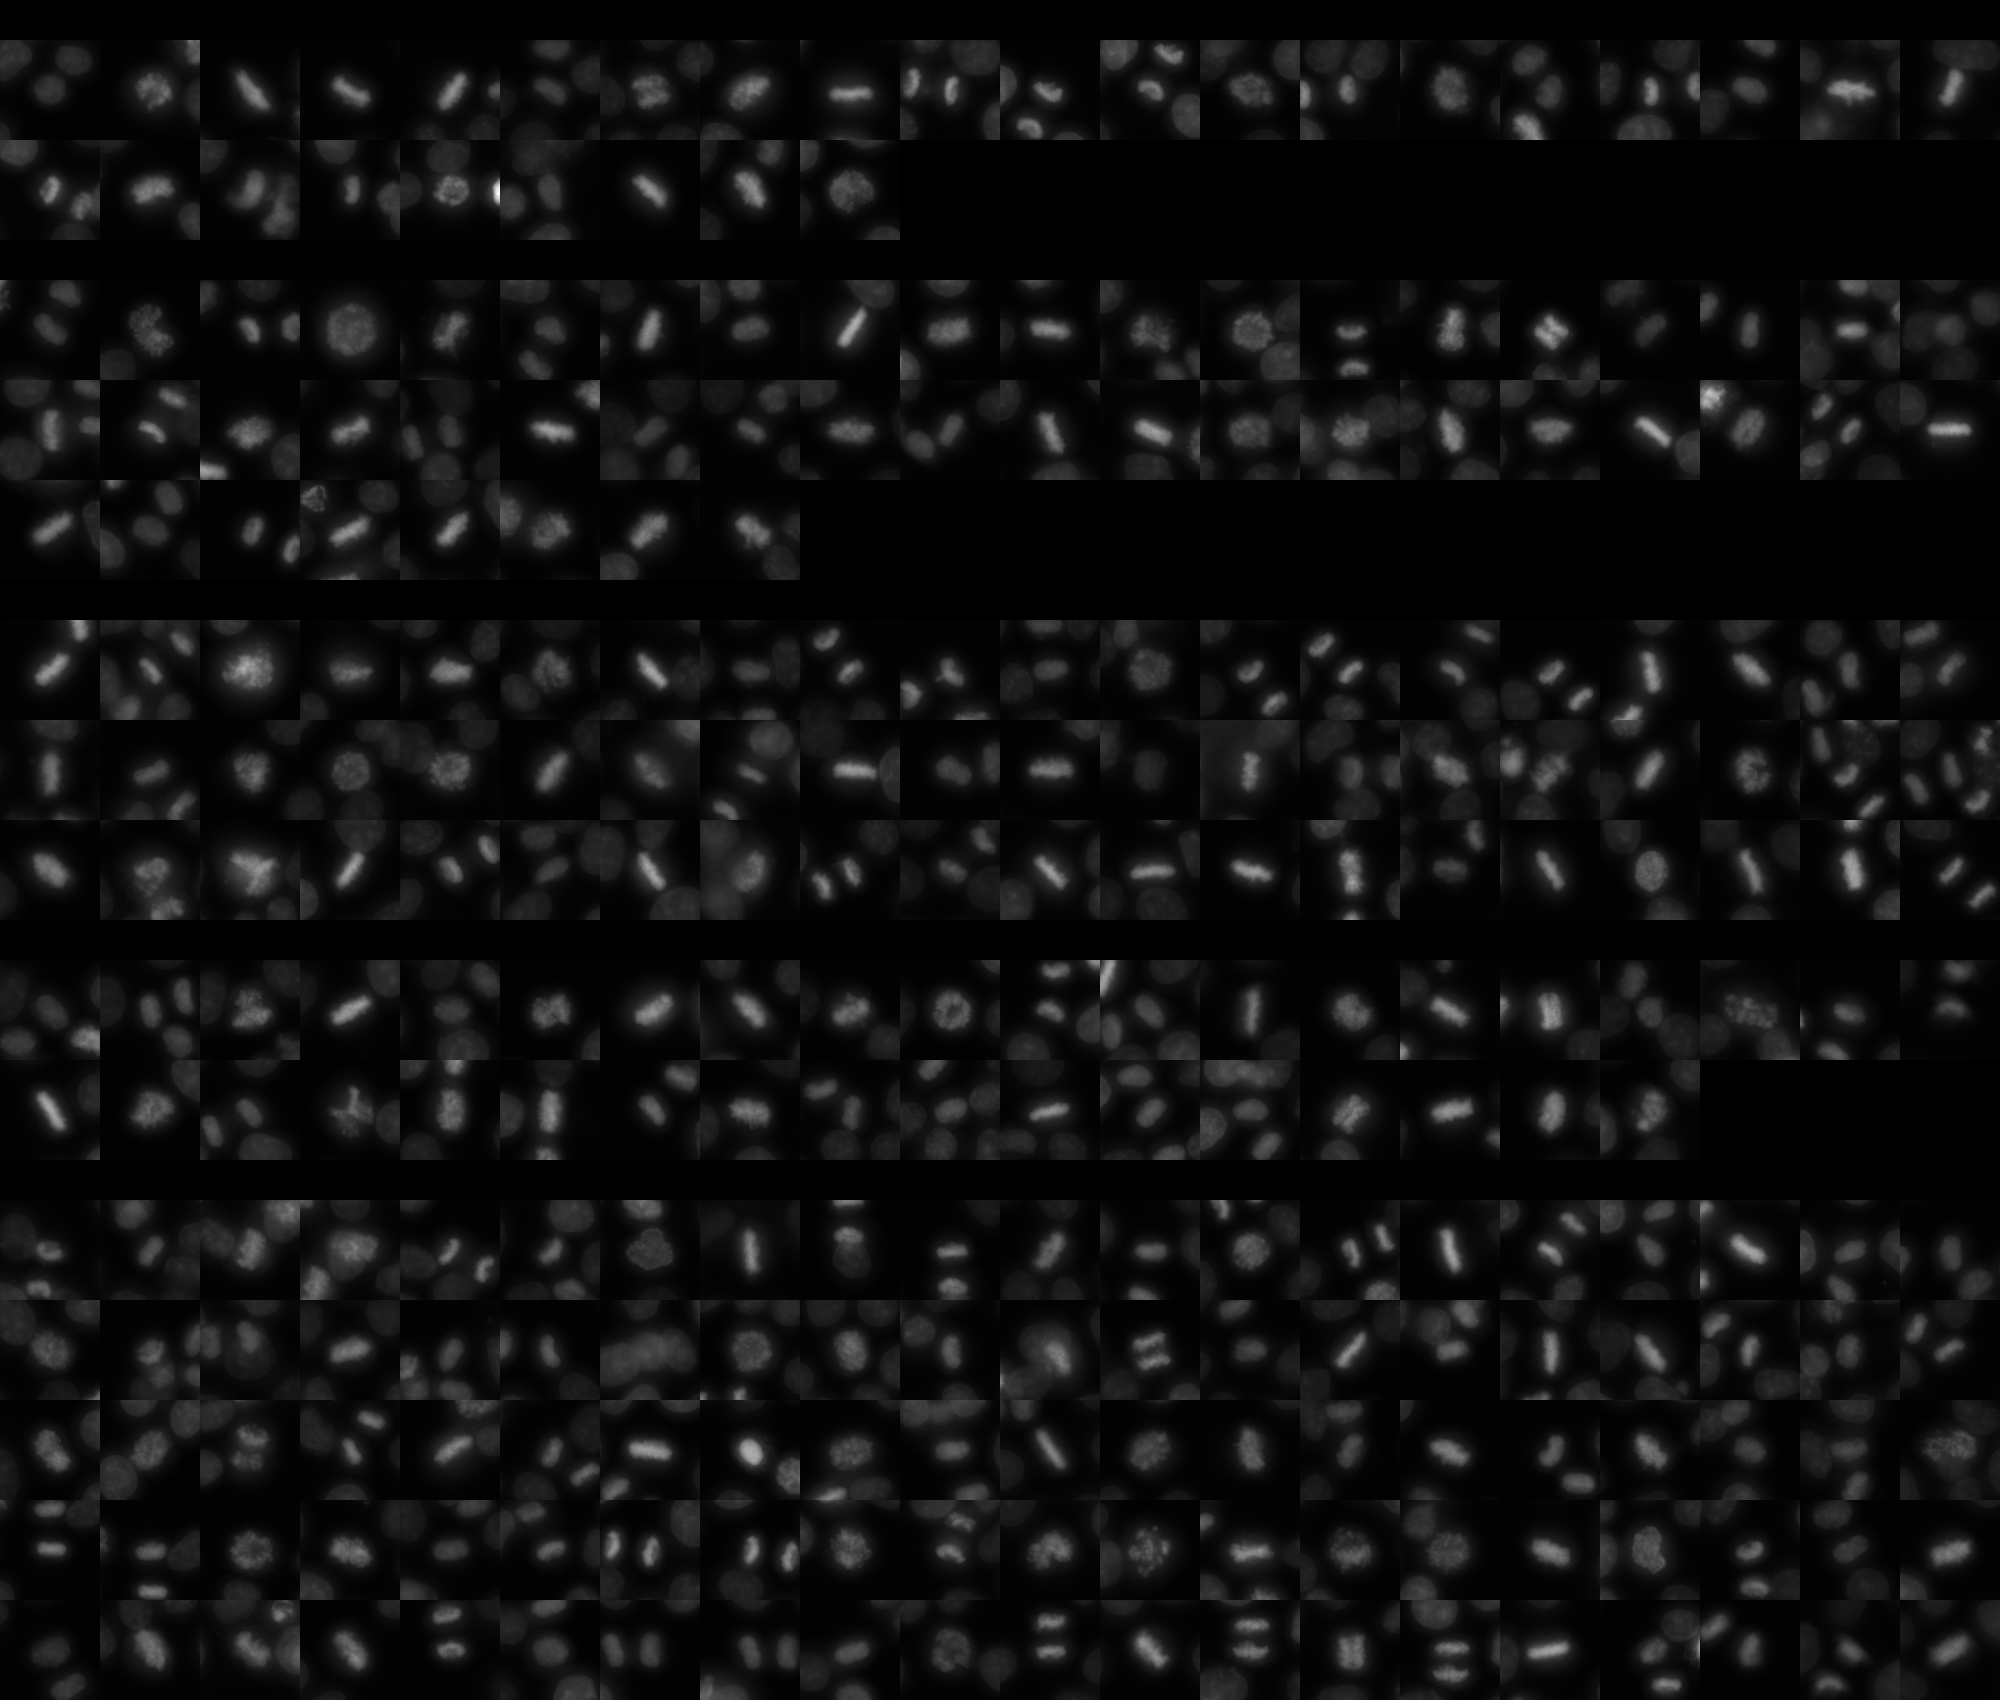
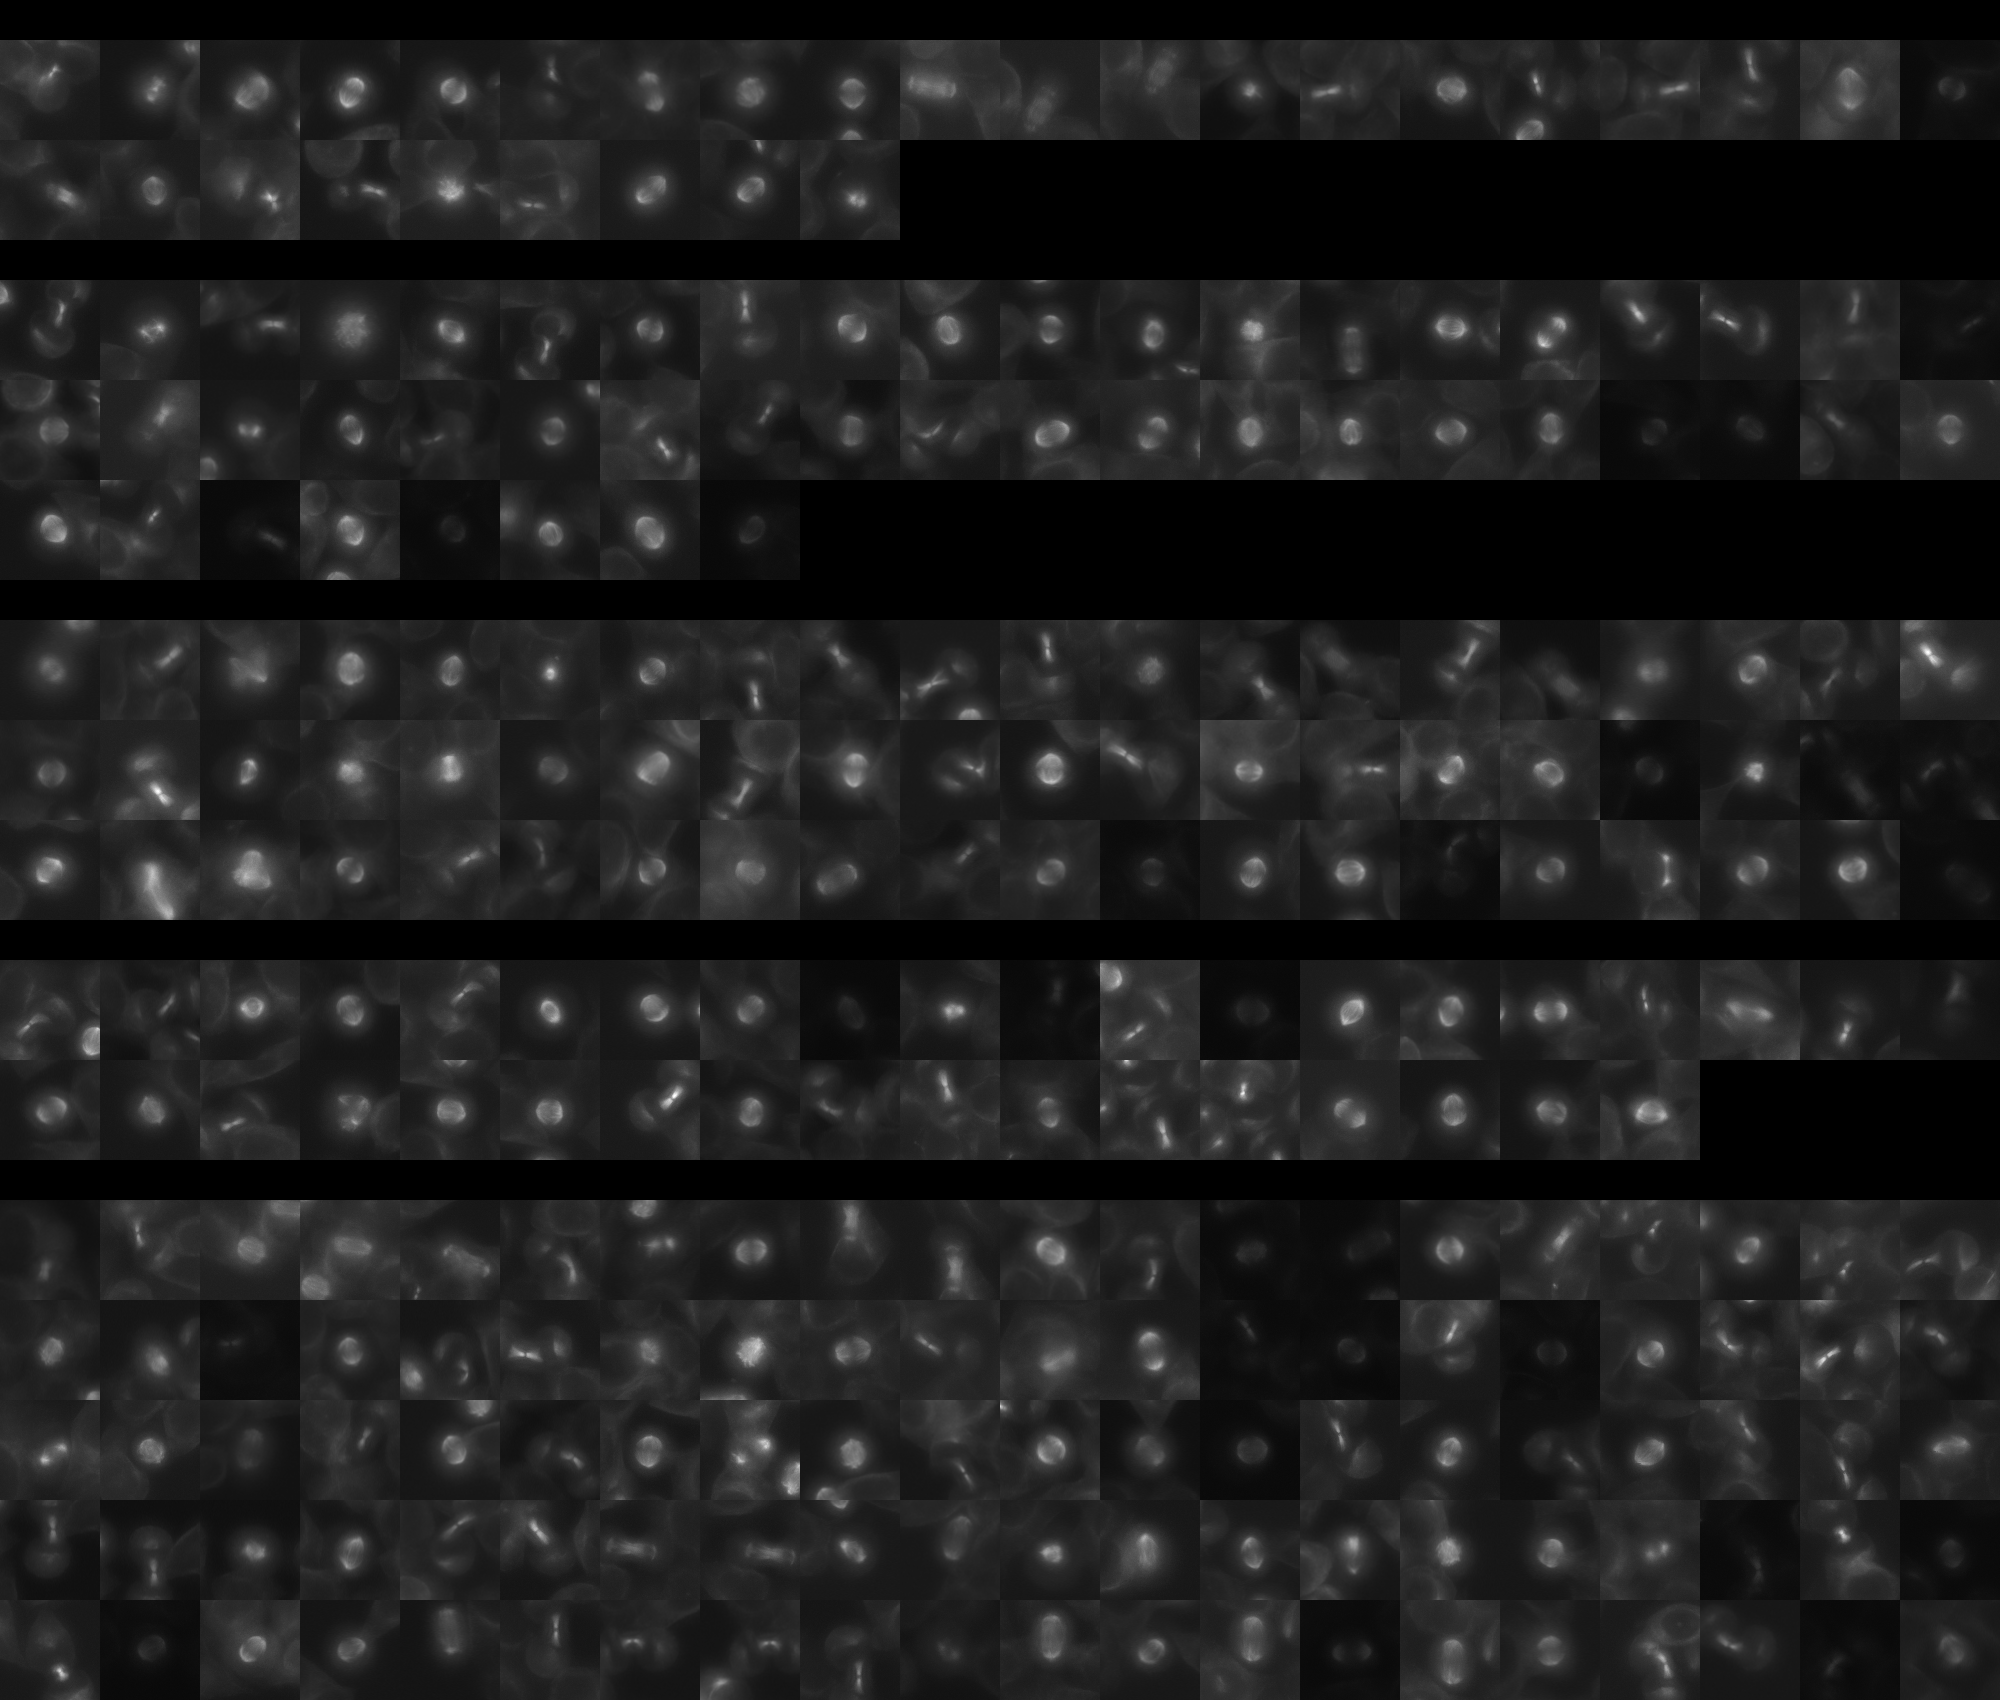
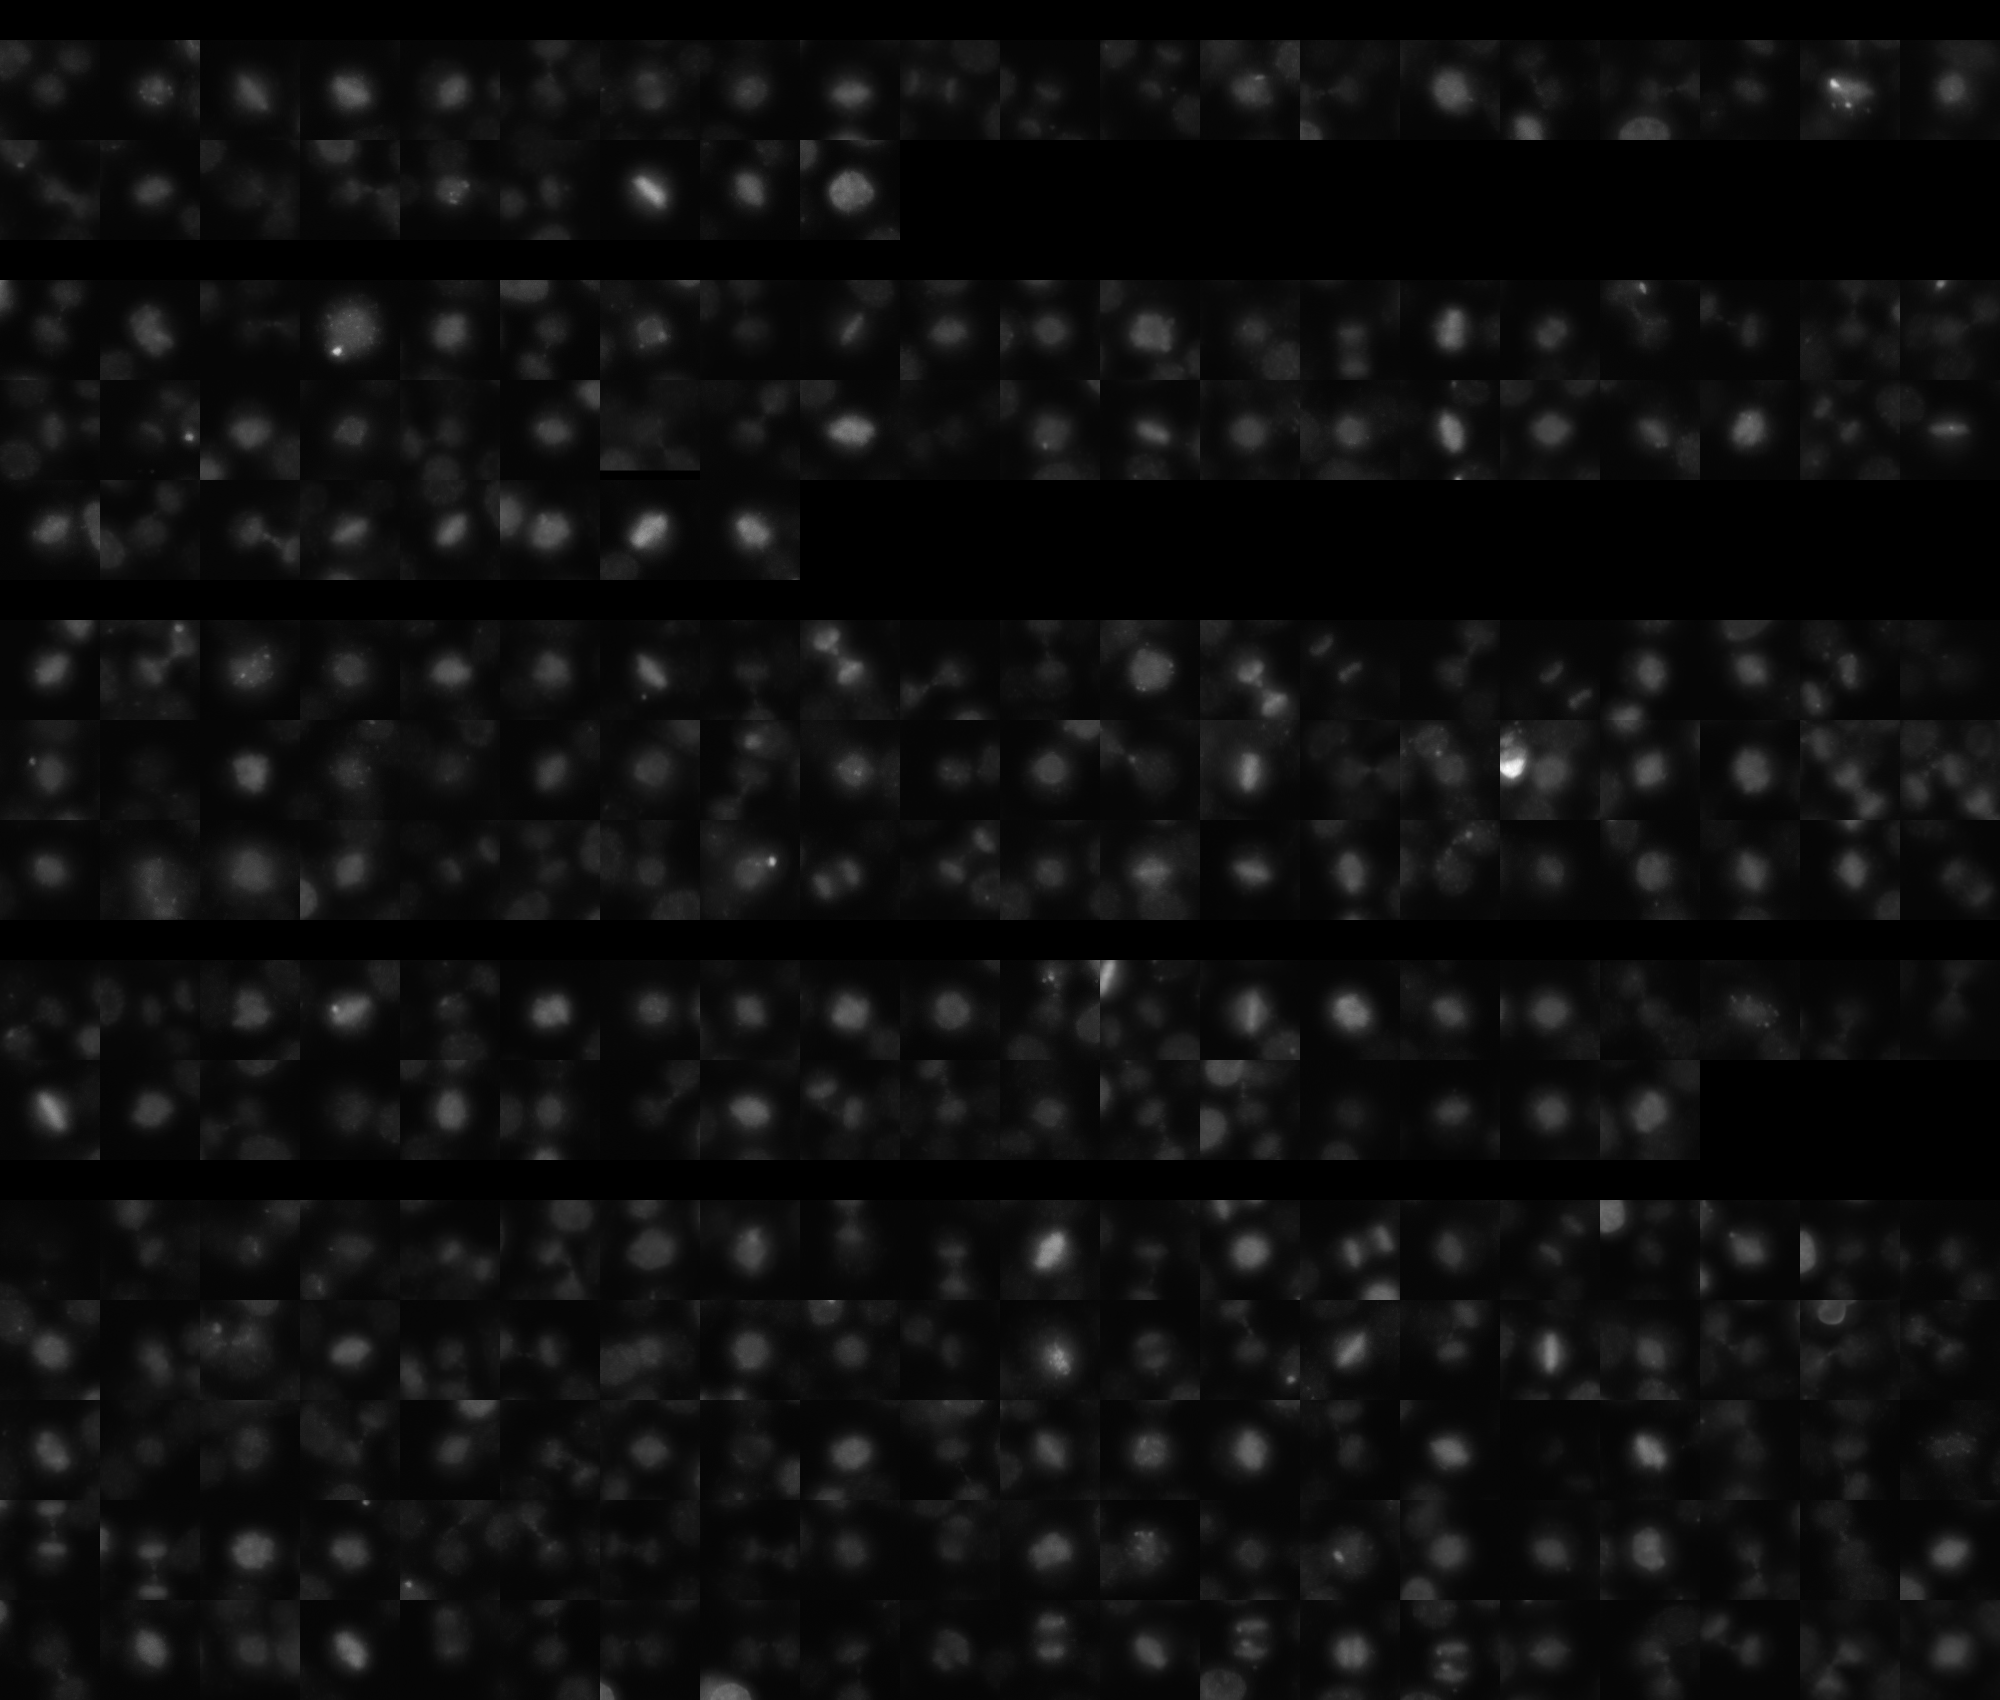
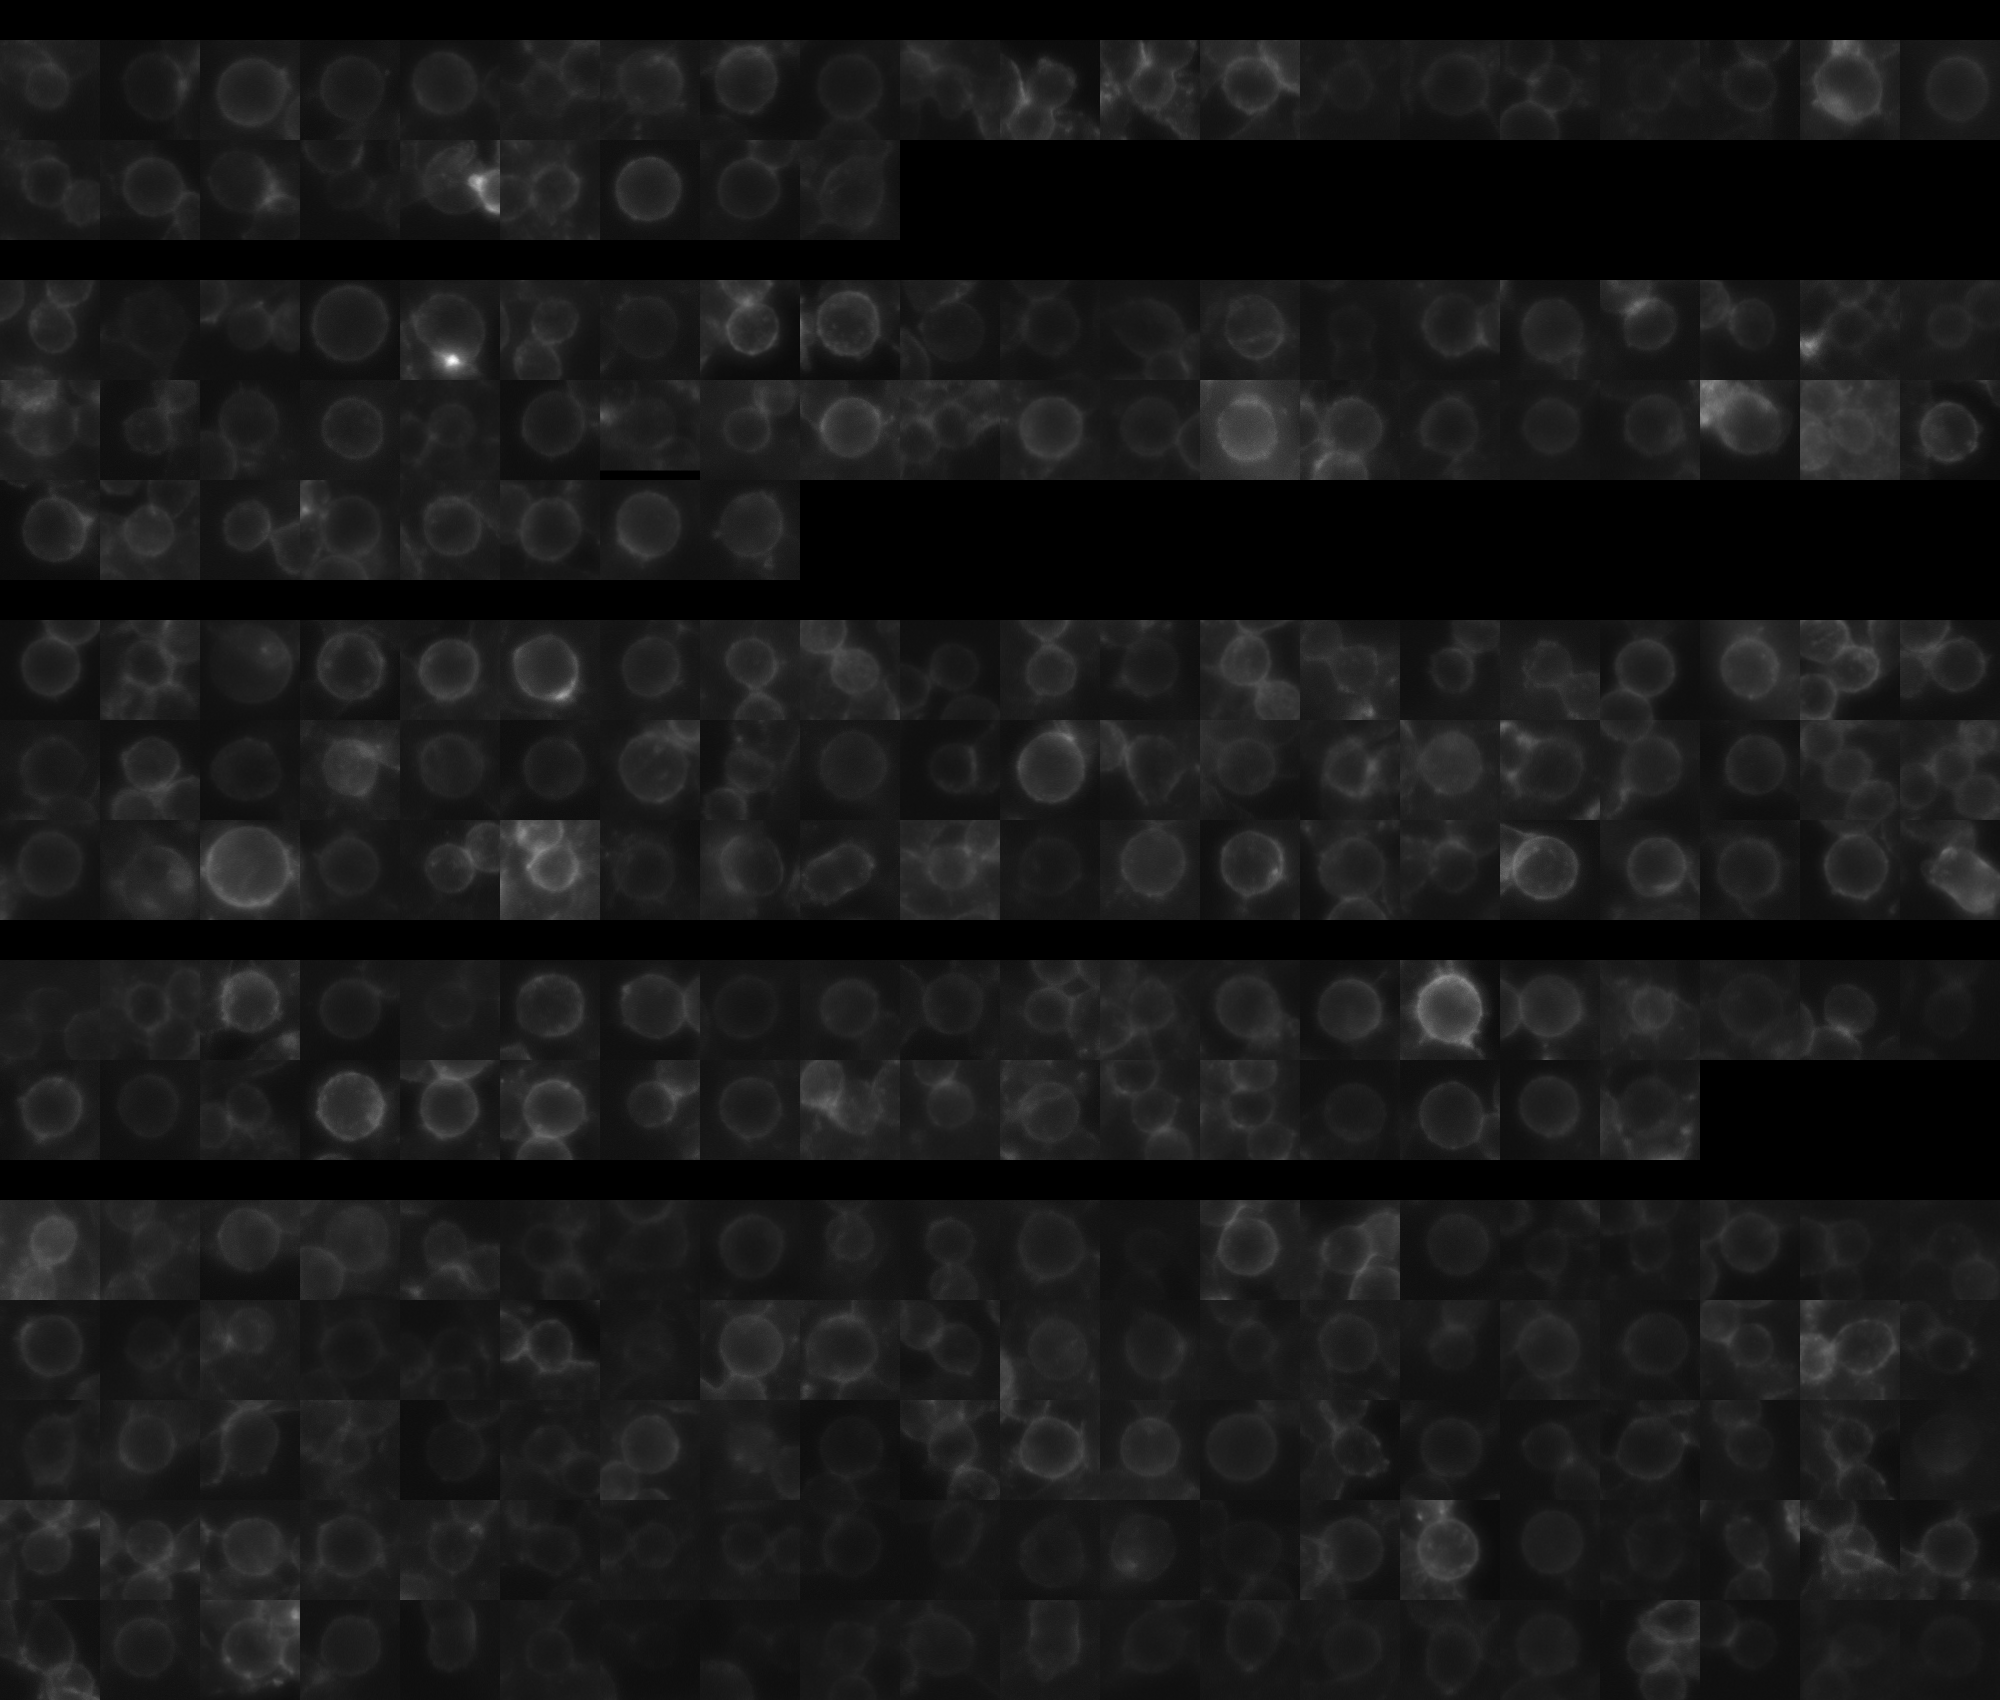
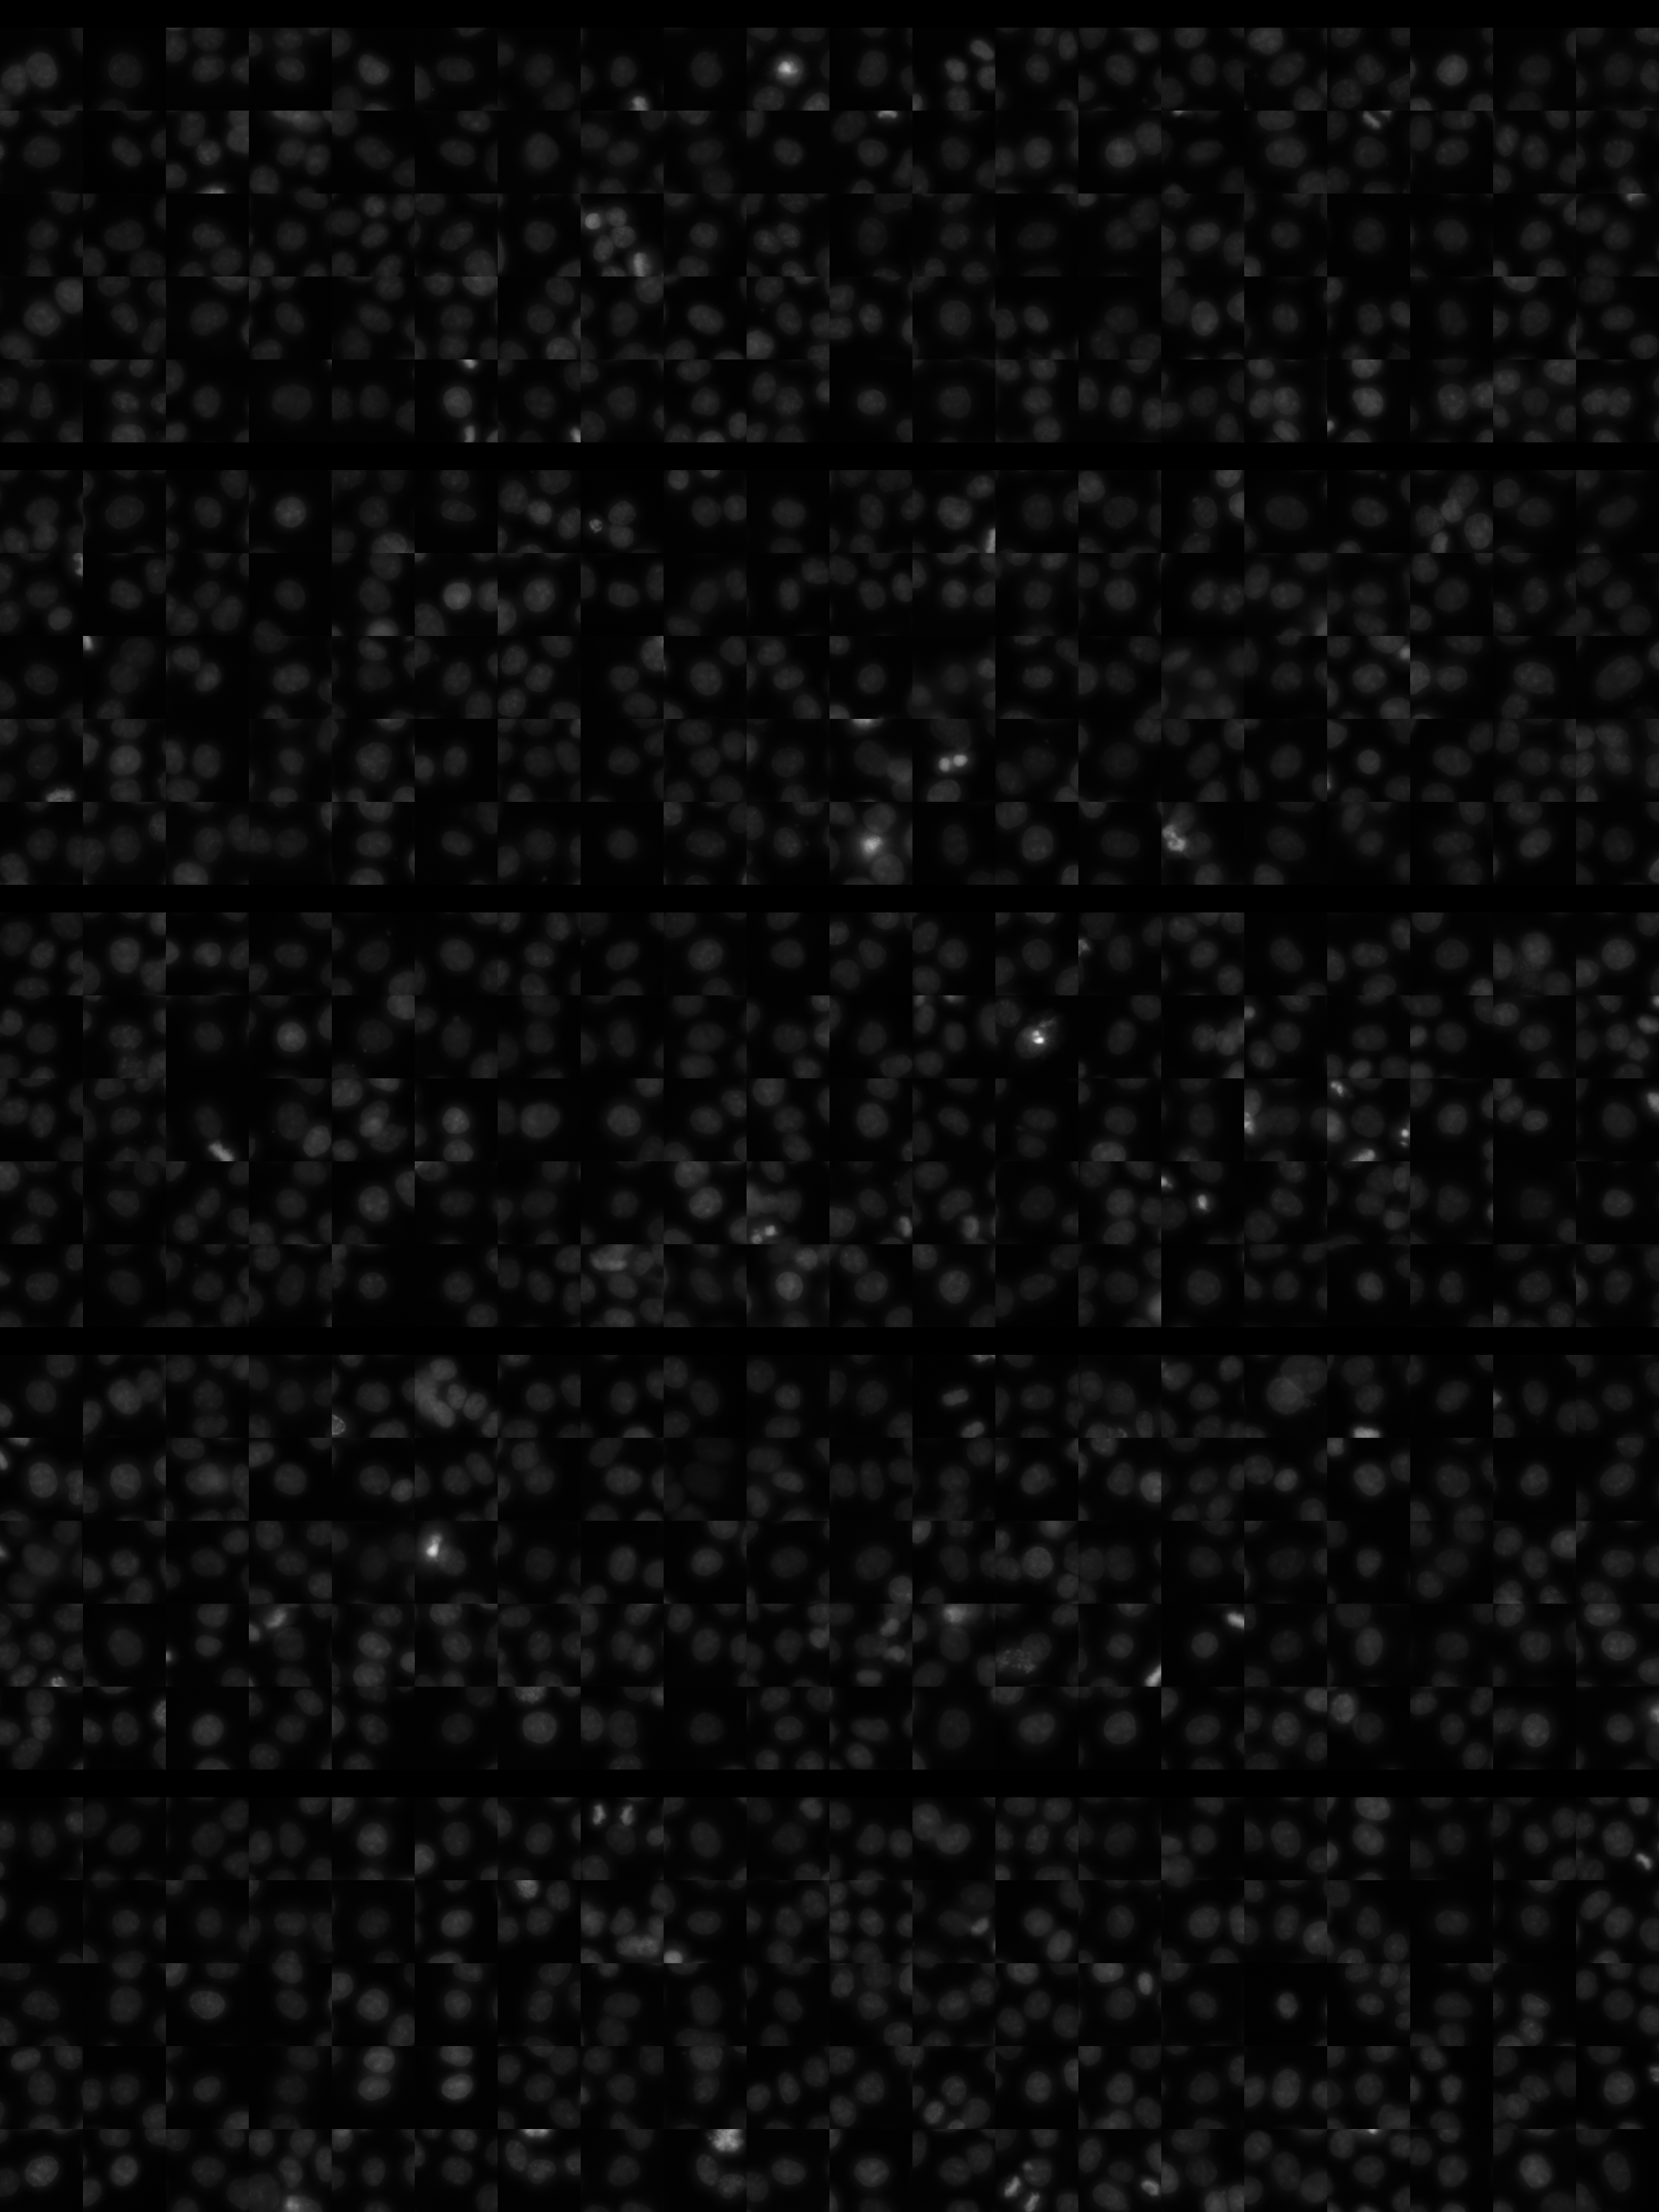
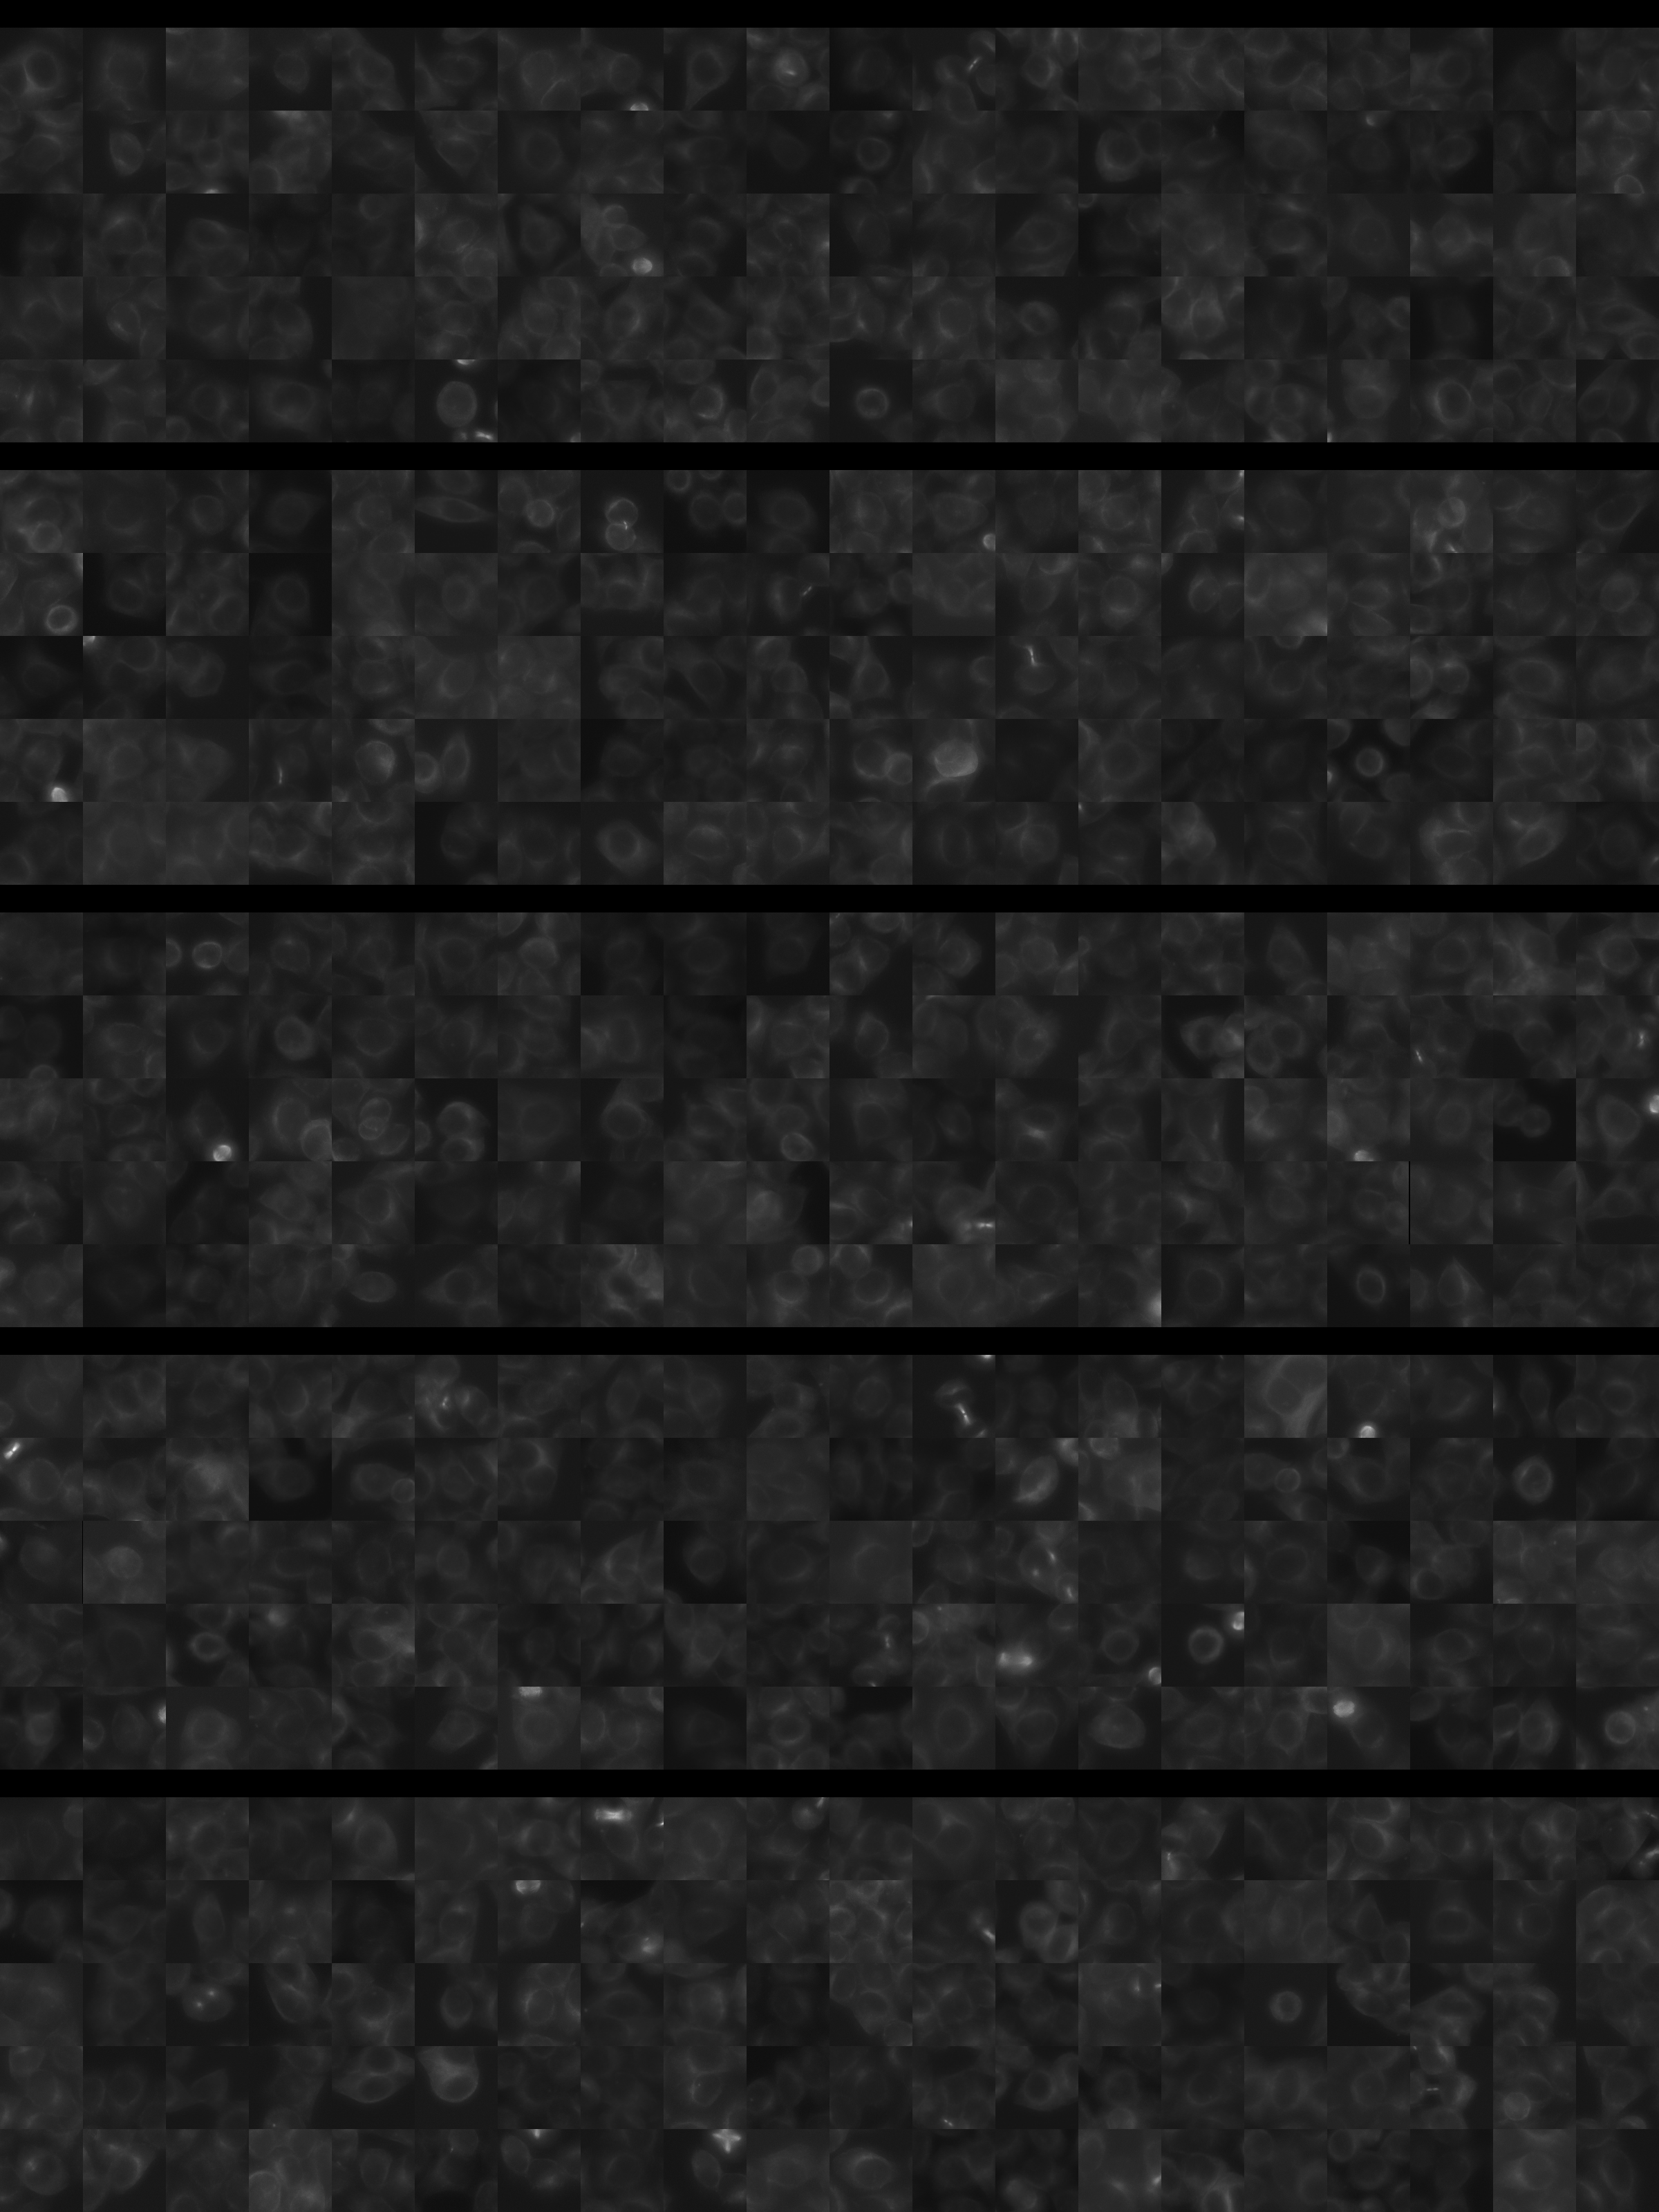
Each montage below shows randomly selected individual cell images for the same target gene separated by sgRNA, along with an example montage of cells expressing a non-targeting negative control sgRNA at the bottom. sgRNA labels in the montages correspond to the numbered sgRNA sequences in the gene info table above. The DNA (blue) and tubulin (green) channels are displayed by default, with gH2AX (grayscale) and actin (yellow) available using the check boxes. Channel brightness, contrast, and opacity are adjustable by clicking the arrow next to the channel name. When only one channel is selected, the display defaults to grayscale. Click the “Zoom” checkbox above the channel controls to enable image zooming (via scrolling) and panning (via click-and-drag).

The cell boxes displayed for this gene are square, 36.43 μm per side for the interphase montage and 30.36 μm per side for the mitotic montage.
Features

Interphase Score Rank FDR q-value
Nucleus DNA Integrated 0.069 663 of 5322 0.208
Nucleus DNA Mean -1.756e-01 5054 of 5322 1.505e-04
Nucleus gH2AX Mean 0.154 967 of 5322 3.502e-04
Nucleus DNA - gH2AX Correlation -2.826e-01 5259 of 5322 1.021e-04
Nucleus Shape Area 0.201 258 of 5322 1.633e-04
Nucleus Shape Eccentricity 0.069 506 of 5322 0.052
Nucleus Shape Form Factor -1.168e-01 4660 of 5322 0.002
Nucleus Shape Solidity -7.772e-02 3743 of 5322 0.019
Cell DNA Mass Displacement 0.157 63 of 5322 0.001
Cell Tubulin Mean -8.385e-02 4789 of 5322 0.052
Cell Tubulin Mass Displacement 0.076 296 of 5322 0.021
Cell Actin Mean 1.385 8 of 5322 1.723e-04
Cell Tubulin - Actin Correlation 0.366 17 of 5322 2.896e-04
Cell DNA - Tubulin Correlation 0.499 48 of 5322 1.948e-04
Cell Shape Area 0.234 184 of 5322 1.651e-04
Cell Shape Eccentricity 0.060 351 of 5322 0.220
Mitotic Score Rank FDR q-value
Nucleus DNA Integrated 0.066 2998 of 5322 0.979
Nucleus DNA Mean 0.215 505 of 5322 1.000
Nucleus DNA Mass Displacement 0.124 1568 of 5322 0.999
Nucleus DNA Mean Frac 3 -9.559e-02 4392 of 5322 1.000
Nucleus gH2AX Mean 0.230 586 of 5322 1.000
Nucleus gH2AX Mean Frac 0 0.020 1978 of 5322 1.000
Nucleus Tubulin Mean Frac 0 -2.897e-02 3897 of 5322 0.999
Nucleus Tubulin Mean Edge 0.057 2417 of 5322 0.999
Nucleus Tubulin Std Edge 0.142 841 of 5322 0.999
Nucleus Shape Area 0.008 3861 of 5322 0.995
Nucleus Shape Eccentricity 0.220 166 of 5322 1.000
Nucleus Shape Form Factor -3.640e-02 1908 of 5322 0.998
Cell Tubulin Mean -1.223e-01 4734 of 5322 0.997
Cell Tubulin Mean Frac 3 -1.796e-01 3860 of 5322 0.999
Cell Actin Mean 1.103 6 of 5322 0.010
Cell Shape Area 0.186 1540 of 5322 0.994
( Reset Zoom )
Brightness
Contrast
Opacity
Brightness
Contrast
Opacity
Brightness
Contrast
Opacity
Brightness
Contrast
Opacity
Brightness
Contrast
Opacity

( Reset Zoom )
Brightness
Contrast
Opacity
Brightness
Contrast
Opacity
Brightness
Contrast
Opacity
Brightness
Contrast
Opacity
Brightness
Contrast
Opacity

MIT Central Accessability