CEBPA

Gene symbol: CEBPA
Gene: 1050
Uniprot Function: Transcription factor that coordinates proliferation arrest and the differentiation of myeloid progenitors, adipocytes, hepatocytes, and cells of the lung and the placenta. Binds directly to the consensus DNA sequence 5'-T[TG]NNGNAA[TG]-3' acting as an activator on distinct target genes (PubMed:11242107). During early embryogenesis, plays essential and redundant functions with CEBPB. Essential for the transition from common myeloid progenitors (CMP) to granulocyte/monocyte progenitors (GMP). Critical for the proper development of the liver and the lung (By similarity). Necessary for terminal adipocyte differentiation, is required for postnatal maintenance of systemic energy homeostasis and lipid storage (By similarity). To regulate these different processes at the proper moment and tissue, interplays with other transcription factors and modulators. Downregulates the expression of genes that maintain cells in an undifferentiated and proliferative state through E2F1 repression, which is critical for its ability to induce adipocyte and granulocyte terminal differentiation. Reciprocally E2F1 blocks adipocyte differentiation by binding to specific promoters and repressing CEBPA binding to its target gene promoters. Proliferation arrest also depends on a functional binding to SWI/SNF complex (PubMed:14660596). In liver, regulates gluconeogenesis and lipogenesis through different mechanisms. To regulate gluconeogenesis, functionally cooperates with FOXO1 binding to IRE-controlled promoters and regulating the expression of target genes such as PCK1 or G6PC1. To modulate lipogenesis, interacts and transcriptionally synergizes with SREBF1 in promoter activation of specific lipogenic target genes such as ACAS2. In adipose tissue, seems to act as FOXO1 coactivator accessing to ADIPOQ promoter through FOXO1 binding sites (By similarity).
Mitotic Index 0.0275
Interphase Cluster: #208 (9 genes)
Mitotic Cluster: #140 (20 genes)
sgRNA 1: CACCCCGACCTCCGCGCGAG (interphase cells: 1641, mitotic cells: 41)
sgRNA 2: CCTGCCGTCCAGGTAGCCGG (interphase cells: 1281, mitotic cells: 36)
sgRNA 3: GTCGGCCGACTTCTACGAGG (interphase cells: 269, mitotic cells: 12)
sgRNA 4: TGAAGCCAAGCAGCTGGCGC (interphase cells: 2785, mitotic cells: 80)

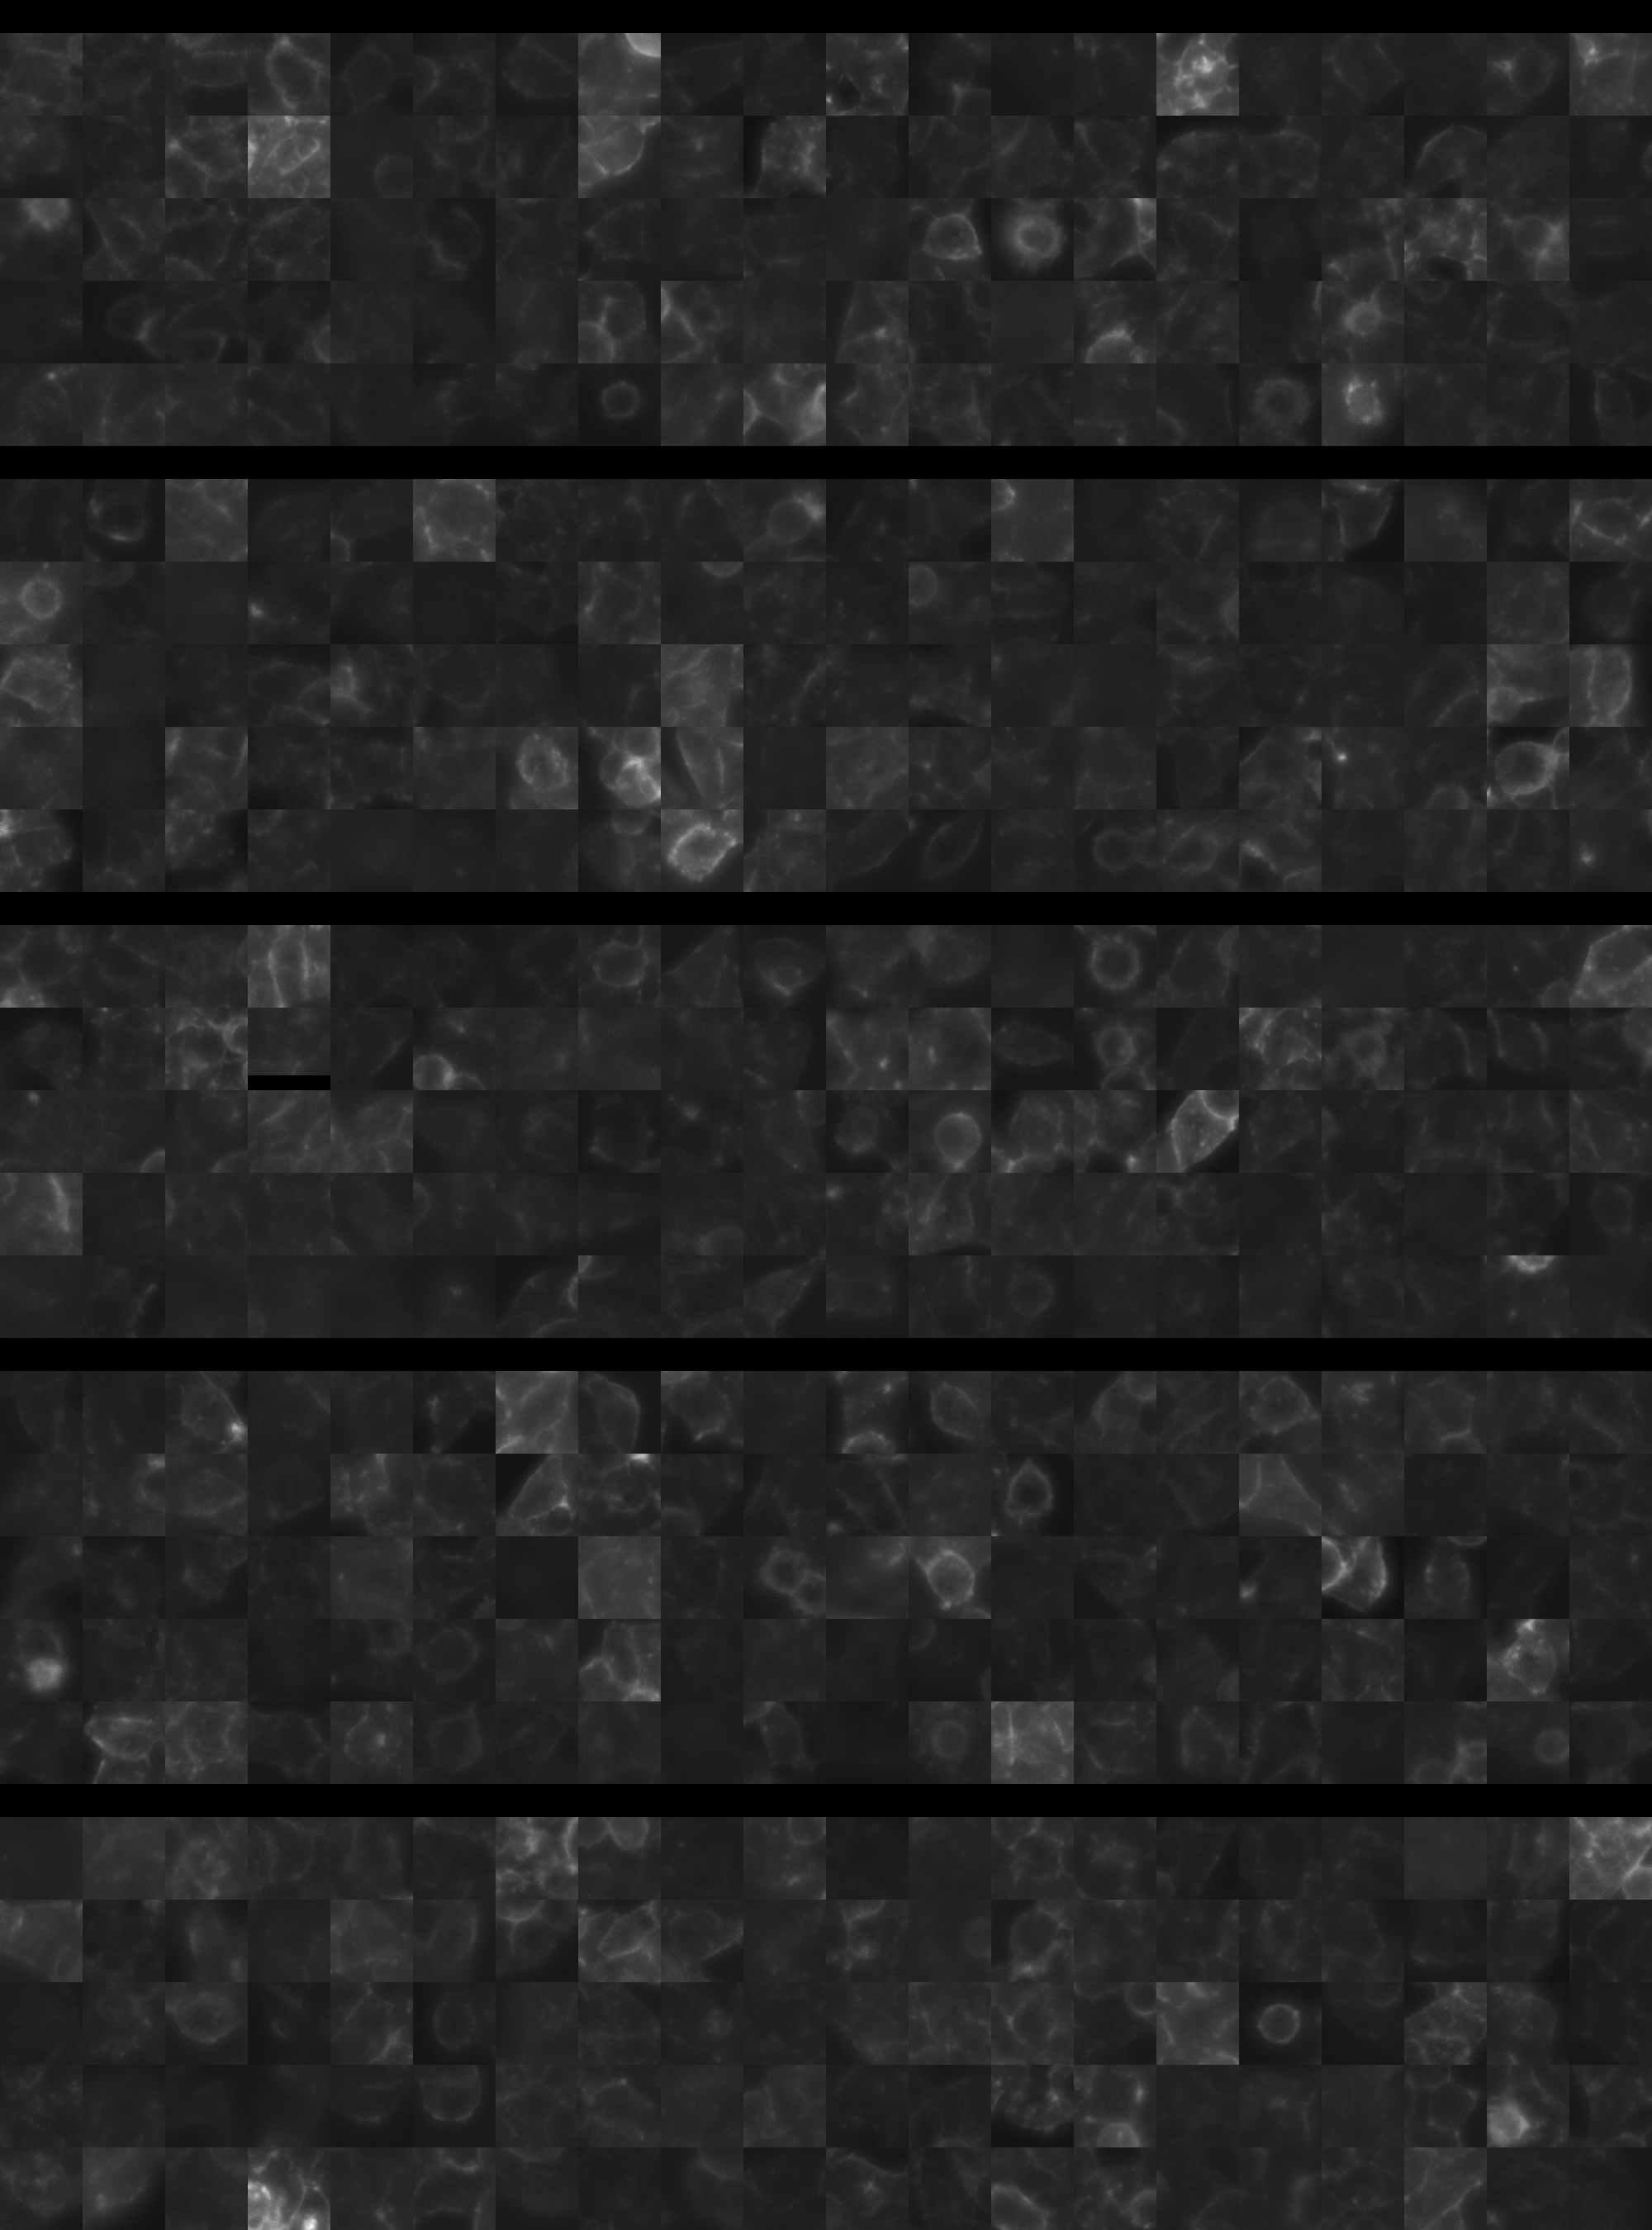
Interphase Cluster

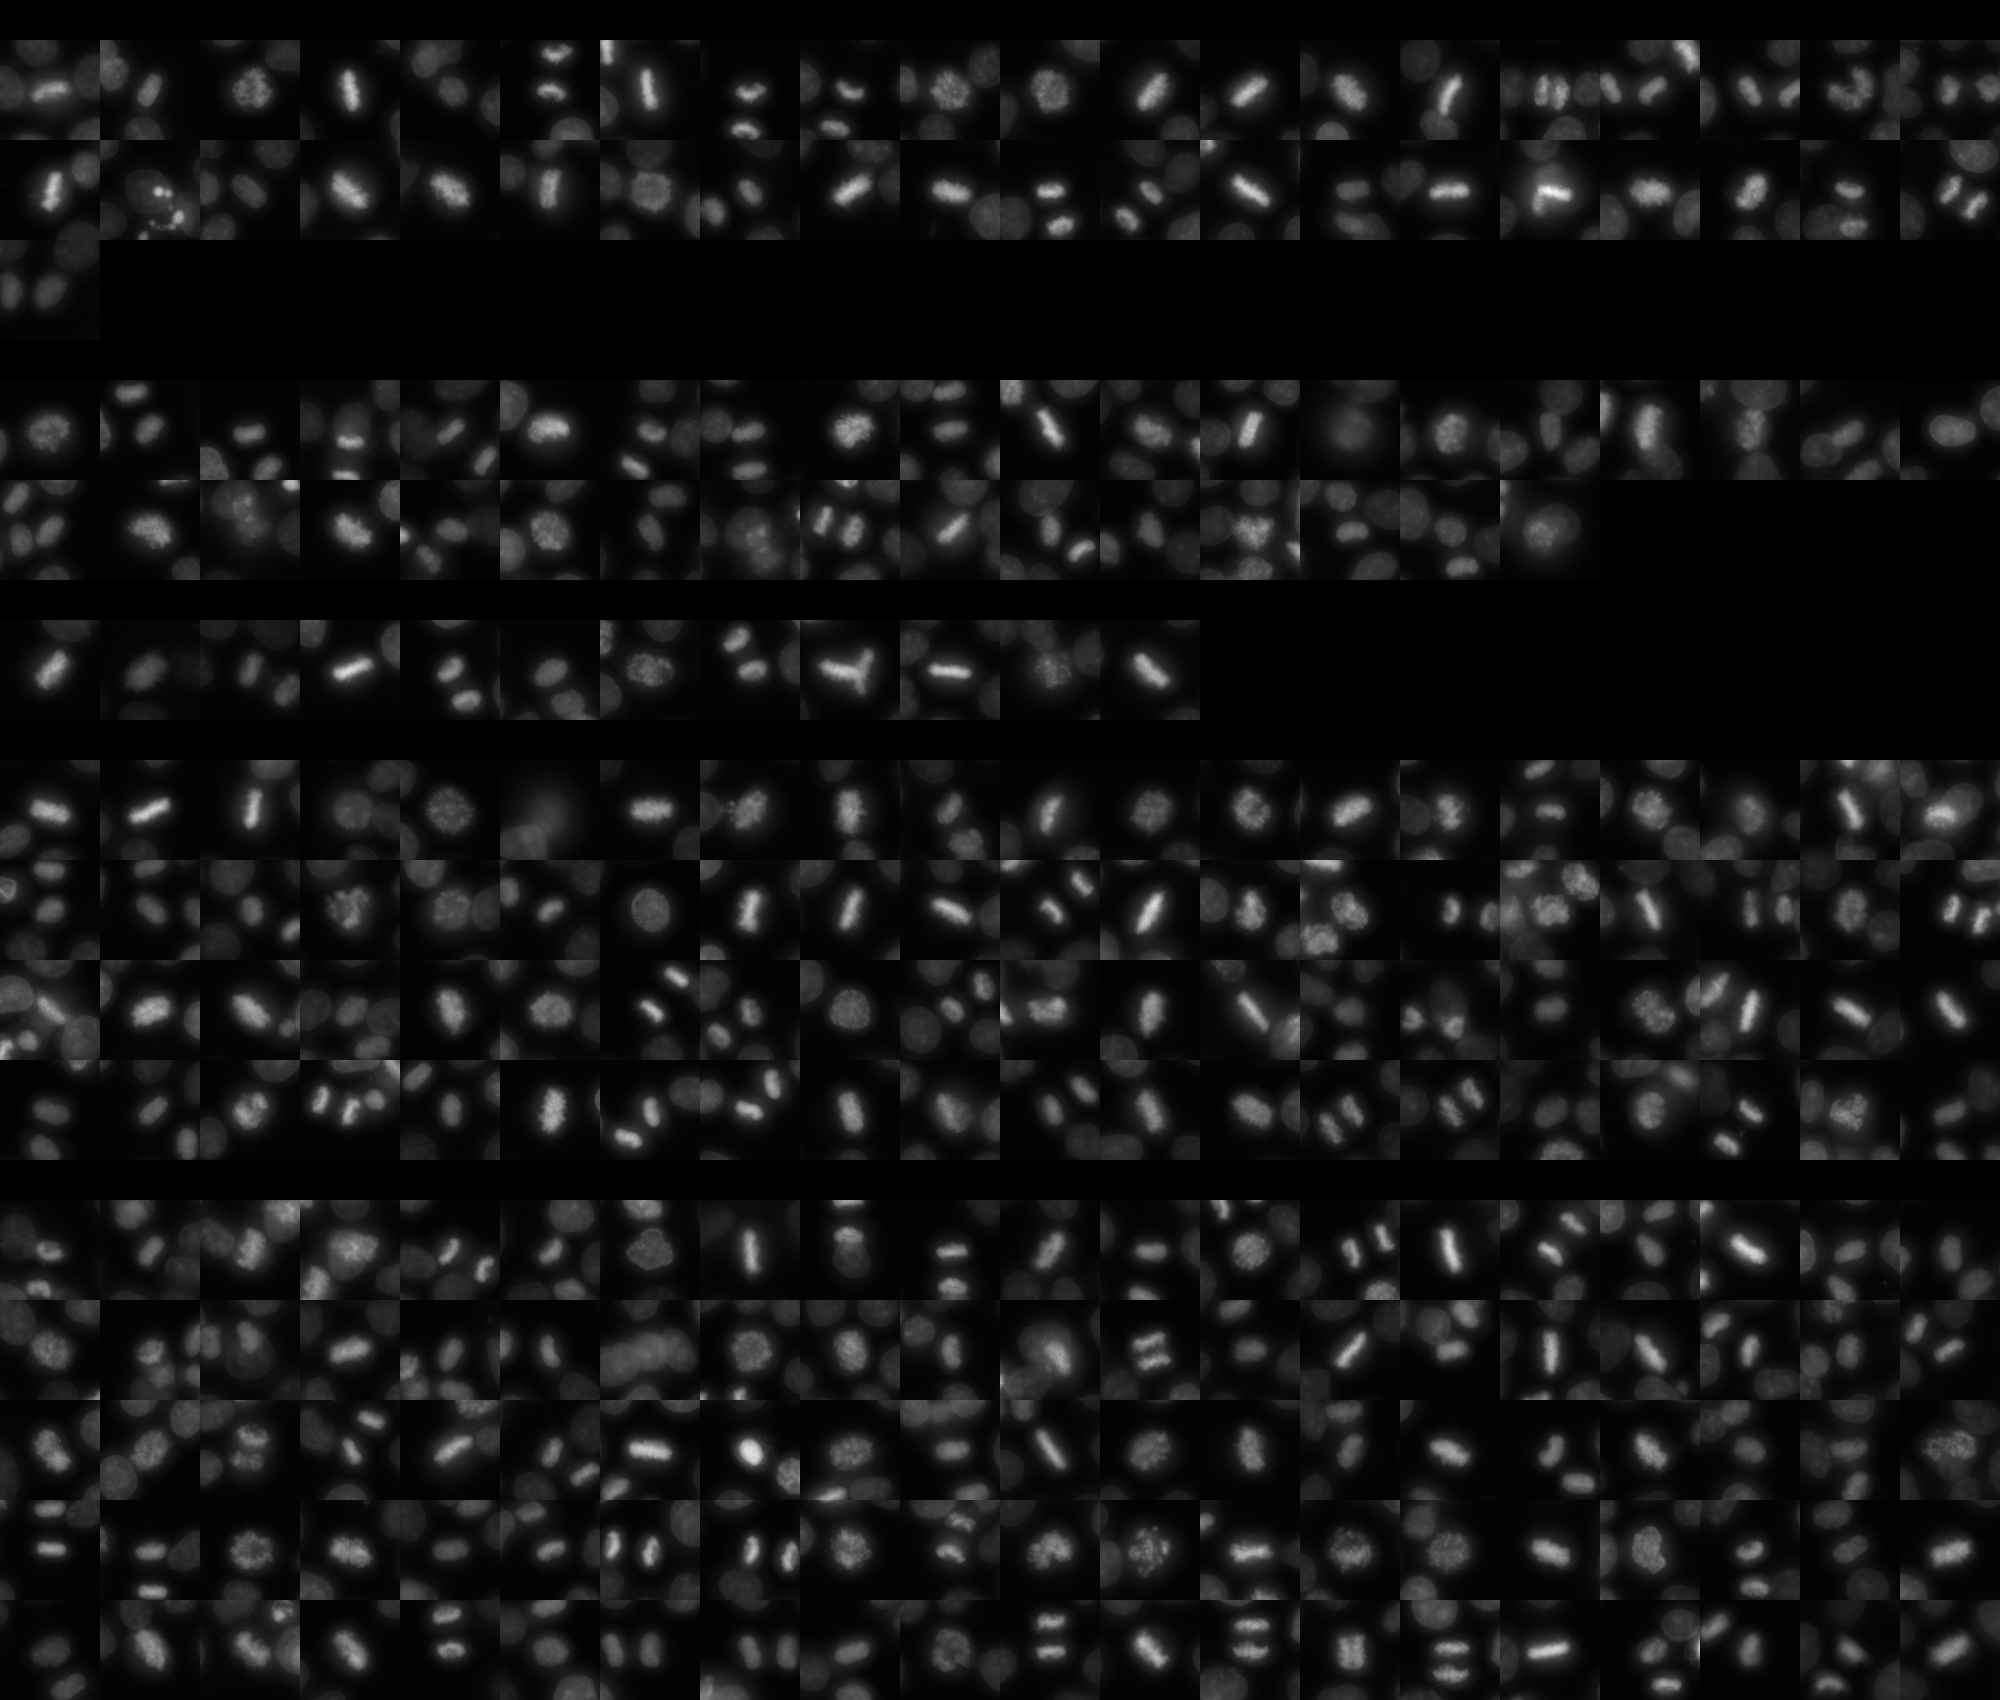
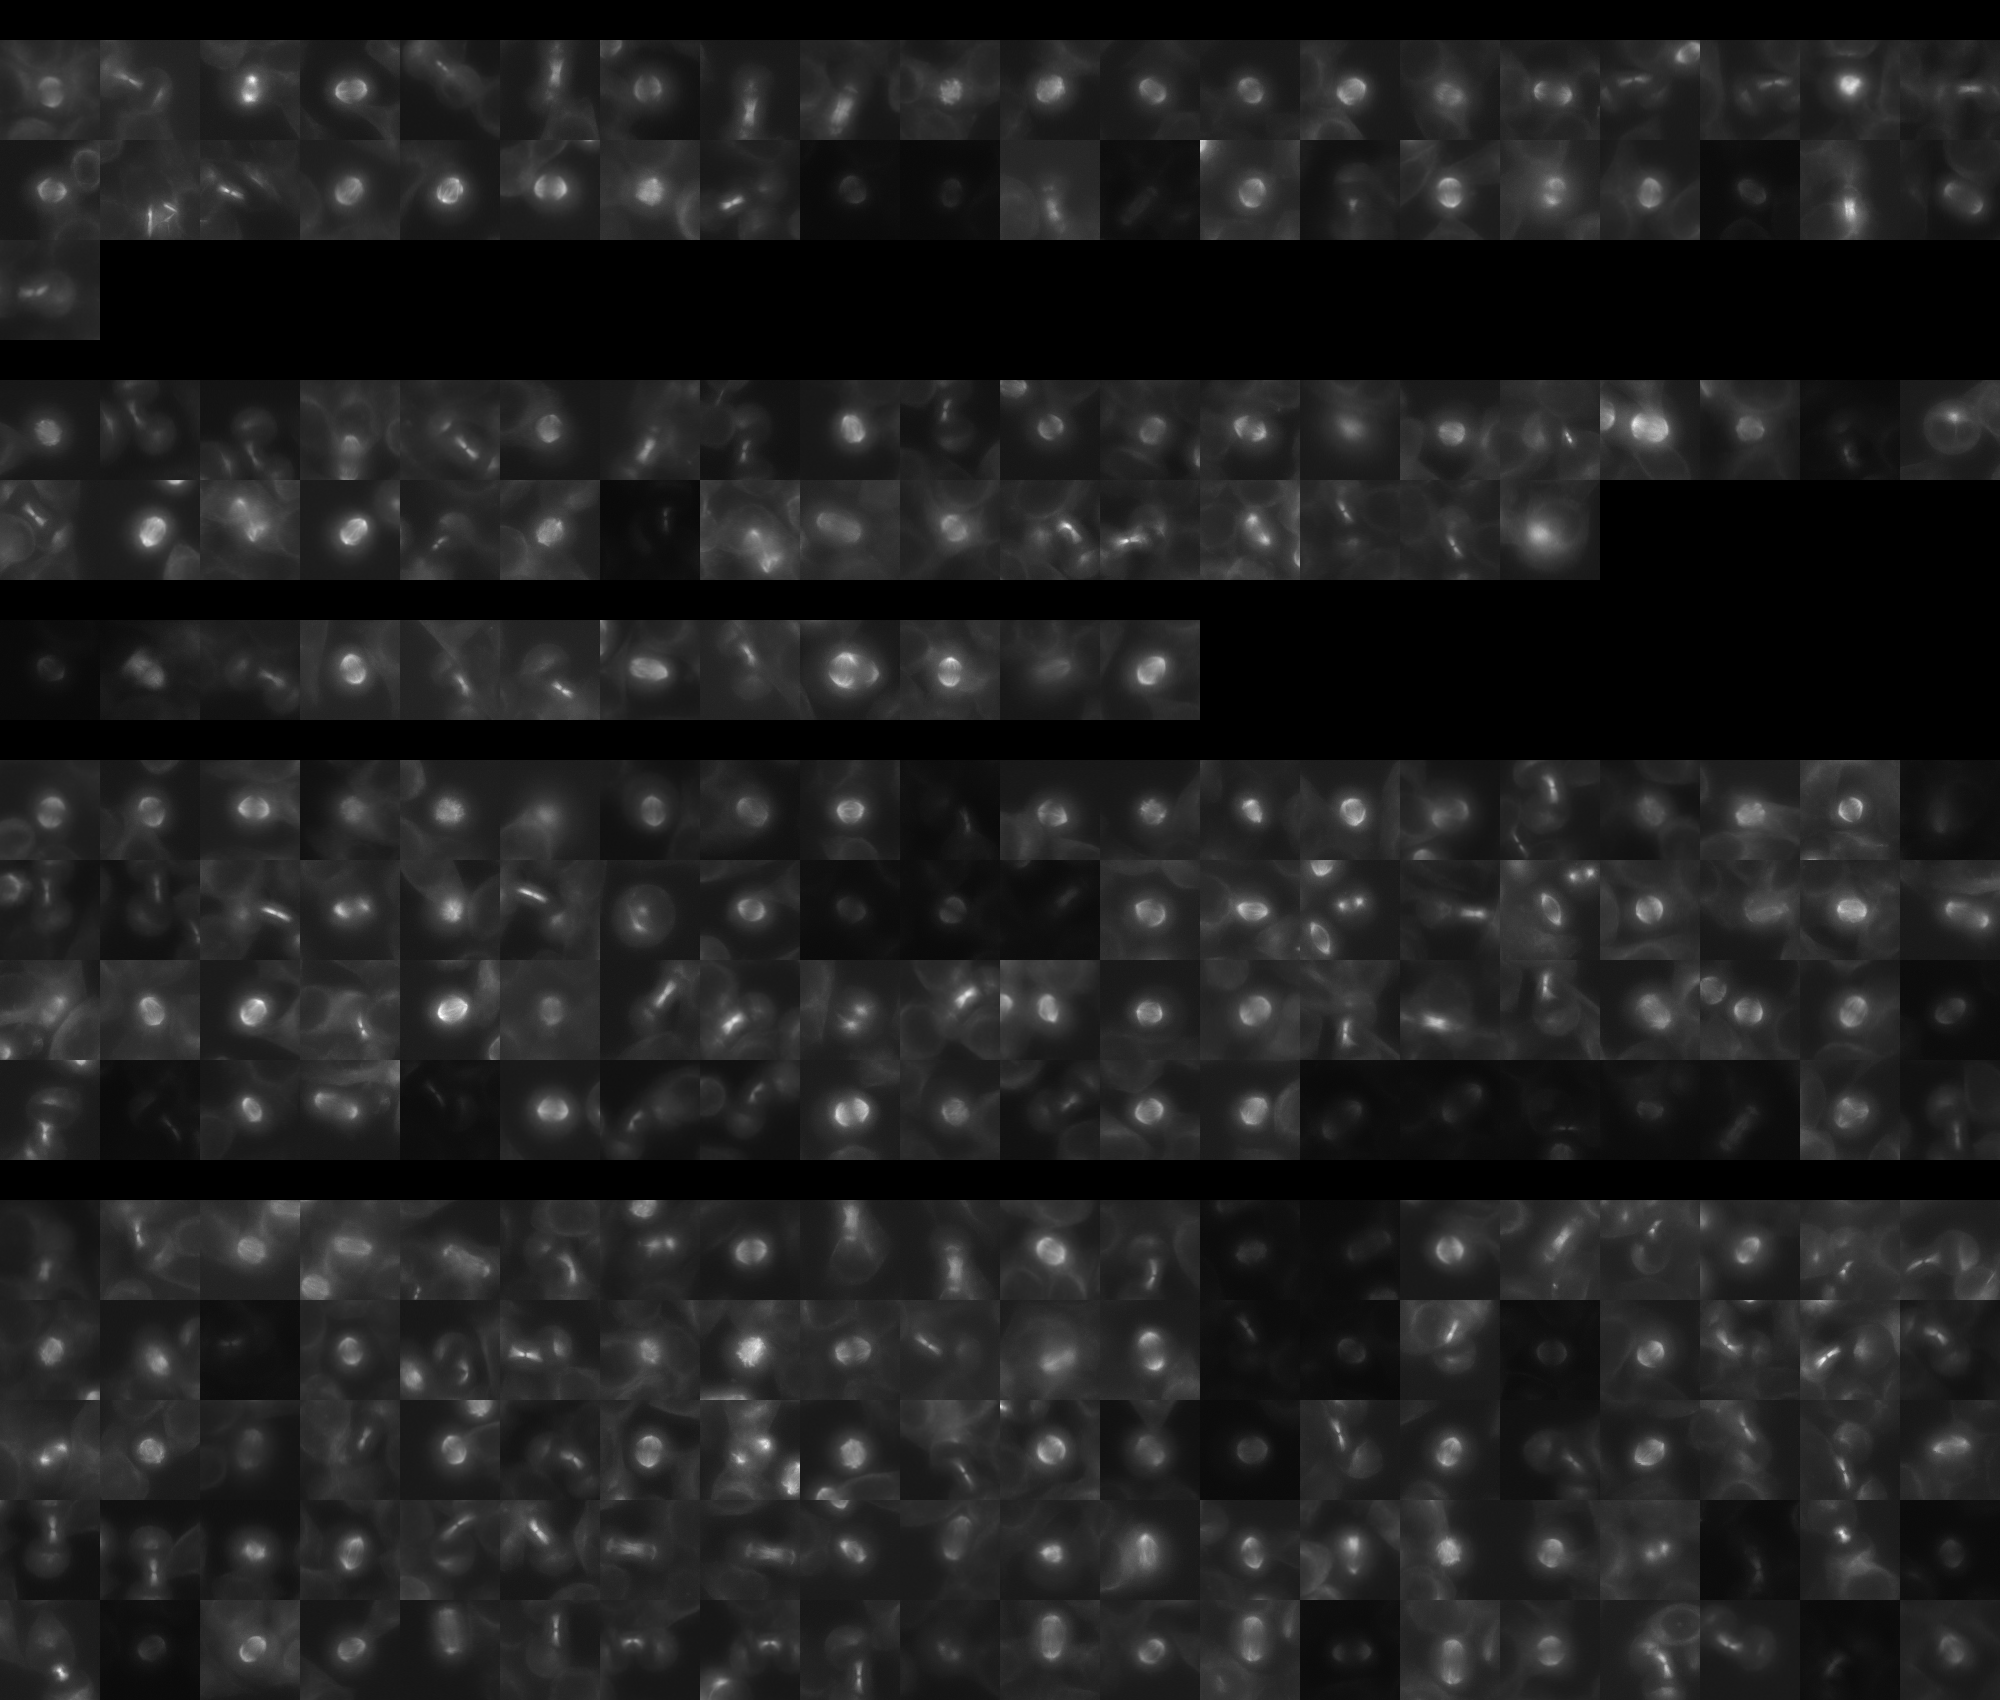
Mitotic Cluster

Overview

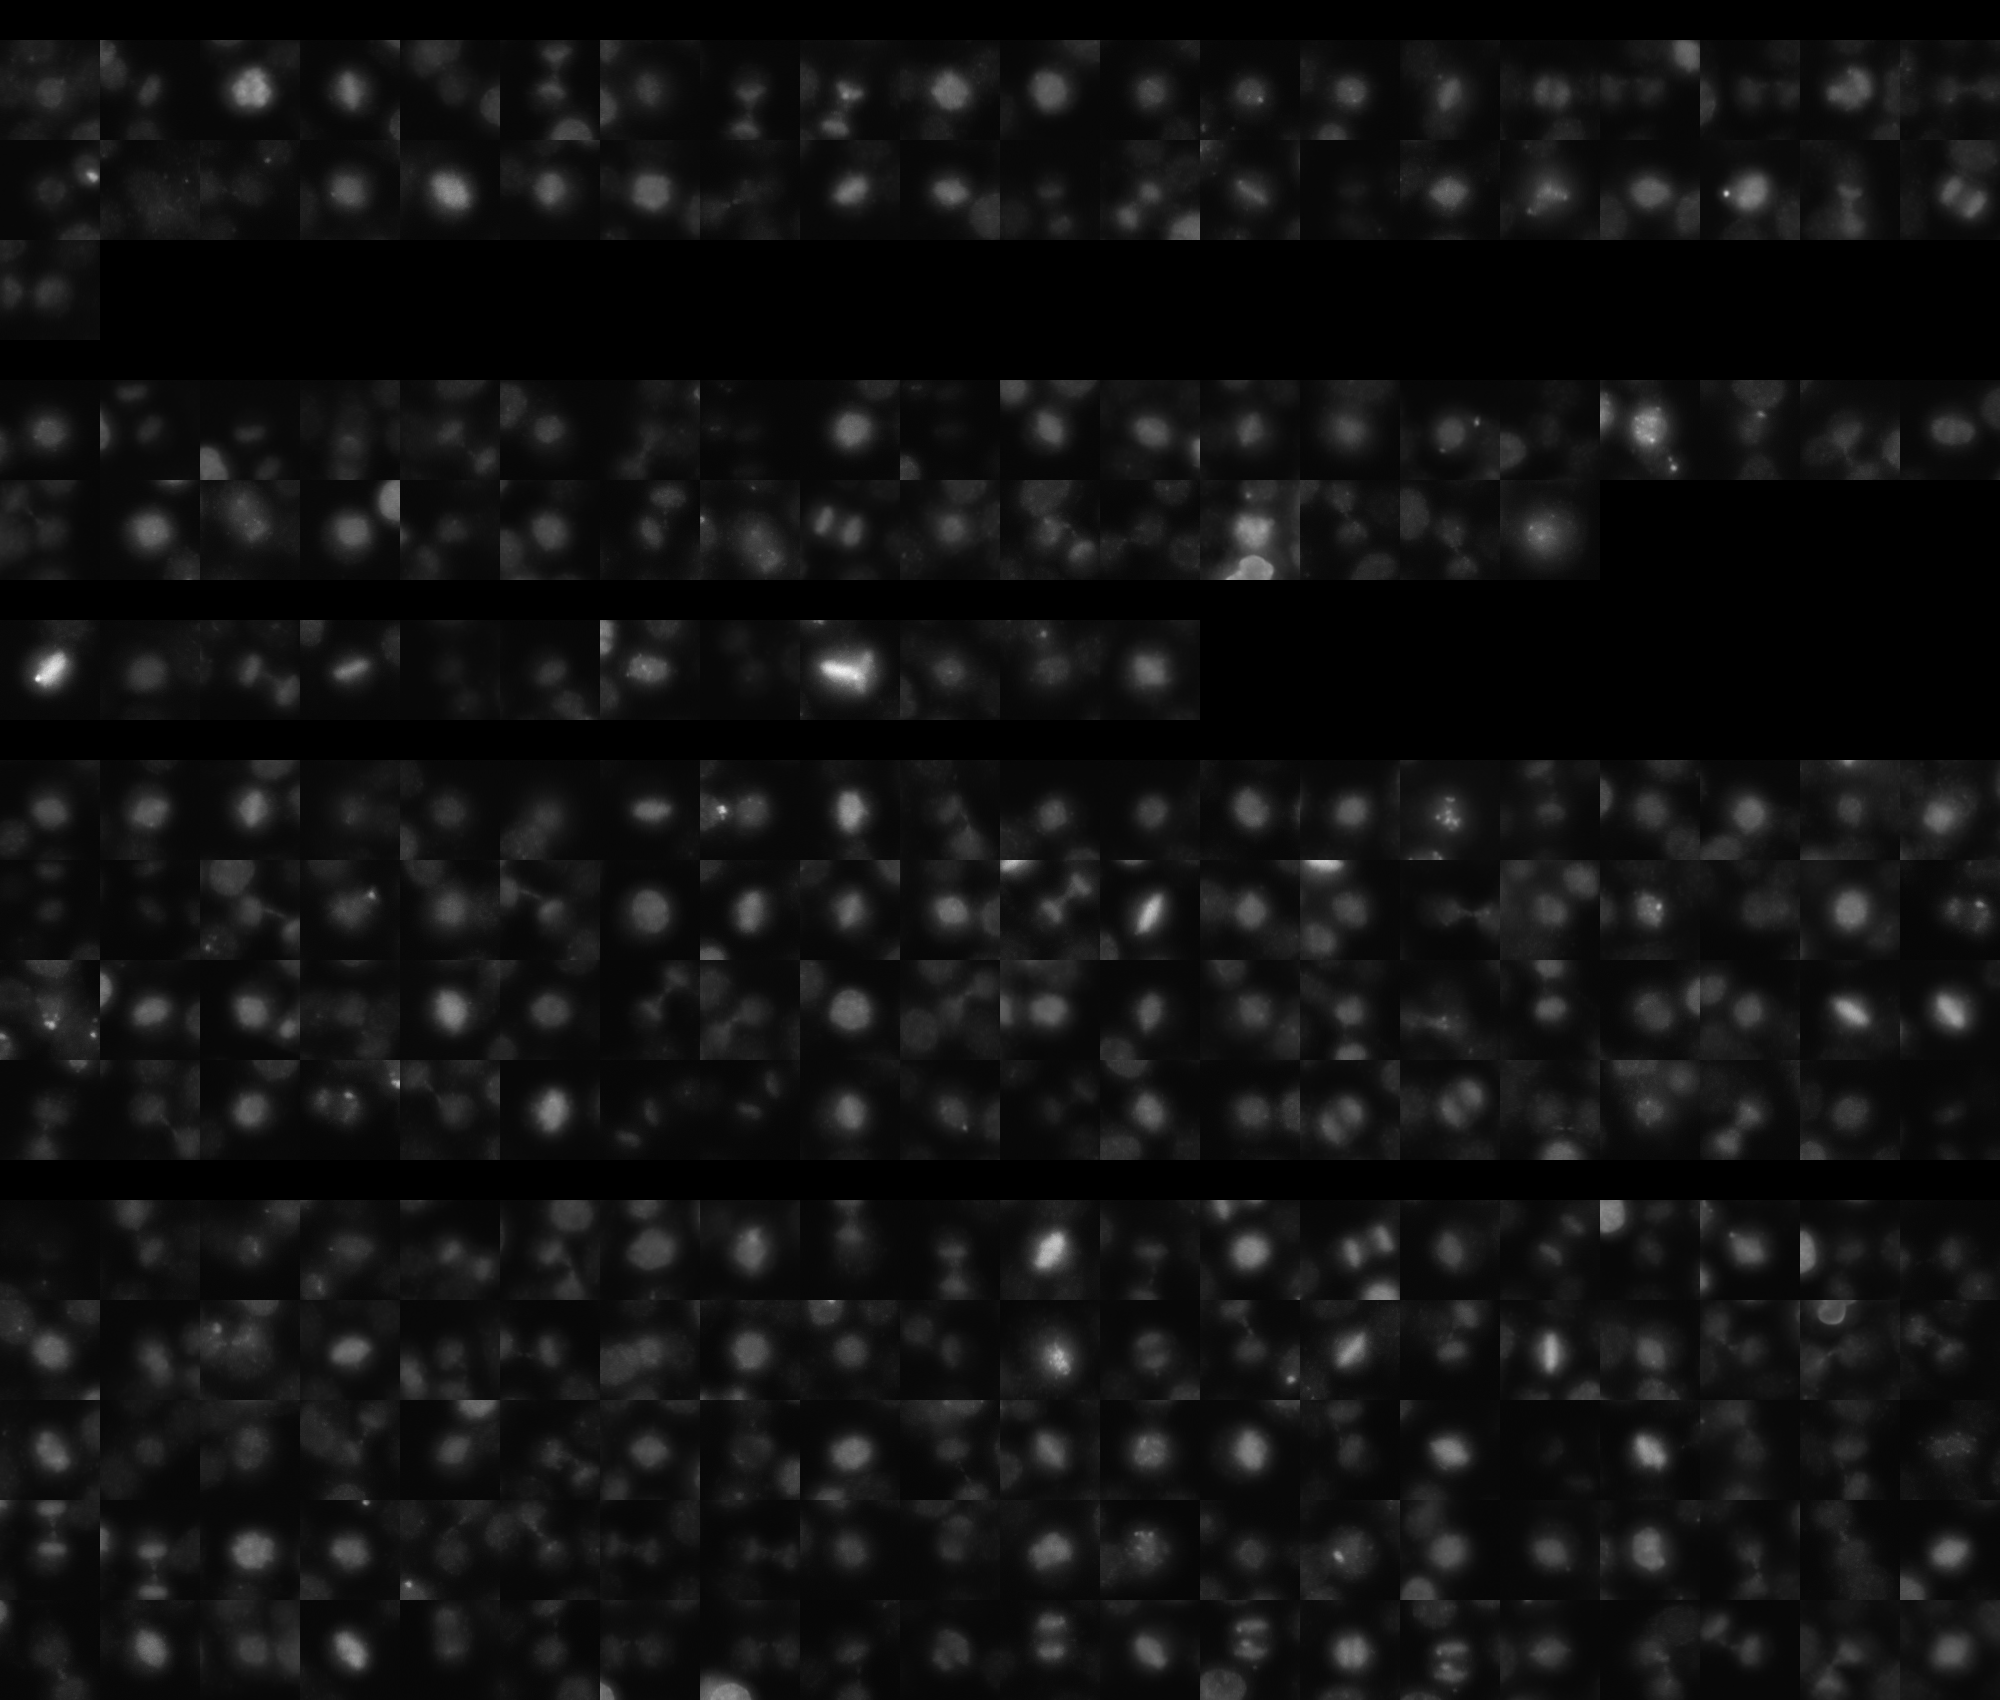
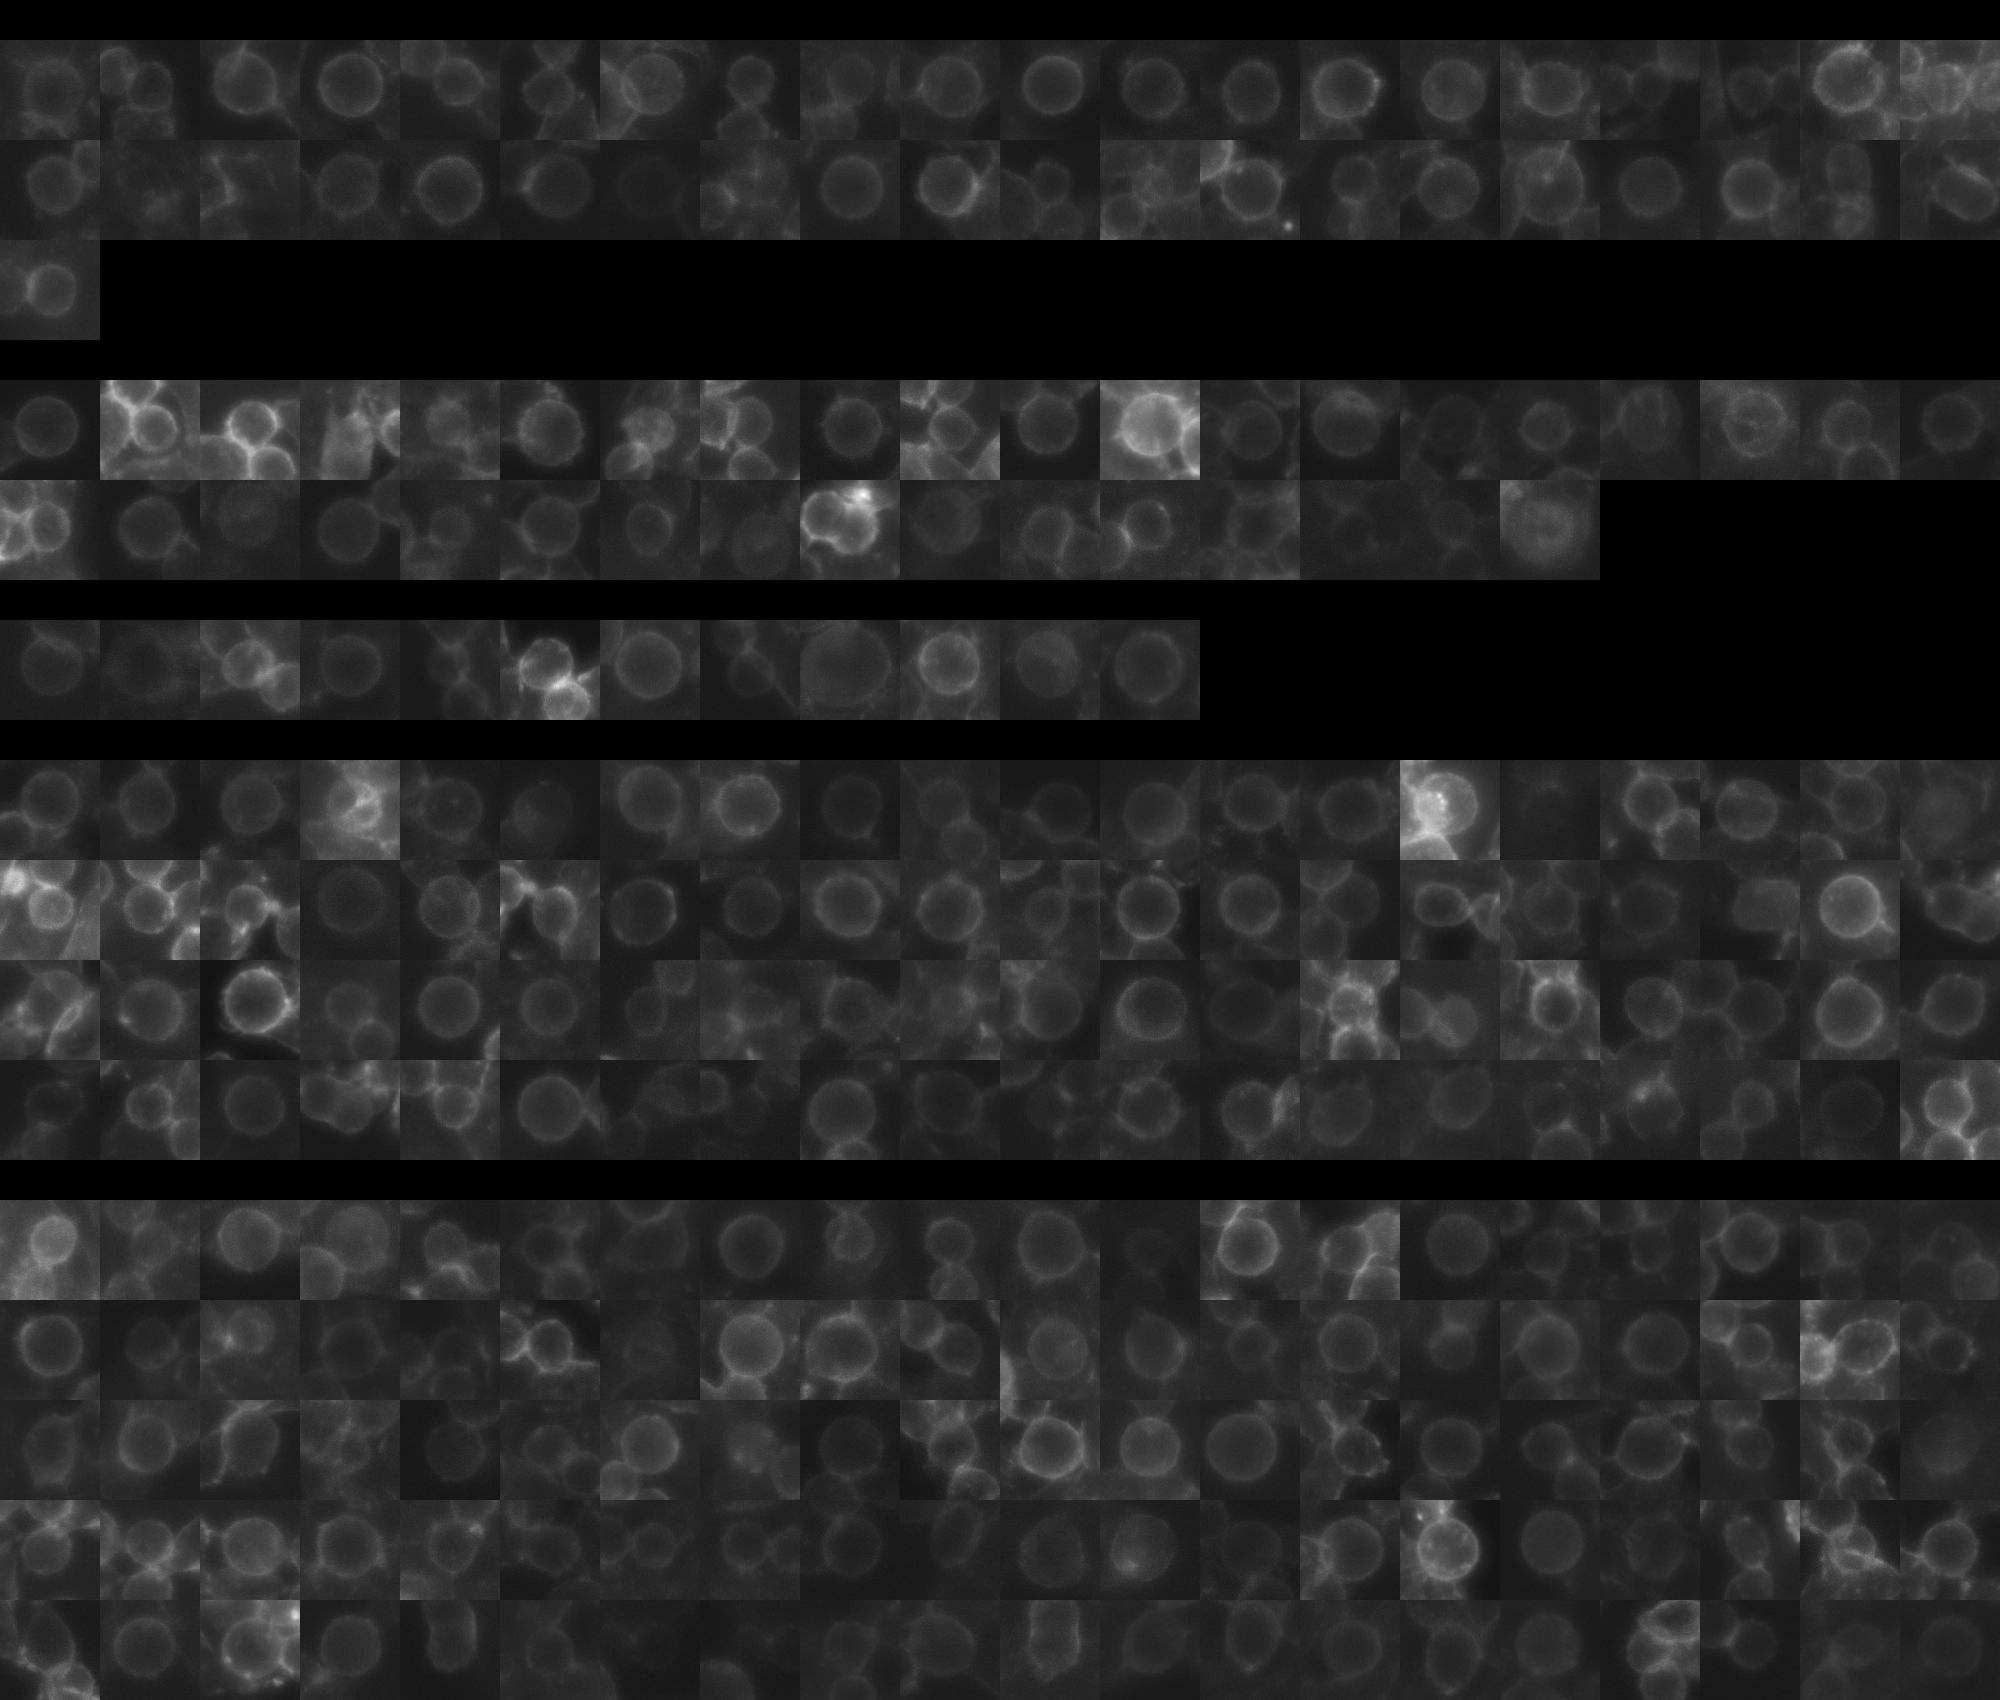
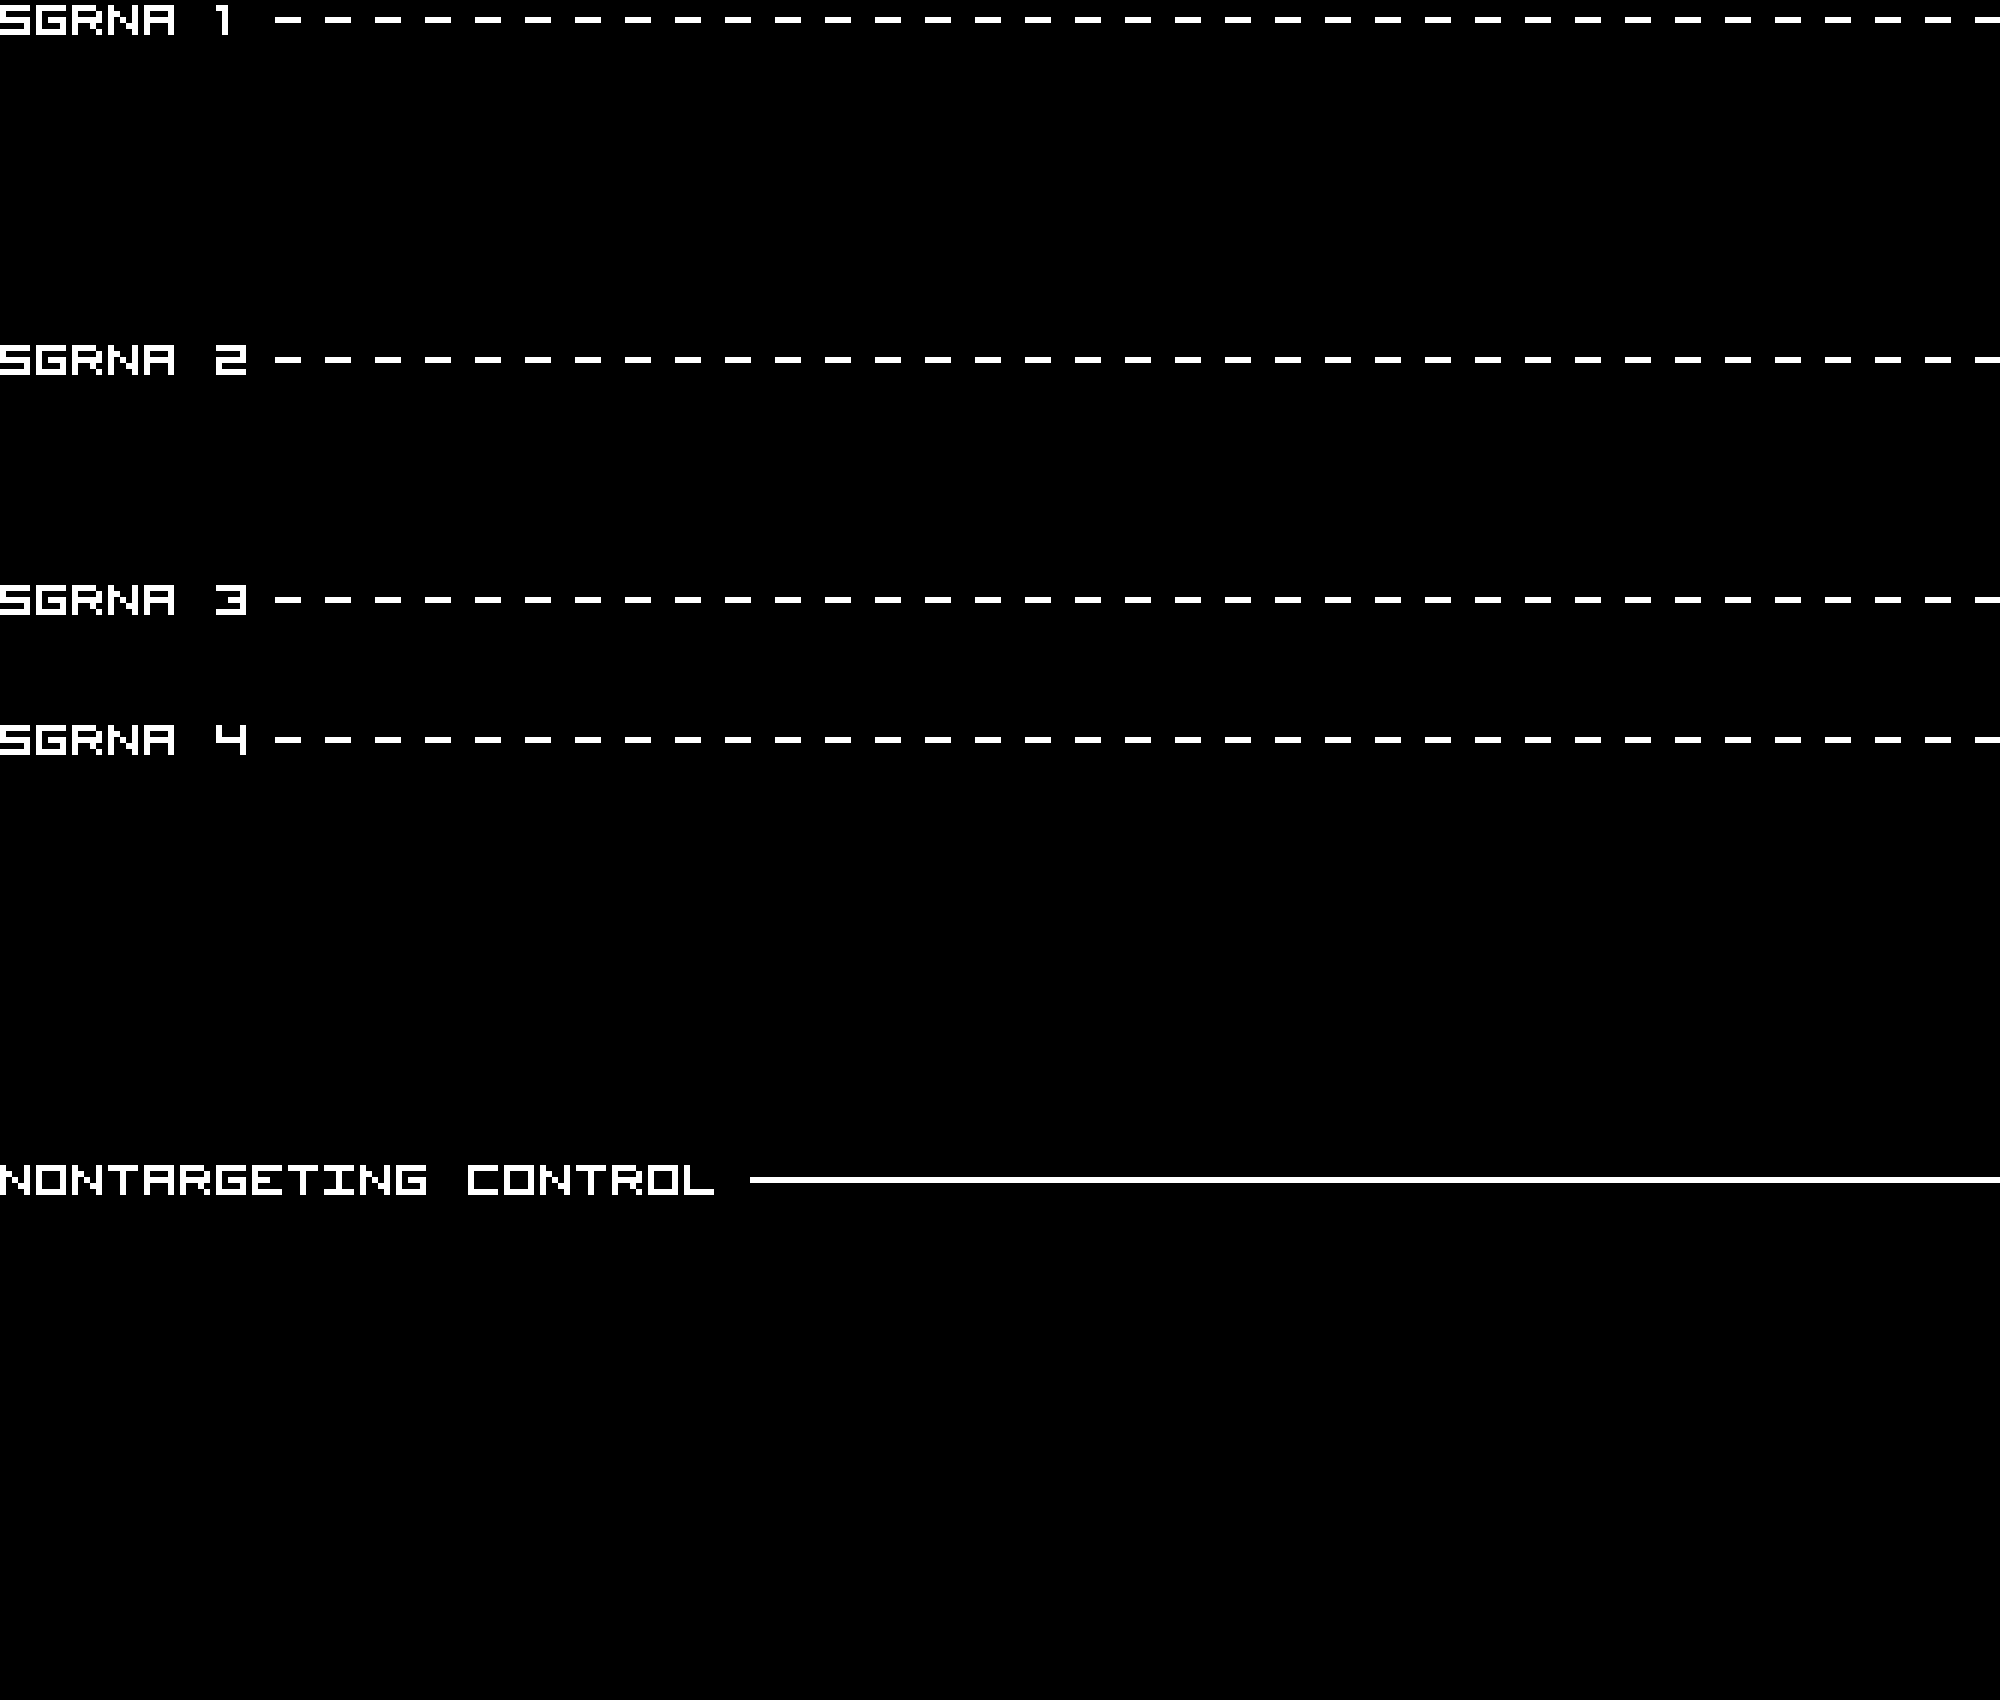
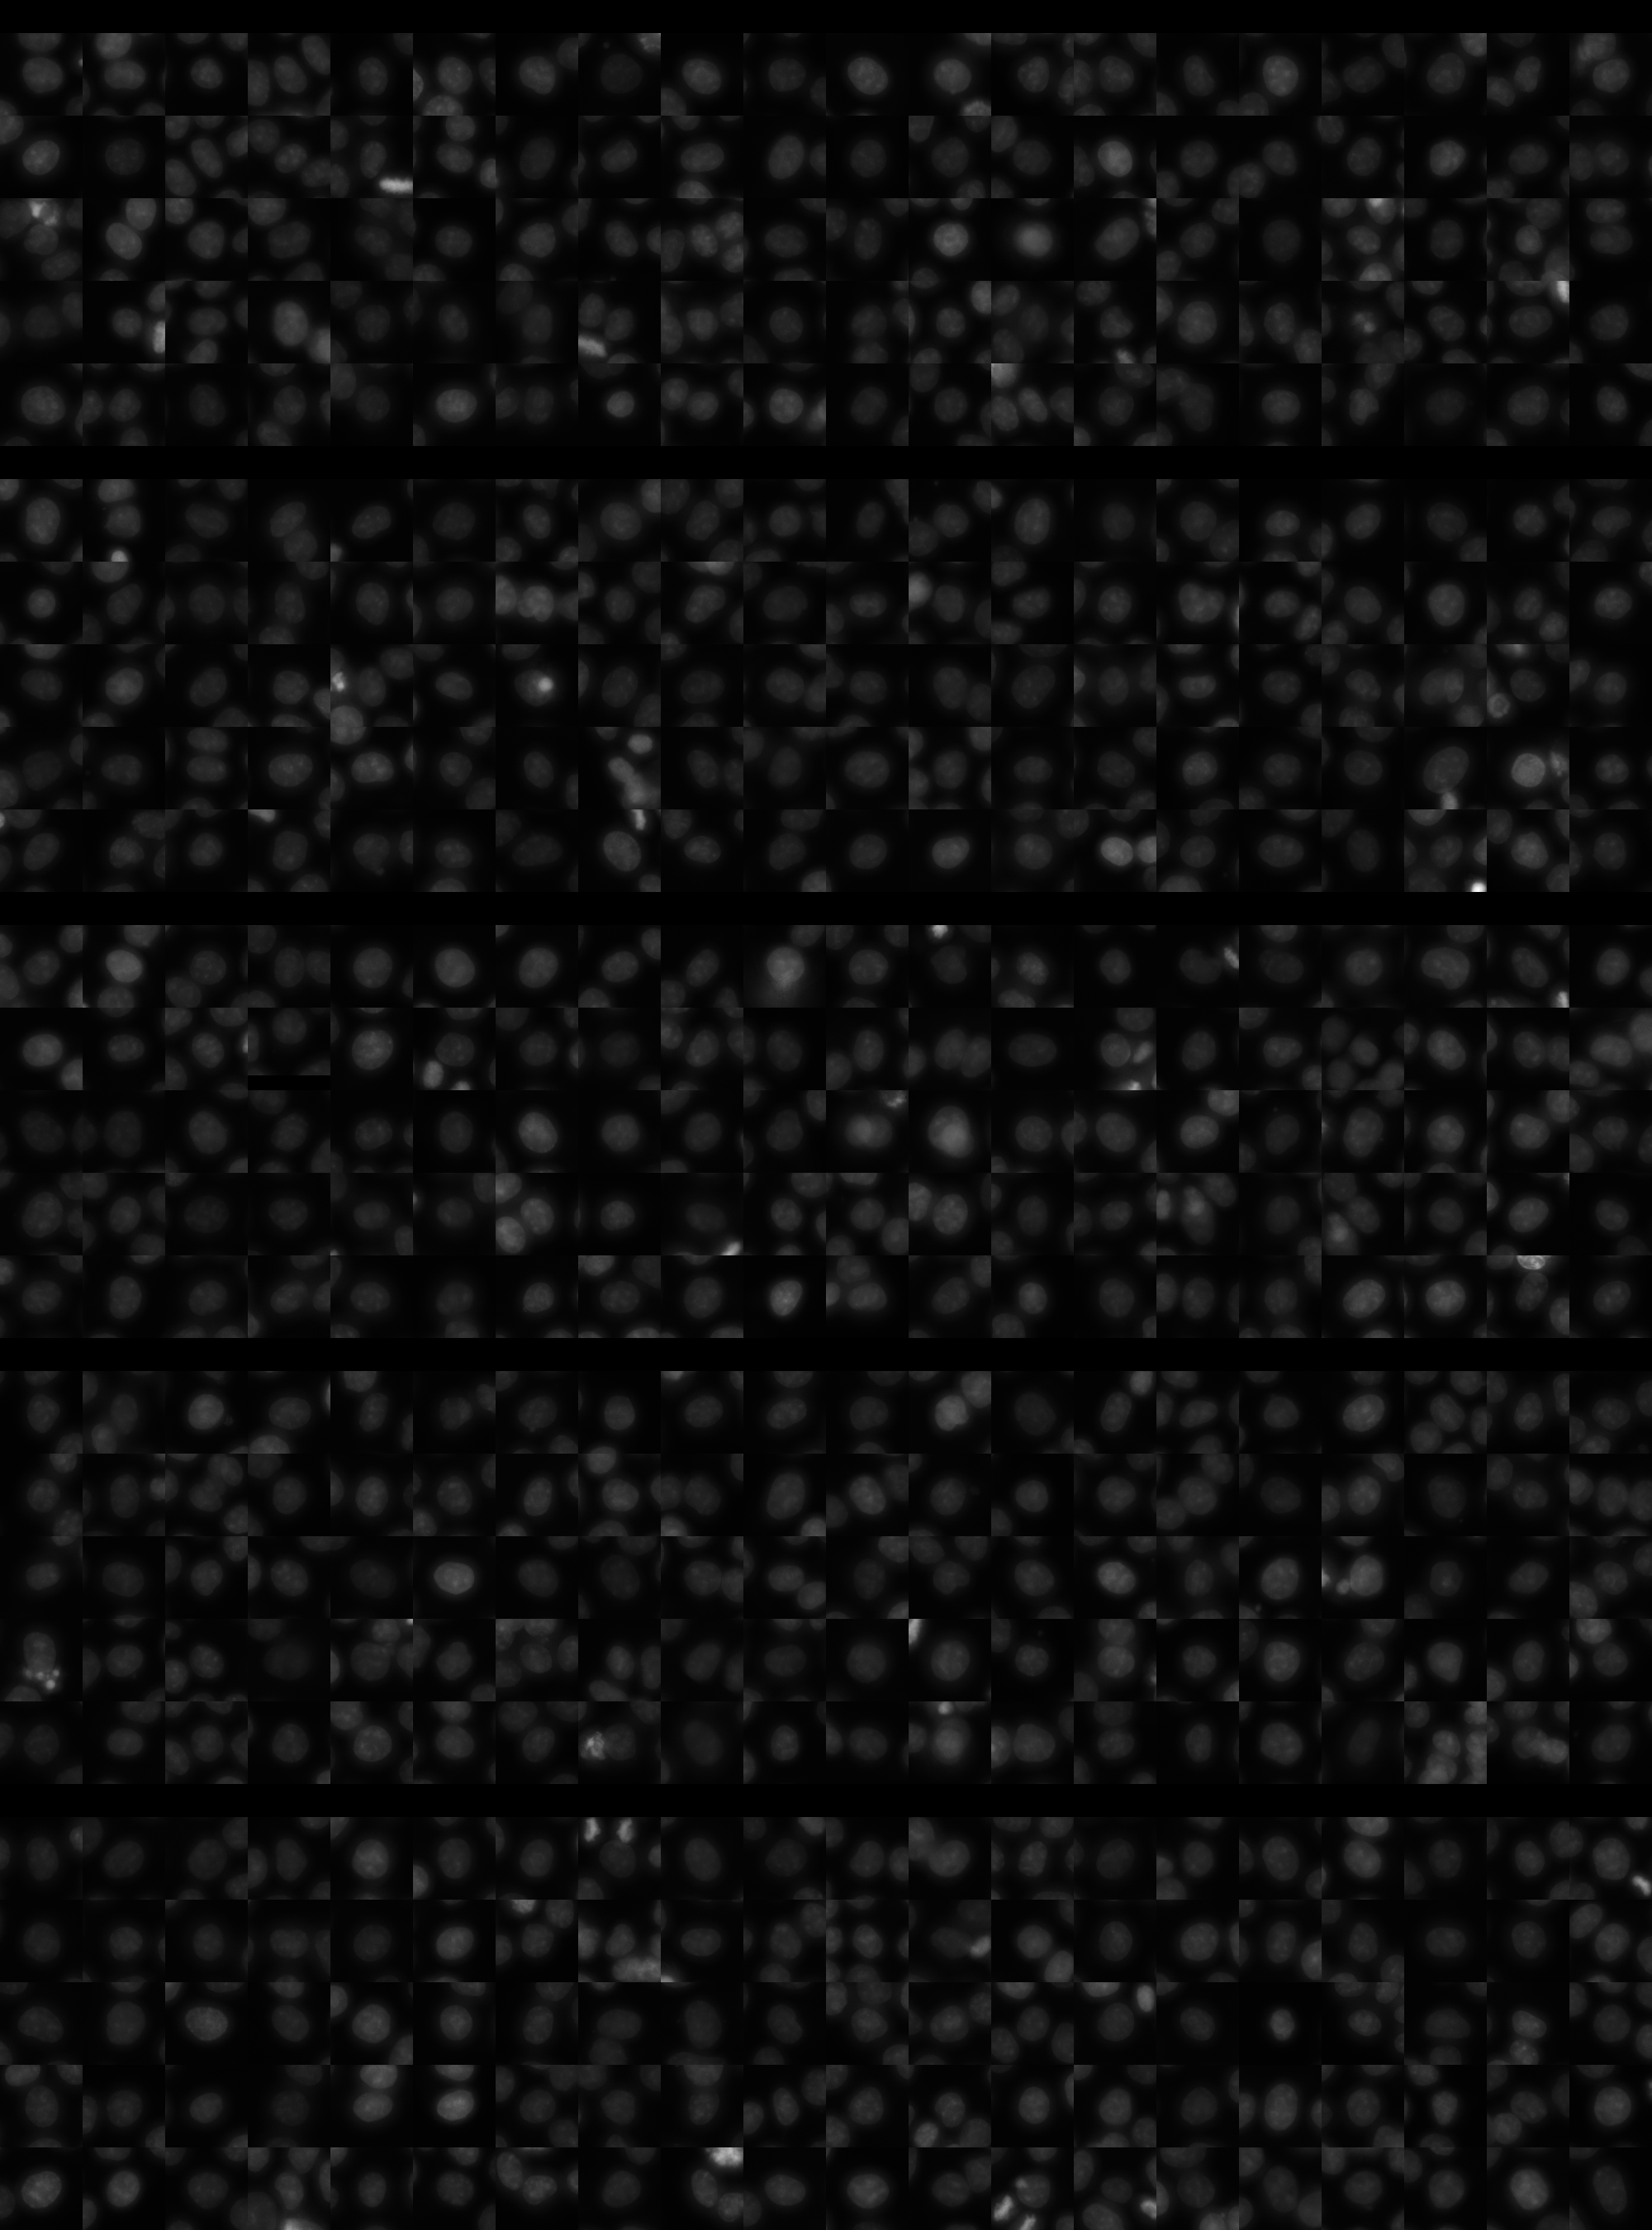
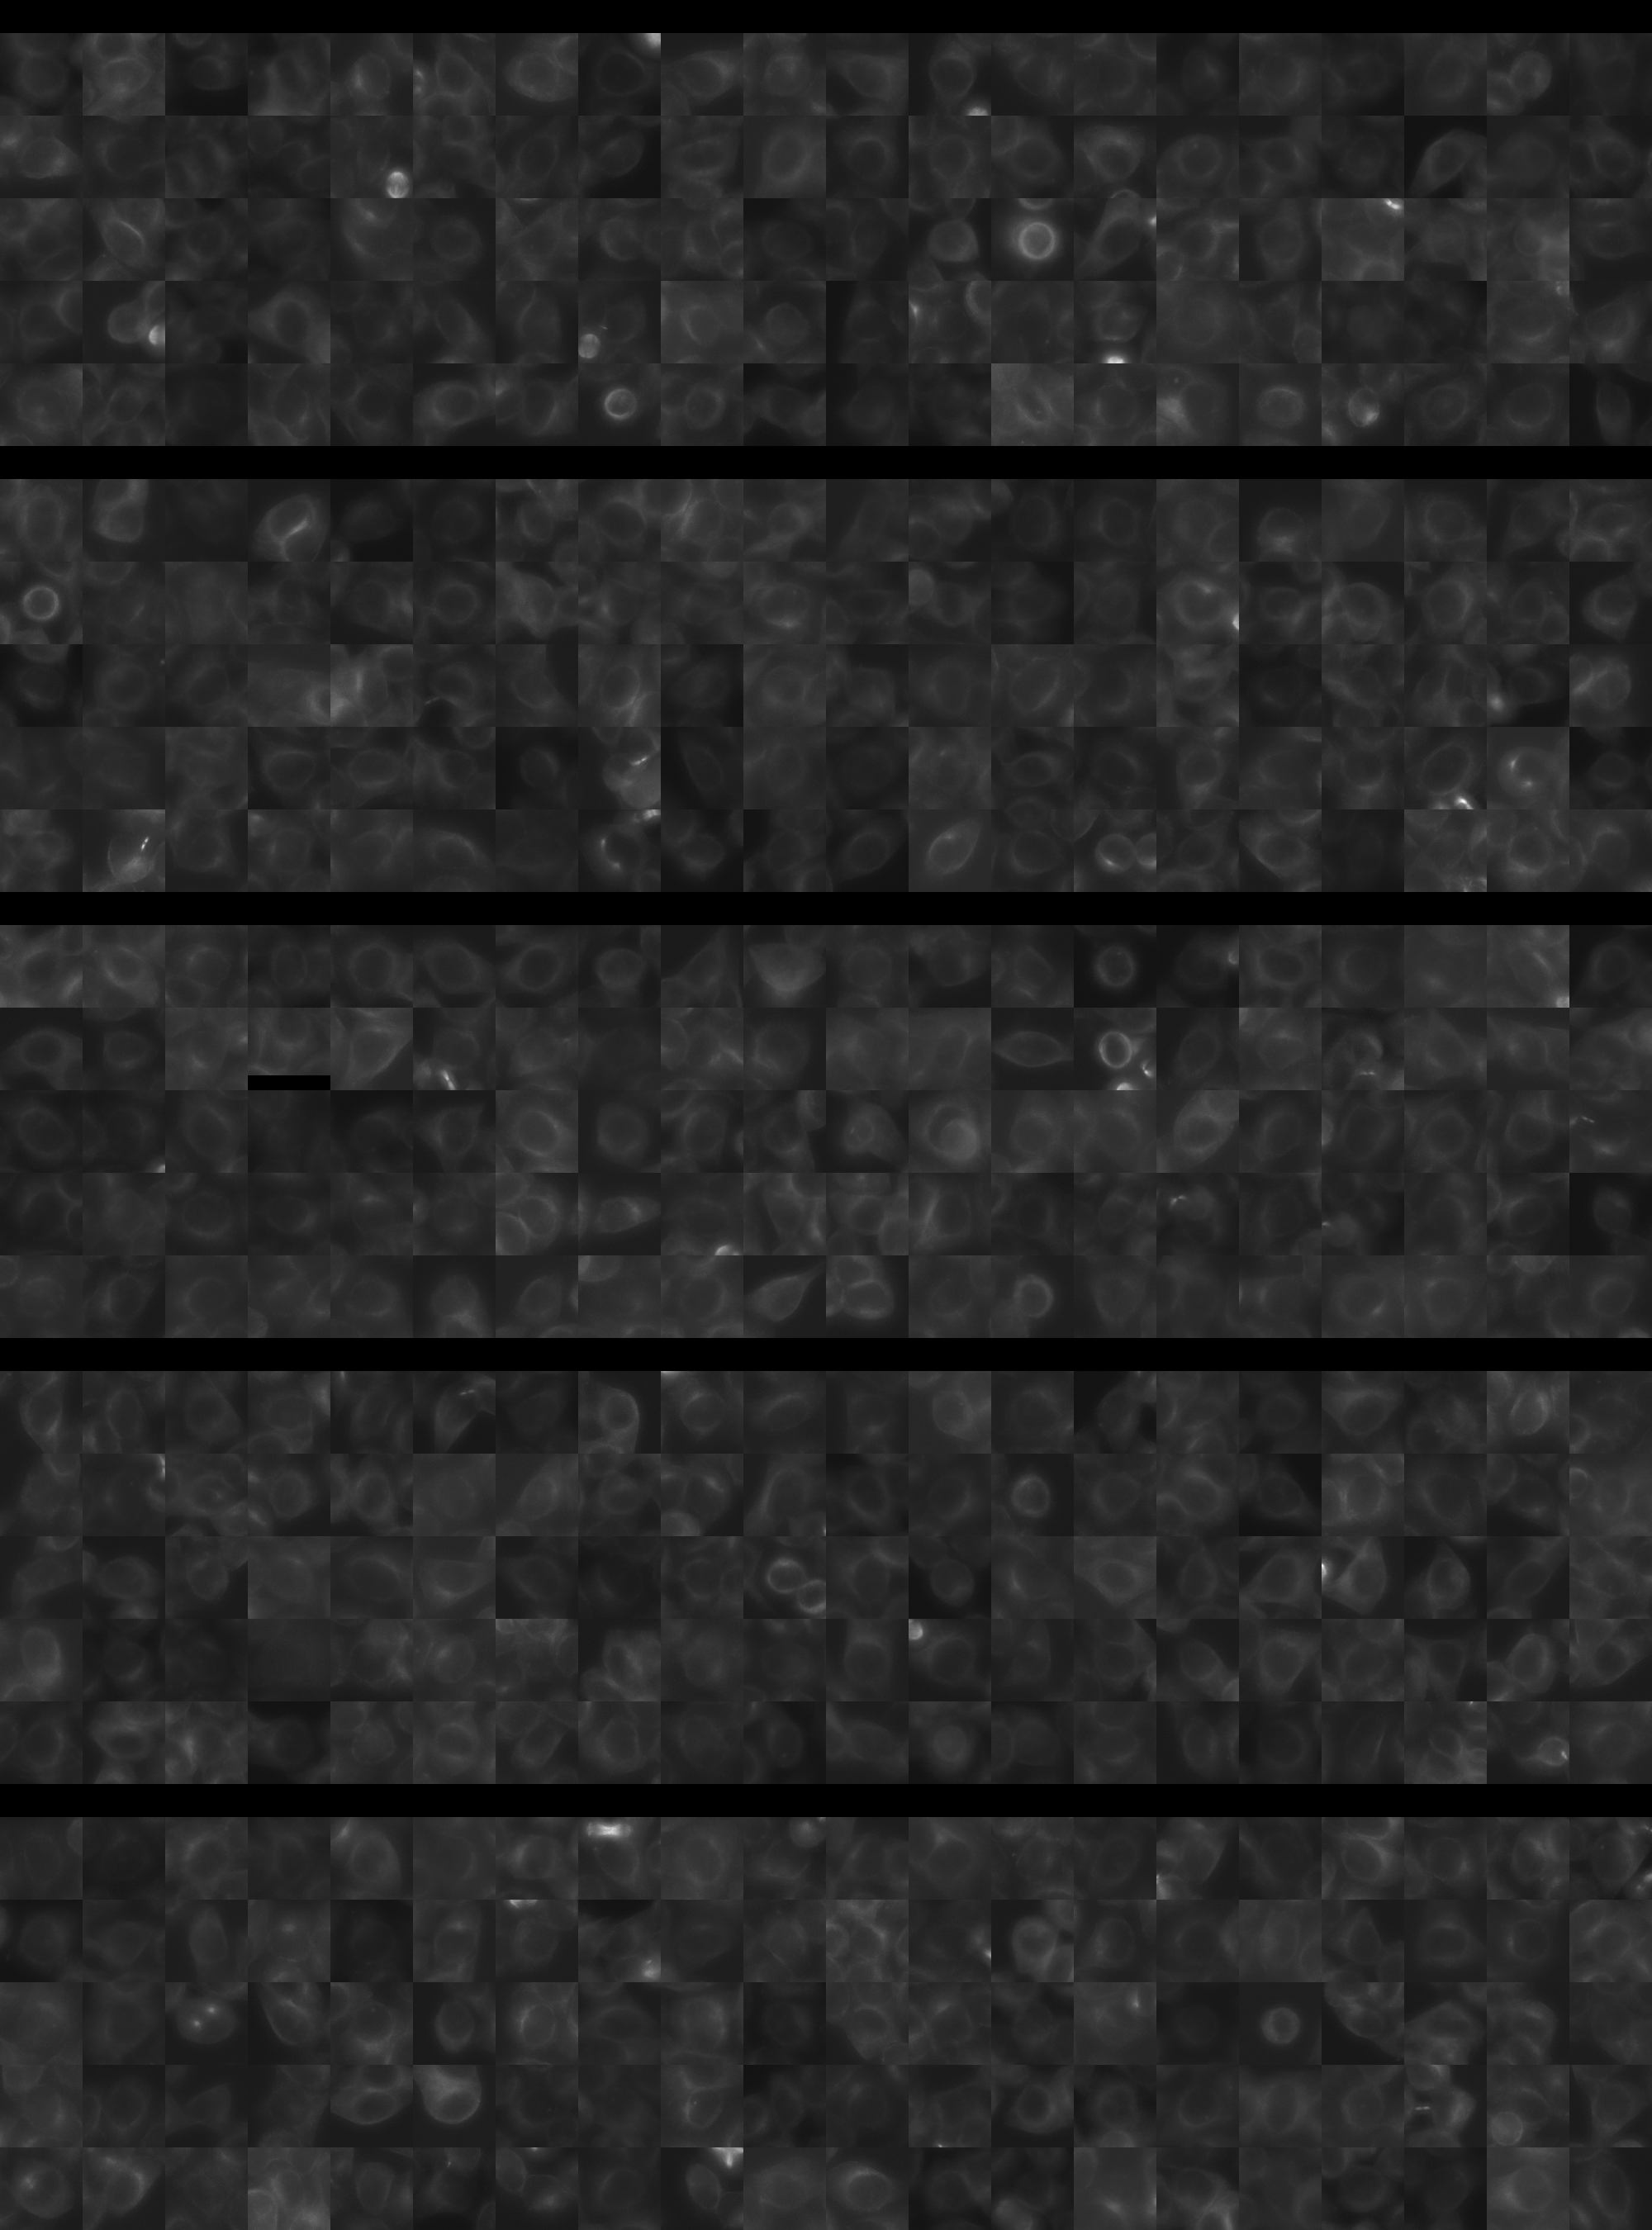
Each montage below shows randomly selected individual cell images for the same target gene separated by sgRNA, along with an example montage of cells expressing a non-targeting negative control sgRNA at the bottom. sgRNA labels in the montages correspond to the numbered sgRNA sequences in the gene info table above. The DNA (blue) and tubulin (green) channels are displayed by default, with gH2AX (grayscale) and actin (yellow) available using the check boxes. Channel brightness, contrast, and opacity are adjustable by clicking the arrow next to the channel name. When only one channel is selected, the display defaults to grayscale. Click the “Zoom” checkbox above the channel controls to enable image zooming (via scrolling) and panning (via click-and-drag).

The cell boxes displayed for this gene are square, 30.36 μm per side for the interphase montage and 30.36 μm per side for the mitotic montage.
Features

Interphase Score Rank FDR q-value
Nucleus DNA Integrated 0.055 908 of 5322 0.432
Nucleus DNA Mean -1.777e-02 2547 of 5322 0.779
Nucleus gH2AX Mean 0.083 2441 of 5322 0.056
Nucleus DNA - gH2AX Correlation -5.321e-02 2539 of 5322 0.093
Nucleus Shape Area 0.066 1265 of 5322 0.272
Nucleus Shape Eccentricity 0.008 2885 of 5322 0.868
Nucleus Shape Form Factor 0.012 409 of 5322 0.689
Nucleus Shape Solidity 0.011 405 of 5322 0.753
Cell DNA Mass Displacement 0.027 2544 of 5322 0.723
Cell Tubulin Mean -1.023e-02 3181 of 5322 0.918
Cell Tubulin Mass Displacement 0.015 2089 of 5322 0.851
Cell Actin Mean -1.525e-02 3502 of 5322 0.843
Cell Tubulin - Actin Correlation 0.015 2899 of 5322 0.788
Cell DNA - Tubulin Correlation 0.040 2251 of 5322 0.358
Cell Shape Area 0.025 2311 of 5322 0.835
Cell Shape Eccentricity -4.079e-02 5120 of 5322 0.605
Mitotic Score Rank FDR q-value
Nucleus DNA Integrated 0.048 3262 of 5322 0.992
Nucleus DNA Mean 0.059 2039 of 5322 1.000
Nucleus DNA Mass Displacement 0.327 188 of 5322 0.999
Nucleus DNA Mean Frac 3 -1.238e-01 4635 of 5322 1.000
Nucleus gH2AX Mean 0.006 2879 of 5322 1.000
Nucleus gH2AX Mean Frac 0 0.040 1691 of 5322 1.000
Nucleus Tubulin Mean Frac 0 -3.896e-02 4041 of 5322 0.999
Nucleus Tubulin Mean Edge 0.021 2869 of 5322 0.999
Nucleus Tubulin Std Edge 0.100 1264 of 5322 0.999
Nucleus Shape Area 0.140 2122 of 5322 0.988
Nucleus Shape Eccentricity -1.148e-01 3764 of 5322 1.000
Nucleus Shape Form Factor -9.702e-02 2809 of 5322 0.998
Cell Tubulin Mean 0.085 2261 of 5322 0.997
Cell Tubulin Mean Frac 3 0.073 948 of 5322 0.999
Cell Actin Mean 0.047 2556 of 5322 0.997
Cell Shape Area 0.080 2890 of 5322 0.998
( Reset Zoom )
Brightness
Contrast
Opacity
Brightness
Contrast
Opacity
Brightness
Contrast
Opacity
Brightness
Contrast
Opacity
Brightness
Contrast
Opacity

( Reset Zoom )
Brightness
Contrast
Opacity
Brightness
Contrast
Opacity
Brightness
Contrast
Opacity
Brightness
Contrast
Opacity
Brightness
Contrast
Opacity

MIT Central Accessability