CDC40

Gene symbol: CDC40
Gene: 51362
Uniprot Function: Required for pre-mRNA splicing as component of the activated spliceosome.
Mitotic Index 0.0241
Interphase Cluster: #52 (30 genes)
Mitotic Cluster: #18 (40 genes)
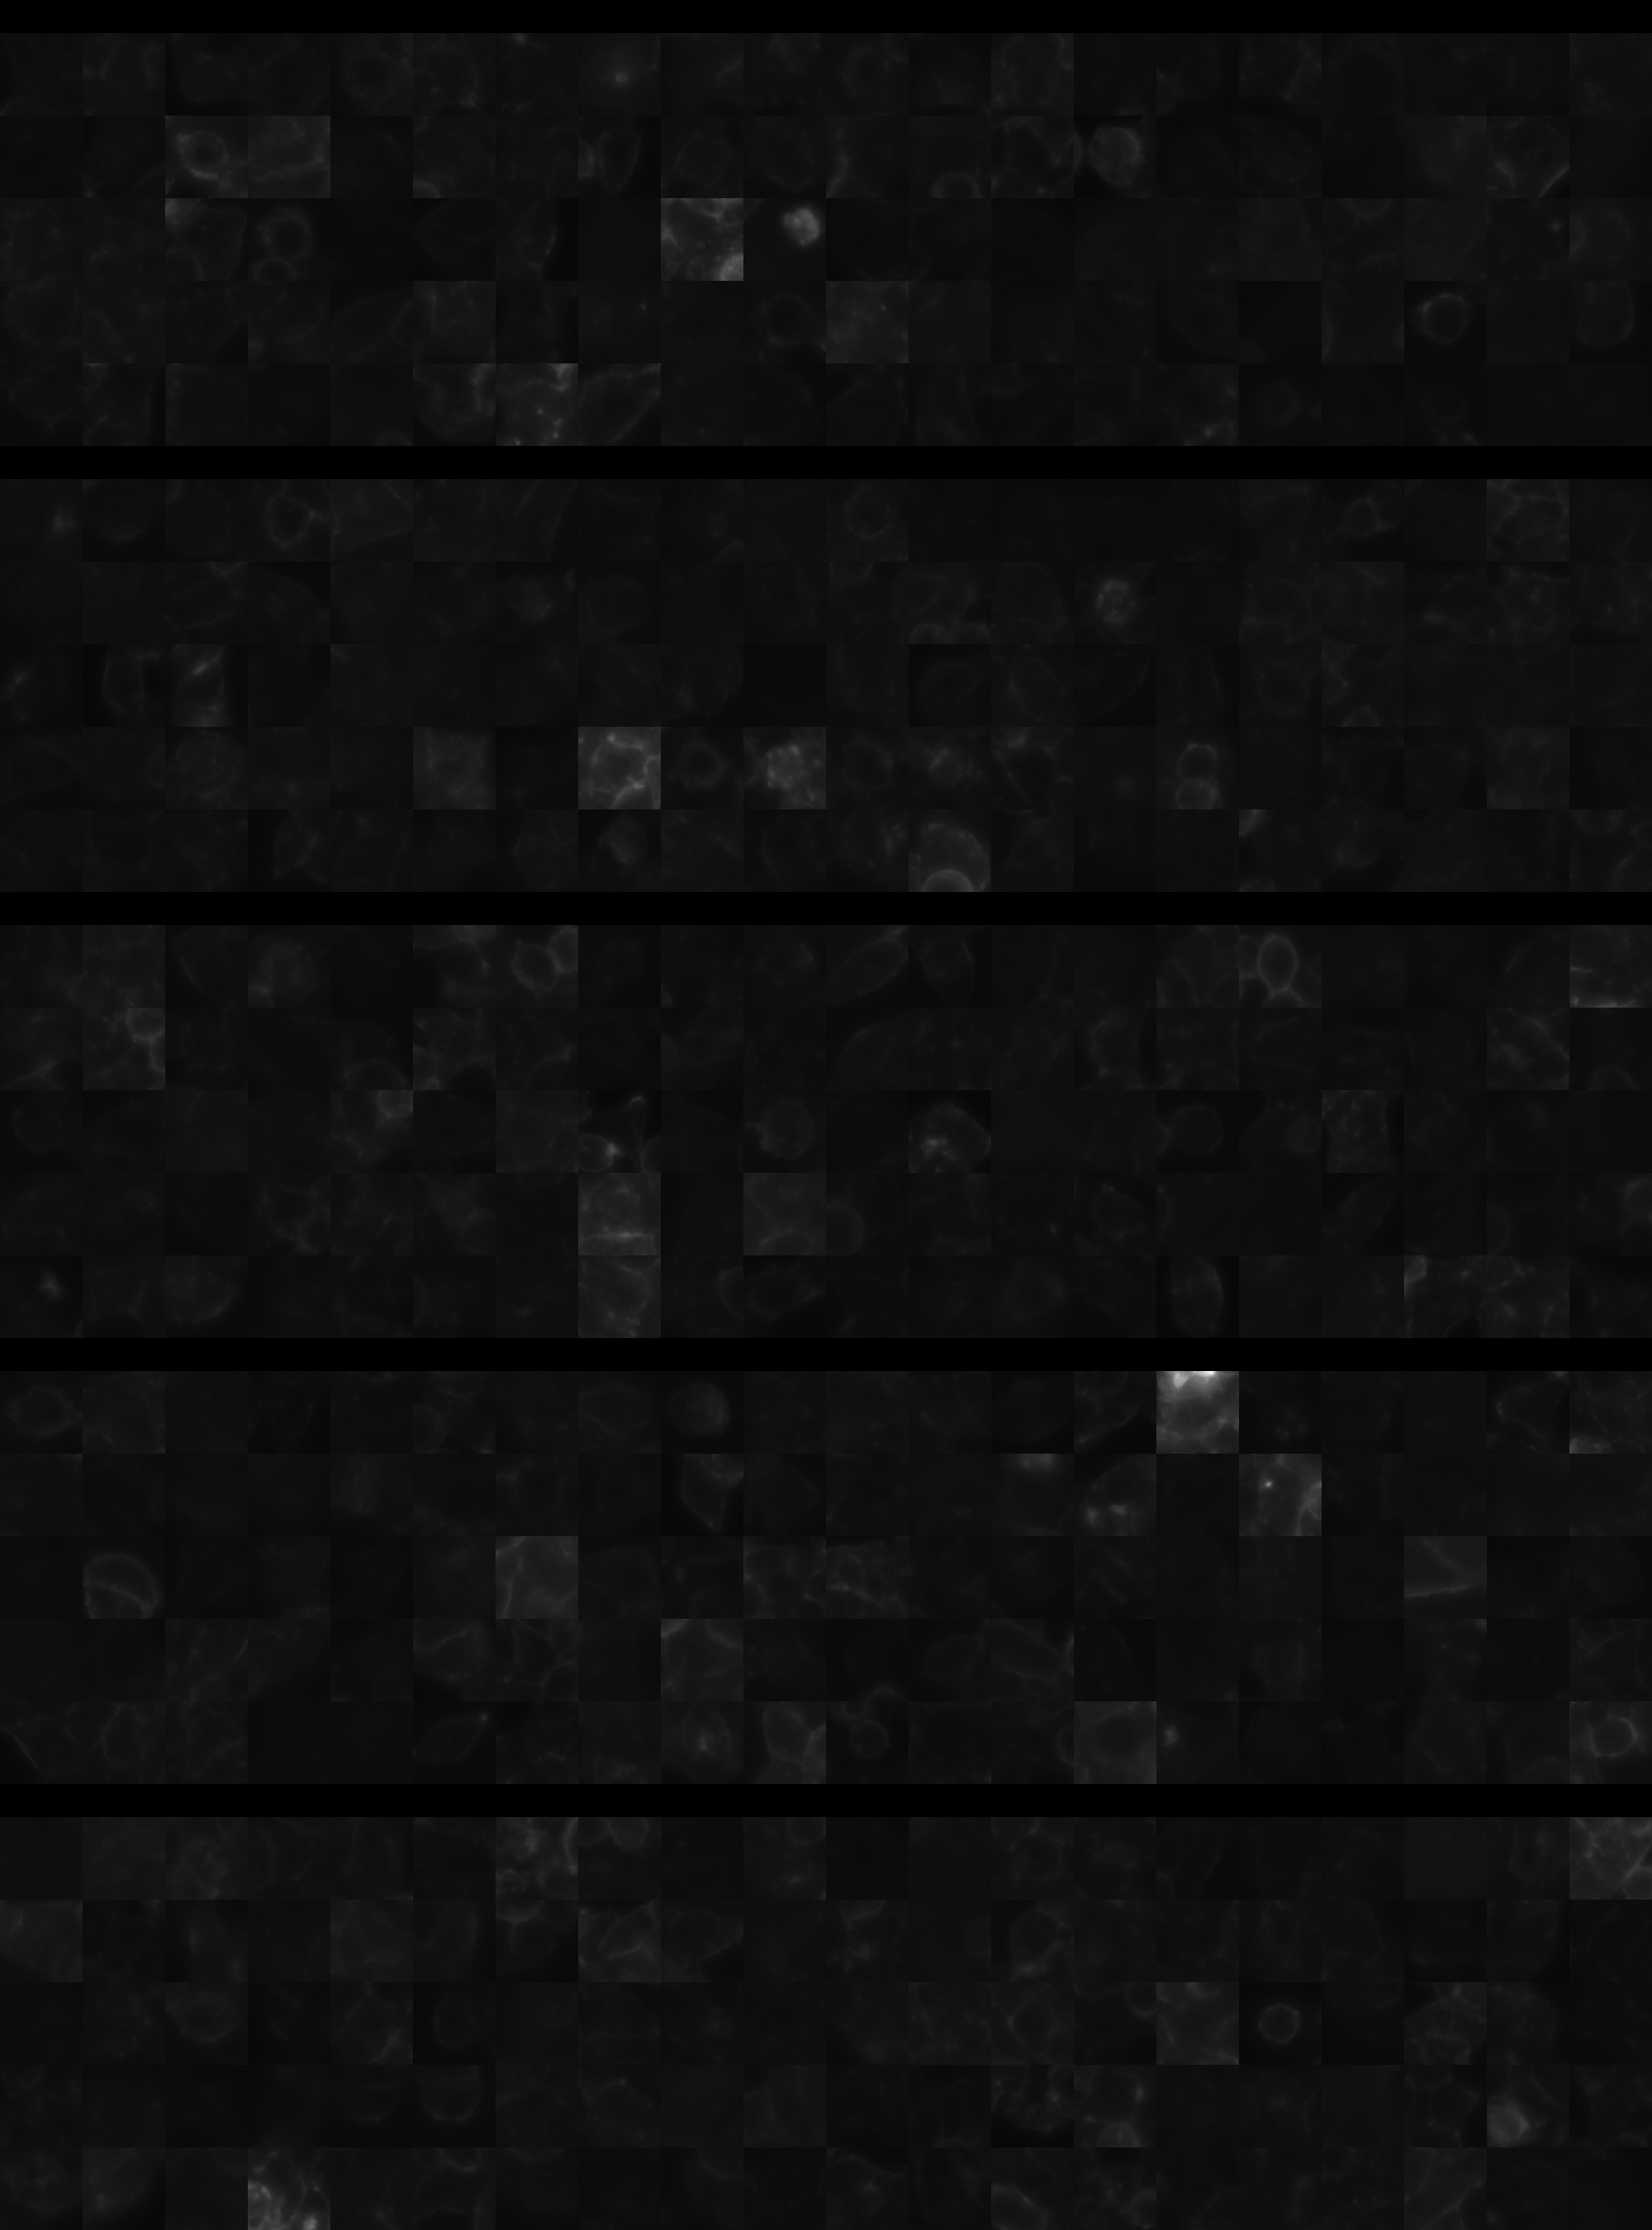
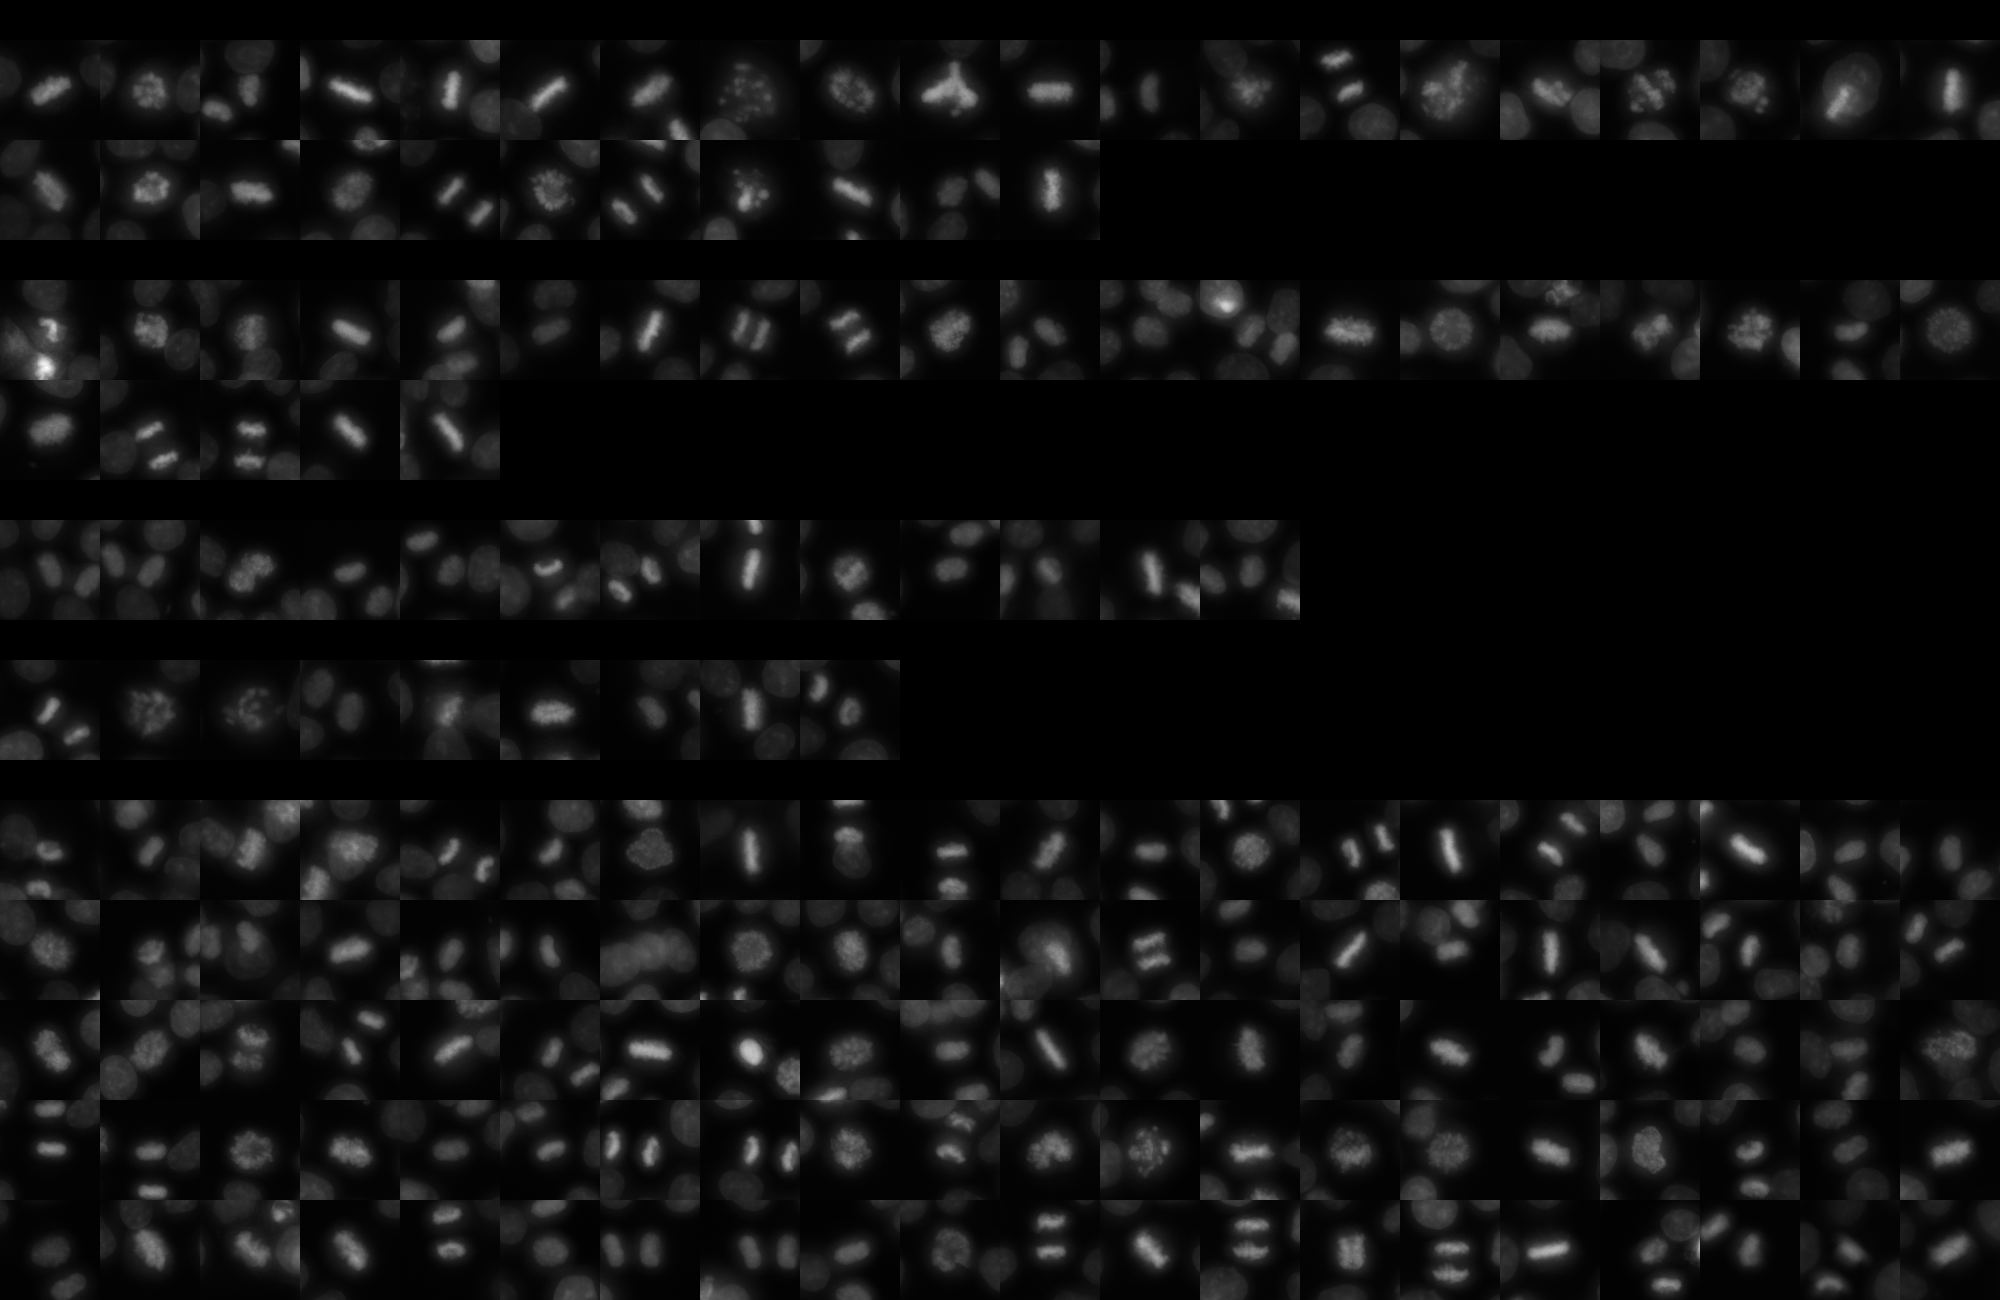
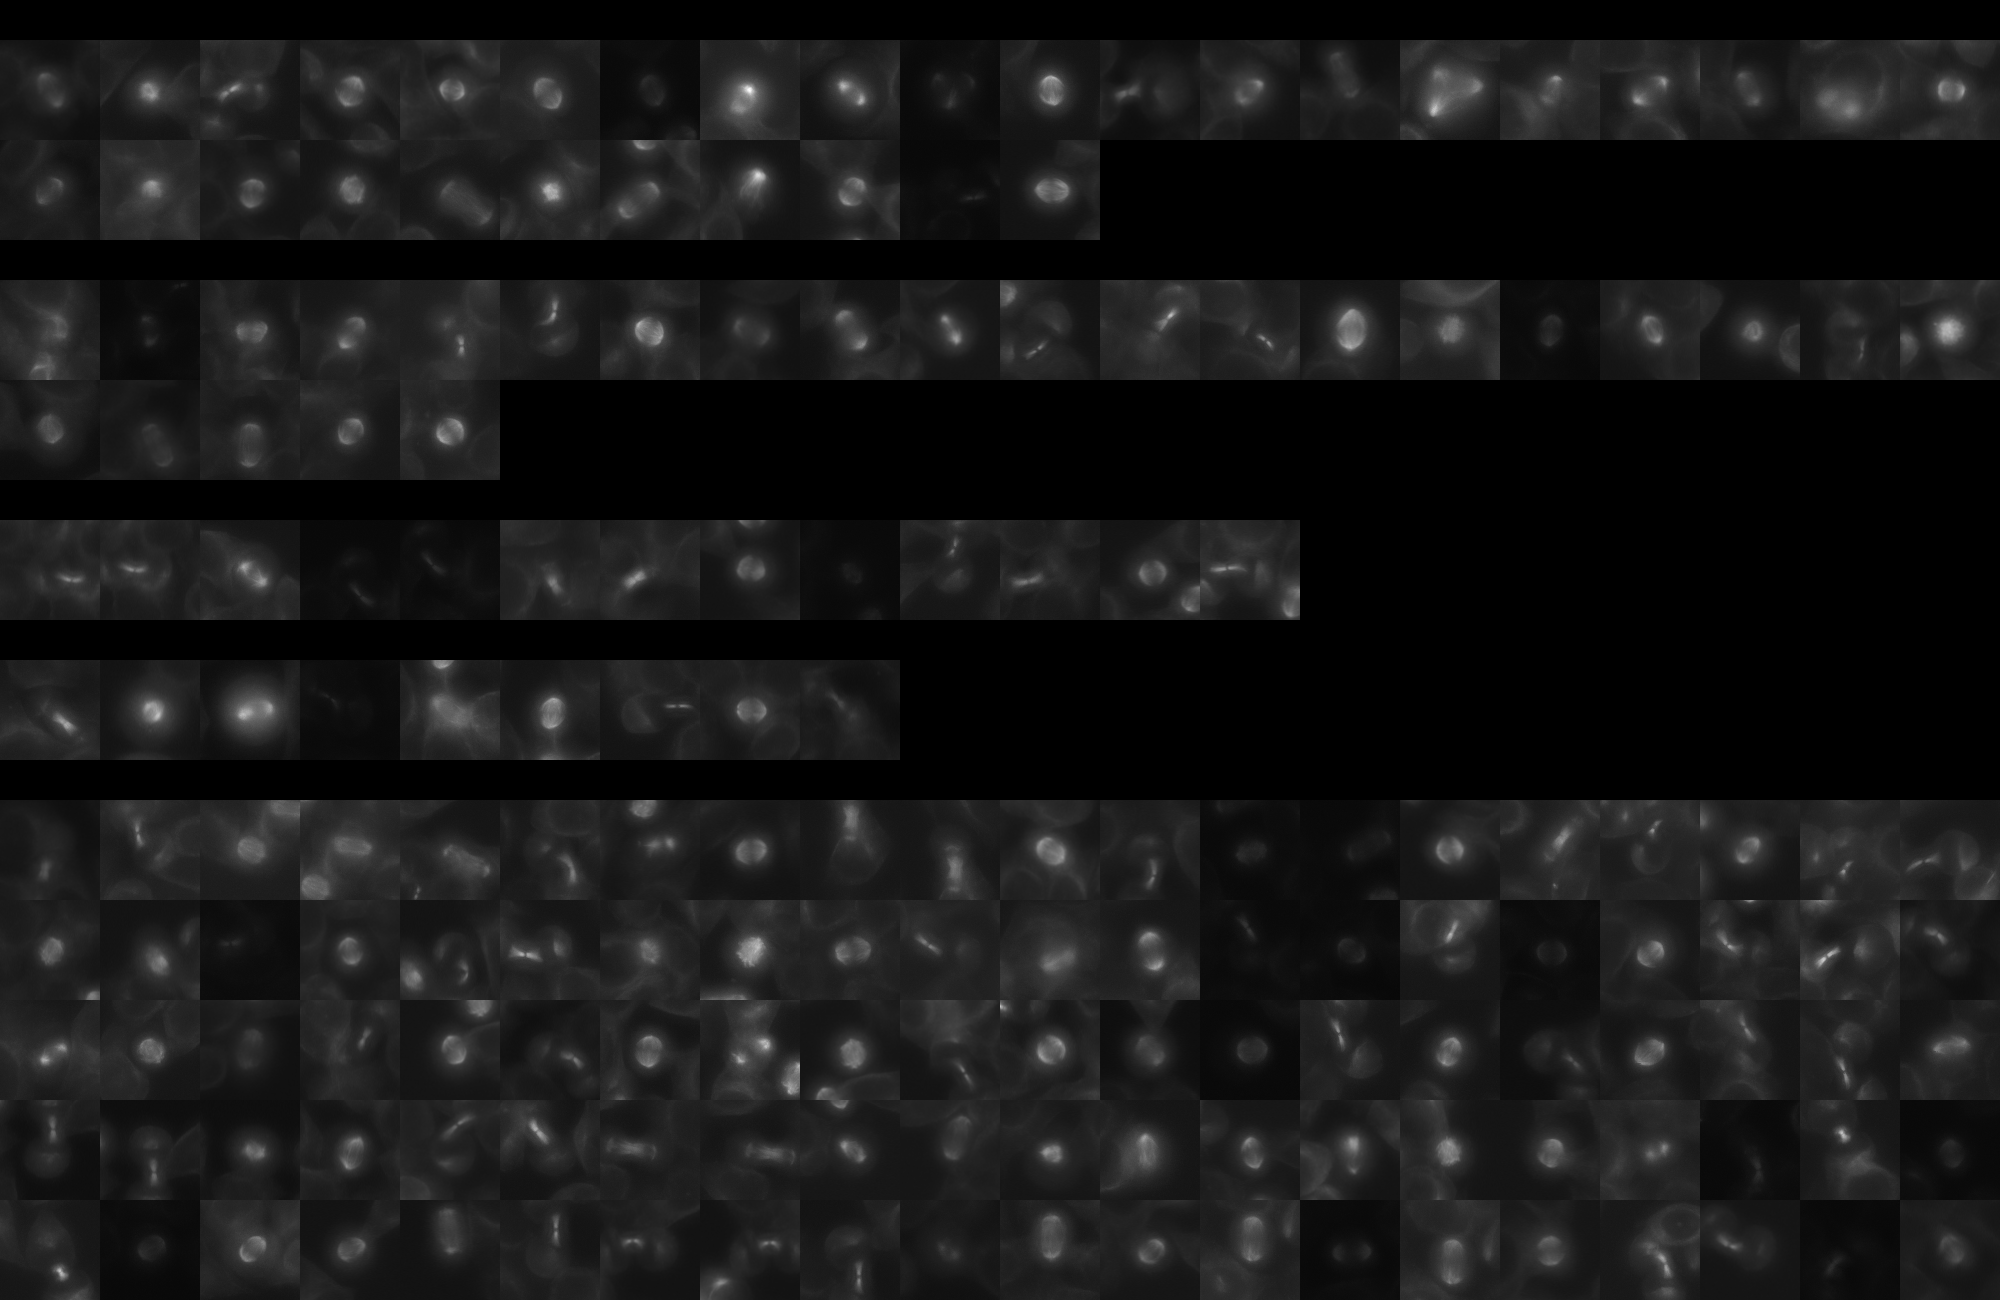
sgRNA 1: ACACAGTGGGACATTCGAAG (interphase cells: 951, mitotic cells: 31)
sgRNA 2: GCAAACATGGTCTCATAGGT (interphase cells: 1140, mitotic cells: 25)
sgRNA 3: GGCAGTGGACTCGGCTCCGG (interphase cells: 658, mitotic cells: 13)
sgRNA 4: TGGATGAAATCACAGCAAAG (interphase cells: 407, mitotic cells: 9)

Interphase Cluster

Mitotic Cluster

Overview

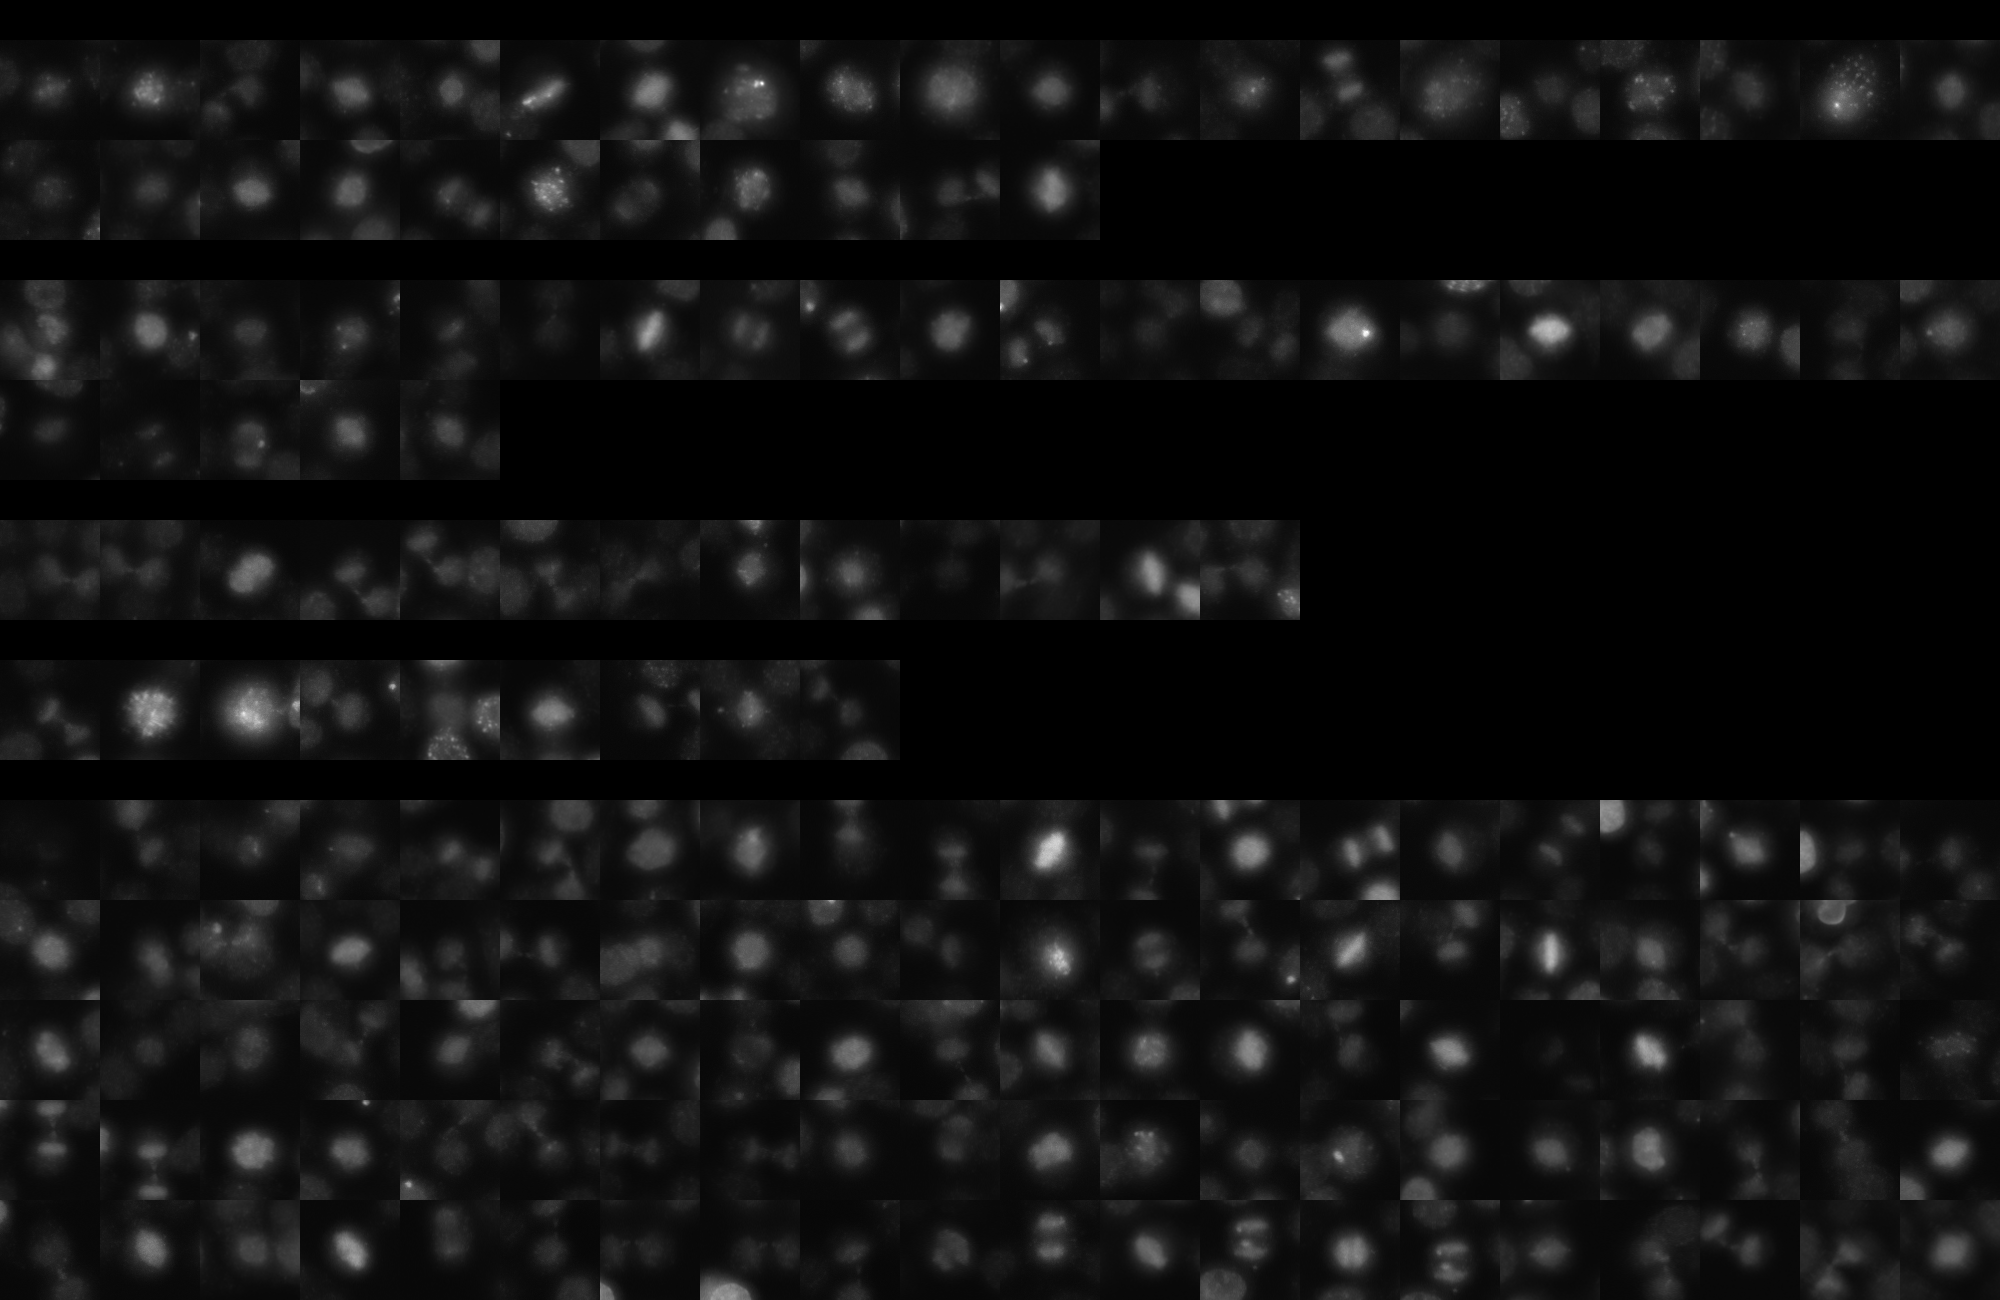
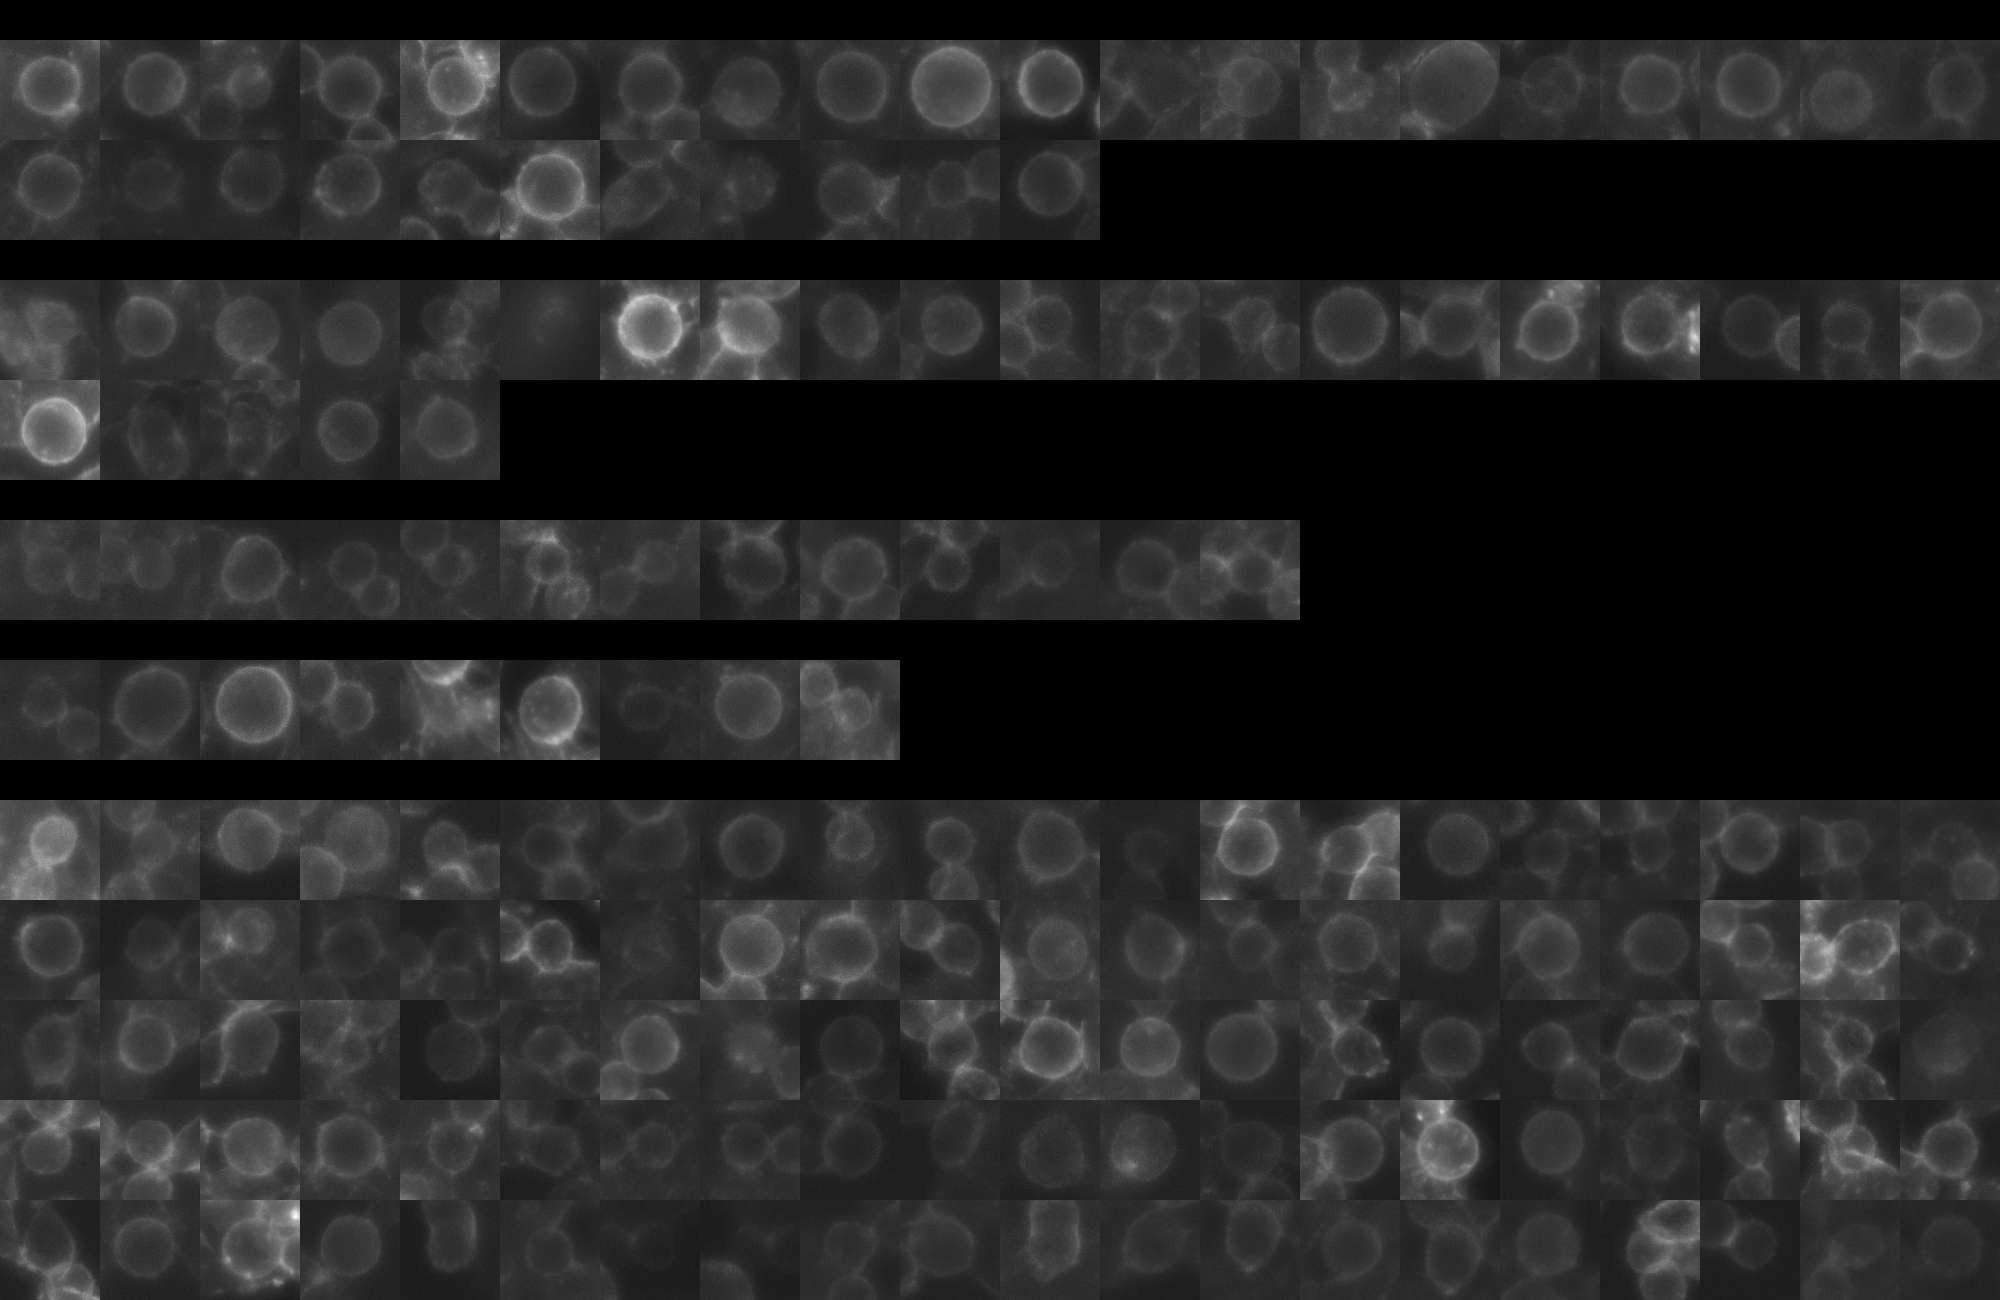
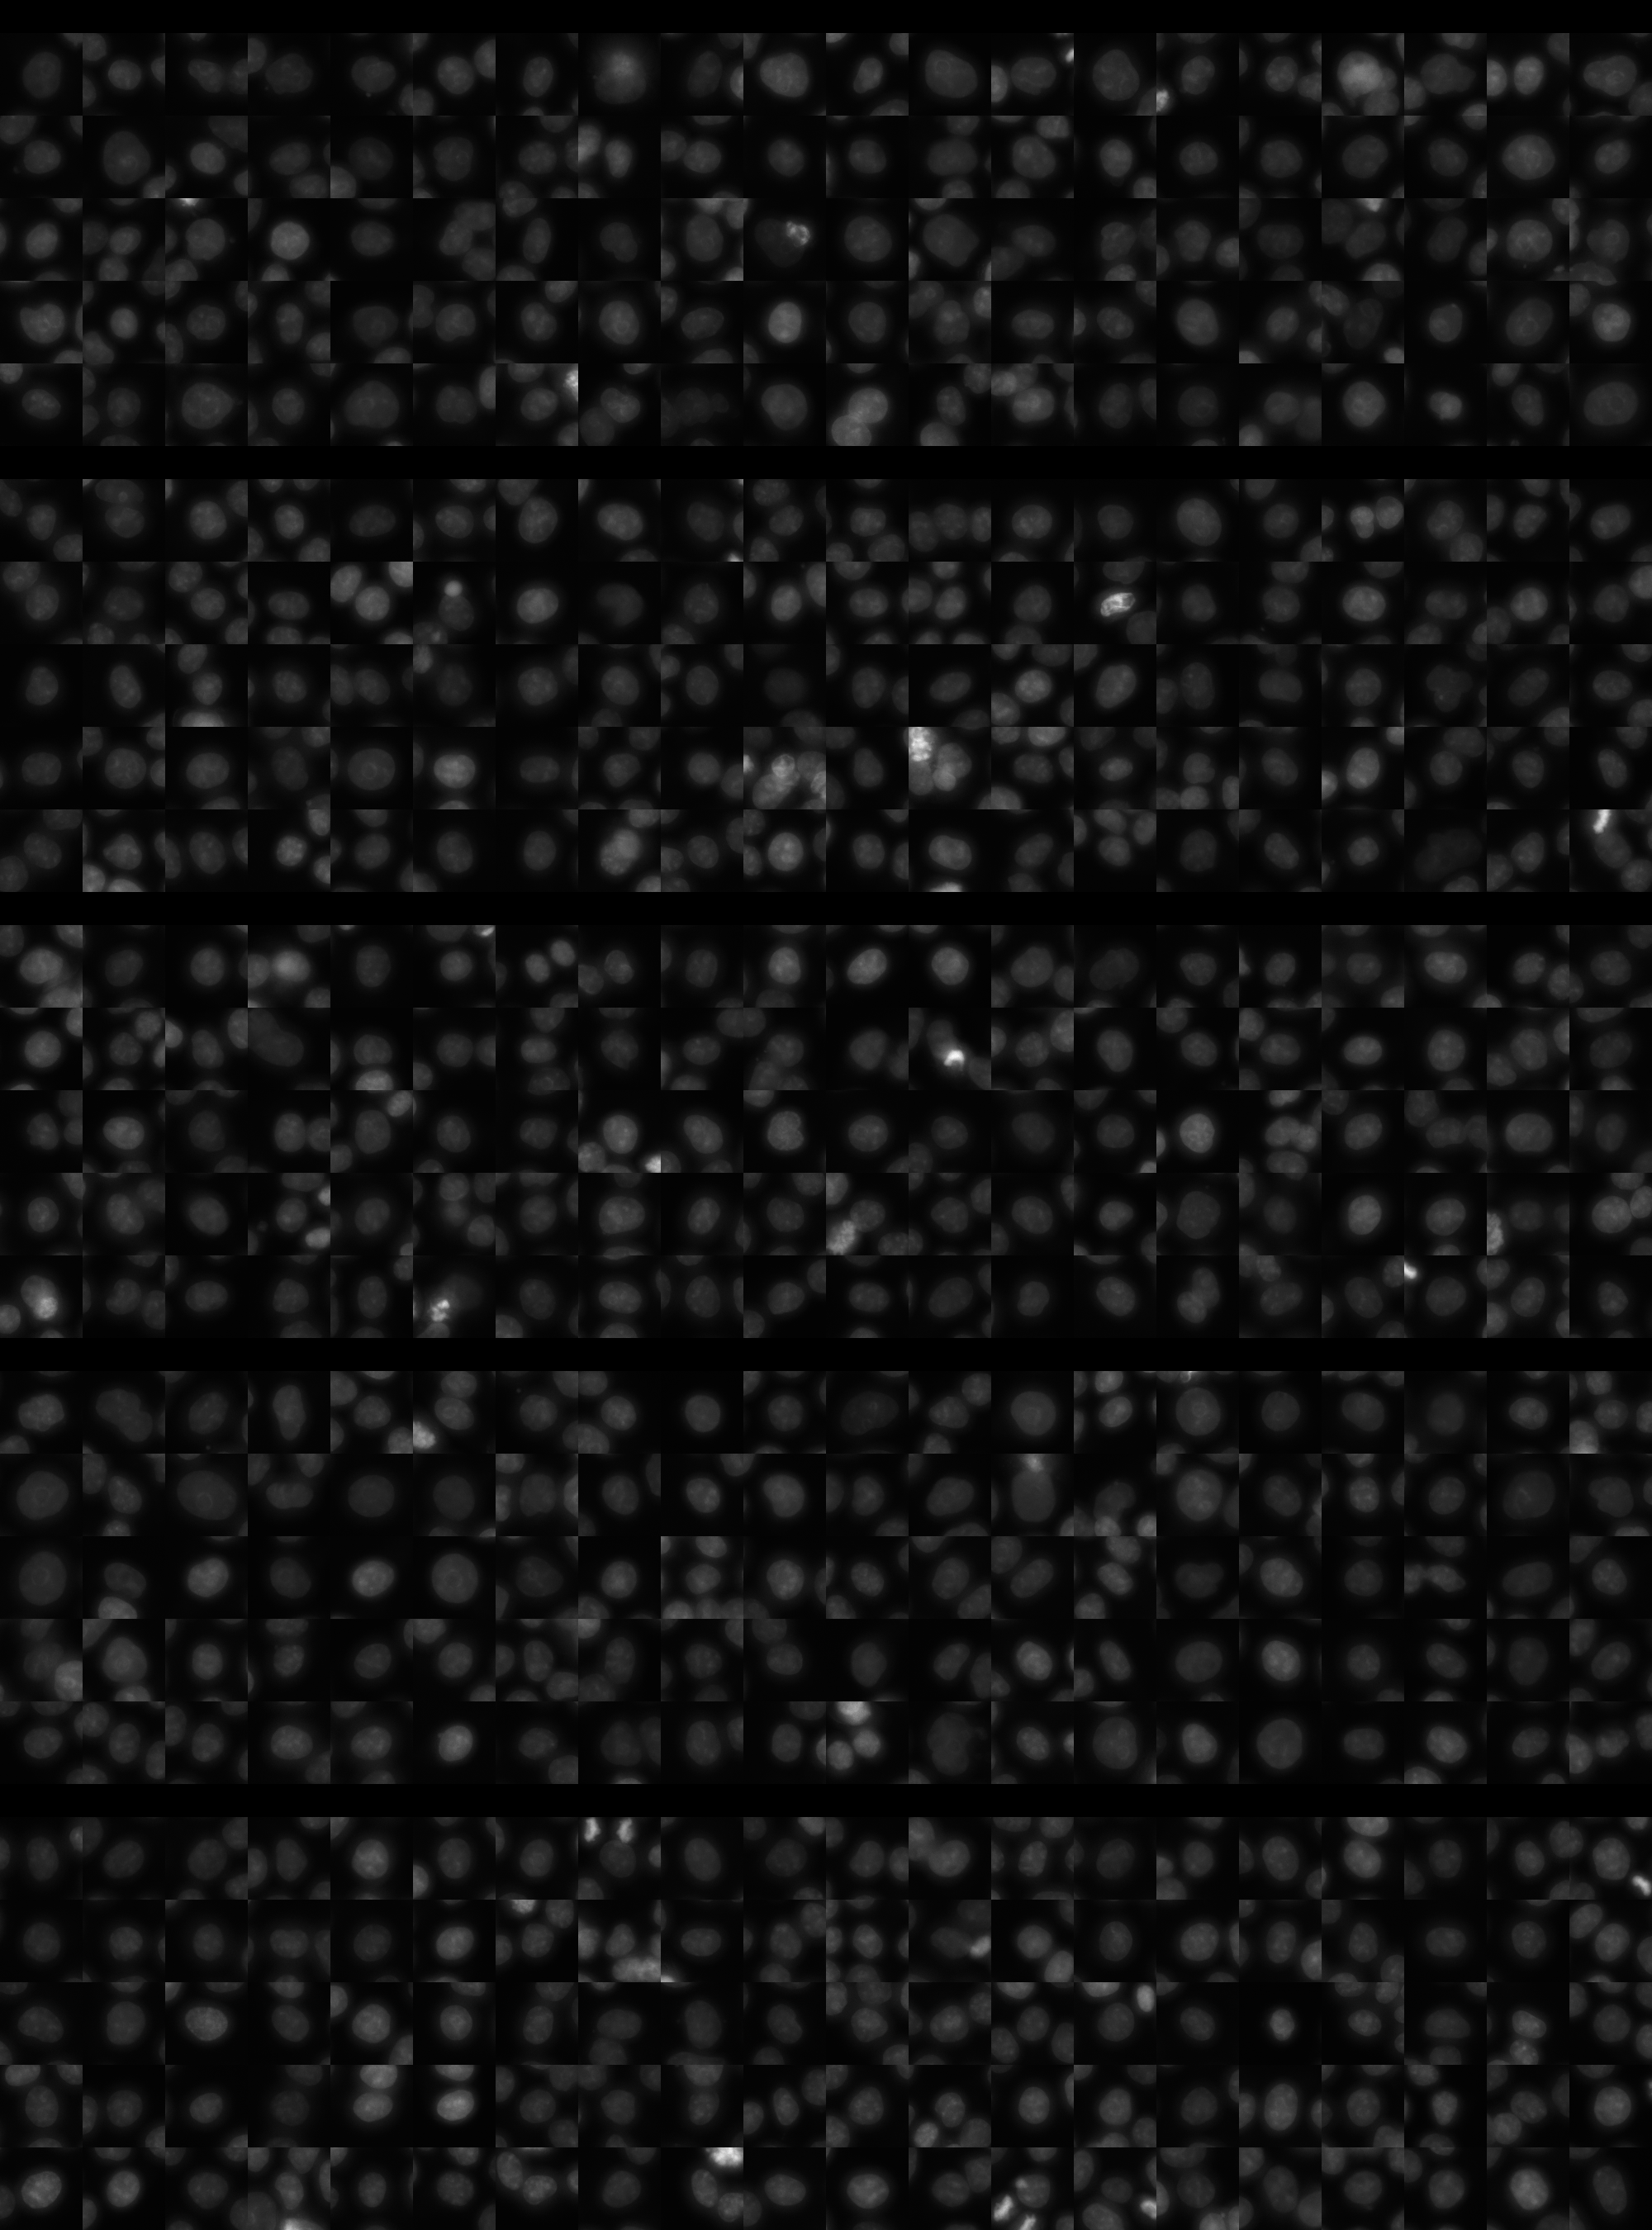
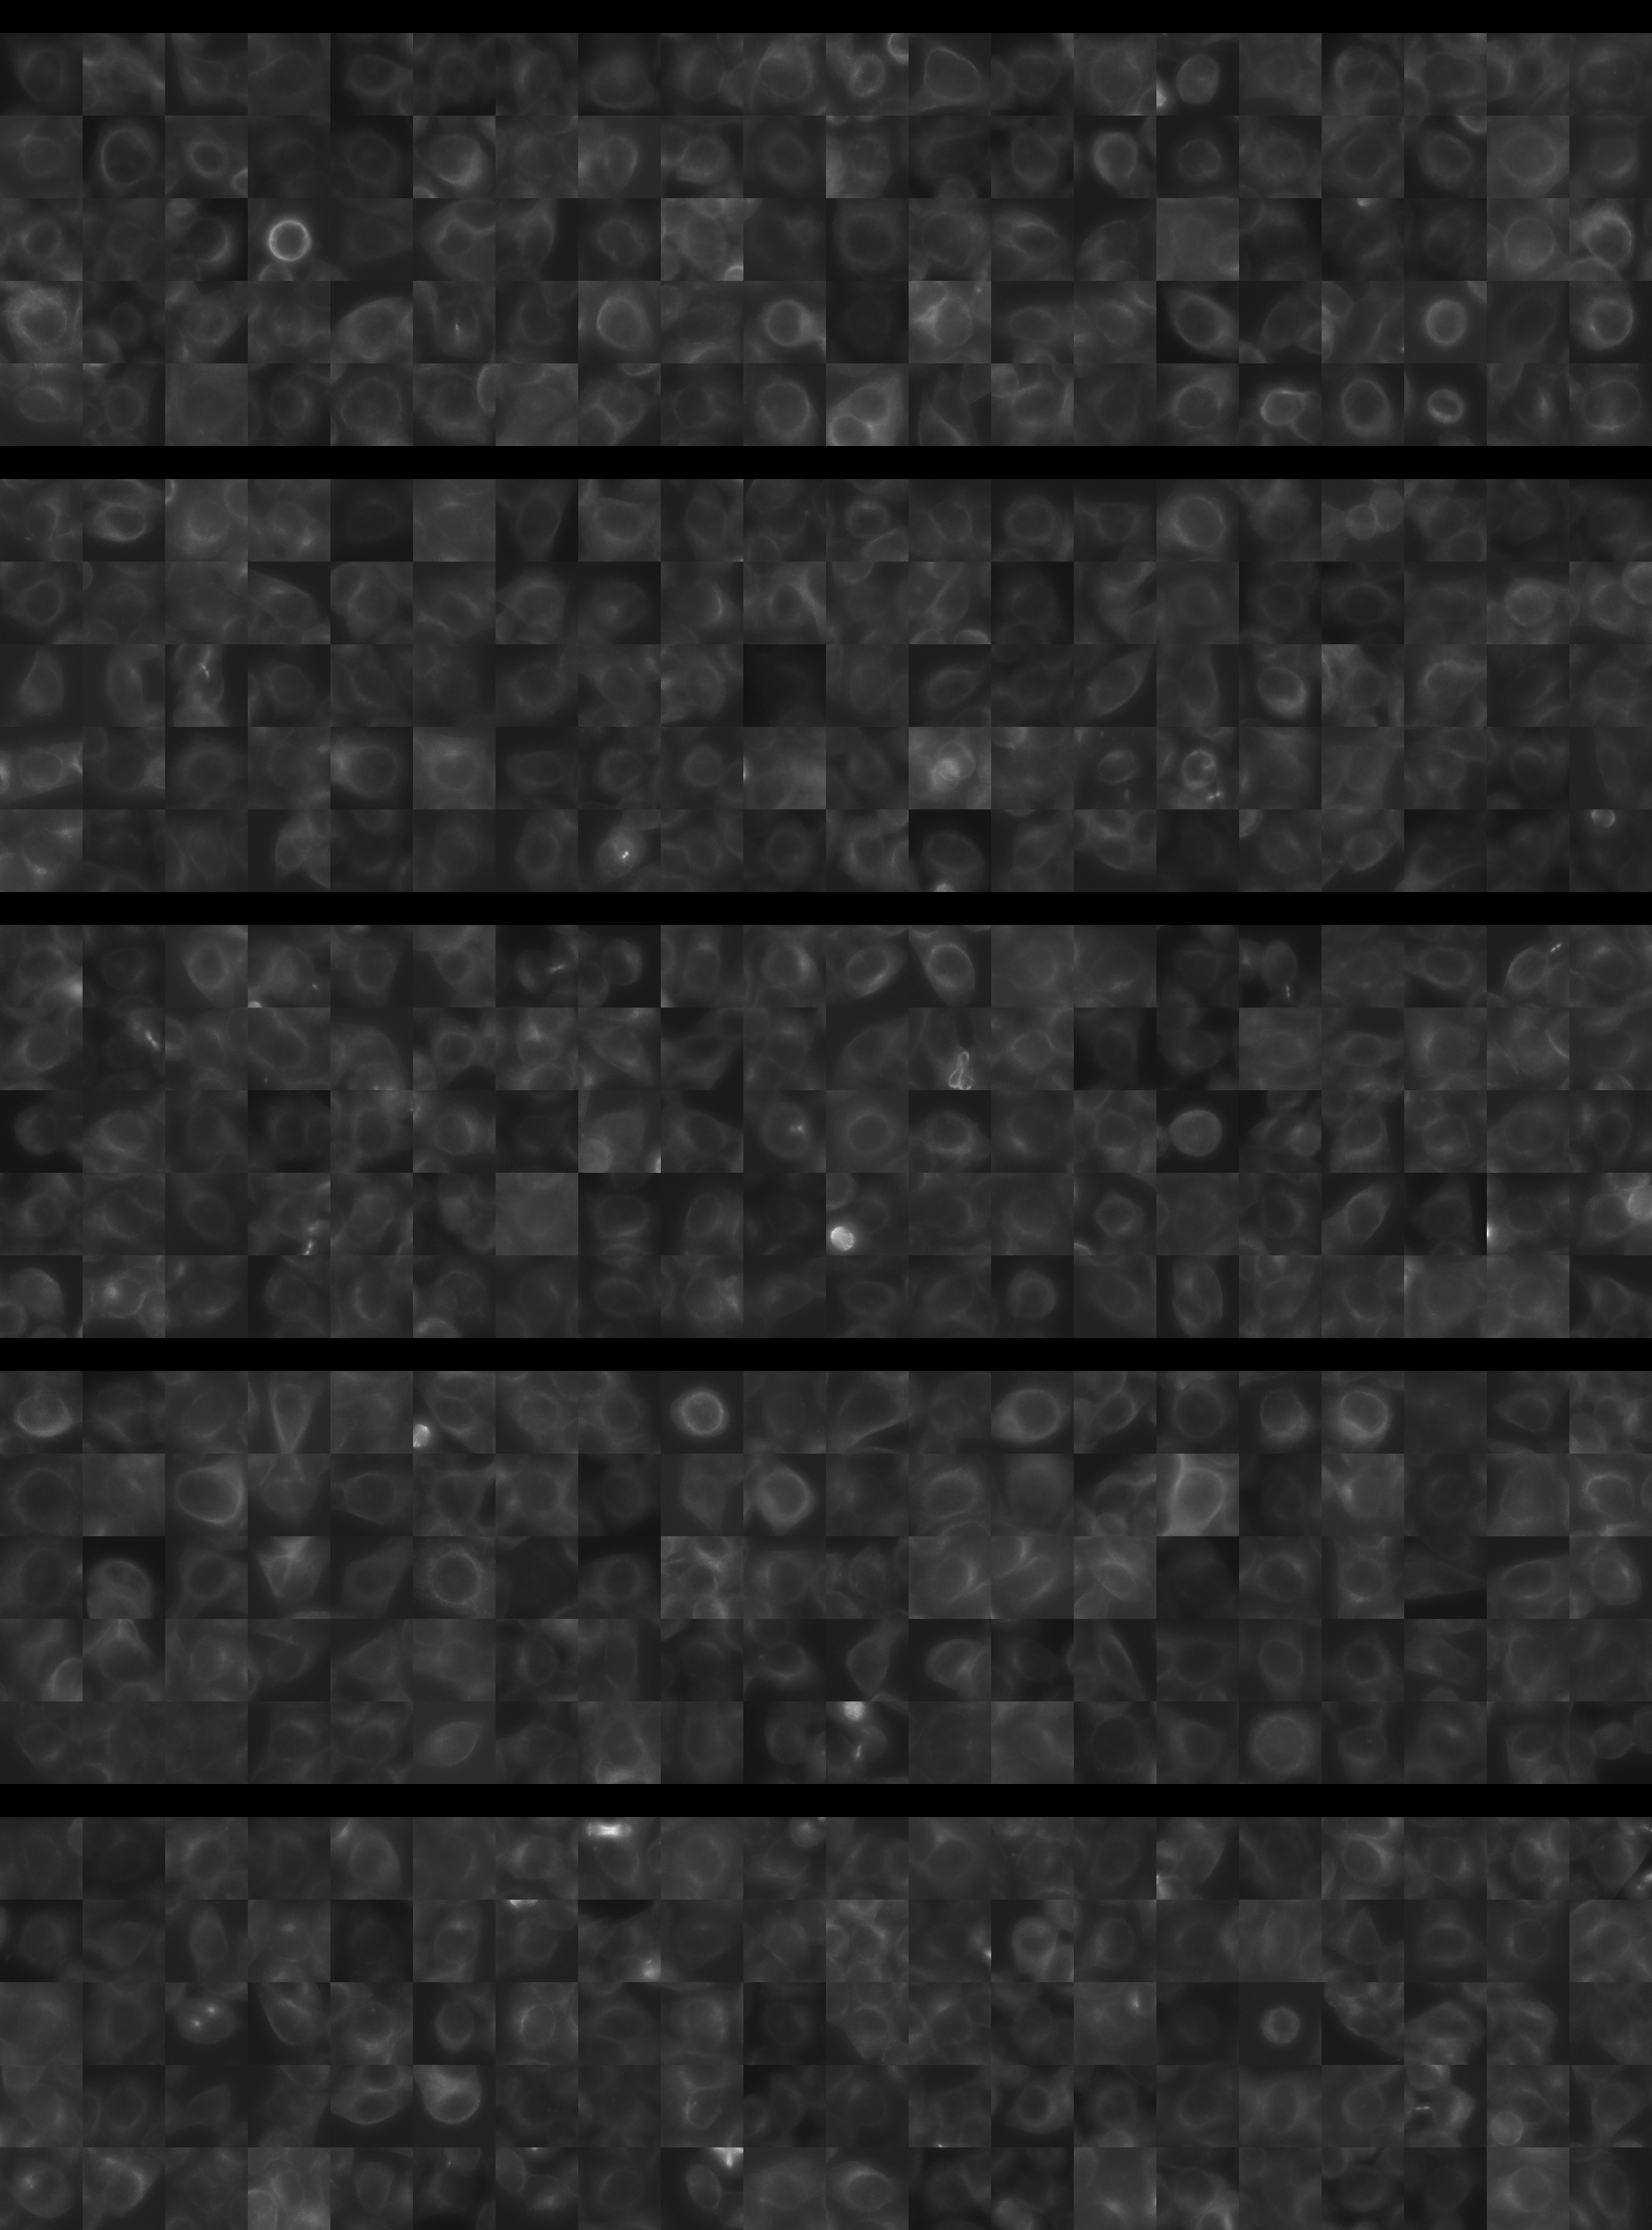
Each montage below shows randomly selected individual cell images for the same target gene separated by sgRNA, along with an example montage of cells expressing a non-targeting negative control sgRNA at the bottom. sgRNA labels in the montages correspond to the numbered sgRNA sequences in the gene info table above. The DNA (blue) and tubulin (green) channels are displayed by default, with gH2AX (grayscale) and actin (yellow) available using the check boxes. Channel brightness, contrast, and opacity are adjustable by clicking the arrow next to the channel name. When only one channel is selected, the display defaults to grayscale. Click the “Zoom” checkbox above the channel controls to enable image zooming (via scrolling) and panning (via click-and-drag).

The cell boxes displayed for this gene are square, 30.36 μm per side for the interphase montage and 30.36 μm per side for the mitotic montage.
Features

Interphase Score Rank FDR q-value
Nucleus DNA Integrated 0.365 77 of 5322 5.407e-04
Nucleus DNA Mean 0.013 1577 of 5322 0.795
Nucleus gH2AX Mean 0.412 150 of 5322 1.367e-04
Nucleus DNA - gH2AX Correlation -4.286e-02 2142 of 5322 0.222
Nucleus Shape Area 0.365 124 of 5322 1.633e-04
Nucleus Shape Eccentricity 1.629e-04 3346 of 5322 0.978
Nucleus Shape Form Factor -5.729e-02 3021 of 5322 0.223
Nucleus Shape Solidity 0.049 88 of 5322 0.196
Cell DNA Mass Displacement 0.044 1428 of 5322 0.552
Cell Tubulin Mean 0.162 247 of 5322 2.141e-04
Cell Tubulin Mass Displacement 0.090 221 of 5322 0.047
Cell Actin Mean -1.496e-02 3489 of 5322 0.861
Cell Tubulin - Actin Correlation 0.045 1604 of 5322 0.401
Cell DNA - Tubulin Correlation 0.043 2135 of 5322 0.369
Cell Shape Area 0.221 197 of 5322 1.651e-04
Cell Shape Eccentricity 0.003 3517 of 5322 0.982
Mitotic Score Rank FDR q-value
Nucleus DNA Integrated -7.359e-02 4608 of 5322 0.973
Nucleus DNA Mean -7.309e-02 3989 of 5322 1.000
Nucleus DNA Mass Displacement 0.212 661 of 5322 0.999
Nucleus DNA Mean Frac 3 0.135 1134 of 5322 1.000
Nucleus gH2AX Mean 0.004 2903 of 5322 1.000
Nucleus gH2AX Mean Frac 0 0.020 1961 of 5322 1.000
Nucleus Tubulin Mean Frac 0 0.006 3402 of 5322 0.999
Nucleus Tubulin Mean Edge 0.338 206 of 5322 0.893
Nucleus Tubulin Std Edge -1.962e-01 4607 of 5322 0.999
Nucleus Shape Area 0.100 2678 of 5322 0.990
Nucleus Shape Eccentricity -3.722e-01 5095 of 5322 1.000
Nucleus Shape Form Factor -1.513e-01 3588 of 5322 0.998
Cell Tubulin Mean 0.321 347 of 5322 0.944
Cell Tubulin Mean Frac 3 0.229 154 of 5322 0.999
Cell Actin Mean 0.161 1195 of 5322 0.997
Cell Shape Area -5.767e-02 4490 of 5322 0.998
( Reset Zoom )
Brightness
Contrast
Opacity
Brightness
Contrast
Opacity
Brightness
Contrast
Opacity
Brightness
Contrast
Opacity
Brightness
Contrast
Opacity

( Reset Zoom )
Brightness
Contrast
Opacity
Brightness
Contrast
Opacity
Brightness
Contrast
Opacity
Brightness
Contrast
Opacity
Brightness
Contrast
Opacity

MIT Central Accessability