CCDC84

Gene symbol: CCDC84
Gene: 338657
Uniprot Function: Negative regulator of centrosome duplication (PubMed:31722219). Constrains centriole number by modulating the degradation of the centrosome-duplication-associated protein SASS6 in an acetylation-dependent manner. SIRT1 deacetylates CENATAC in G1 phase, allowing for SASS6 accumulation on the centrosome and subsequent procentriole assembly. The CENATAC acetylation level is restored in mitosis by NAT10, promoting SASS6 proteasome degradation by facilitating SASS6 binding to APC/C E3 ubiquitin-protein ligase complex/FZR1 (PubMed:31722219).
Mitotic Index 0.0251
Interphase Cluster: #220 (6 genes)
Mitotic Cluster: #9 (45 genes)
sgRNA 1: AGCAACCAACAAATTCTGGT (interphase cells: 1053, mitotic cells: 24)
sgRNA 2: CACATAGCGCTCCACCTGAG (interphase cells: 1303, mitotic cells: 24)
sgRNA 3: CTGGTGGGAGAACAAAGCTG (interphase cells: 116, mitotic cells: 6)
sgRNA 4: TCACTCCCCAGGATTATGCG (interphase cells: 711, mitotic cells: 28)

Interphase Cluster

Mitotic Cluster

Overview

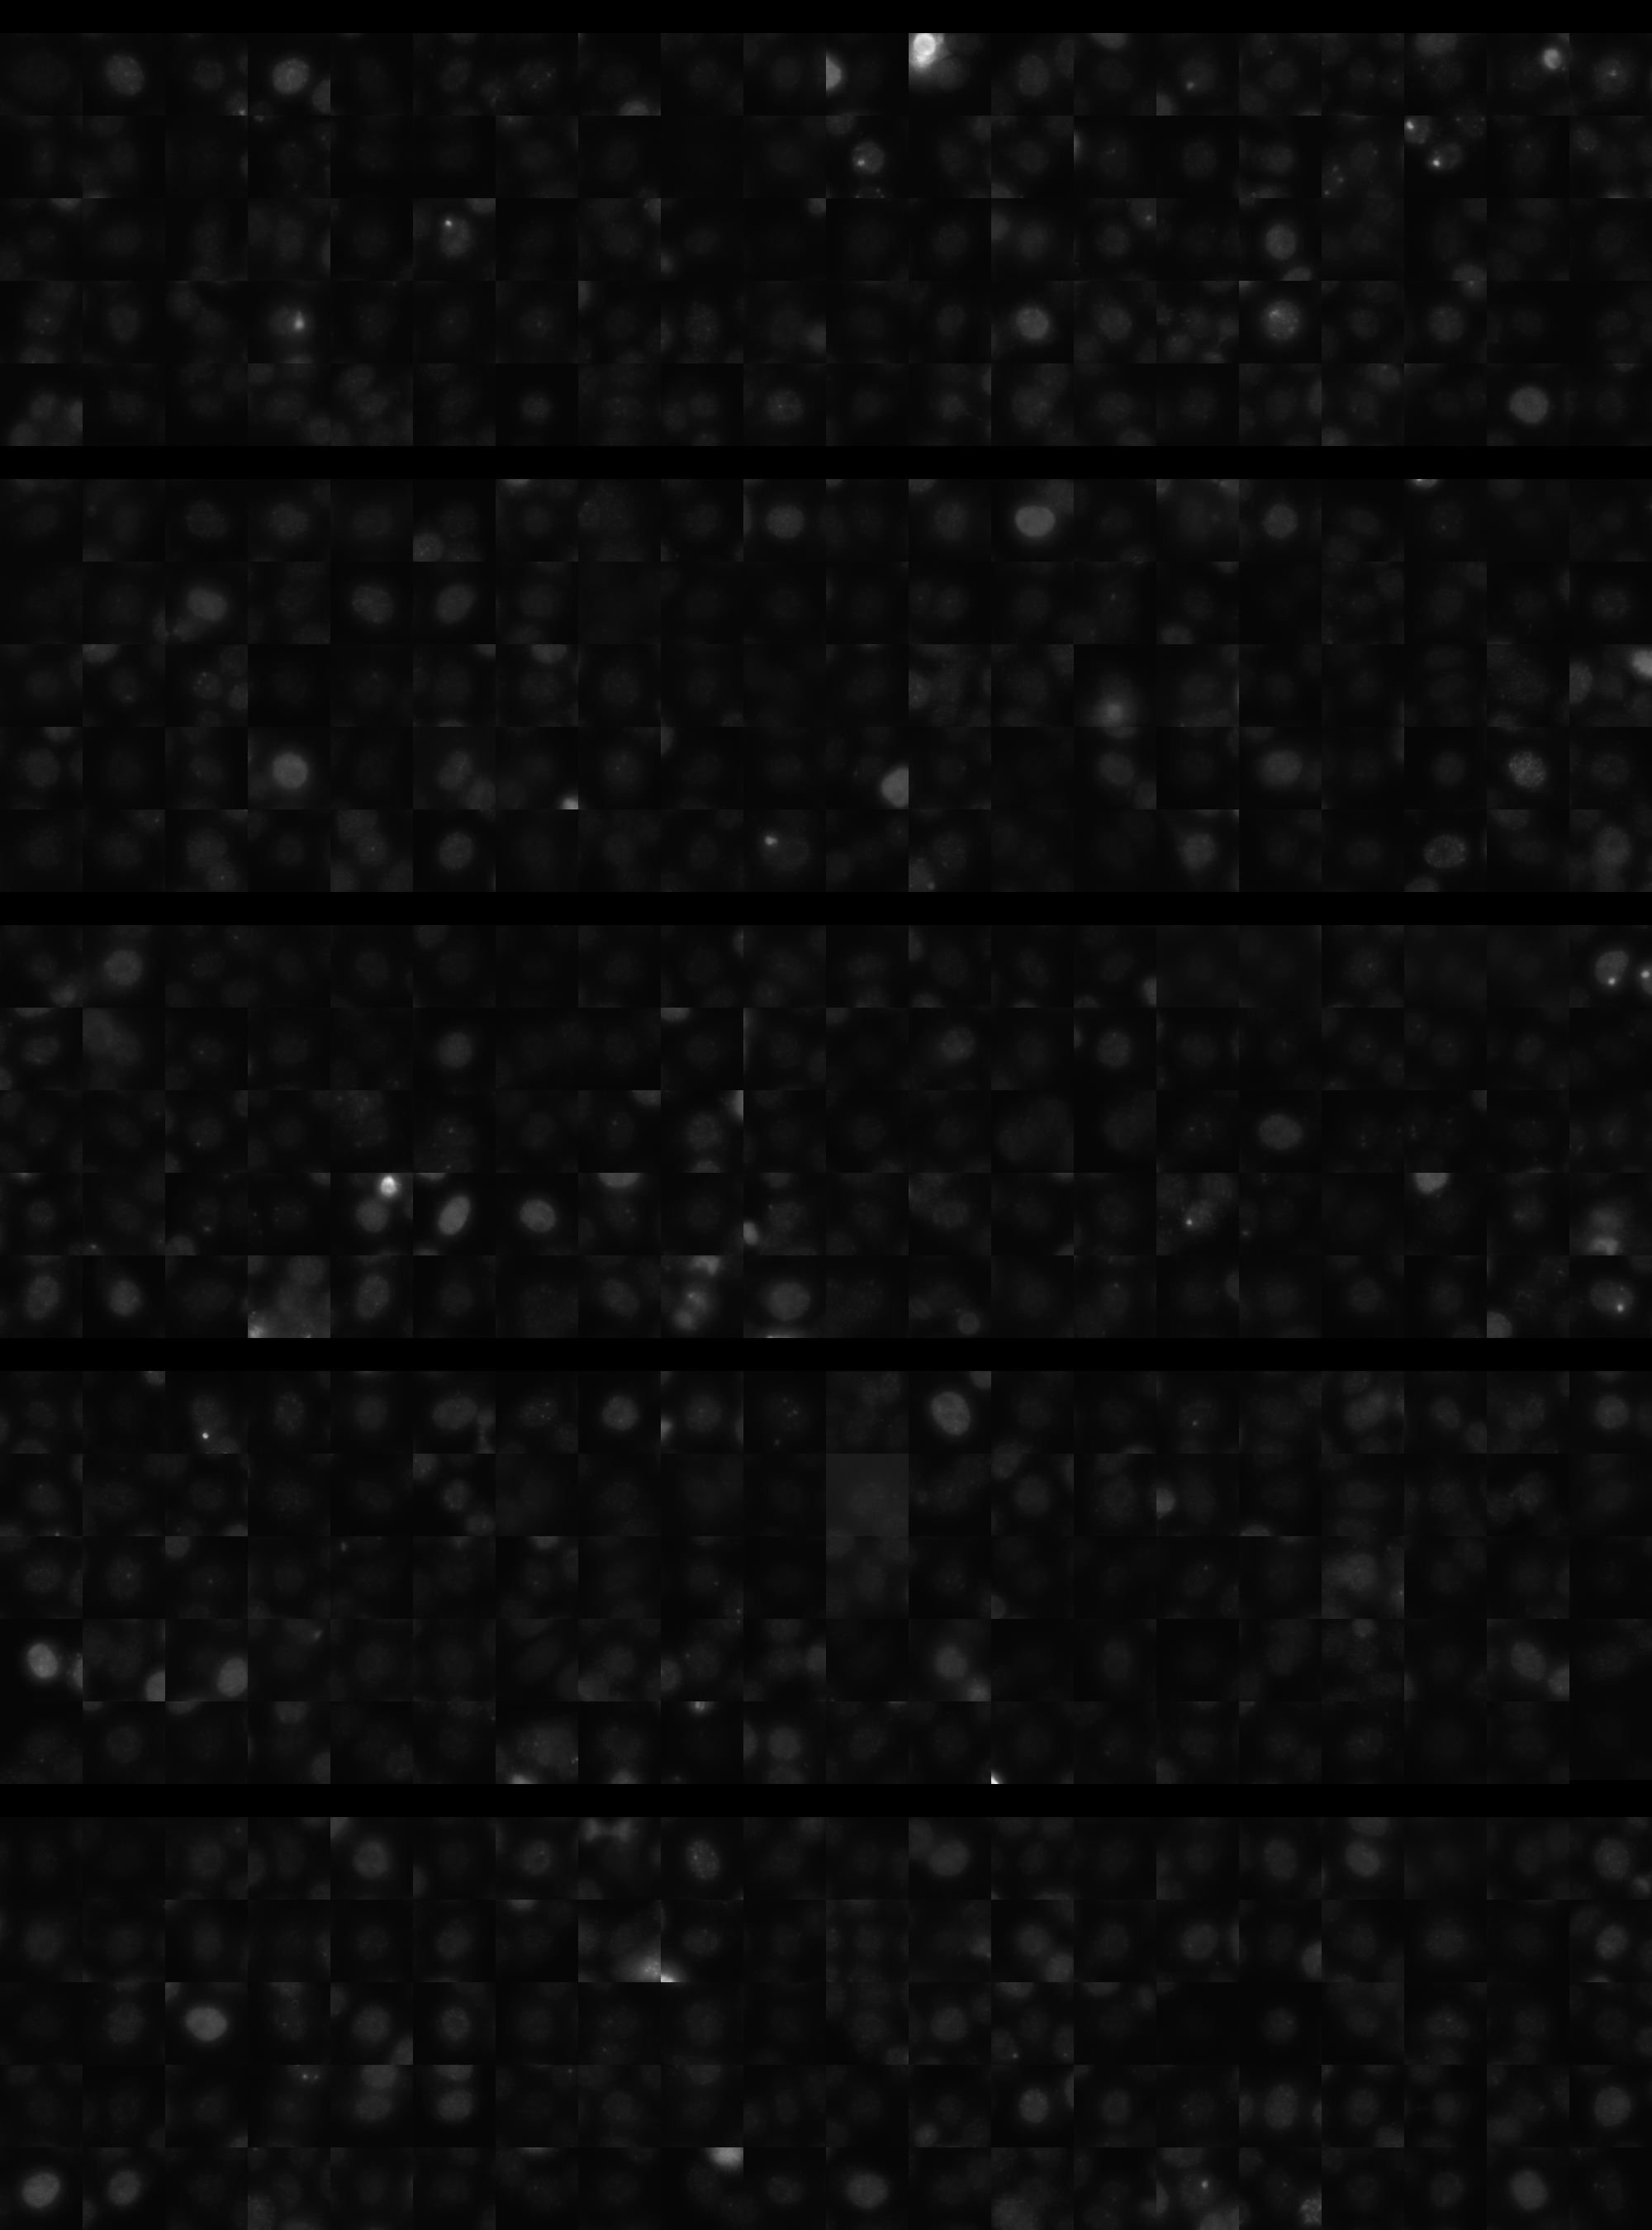
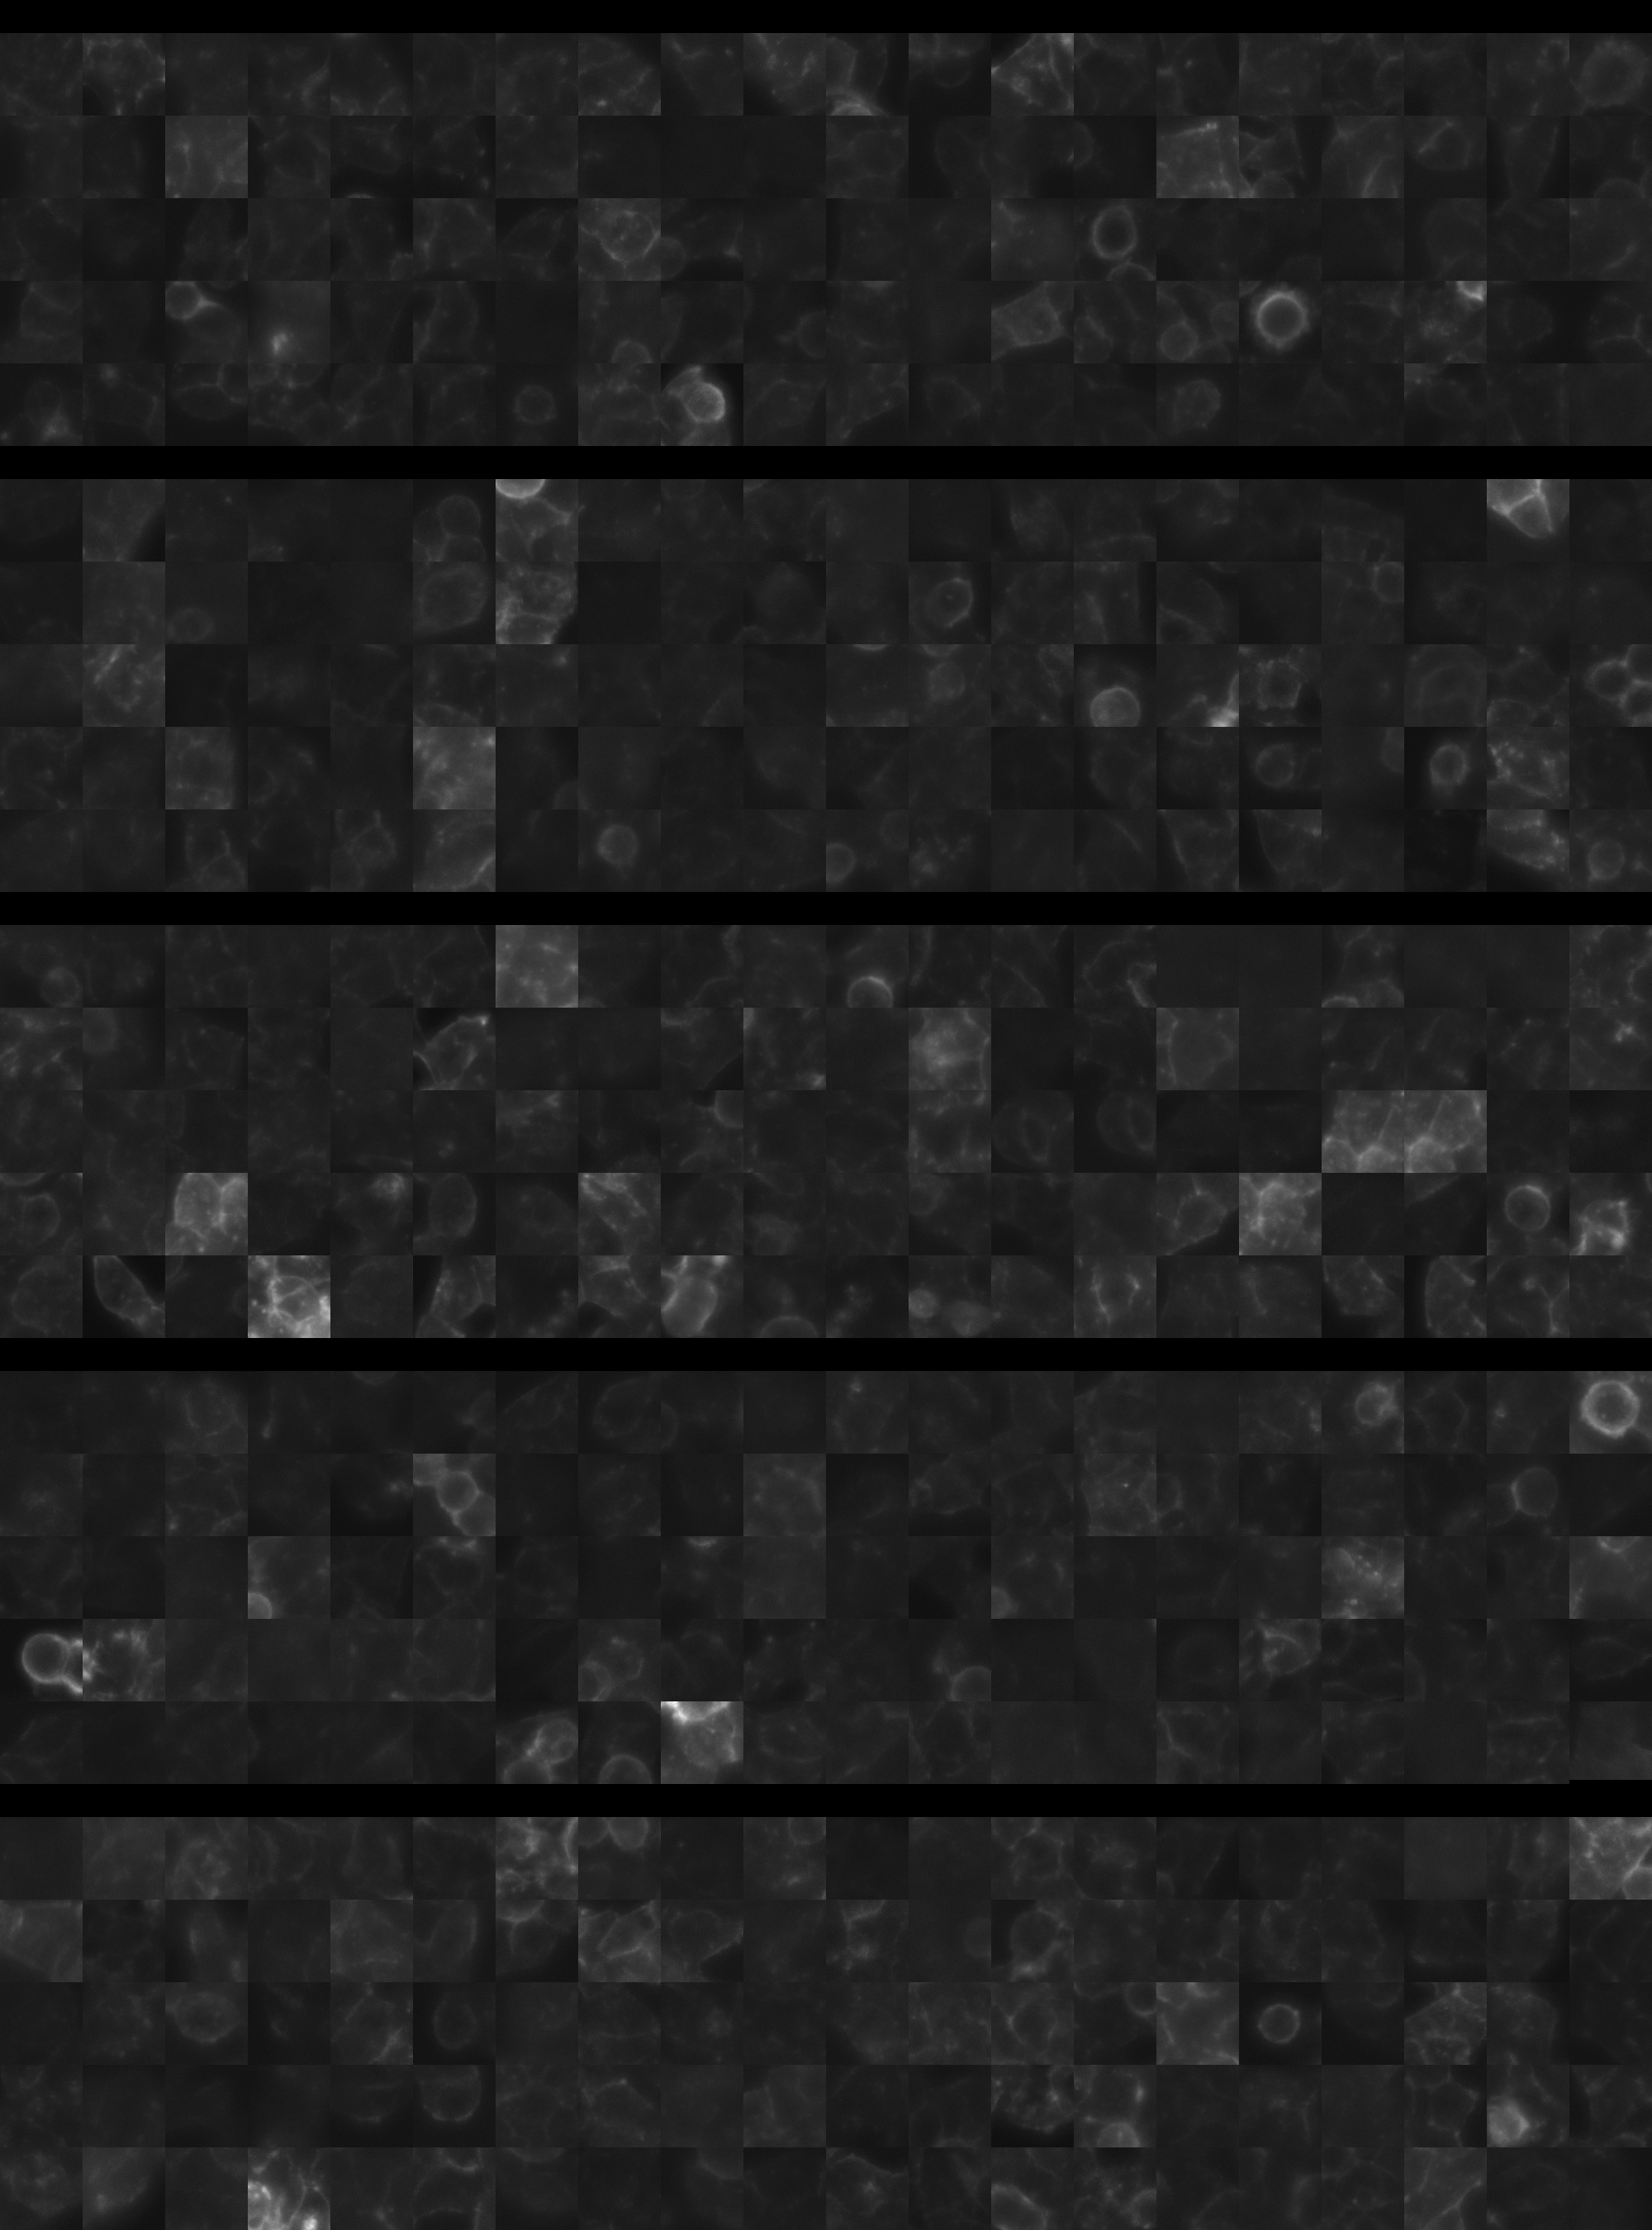
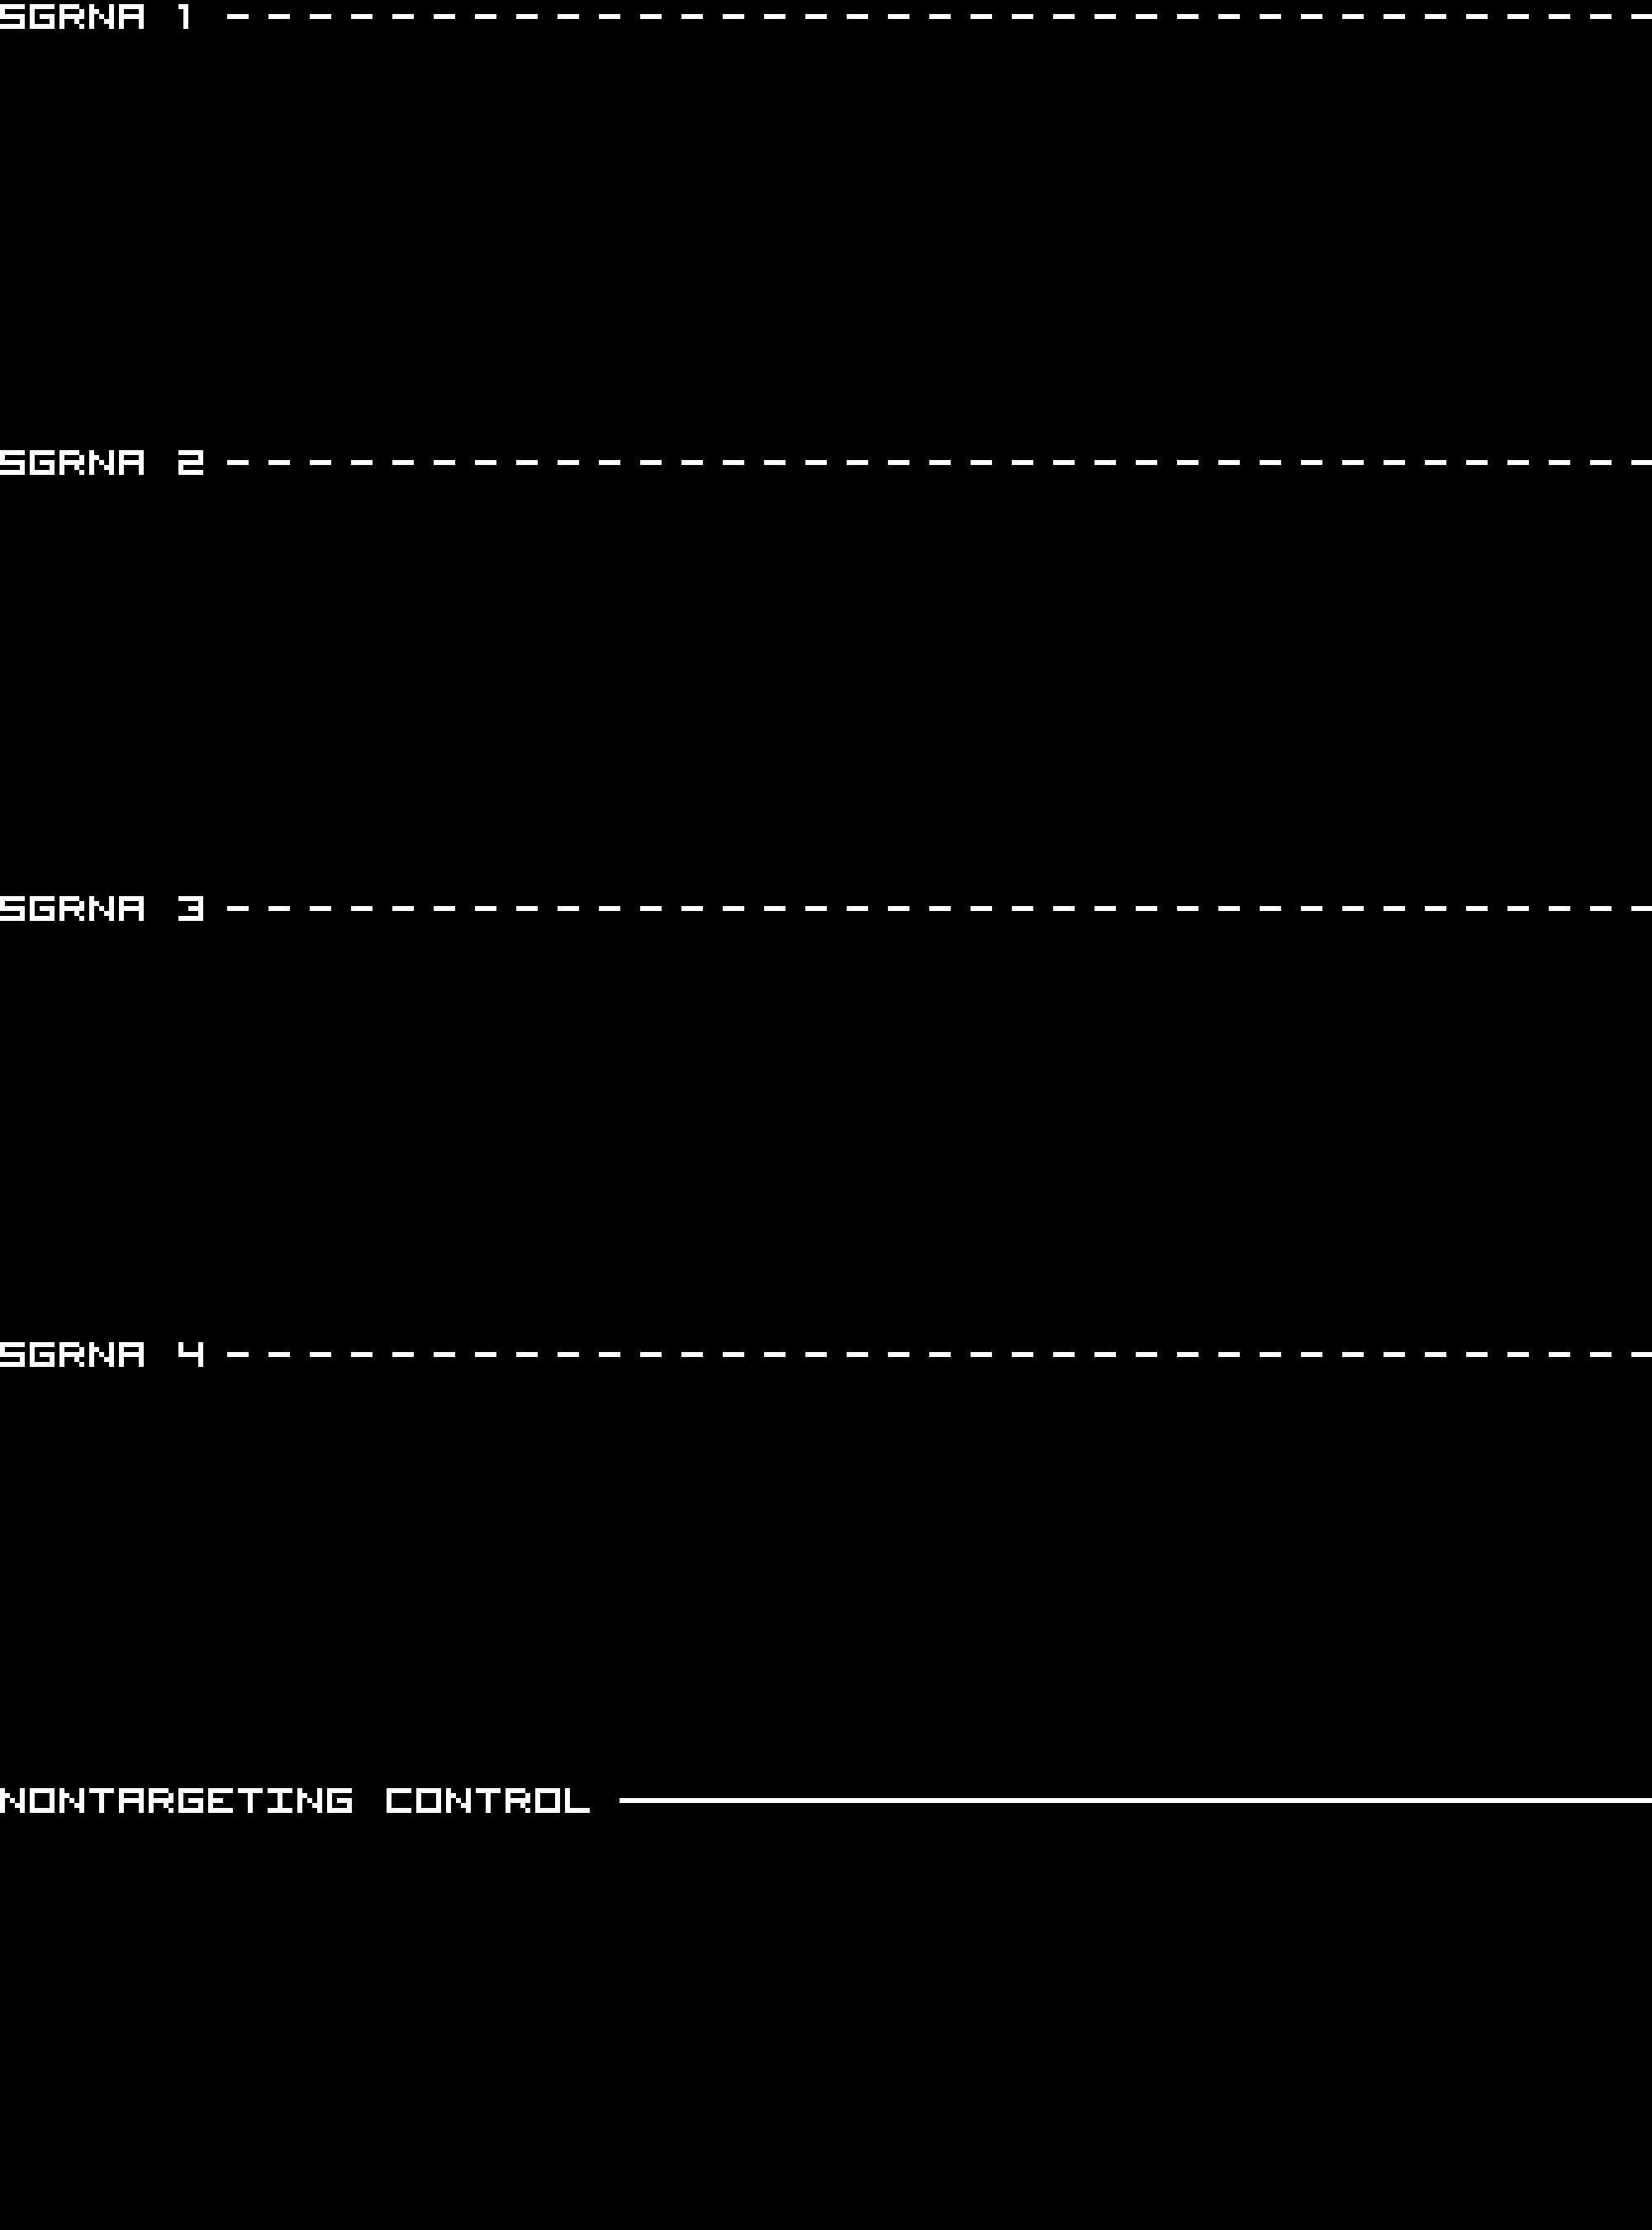
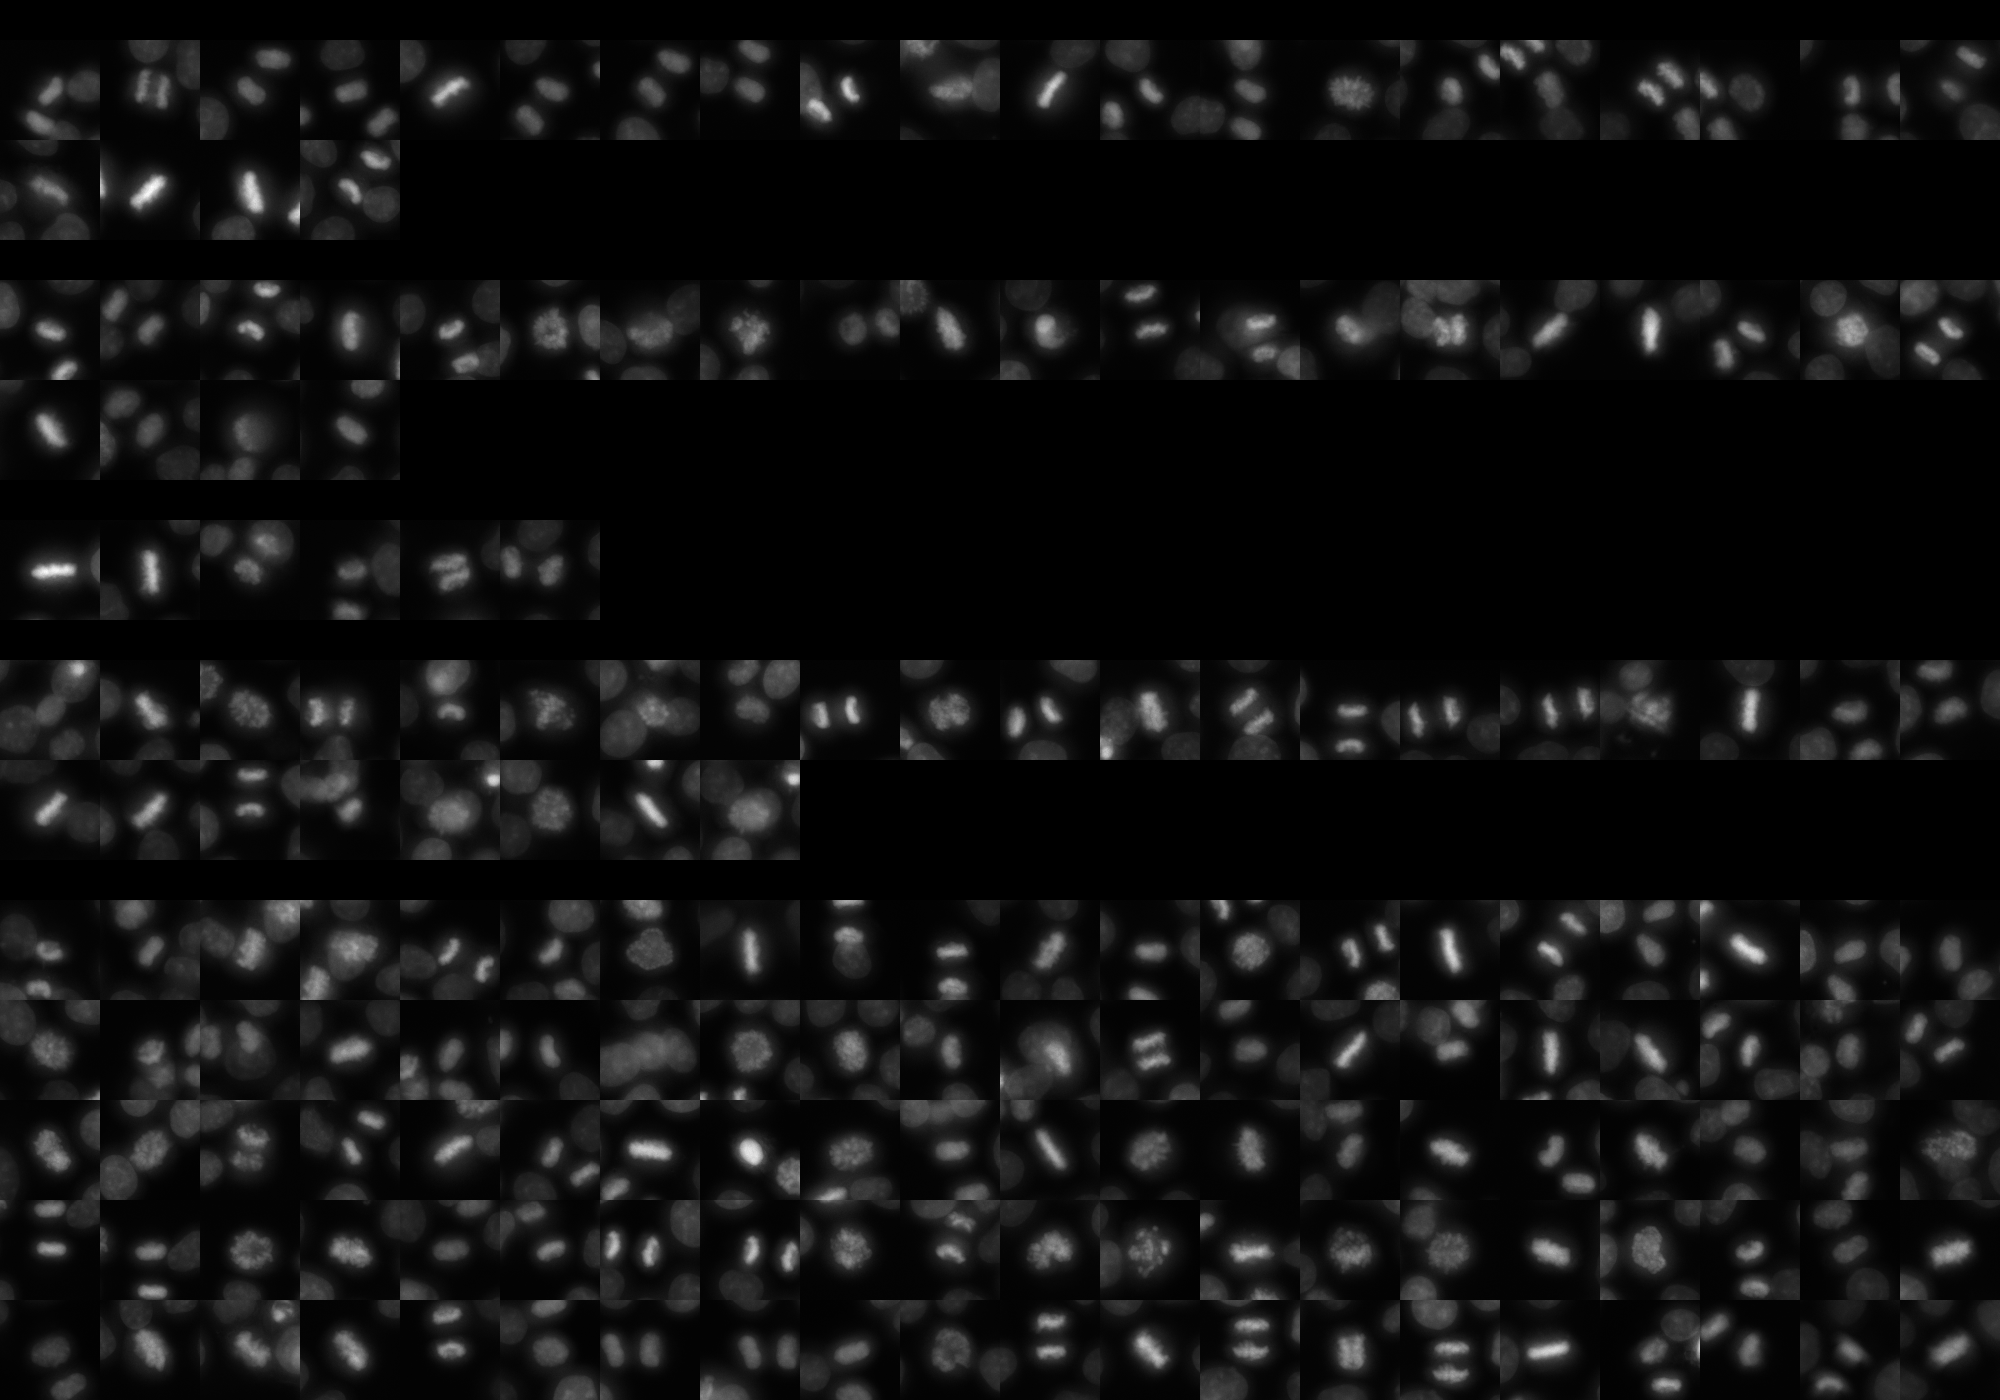
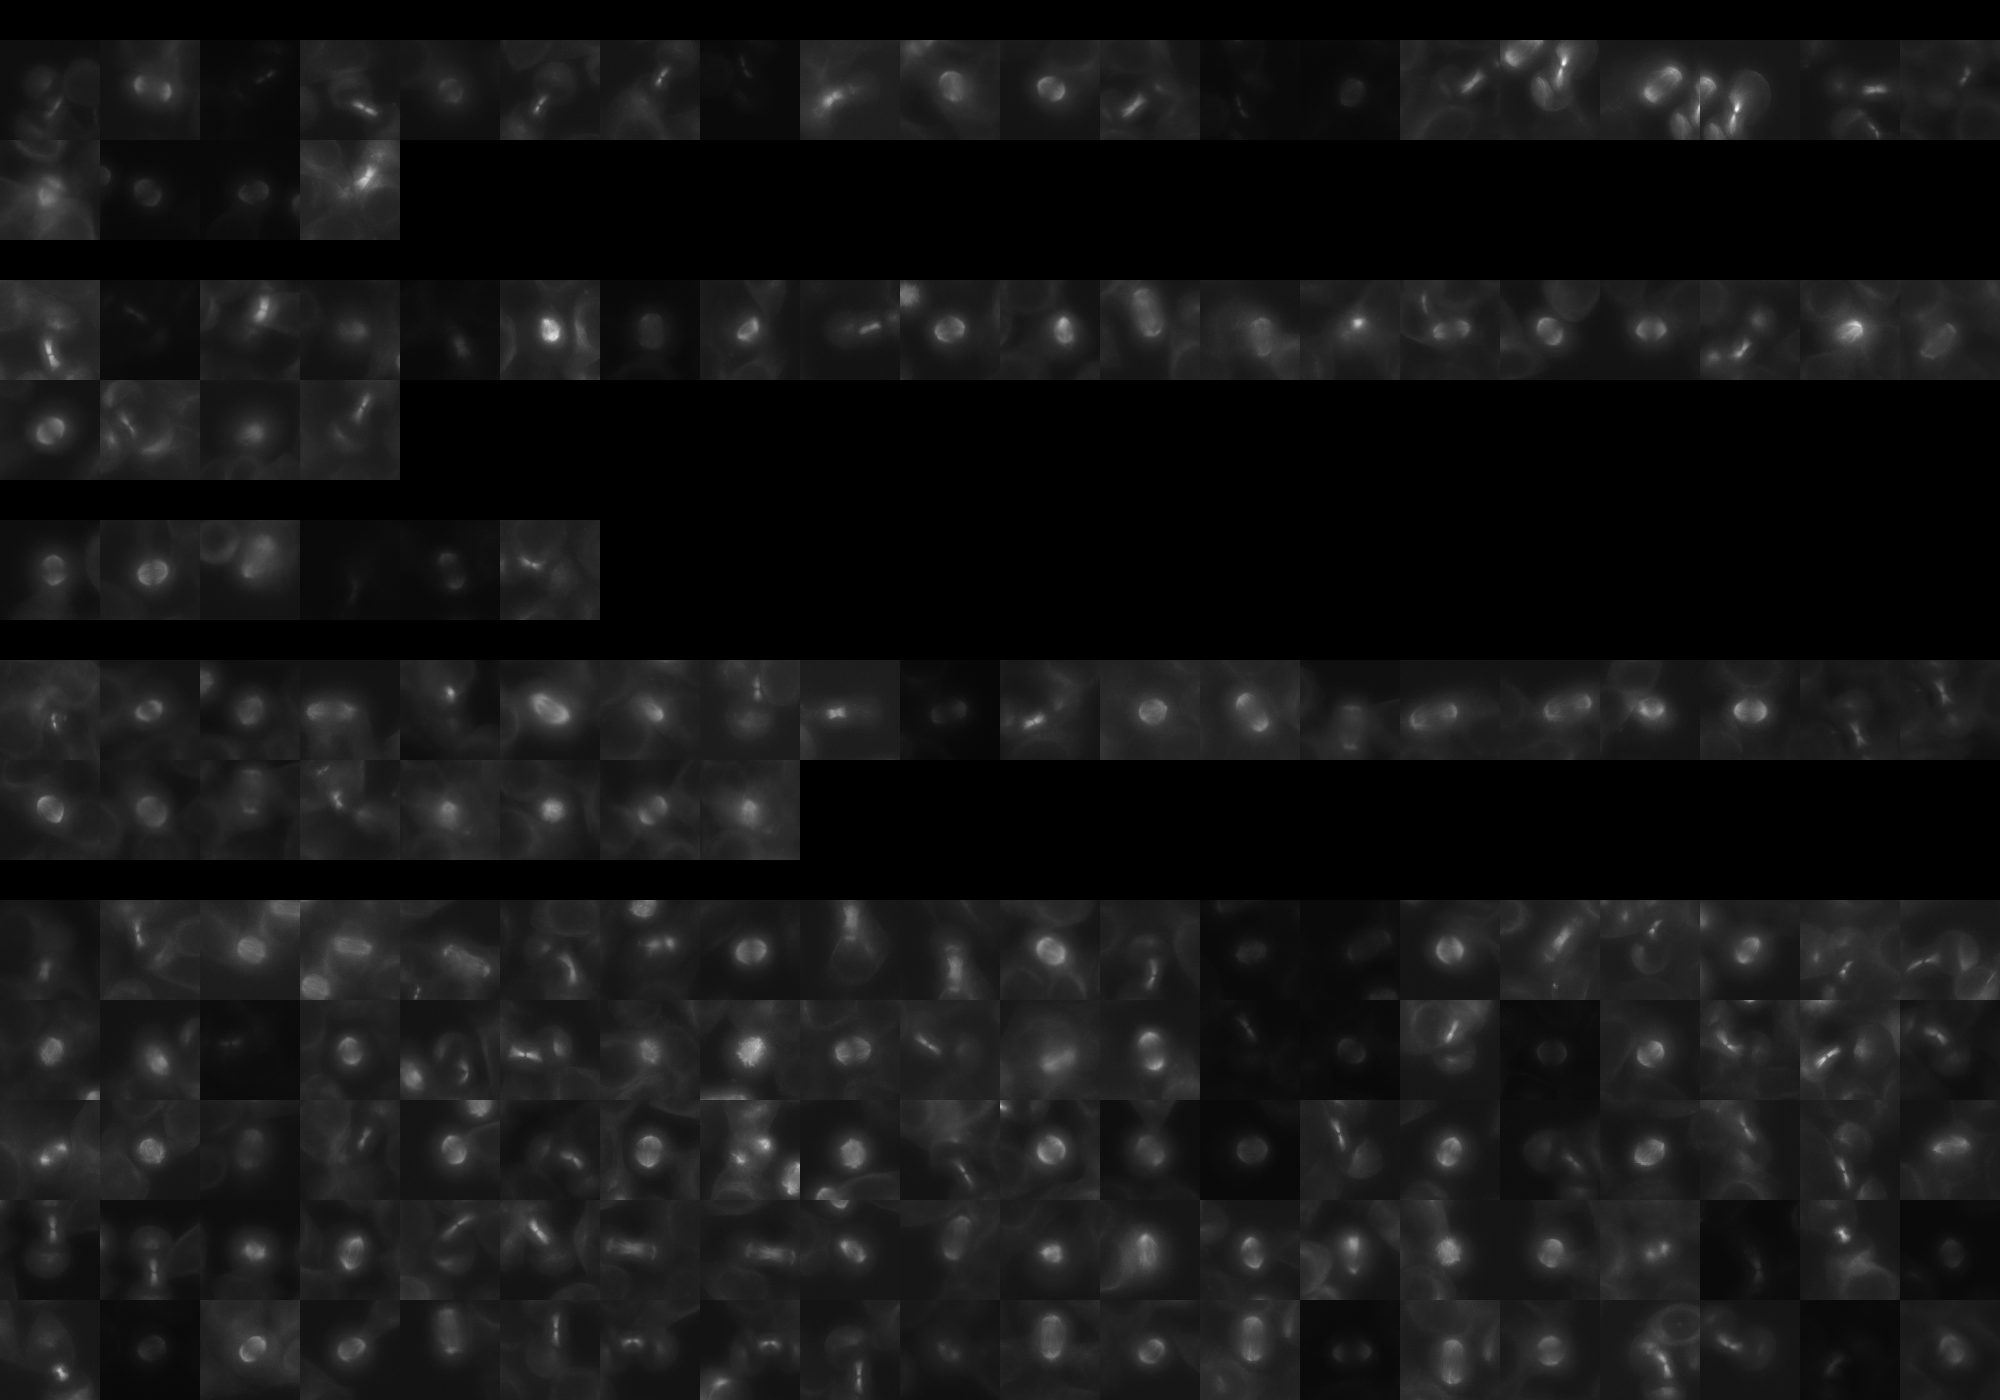
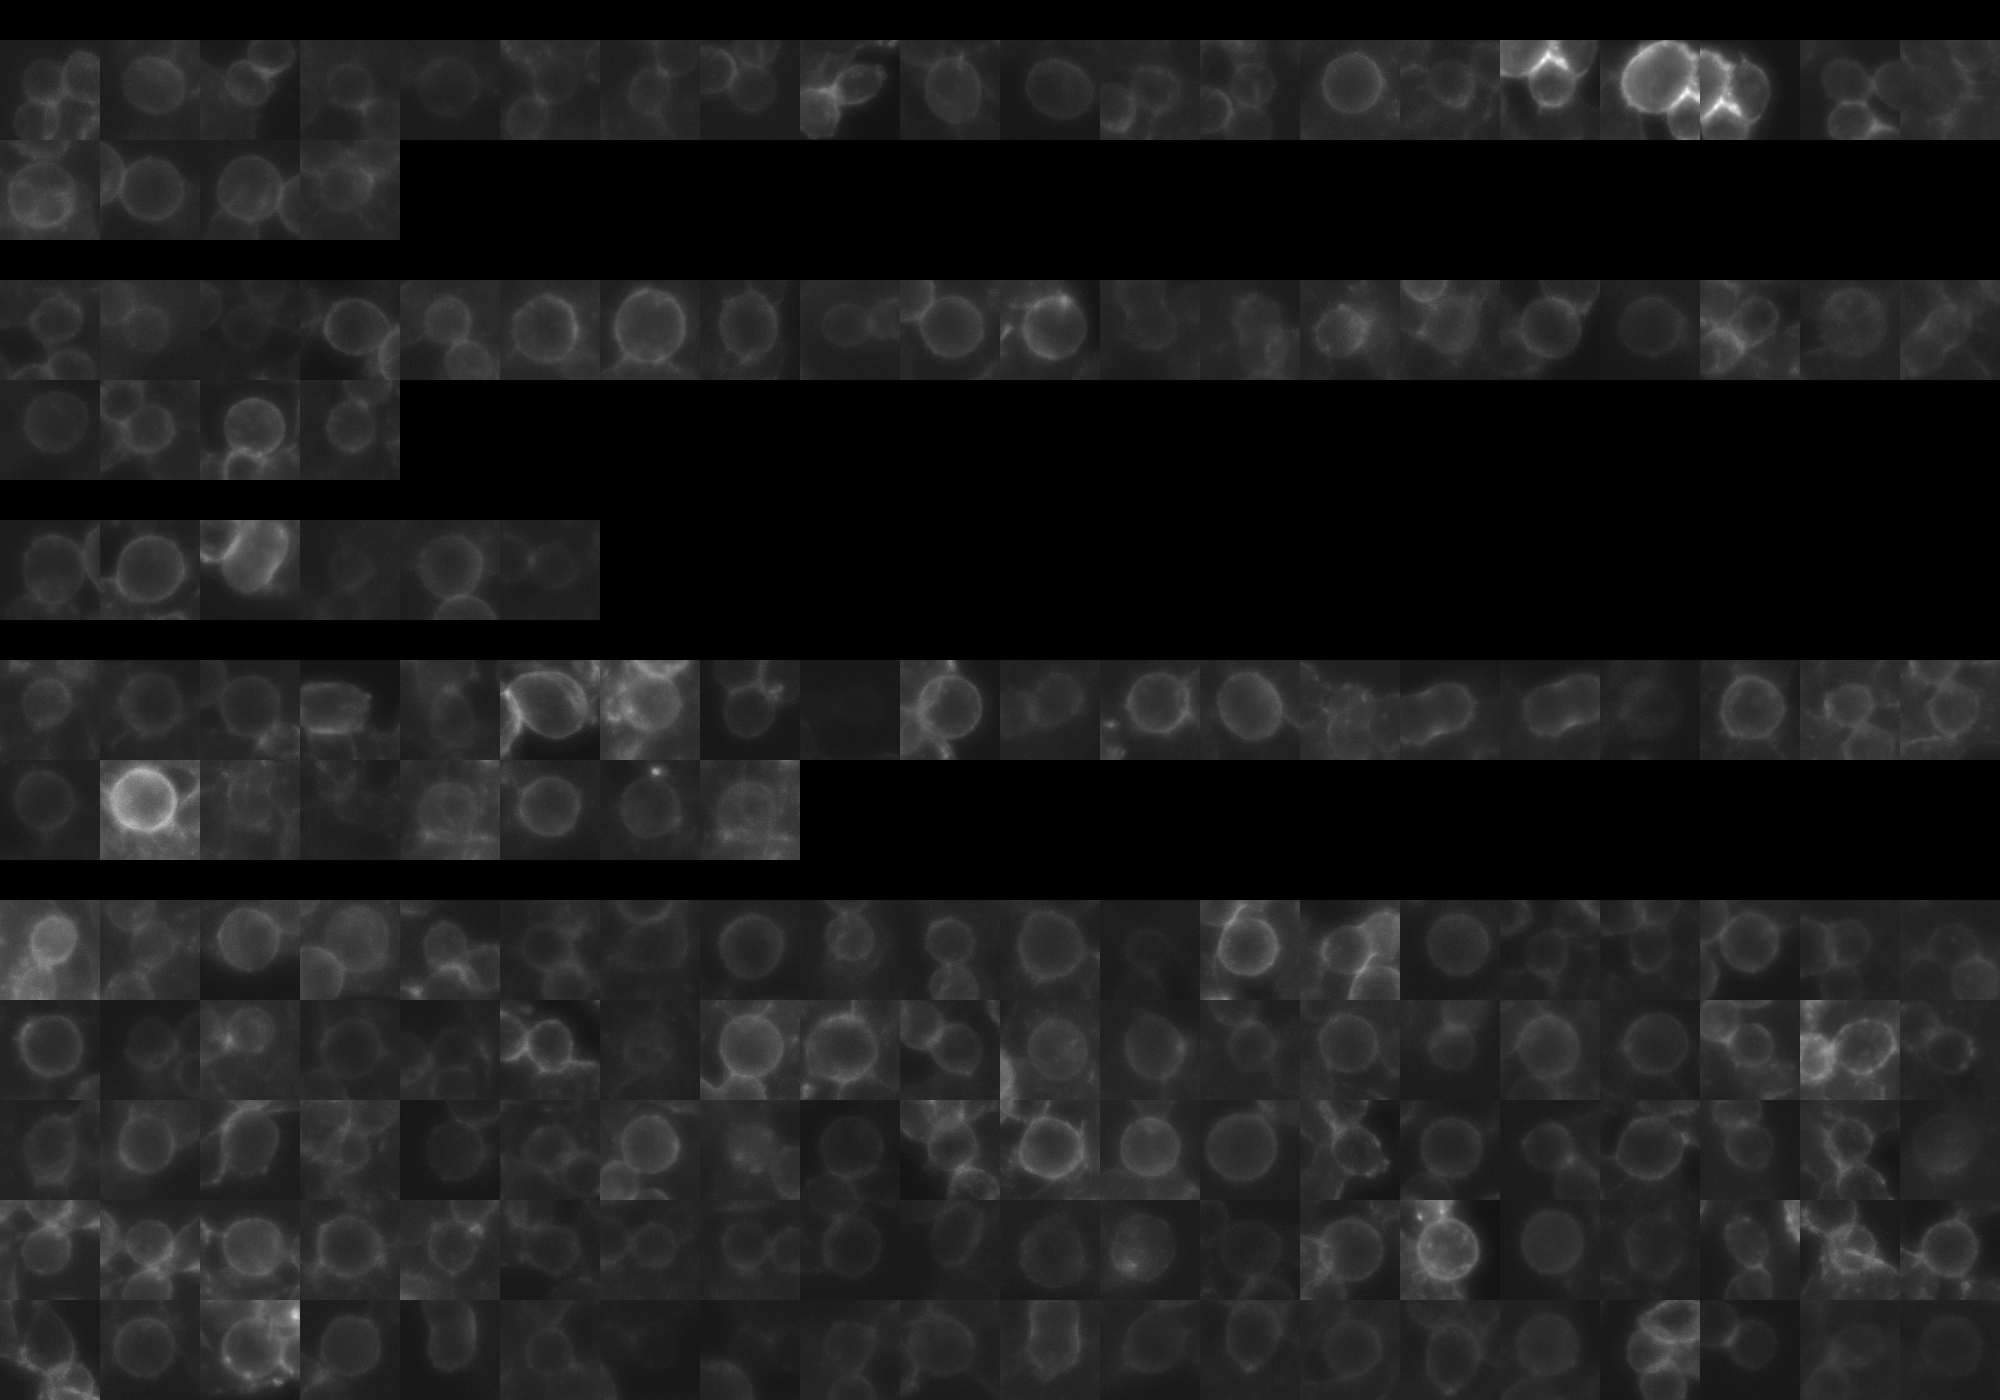
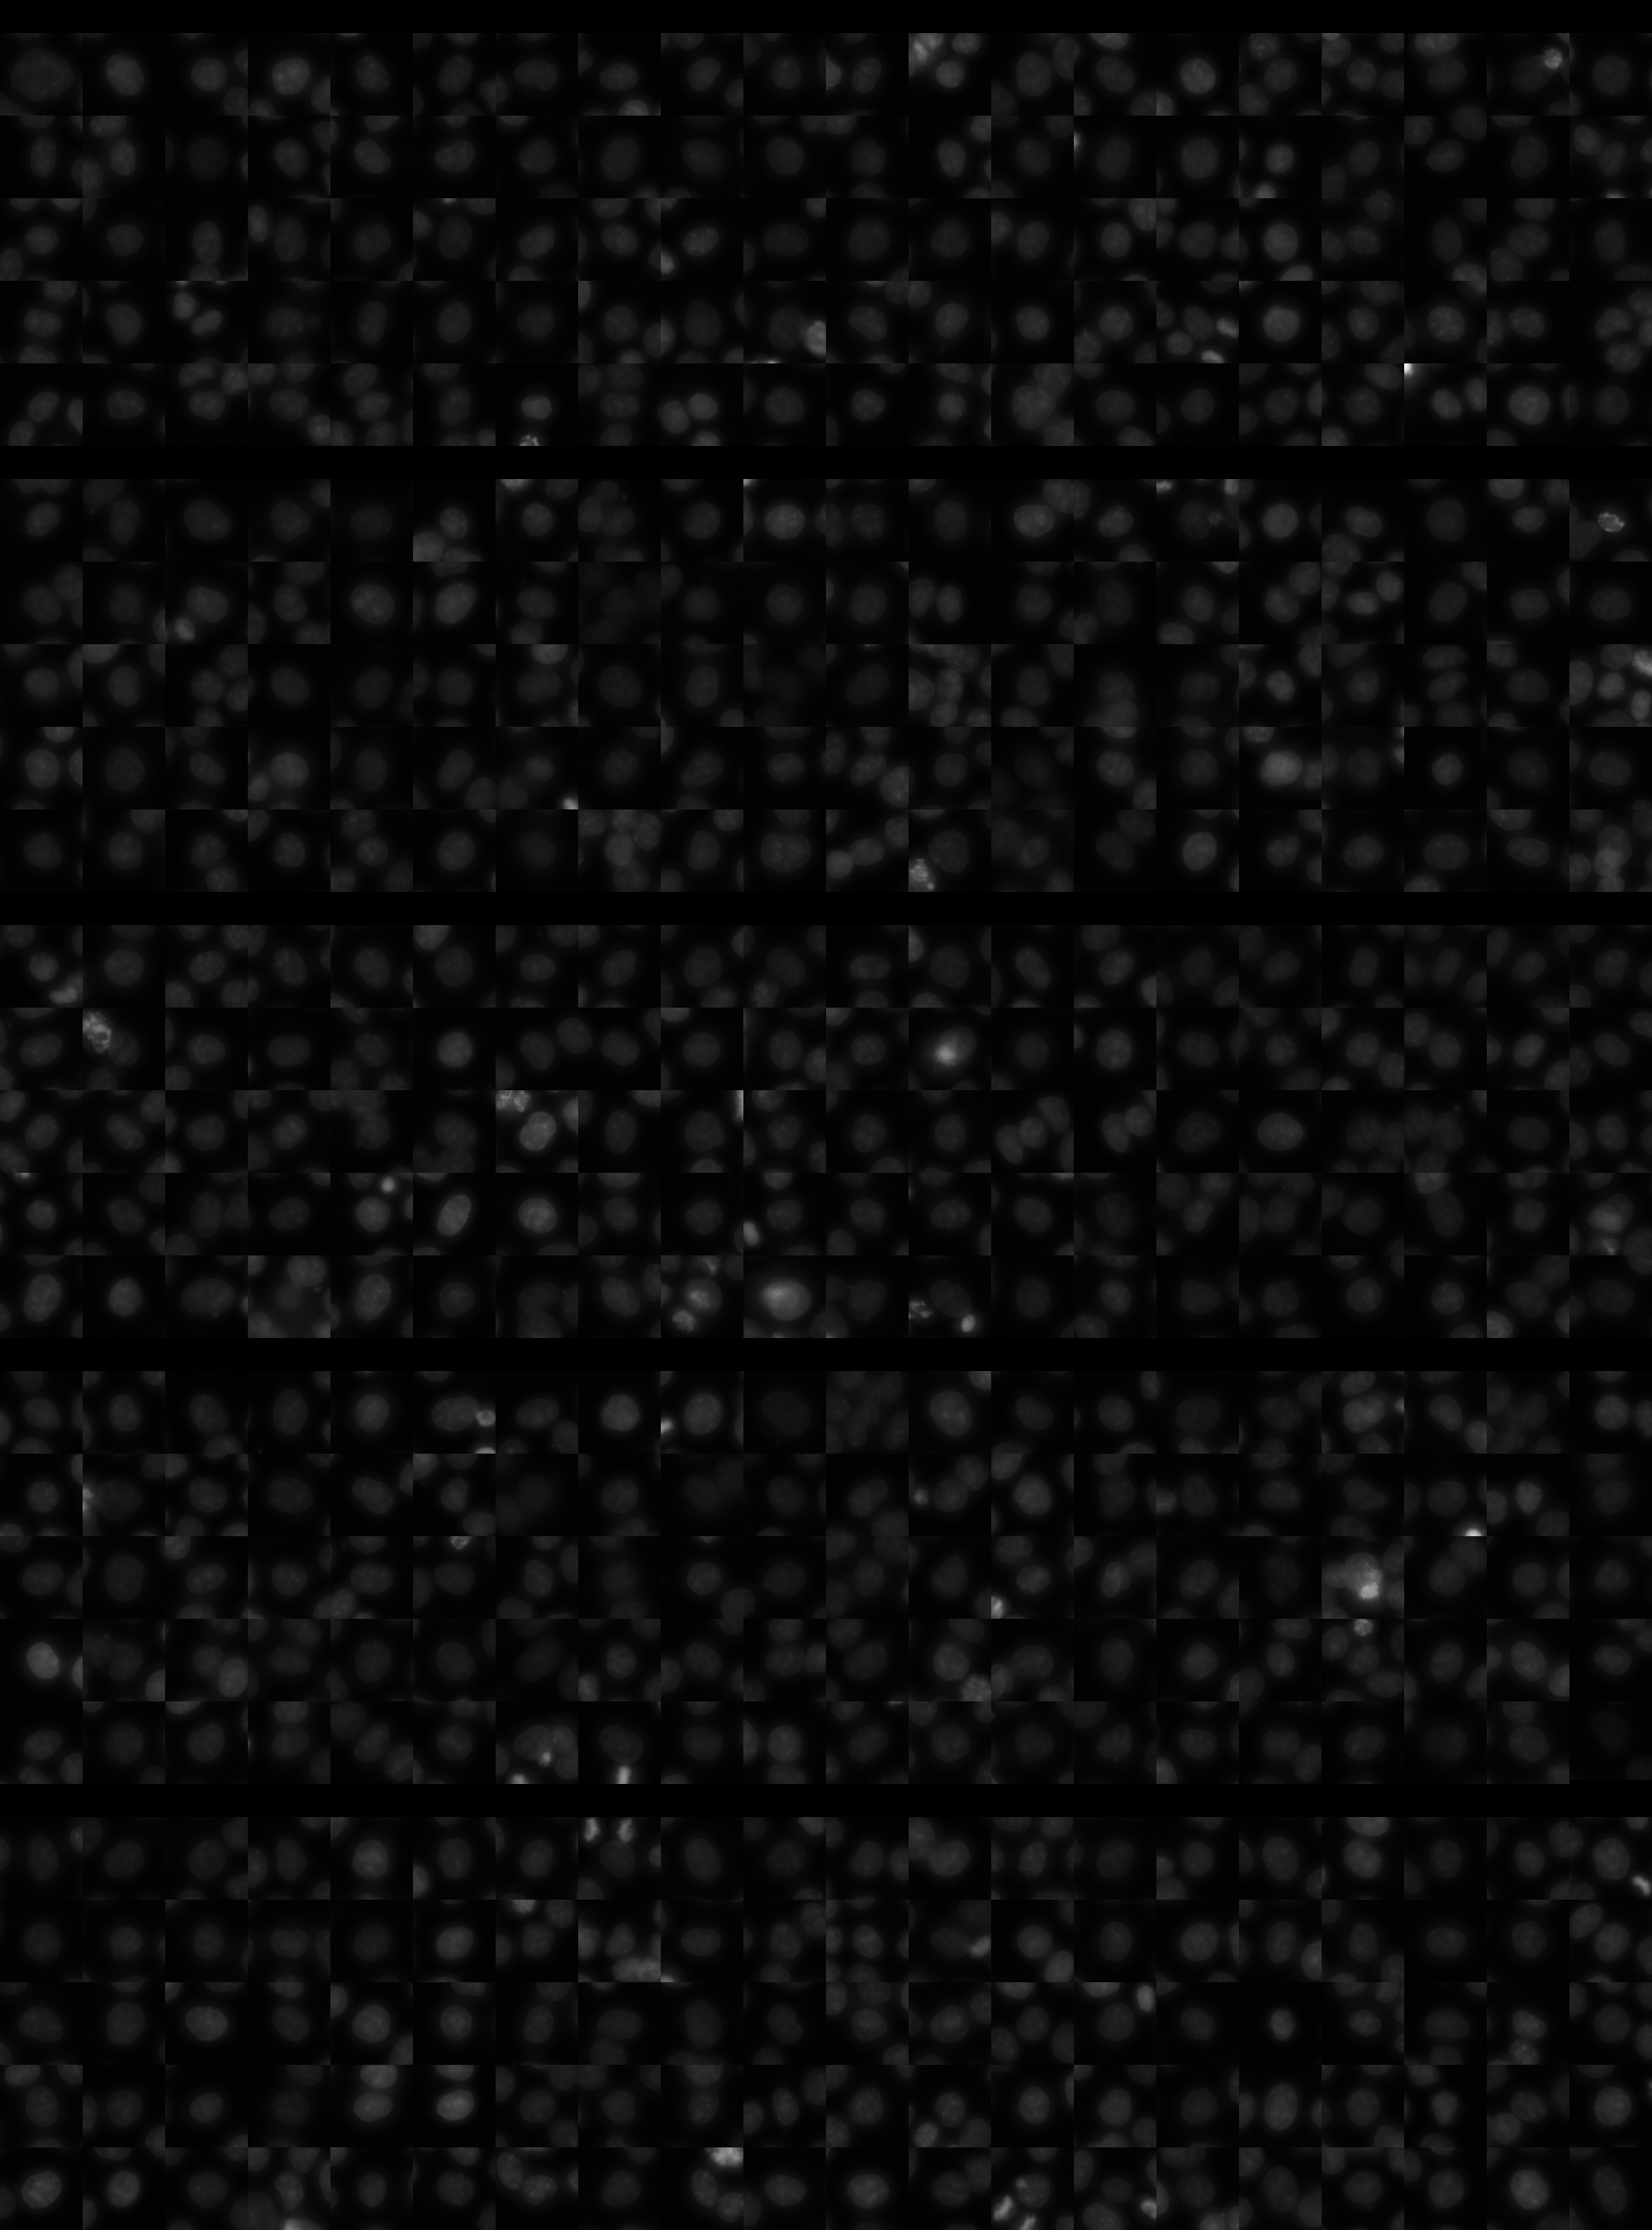
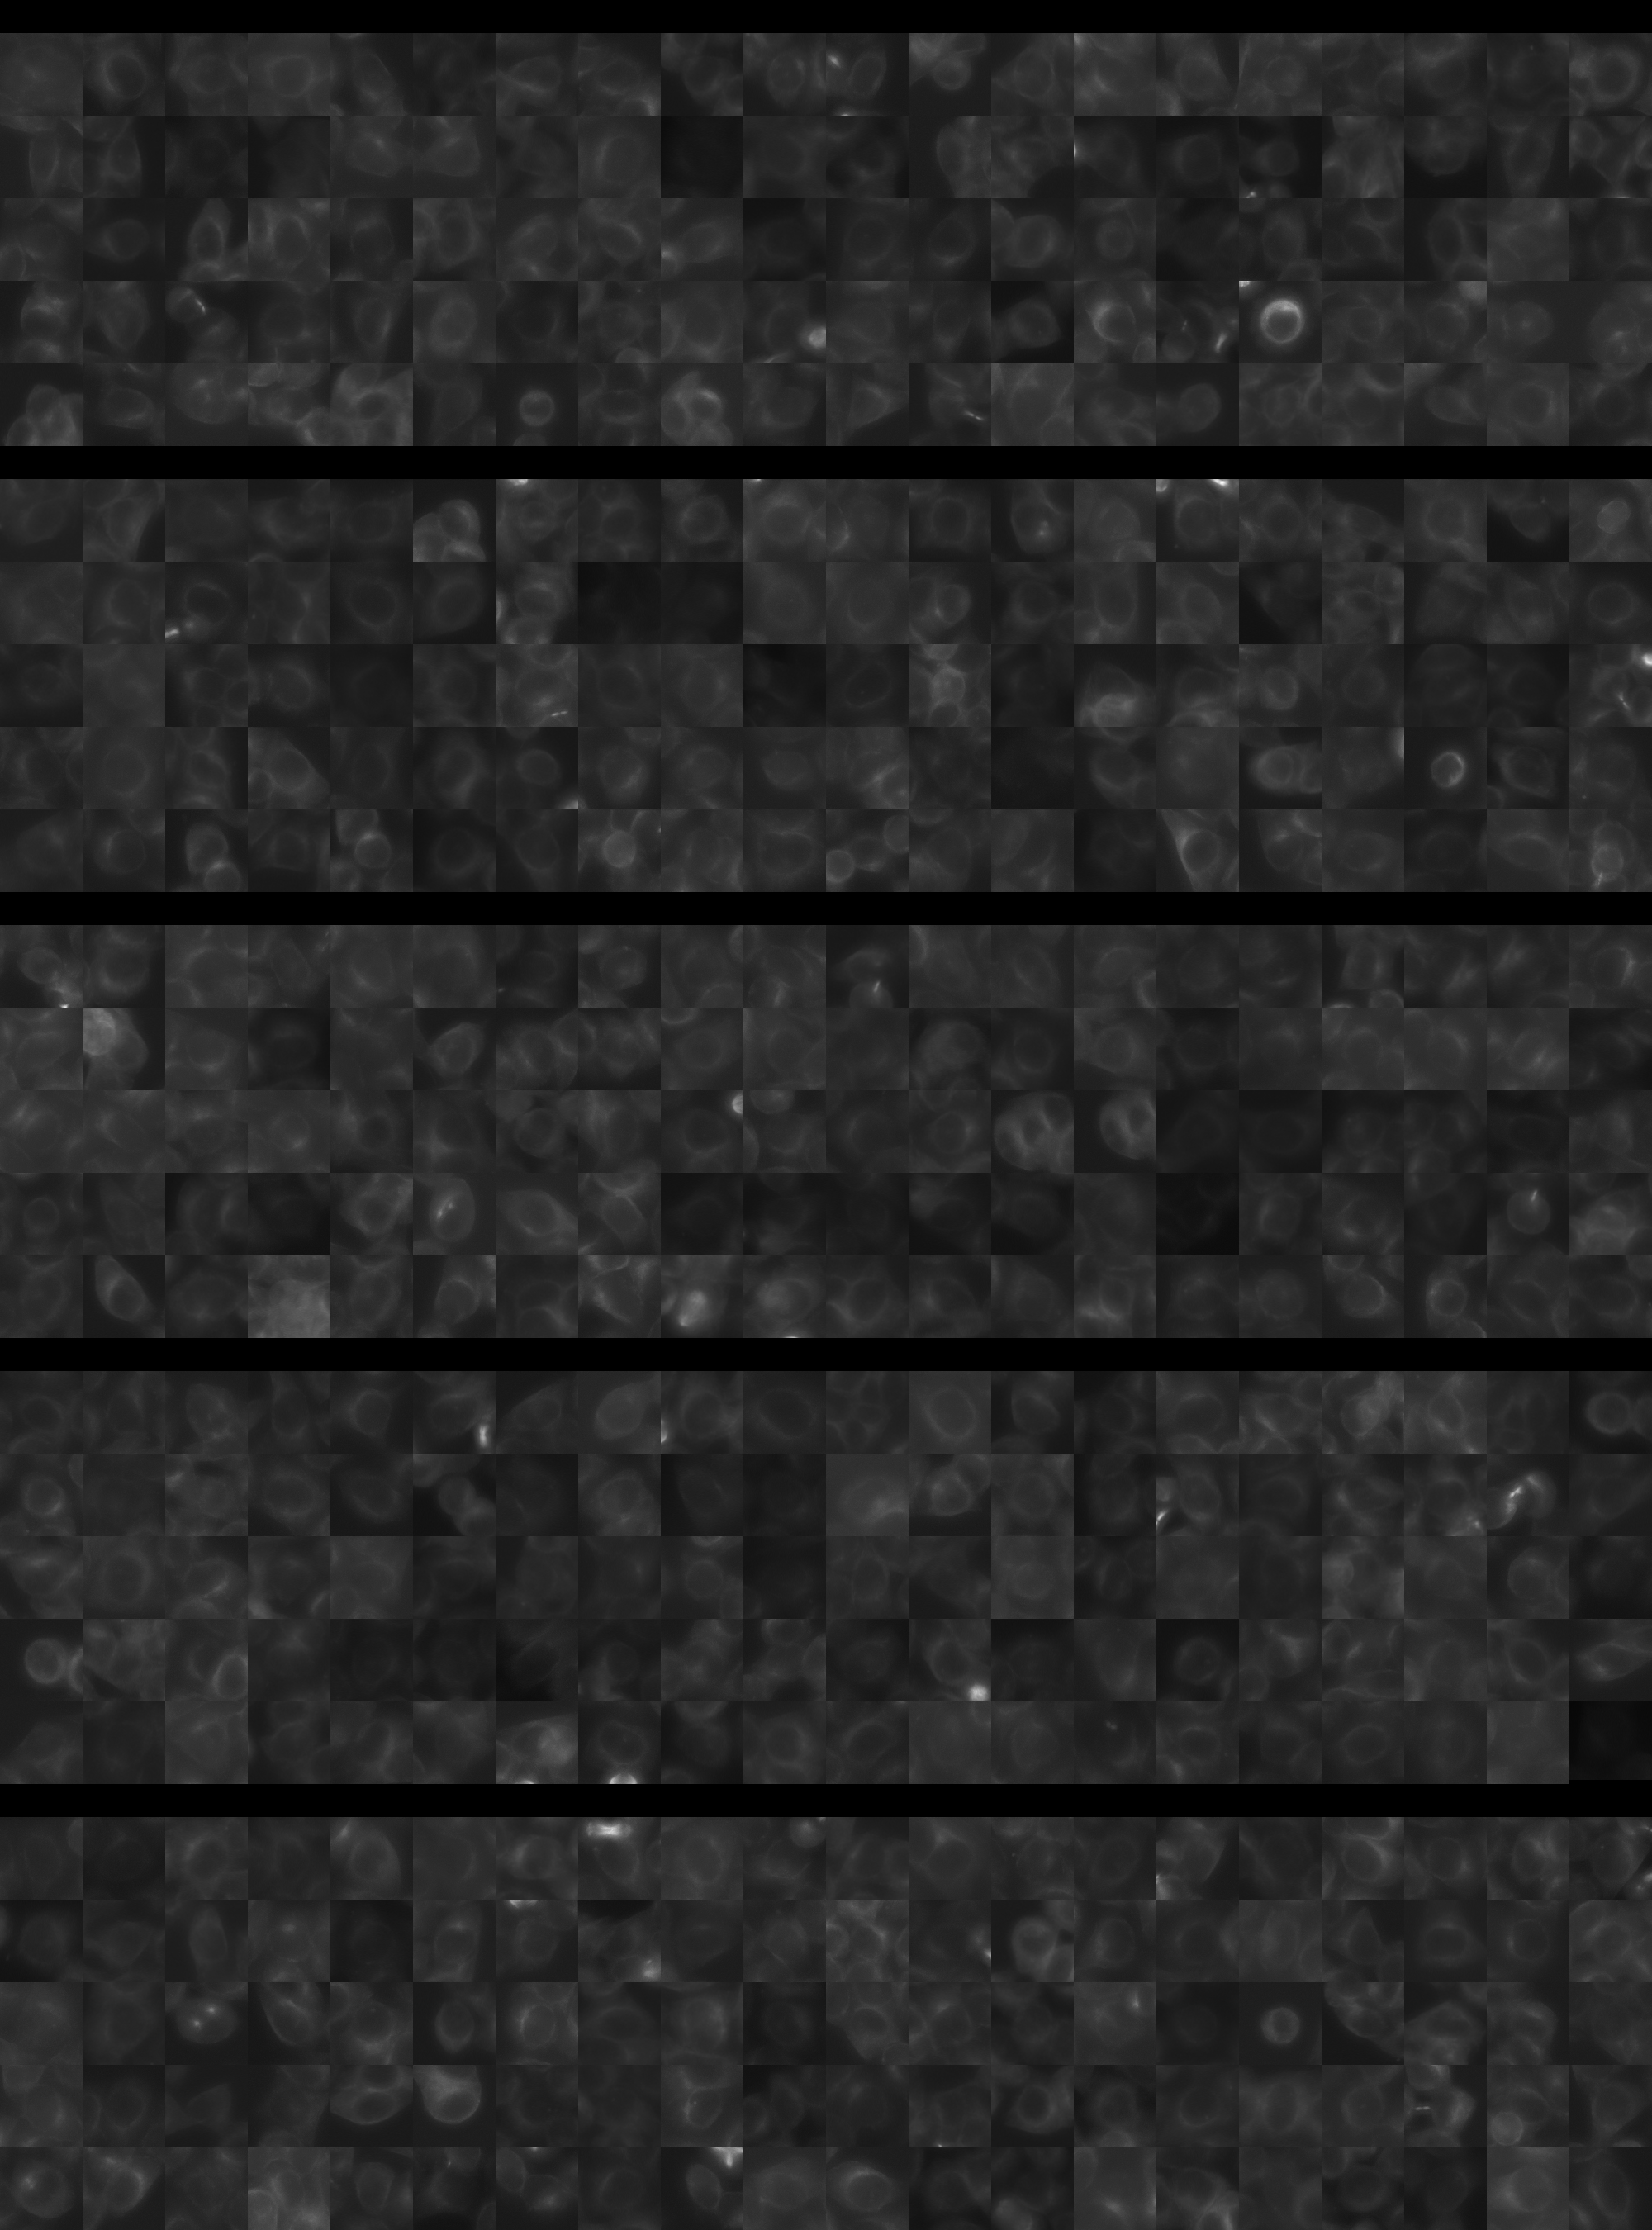
Each montage below shows randomly selected individual cell images for the same target gene separated by sgRNA, along with an example montage of cells expressing a non-targeting negative control sgRNA at the bottom. sgRNA labels in the montages correspond to the numbered sgRNA sequences in the gene info table above. The DNA (blue) and tubulin (green) channels are displayed by default, with gH2AX (grayscale) and actin (yellow) available using the check boxes. Channel brightness, contrast, and opacity are adjustable by clicking the arrow next to the channel name. When only one channel is selected, the display defaults to grayscale. Click the “Zoom” checkbox above the channel controls to enable image zooming (via scrolling) and panning (via click-and-drag).

The cell boxes displayed for this gene are square, 30.36 μm per side for the interphase montage and 30.36 μm per side for the mitotic montage.
Features

Interphase Score Rank FDR q-value
Nucleus DNA Integrated -9.487e-02 5236 of 5322 0.078
Nucleus DNA Mean -1.186e-01 4773 of 5322 0.019
Nucleus gH2AX Mean -6.223e-02 5112 of 5322 0.147
Nucleus DNA - gH2AX Correlation -1.817e-01 5021 of 5322 1.021e-04
Nucleus Shape Area -7.579e-03 3553 of 5322 0.853
Nucleus Shape Eccentricity 0.143 65 of 5322 0.002
Nucleus Shape Form Factor -1.098e-01 4563 of 5322 0.029
Nucleus Shape Solidity -9.991e-02 4273 of 5322 0.024
Cell DNA Mass Displacement 0.045 1374 of 5322 0.578
Cell Tubulin Mean -1.250e-01 5010 of 5322 0.018
Cell Tubulin Mass Displacement 0.008 2522 of 5322 0.941
Cell Actin Mean -1.504e-01 5124 of 5322 0.003
Cell Tubulin - Actin Correlation 0.041 1763 of 5322 0.505
Cell DNA - Tubulin Correlation -8.422e-02 5159 of 5322 0.060
Cell Shape Area -1.171e-01 4853 of 5322 0.014
Cell Shape Eccentricity 0.028 1563 of 5322 0.803
Mitotic Score Rank FDR q-value
Nucleus DNA Integrated -2.073e-01 5183 of 5322 0.930
Nucleus DNA Mean 0.019 2615 of 5322 1.000
Nucleus DNA Mass Displacement 0.108 1795 of 5322 0.999
Nucleus DNA Mean Frac 3 -5.817e-03 3217 of 5322 1.000
Nucleus gH2AX Mean -3.597e-01 5243 of 5322 1.000
Nucleus gH2AX Mean Frac 0 -1.696e-01 4565 of 5322 1.000
Nucleus Tubulin Mean Frac 0 -1.204e-01 4813 of 5322 0.999
Nucleus Tubulin Mean Edge 0.218 680 of 5322 0.999
Nucleus Tubulin Std Edge -1.146e-01 4041 of 5322 0.999
Nucleus Shape Area -1.235e-01 4914 of 5322 0.989
Nucleus Shape Eccentricity -5.341e-01 5227 of 5322 1.000
Nucleus Shape Form Factor -1.234e-01 3193 of 5322 0.998
Cell Tubulin Mean -7.078e-02 4328 of 5322 0.997
Cell Tubulin Mean Frac 3 0.187 289 of 5322 0.999
Cell Actin Mean -1.433e-01 4757 of 5322 0.997
Cell Shape Area -2.237e-01 5192 of 5322 0.994
( Reset Zoom )
Brightness
Contrast
Opacity
Brightness
Contrast
Opacity
Brightness
Contrast
Opacity
Brightness
Contrast
Opacity
Brightness
Contrast
Opacity

( Reset Zoom )
Brightness
Contrast
Opacity
Brightness
Contrast
Opacity
Brightness
Contrast
Opacity
Brightness
Contrast
Opacity
Brightness
Contrast
Opacity

MIT Central Accessability