CACNA1S

Gene symbol: CACNA1S
Gene: 779
Uniprot Function: Pore-forming, alpha-1S subunit of the voltage-gated calcium channel that gives rise to L-type calcium currents in skeletal muscle. Calcium channels containing the alpha-1S subunit play an important role in excitation-contraction coupling in skeletal muscle via their interaction with RYR1, which triggers Ca(2+) release from the sarcplasmic reticulum and ultimately results in muscle contraction. Long-lasting (L-type) calcium channels belong to the 'high-voltage activated' (HVA) group.
Mitotic Index 0.0248
Interphase Cluster: #194 (12 genes)
Mitotic Cluster: #79 (26 genes)
sgRNA 1: GAGGGCCTTGACATCCAAGC (interphase cells: 3379, mitotic cells: 80)
sgRNA 2: GGAAGTCAAACACATTCCAG (interphase cells: 1250, mitotic cells: 27)
sgRNA 3: GGGCCAATCTTACCAGGCCG (interphase cells: 227, mitotic cells: 3)
sgRNA 4: GTAGGCAATGATCTTCATGG (interphase cells: 2537, mitotic cells: 78)

Interphase Cluster

Mitotic Cluster

Overview

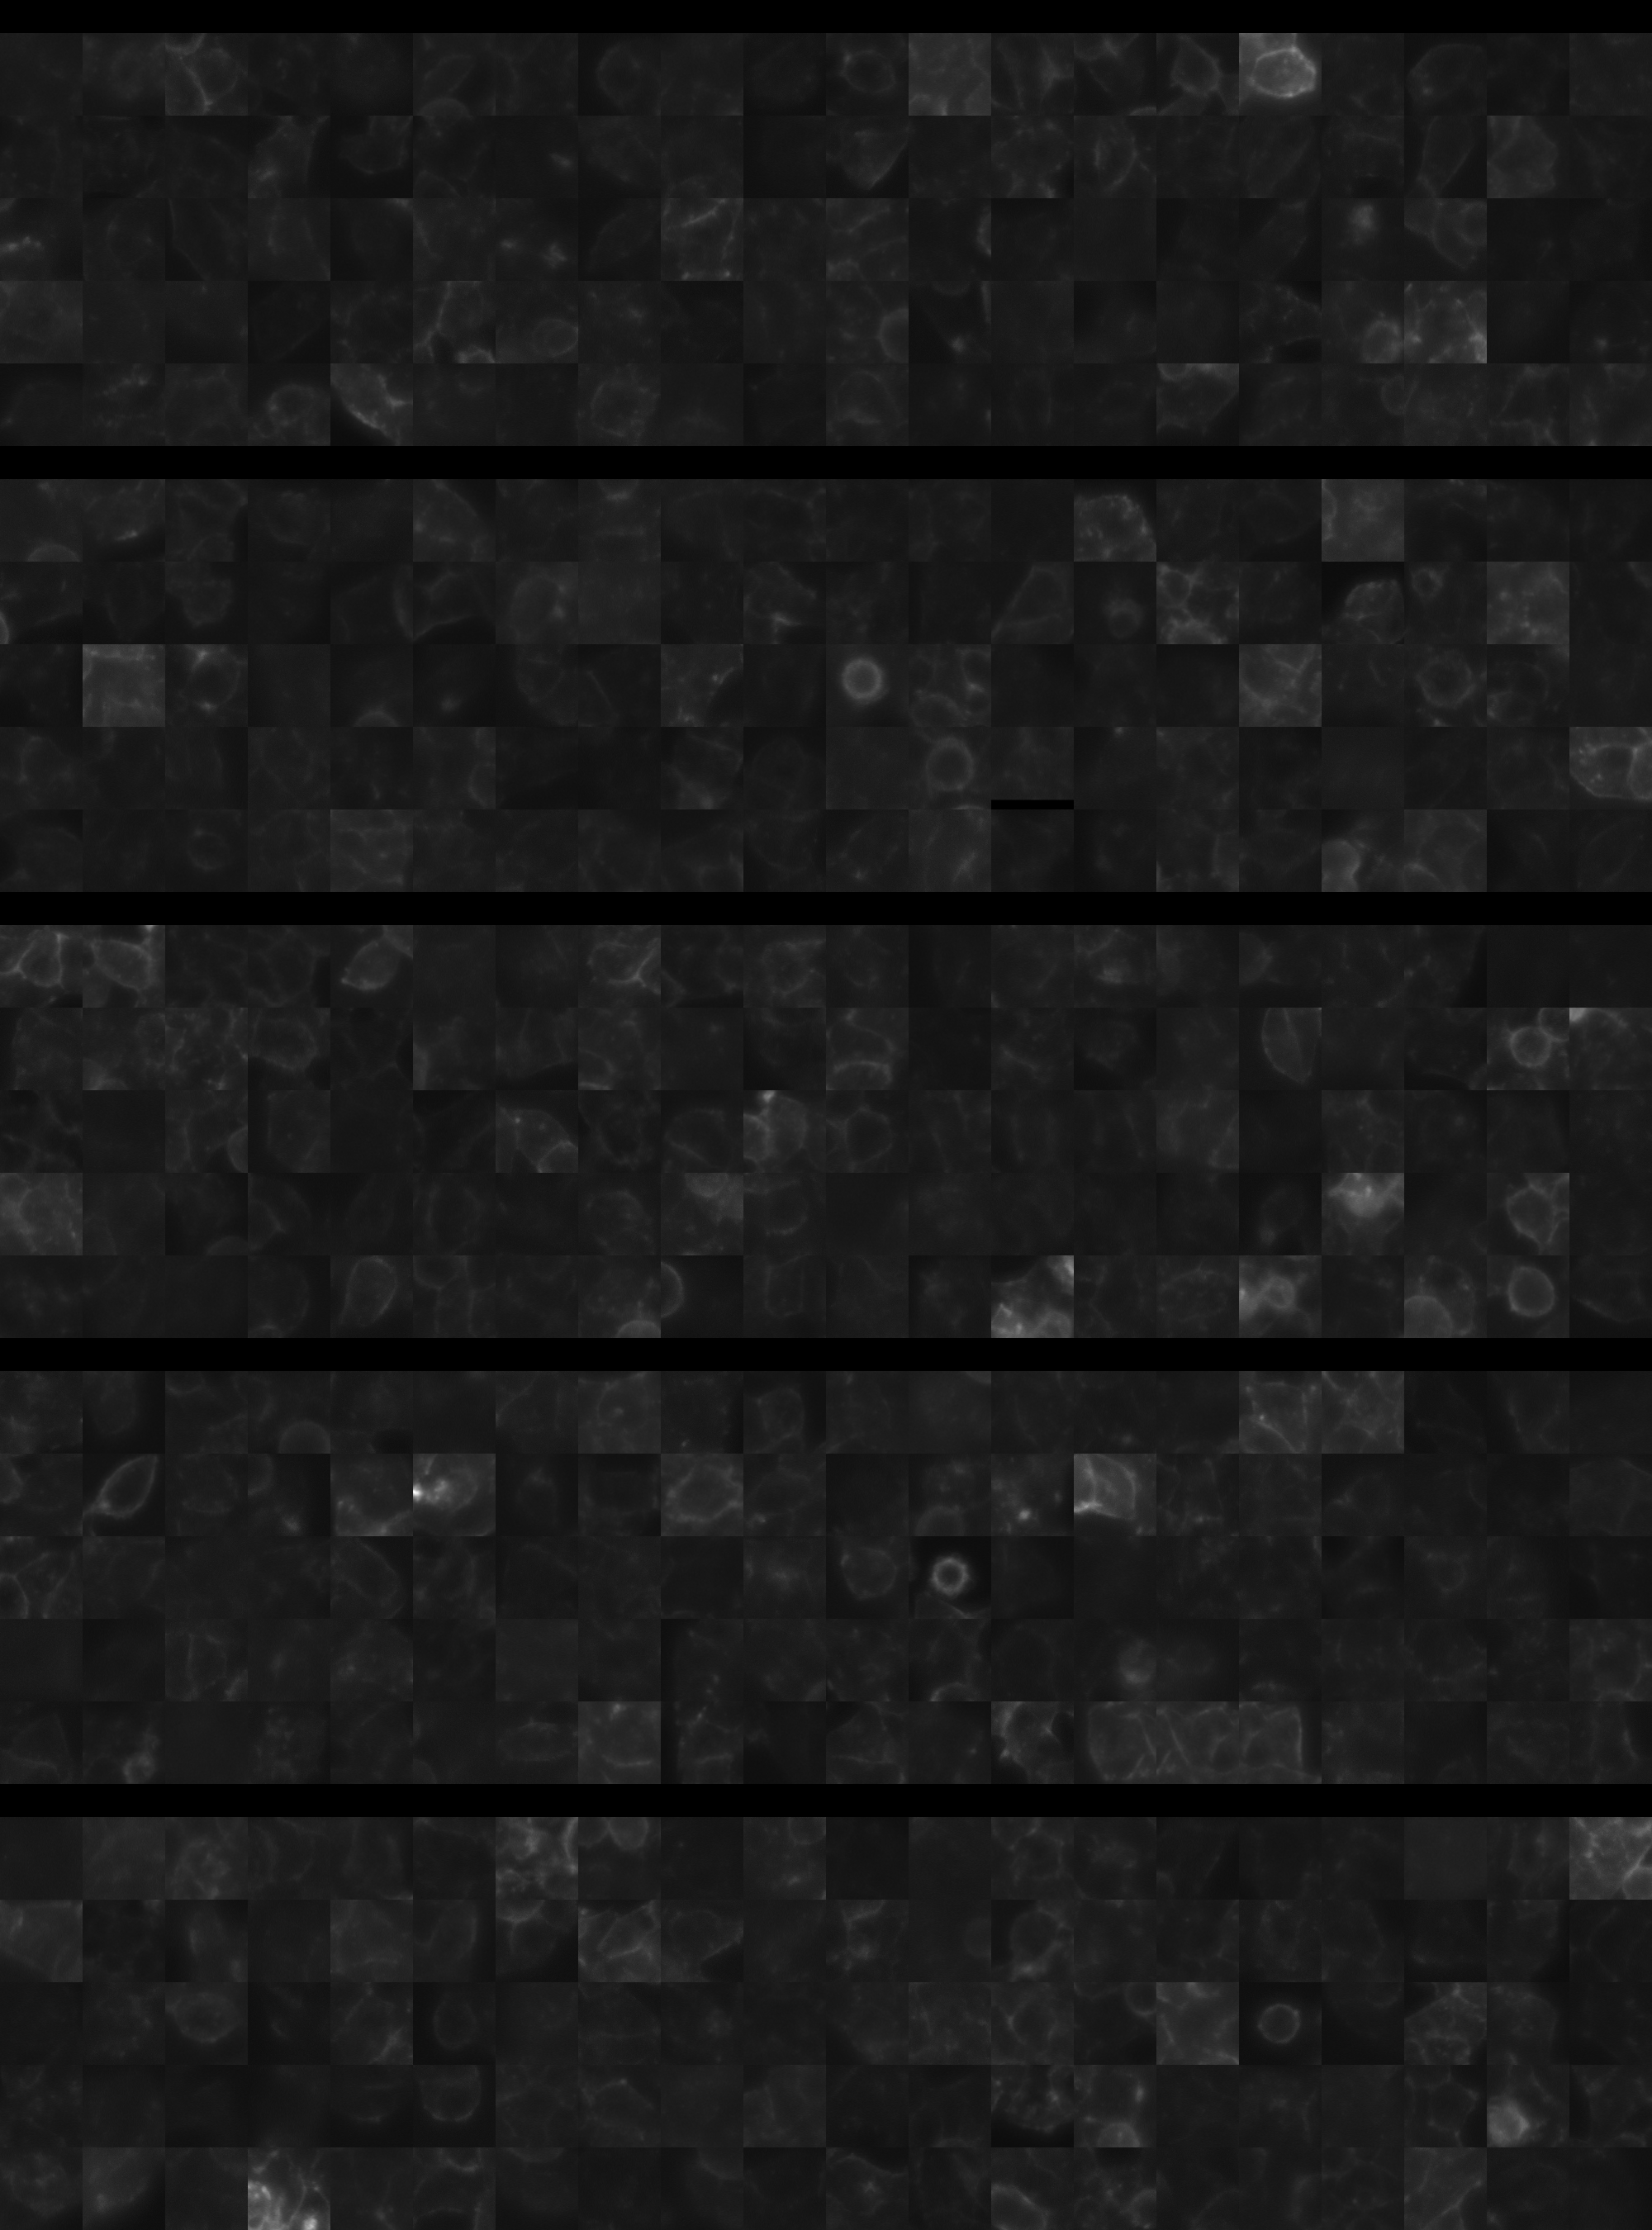
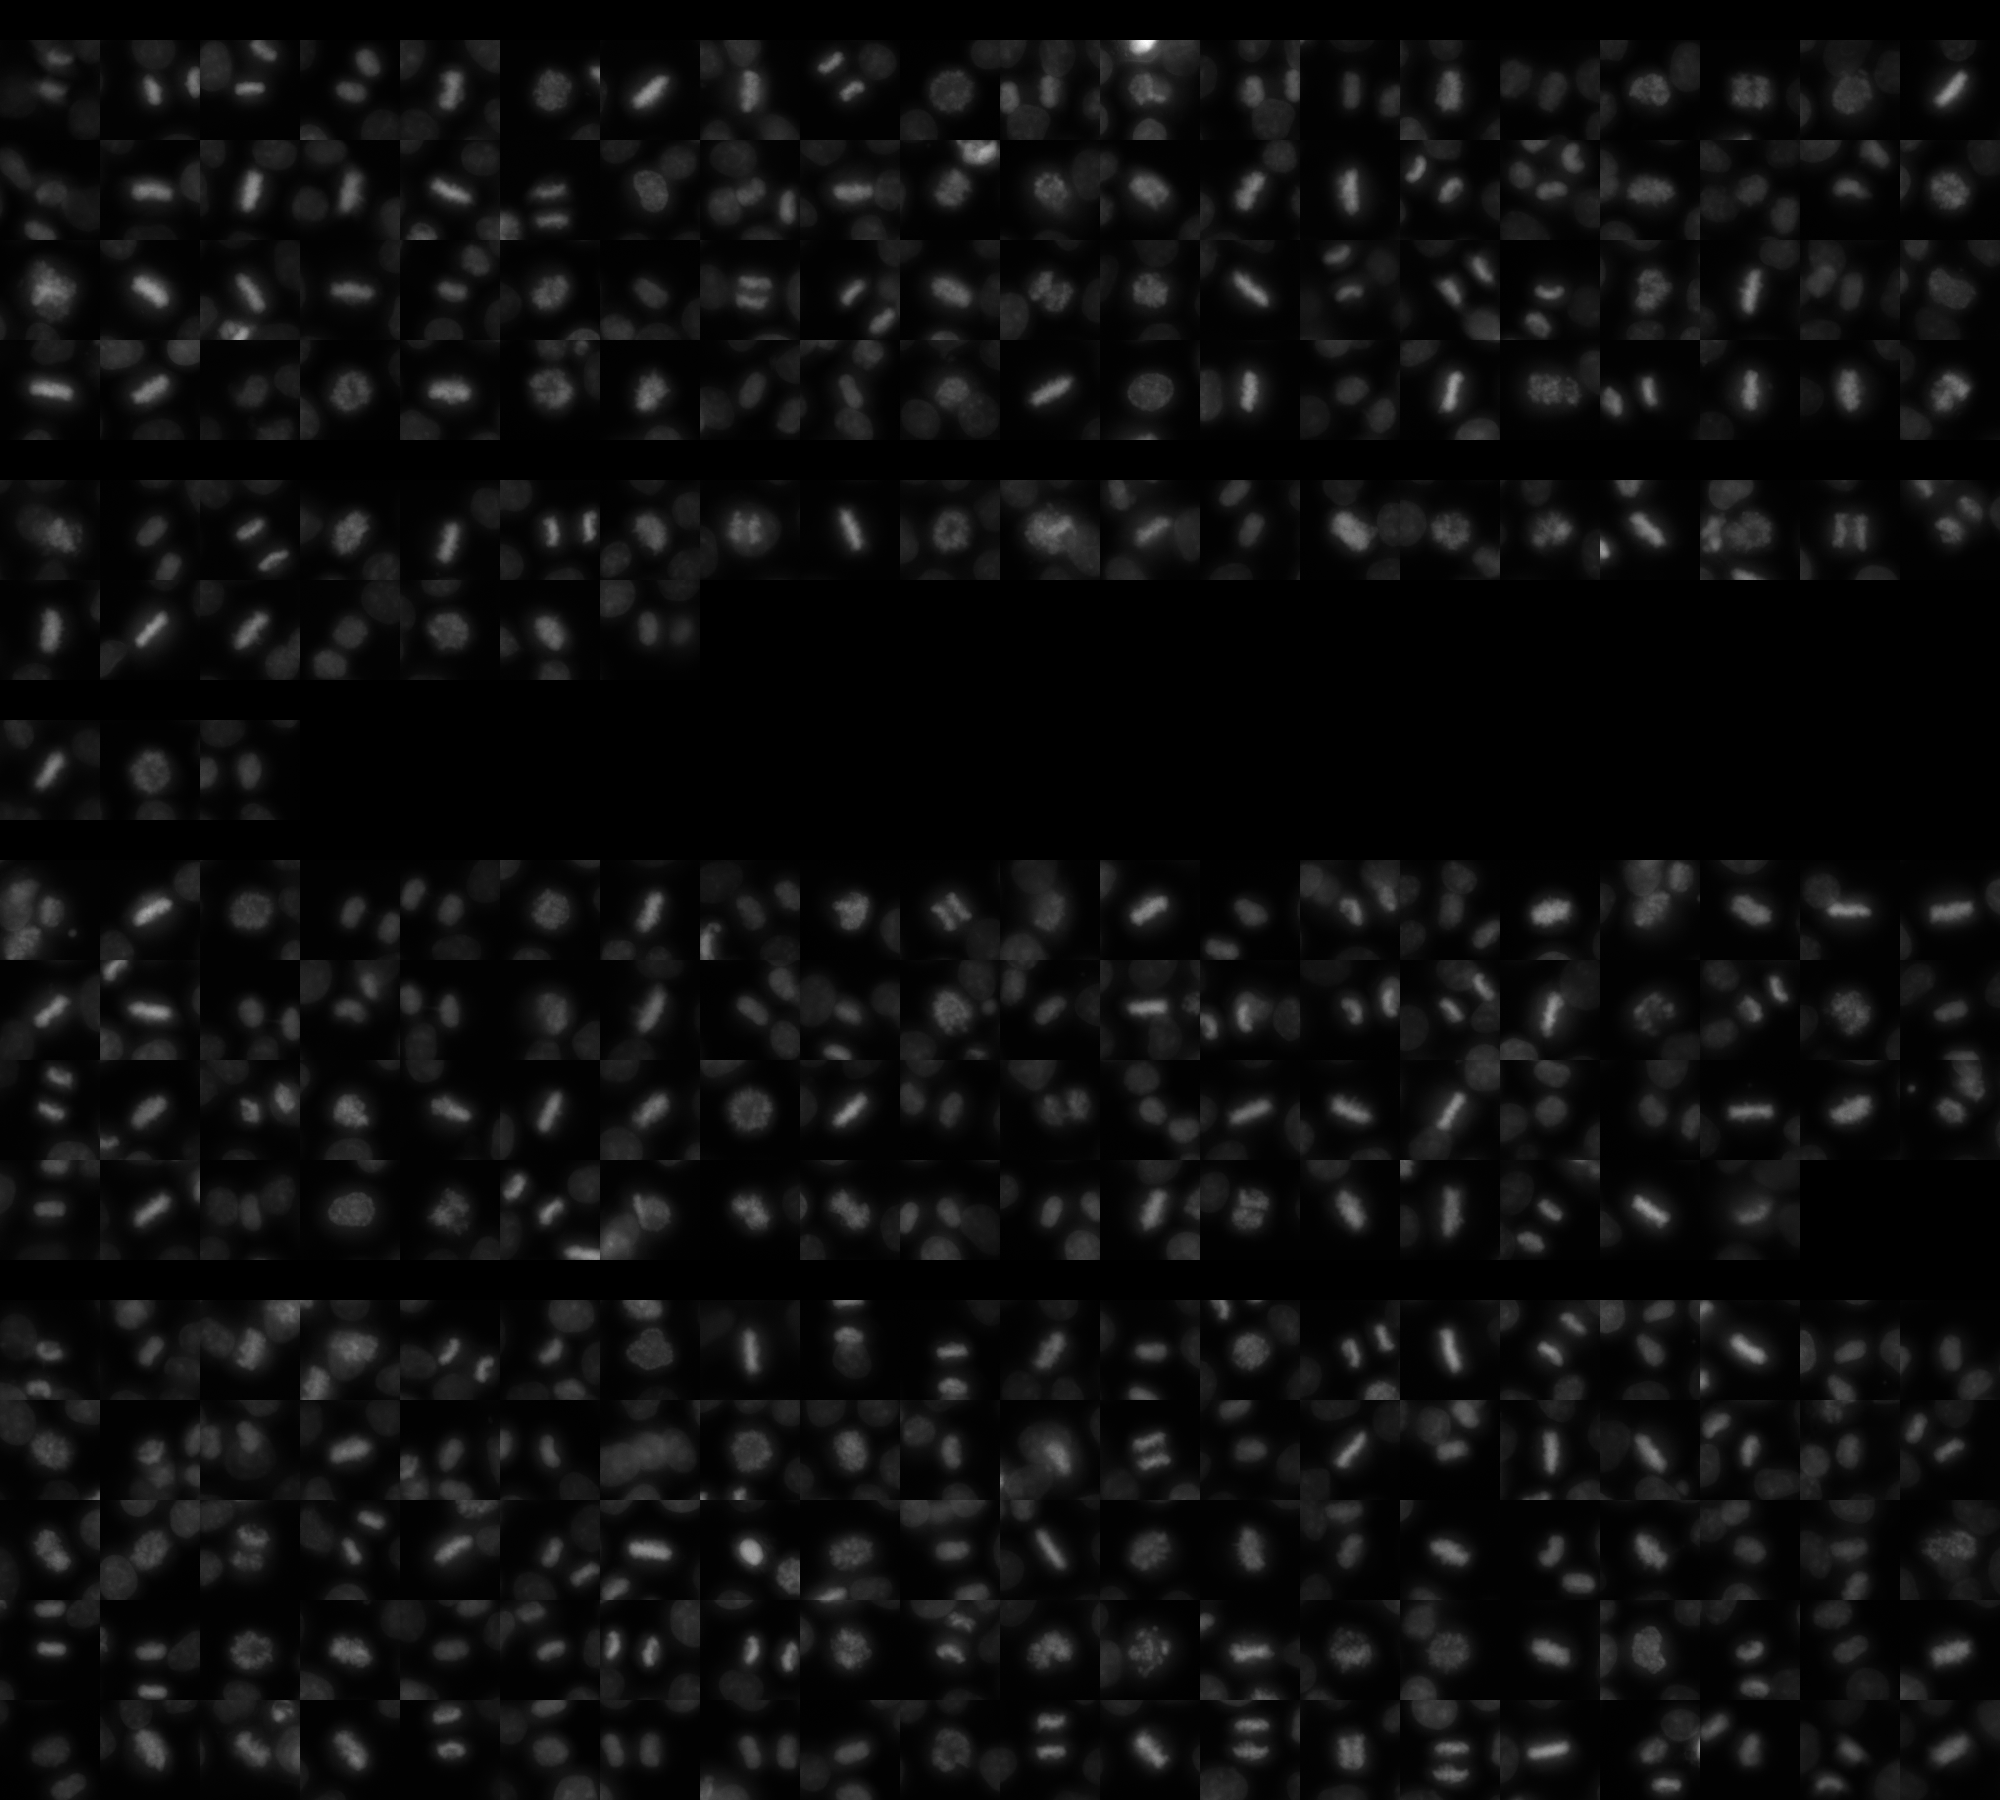
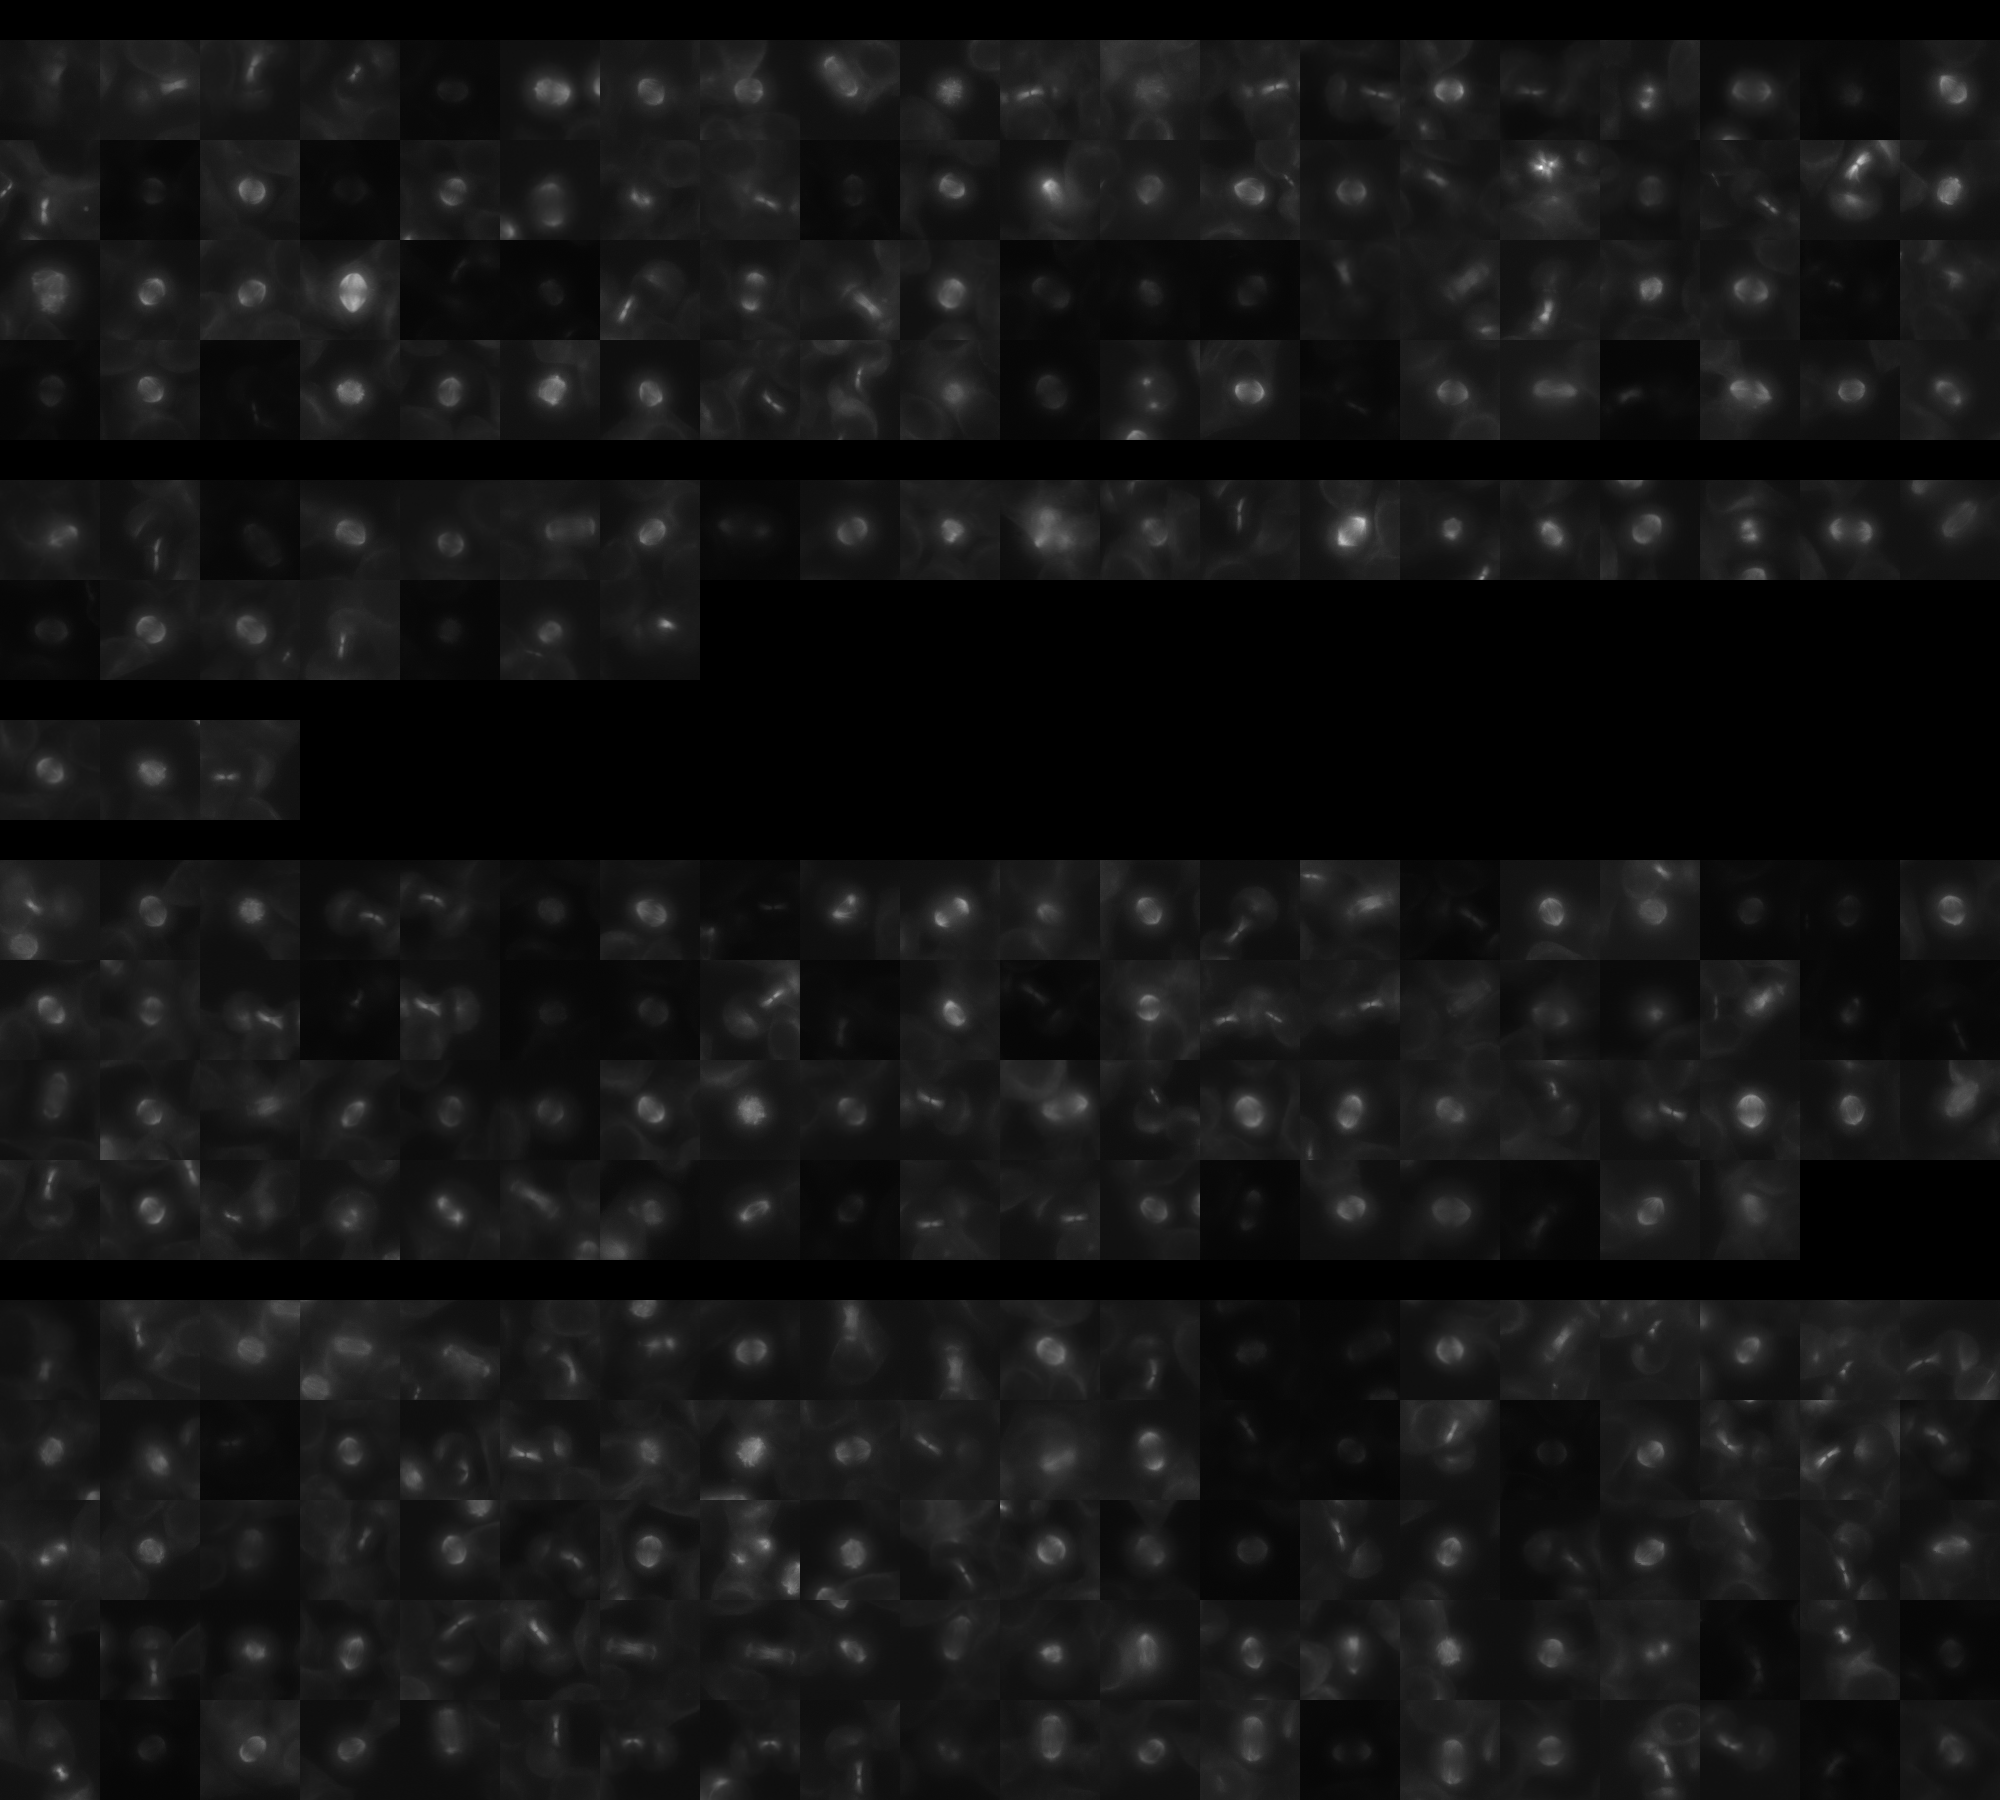
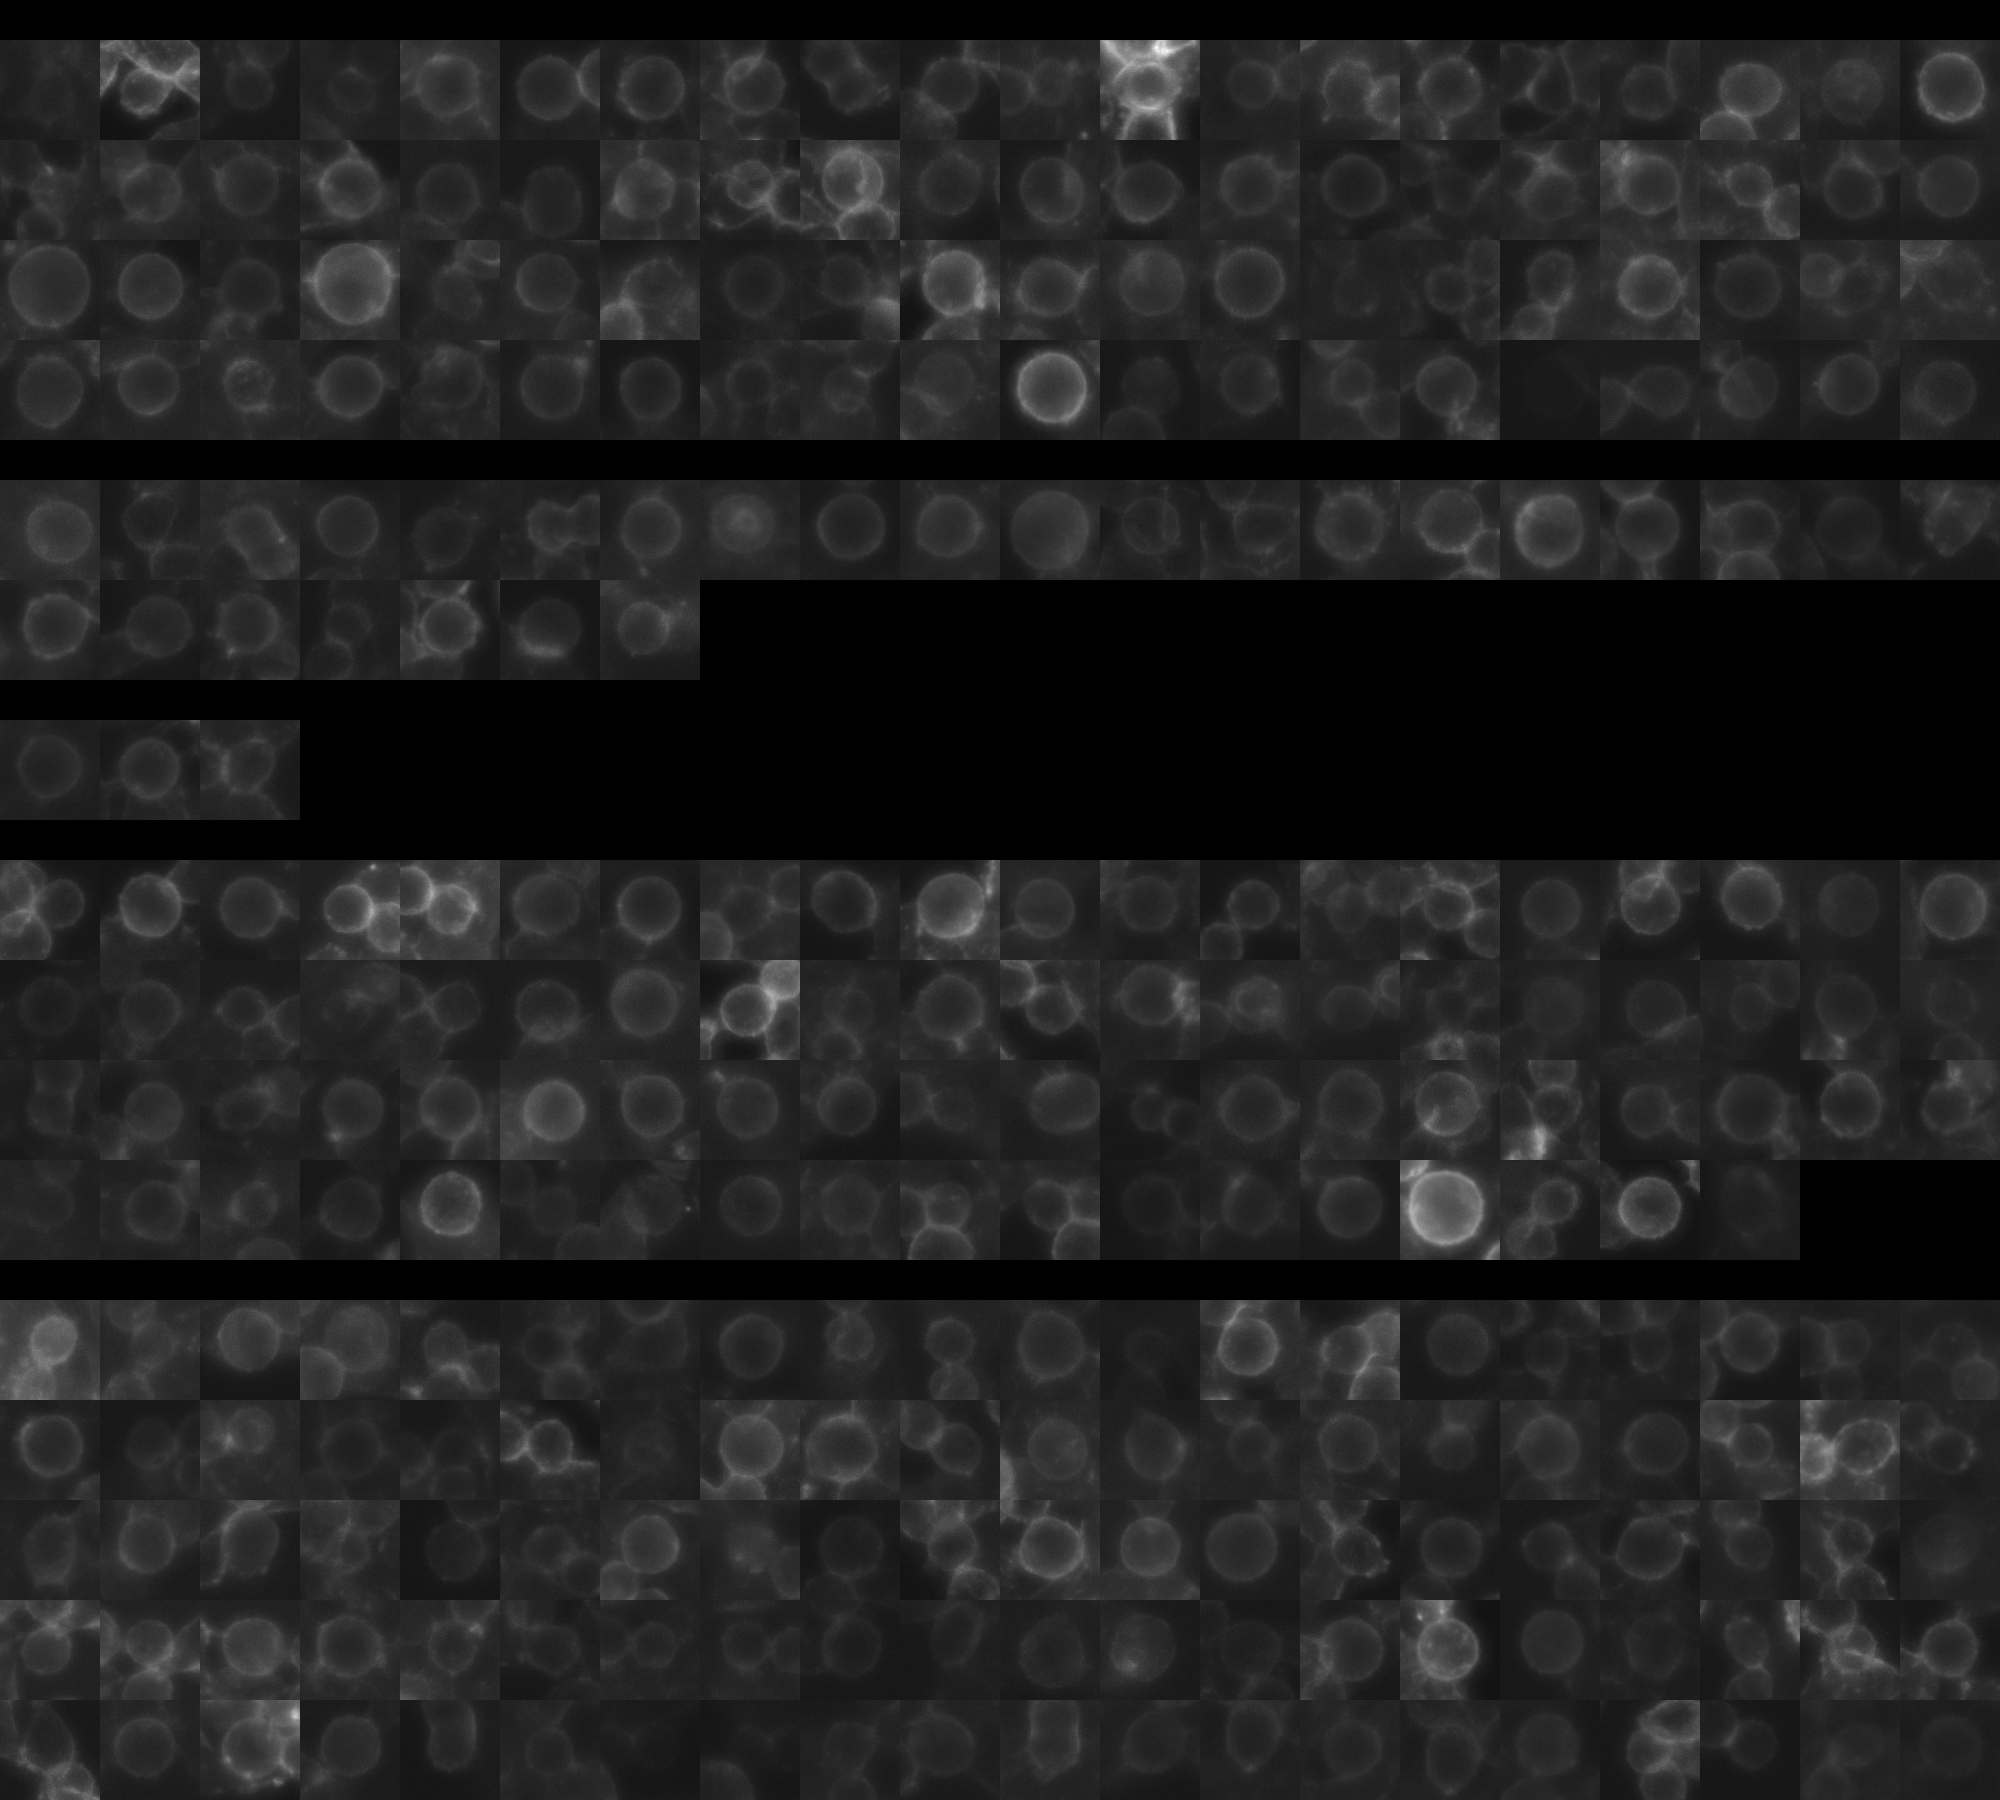
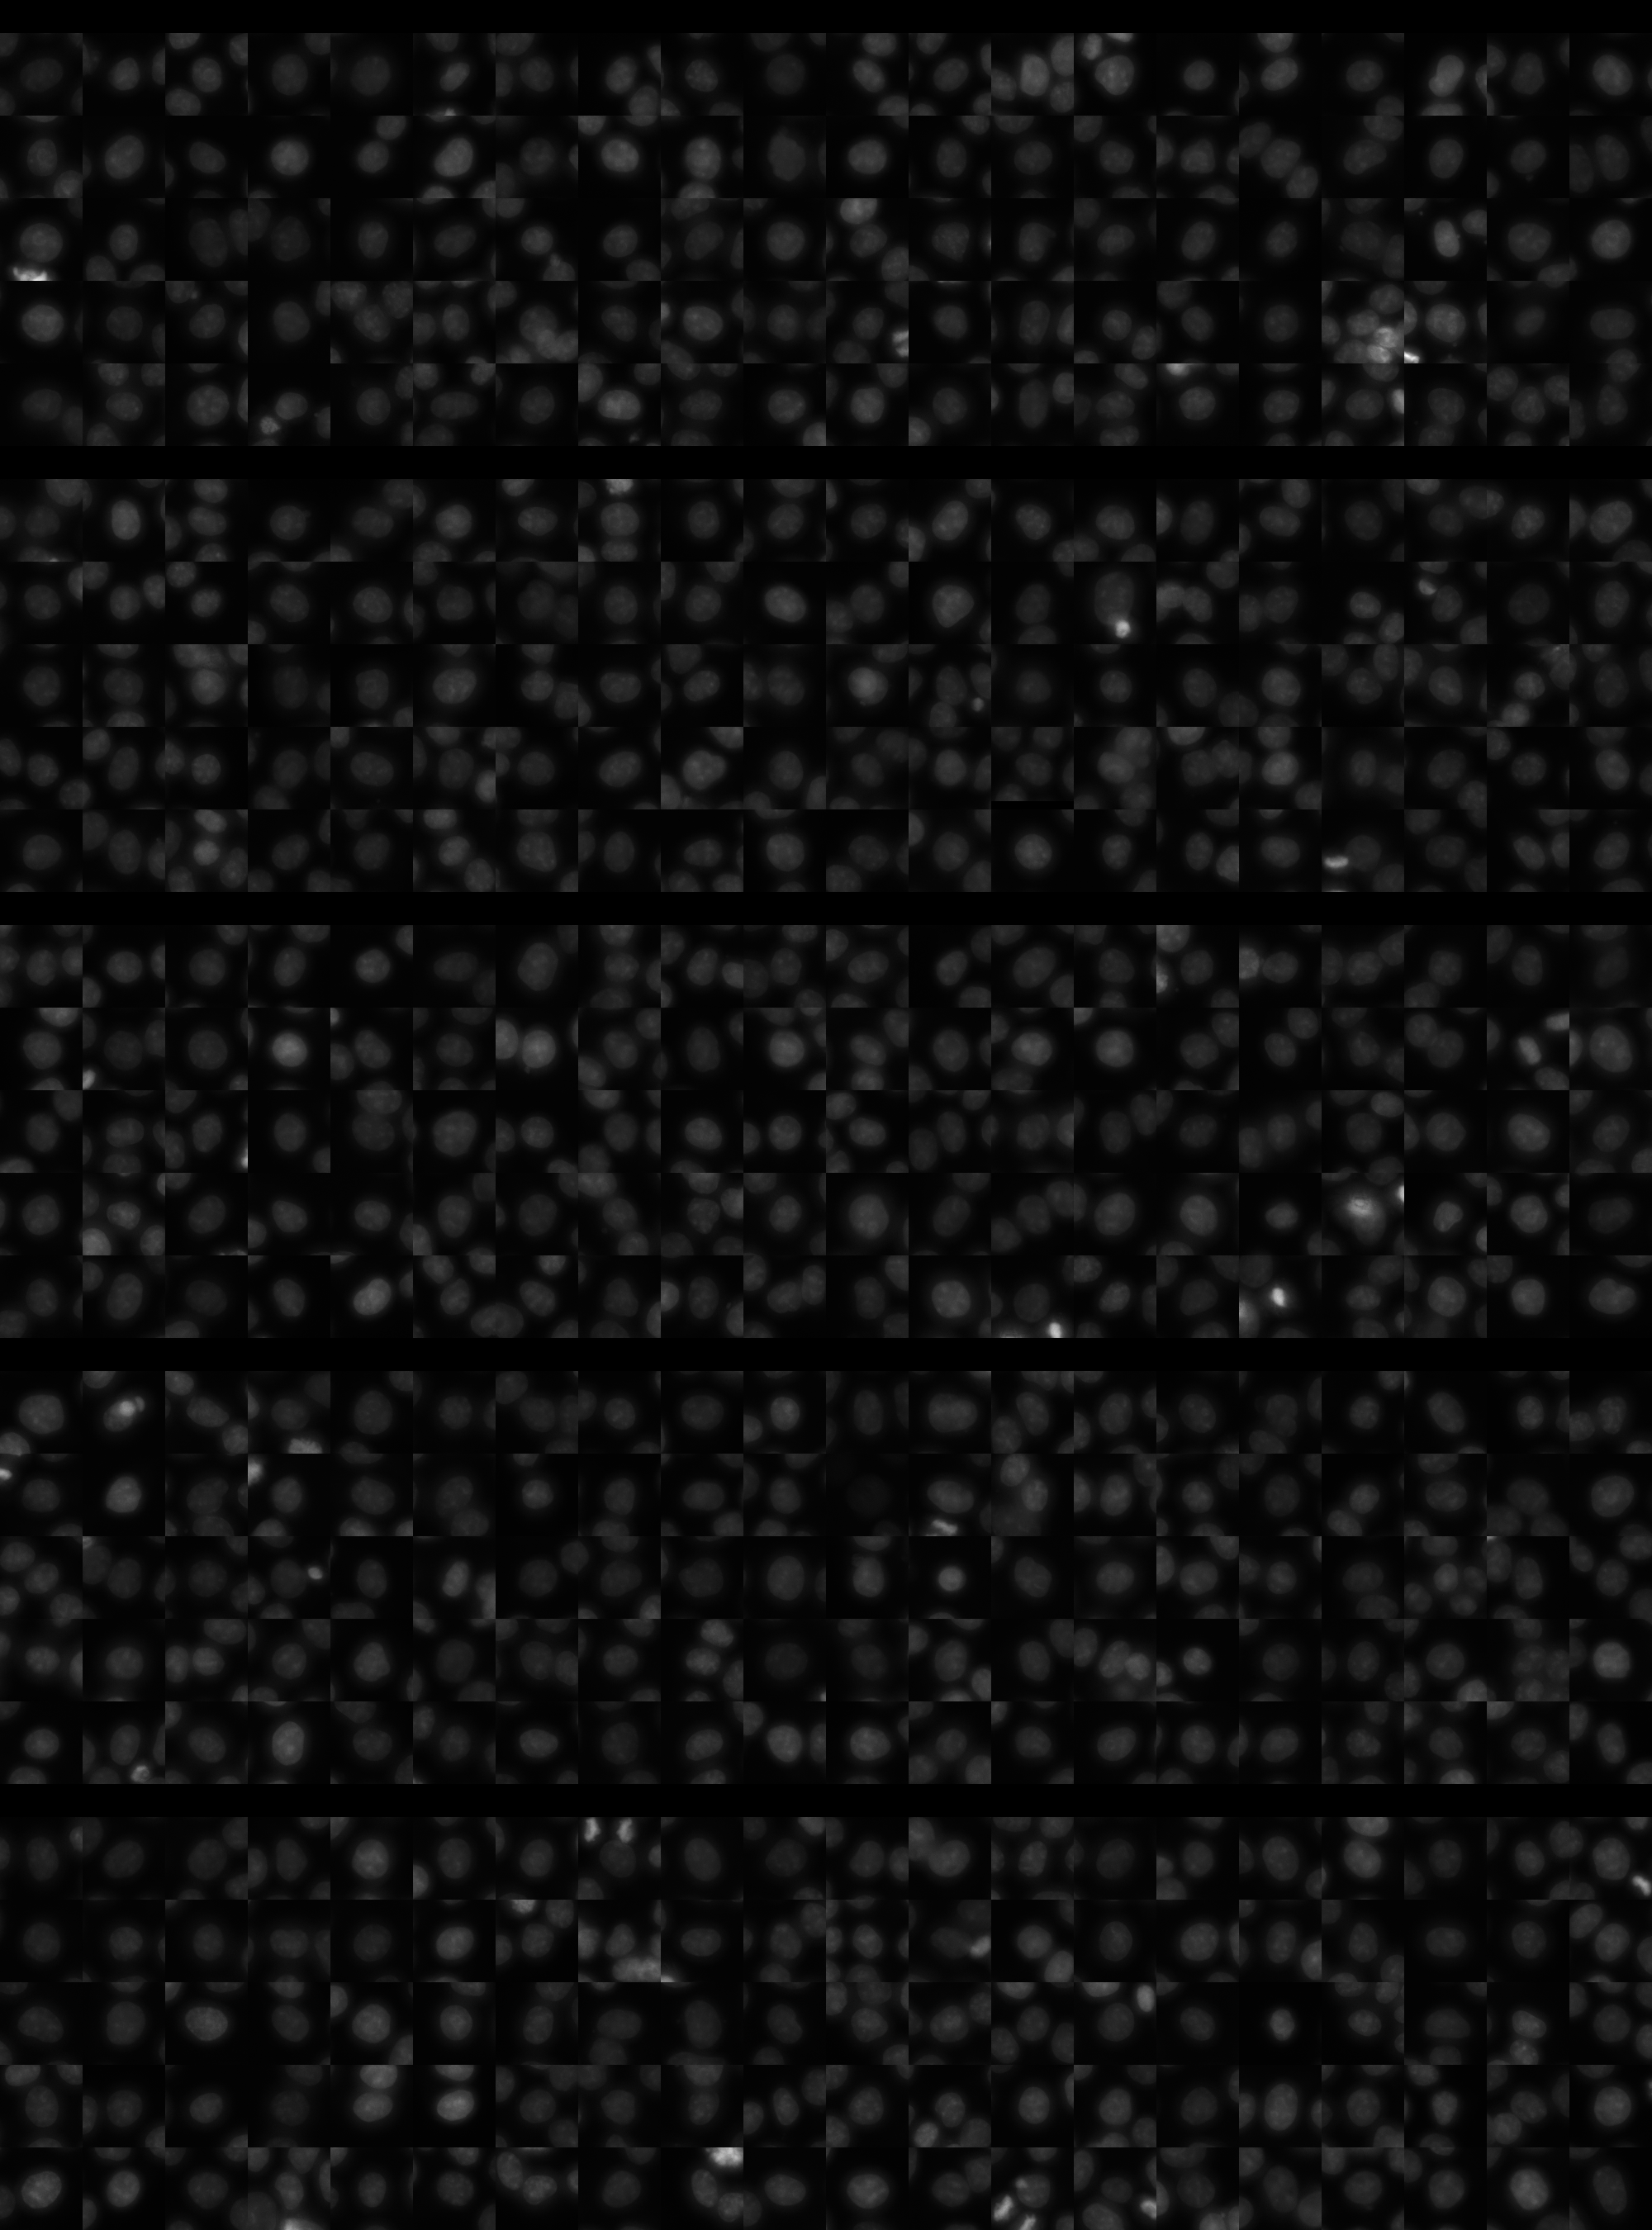
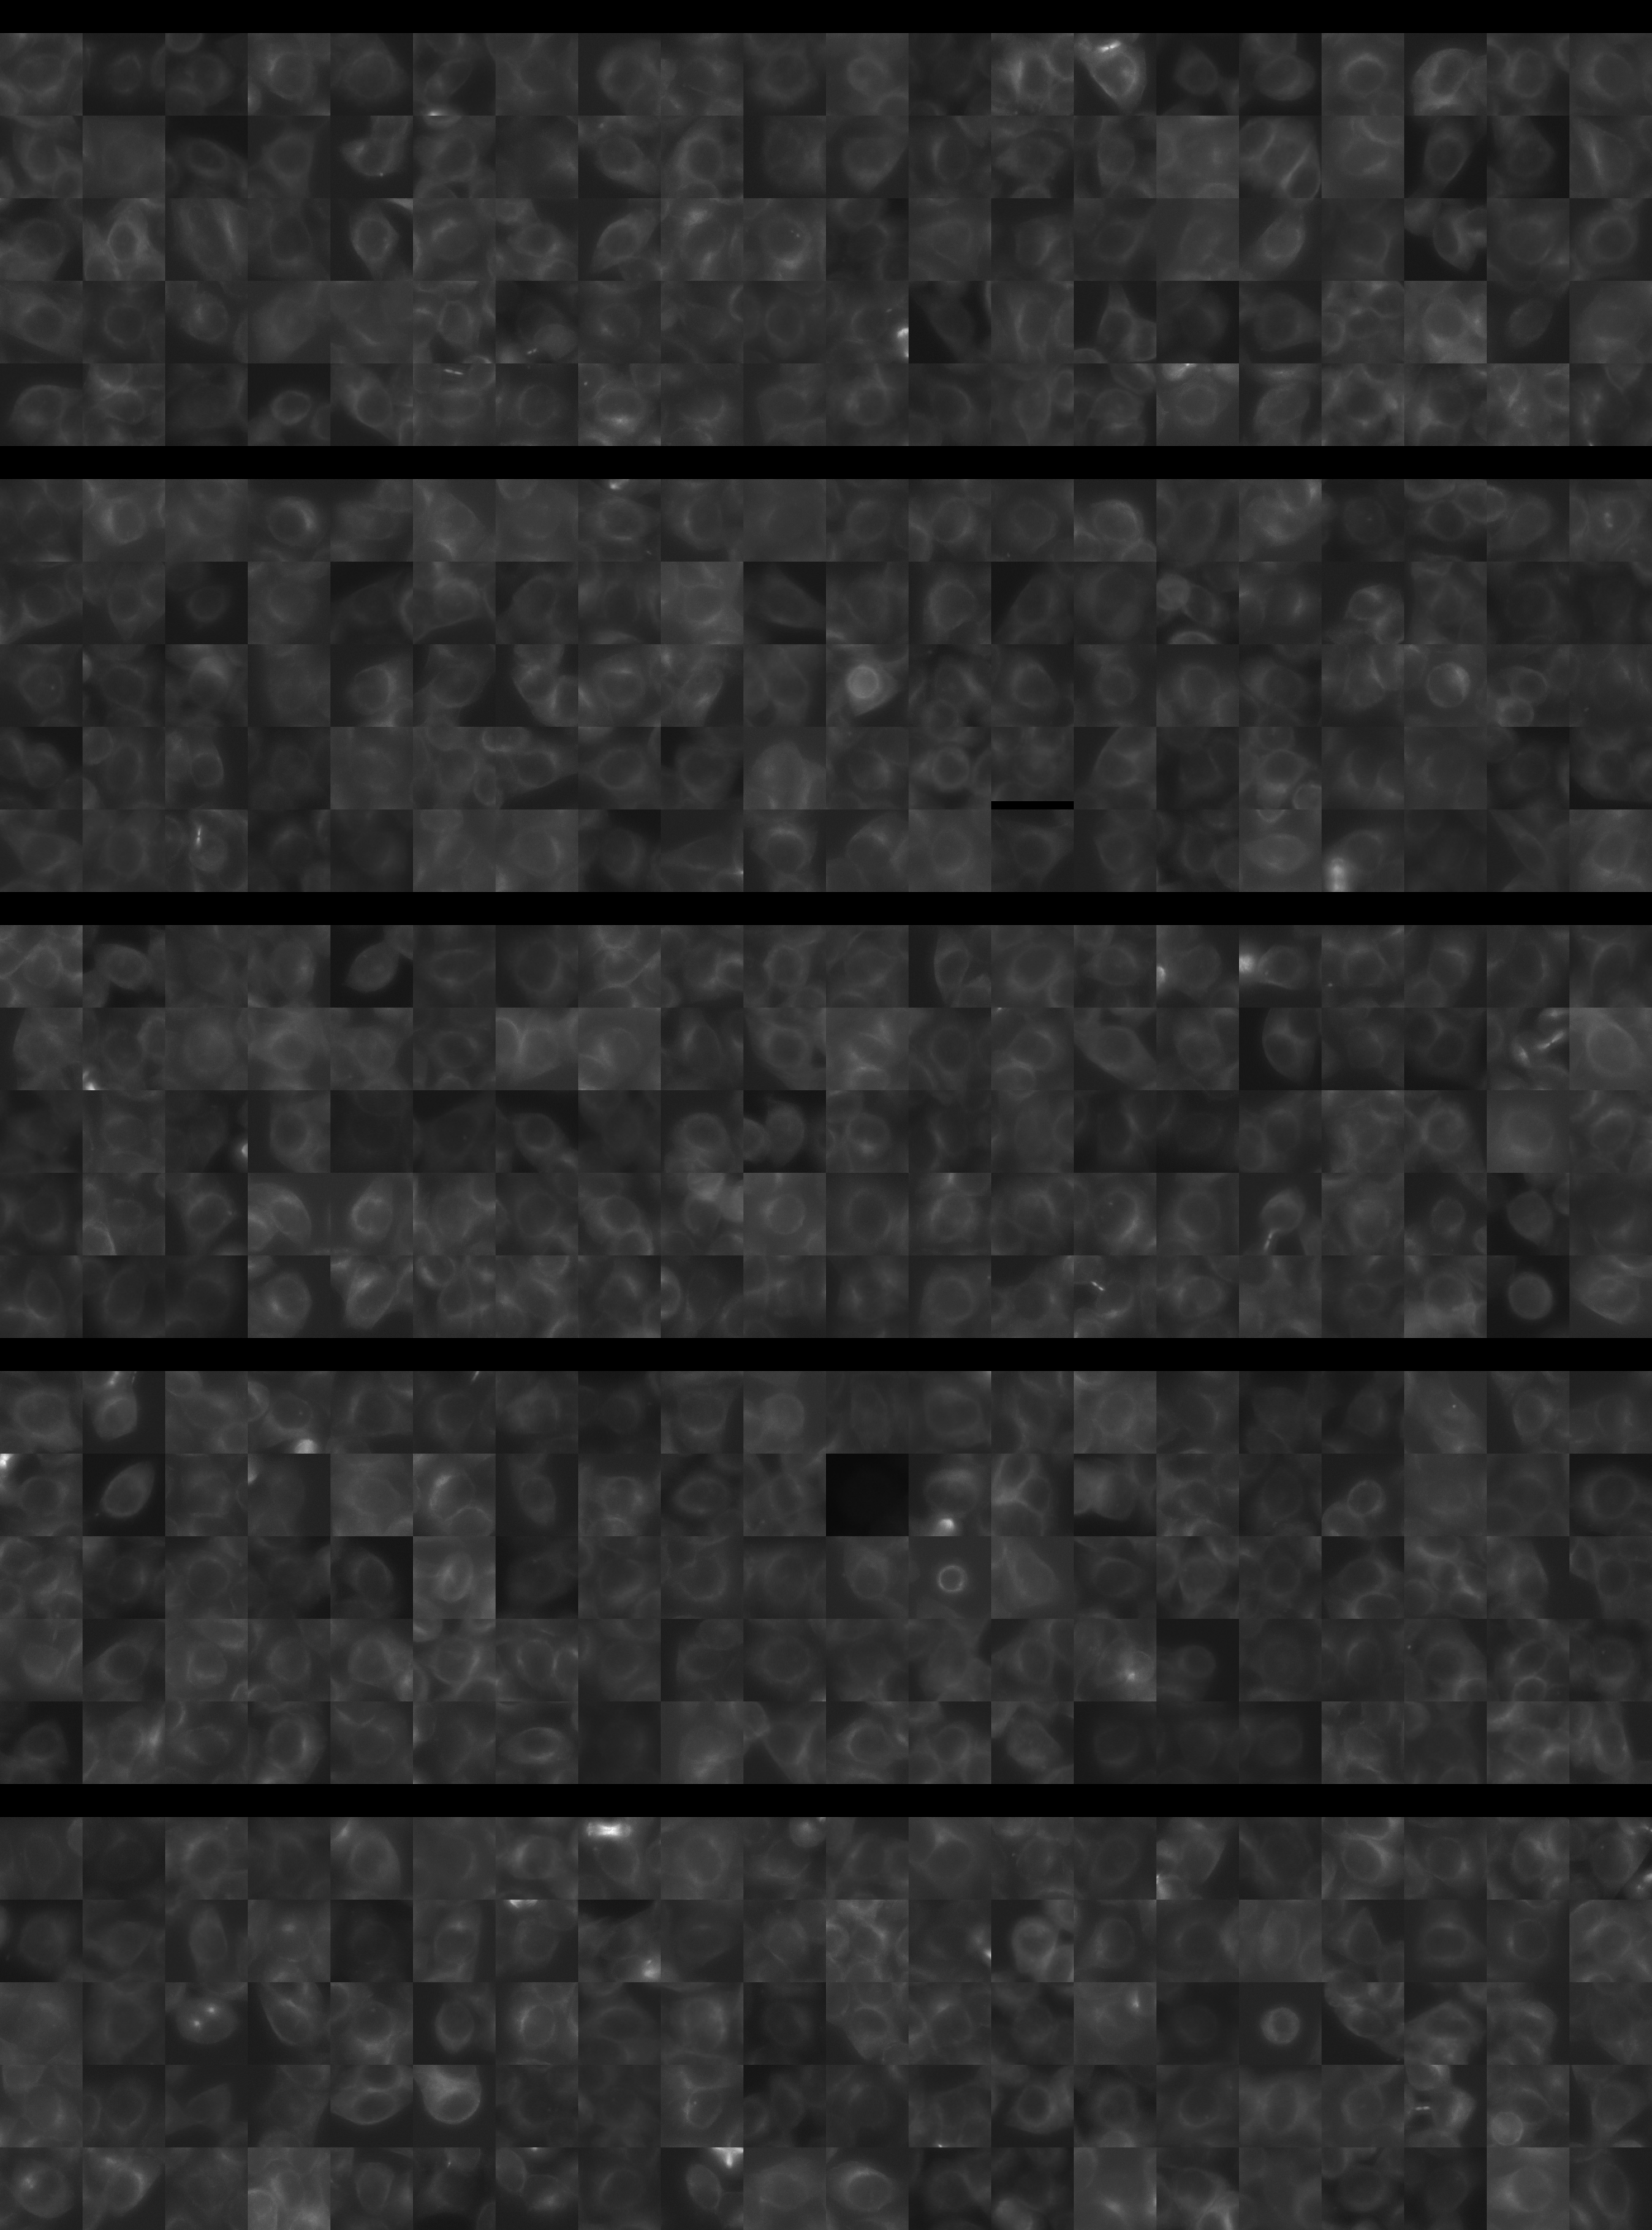
Each montage below shows randomly selected individual cell images for the same target gene separated by sgRNA, along with an example montage of cells expressing a non-targeting negative control sgRNA at the bottom. sgRNA labels in the montages correspond to the numbered sgRNA sequences in the gene info table above. The DNA (blue) and tubulin (green) channels are displayed by default, with gH2AX (grayscale) and actin (yellow) available using the check boxes. Channel brightness, contrast, and opacity are adjustable by clicking the arrow next to the channel name. When only one channel is selected, the display defaults to grayscale. Click the “Zoom” checkbox above the channel controls to enable image zooming (via scrolling) and panning (via click-and-drag).

The cell boxes displayed for this gene are square, 30.36 μm per side for the interphase montage and 30.36 μm per side for the mitotic montage.
Features

Interphase Score Rank FDR q-value
Nucleus DNA Integrated -1.959e-02 4026 of 5322 0.774
Nucleus DNA Mean -3.630e-02 3189 of 5322 0.489
Nucleus gH2AX Mean 0.092 2162 of 5322 0.035
Nucleus DNA - gH2AX Correlation -6.906e-02 3071 of 5322 0.026
Nucleus Shape Area 0.007 3013 of 5322 0.994
Nucleus Shape Eccentricity 0.013 2627 of 5322 0.795
Nucleus Shape Form Factor -1.033e-01 4448 of 5322 0.016
Nucleus Shape Solidity -1.104e-01 4475 of 5322 0.005
Cell DNA Mass Displacement 0.046 1338 of 5322 0.442
Cell Tubulin Mean -1.031e-03 2820 of 5322 0.979
Cell Tubulin Mass Displacement 0.044 759 of 5322 0.378
Cell Actin Mean -2.256e-02 3709 of 5322 0.746
Cell Tubulin - Actin Correlation -1.261e-02 4210 of 5322 0.827
Cell DNA - Tubulin Correlation 0.026 2756 of 5322 0.575
Cell Shape Area 0.043 1738 of 5322 0.598
Cell Shape Eccentricity 0.052 538 of 5322 0.399
Mitotic Score Rank FDR q-value
Nucleus DNA Integrated 0.042 3351 of 5322 0.996
Nucleus DNA Mean 0.053 2125 of 5322 1.000
Nucleus DNA Mass Displacement -1.179e-01 4831 of 5322 0.999
Nucleus DNA Mean Frac 3 0.130 1199 of 5322 1.000
Nucleus gH2AX Mean 0.181 879 of 5322 1.000
Nucleus gH2AX Mean Frac 0 -2.826e-02 2720 of 5322 1.000
Nucleus Tubulin Mean Frac 0 0.017 3243 of 5322 0.999
Nucleus Tubulin Mean Edge -1.164e-01 4446 of 5322 0.999
Nucleus Tubulin Std Edge -1.020e-01 3911 of 5322 0.999
Nucleus Shape Area 0.012 3817 of 5322 1.000
Nucleus Shape Eccentricity -1.052e-01 3642 of 5322 1.000
Nucleus Shape Form Factor -1.303e-01 3282 of 5322 0.998
Cell Tubulin Mean -3.252e-02 3915 of 5322 0.997
Cell Tubulin Mean Frac 3 -2.371e-01 4346 of 5322 0.999
Cell Actin Mean 0.164 1160 of 5322 0.997
Cell Shape Area 0.071 2994 of 5322 0.998
( Reset Zoom )
Brightness
Contrast
Opacity
Brightness
Contrast
Opacity
Brightness
Contrast
Opacity
Brightness
Contrast
Opacity
Brightness
Contrast
Opacity

( Reset Zoom )
Brightness
Contrast
Opacity
Brightness
Contrast
Opacity
Brightness
Contrast
Opacity
Brightness
Contrast
Opacity
Brightness
Contrast
Opacity

MIT Central Accessability