C12orf10

Gene symbol: C12orf10
Gene: 60314
Uniprot Function: 3'-5' RNA exonuclease which cleaves in situ on specific transcripts in both nucleus and mitochondrion. Involved in regulating spatially segregated organellar RNA processing, acts as a coordinator of nucleo-mitochondrial crosstalk (PubMed:31081026). In nucleolus, processes pre-ribosomal RNA involved in ribosome assembly and alters cytoplasmic translation. In mitochondrial matrix, processes 3'-termini of the mito-ribosomal and messenger RNAs and controls translation of mitochondrial proteins (Probable).
Mitotic Index 0.0234
Interphase Cluster: #87 (25 genes)
Mitotic Cluster: #18 (40 genes)
sgRNA 1: ACCGATATGACCATCACCAG (interphase cells: 2888, mitotic cells: 66)
sgRNA 2: GCGGACCGTACCCGGTACTC (interphase cells: 243, mitotic cells: 2)
sgRNA 3: GTAGTGGTCAGTGCATATCG (interphase cells: 1376, mitotic cells: 42)
sgRNA 4: TTGTGCGTCCCGATTCGGGG (interphase cells: 1036, mitotic cells: 23)

Interphase Cluster

Mitotic Cluster

Overview

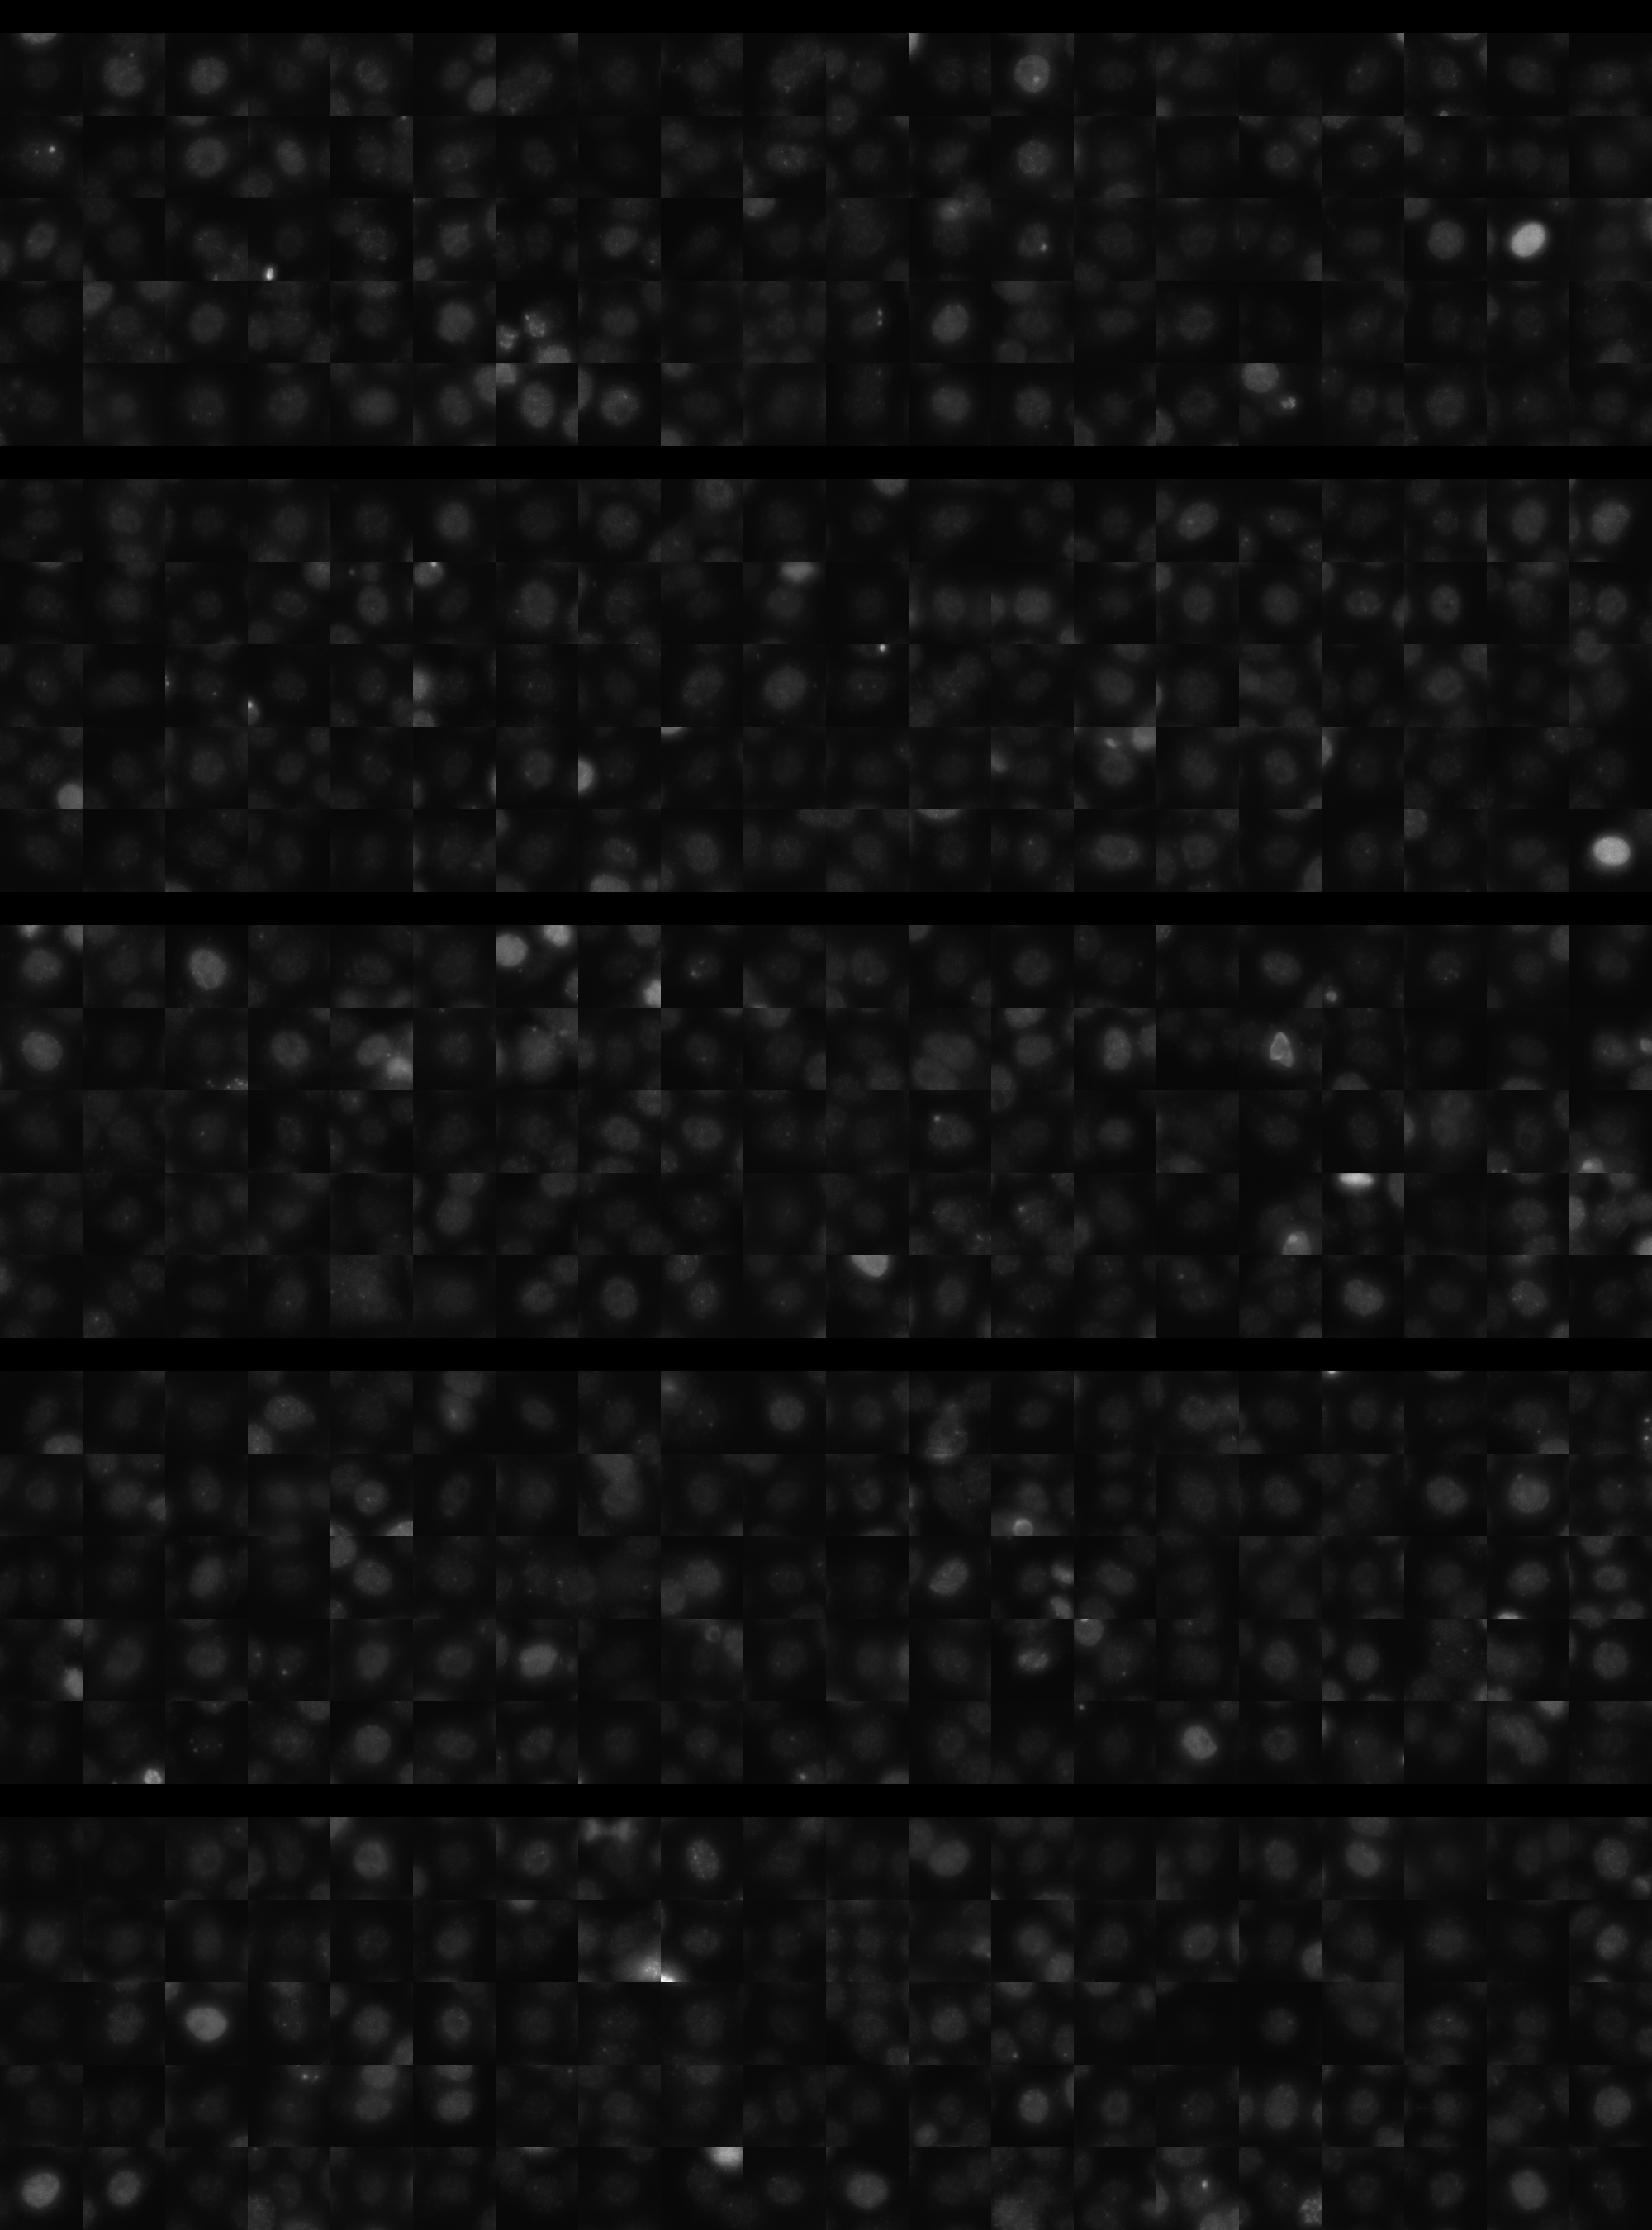
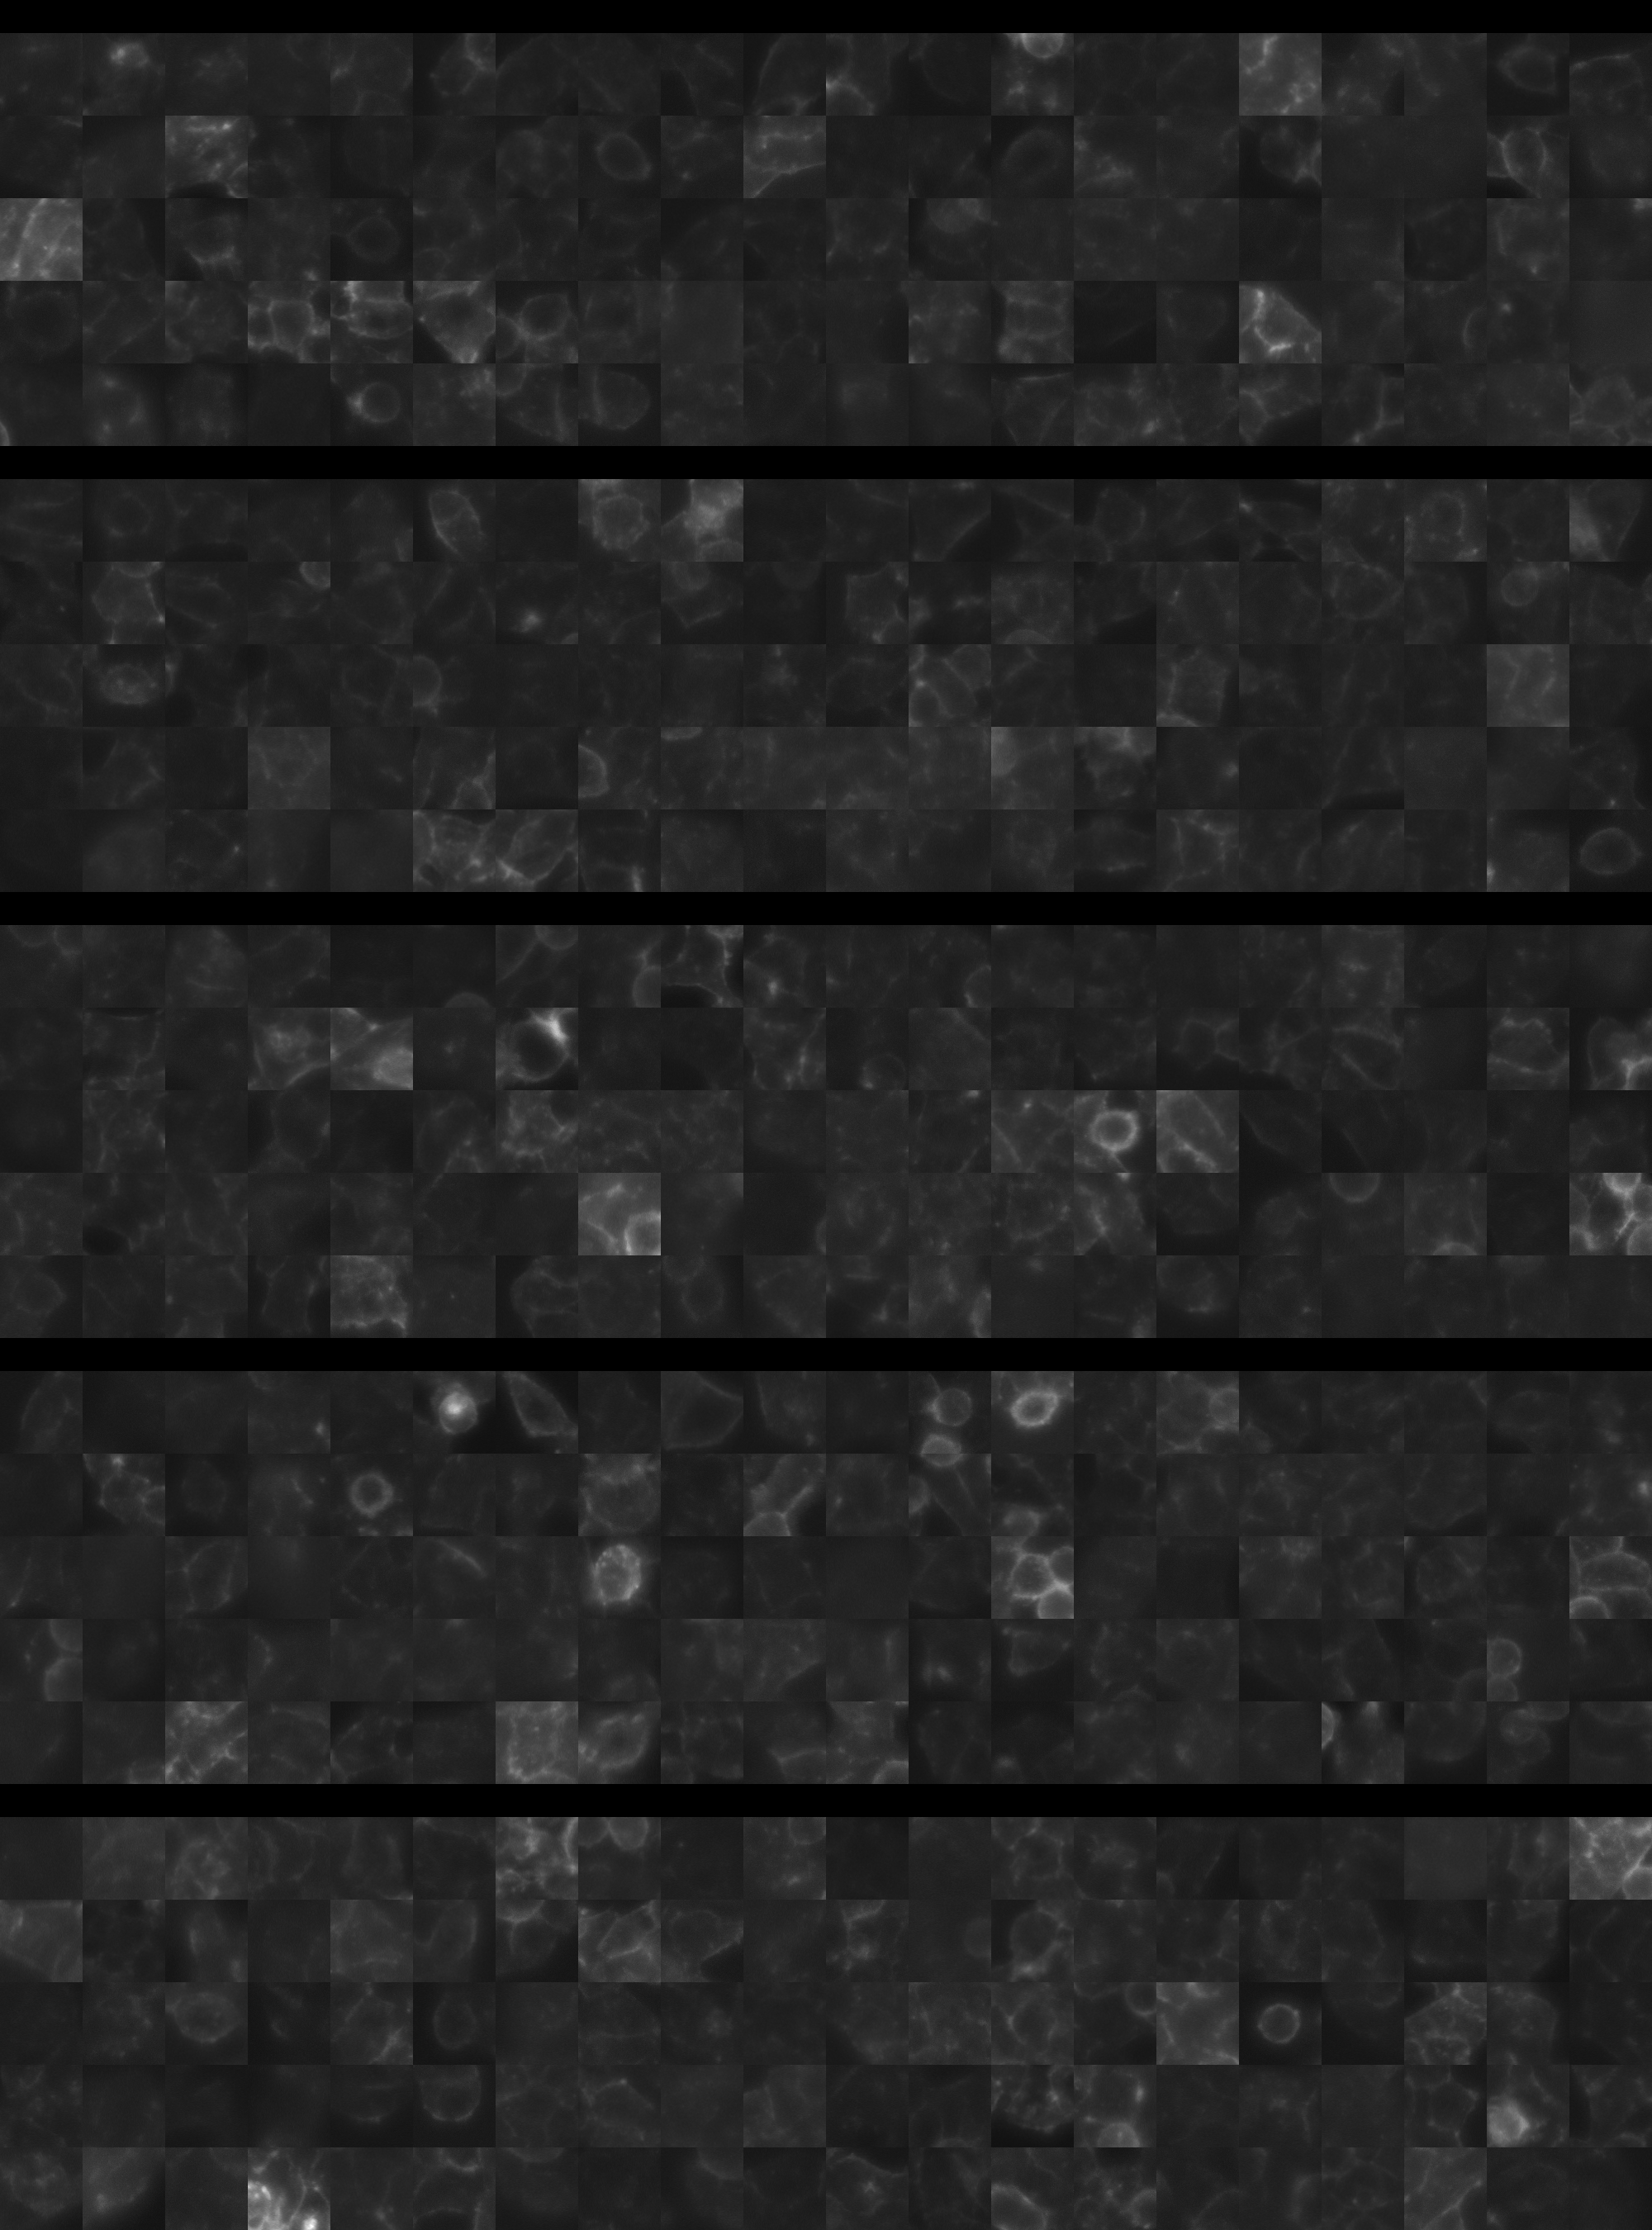
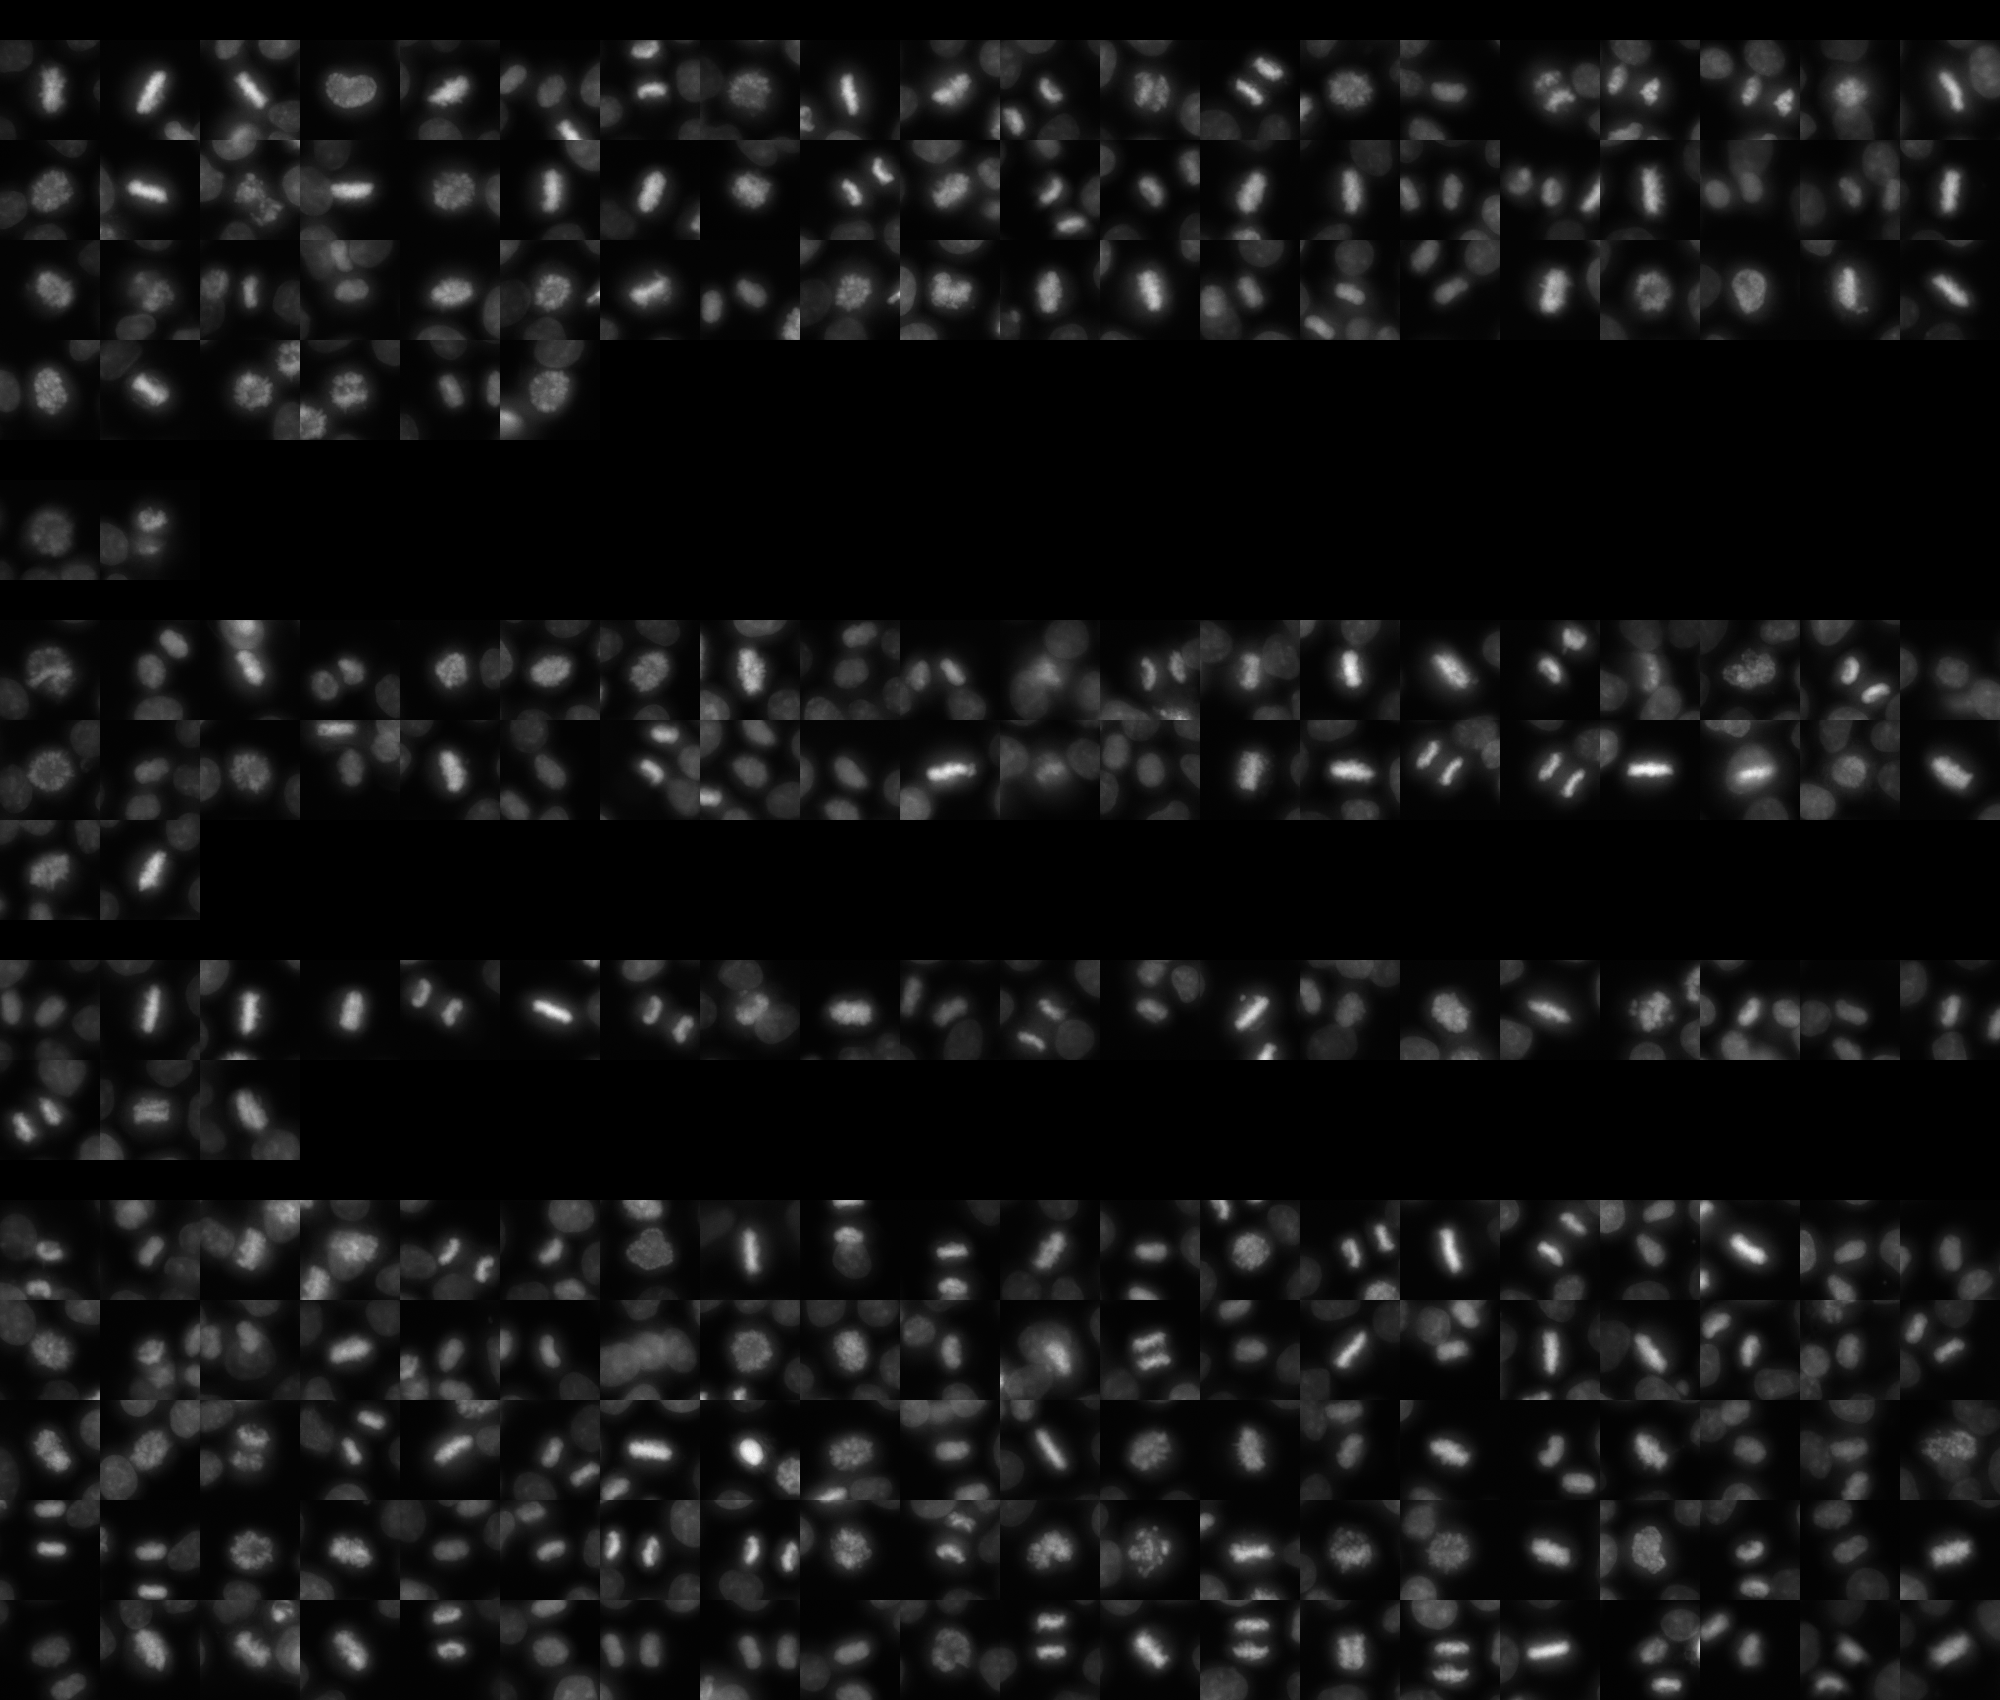
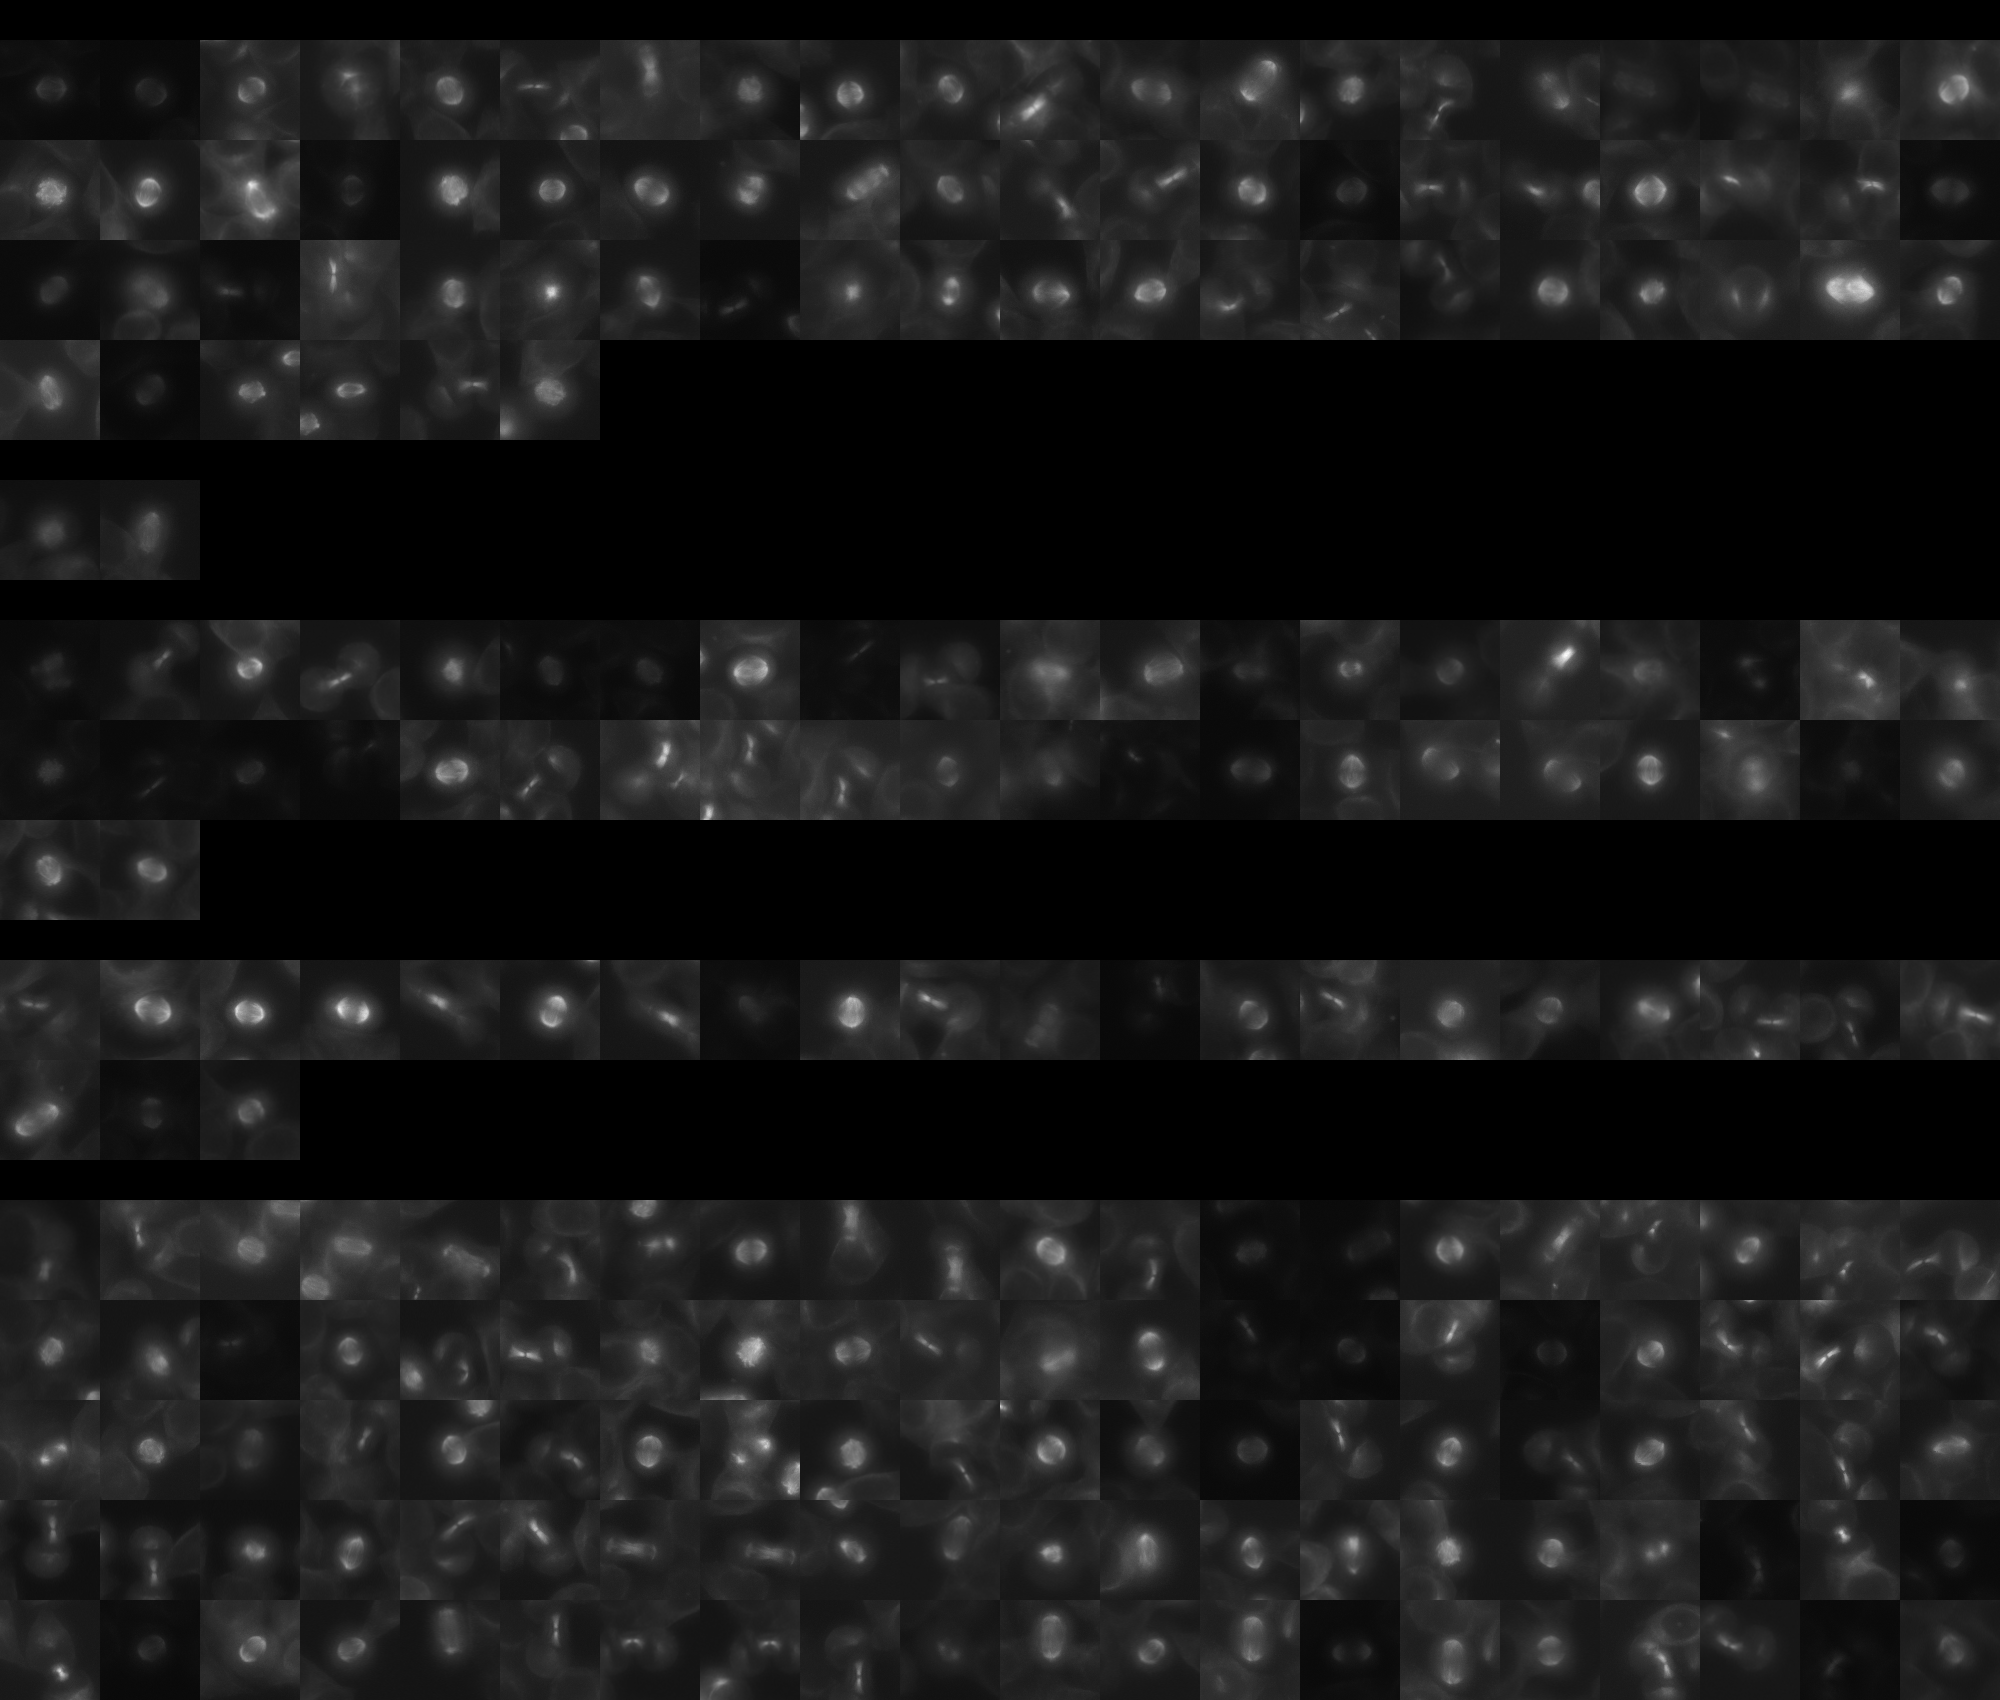
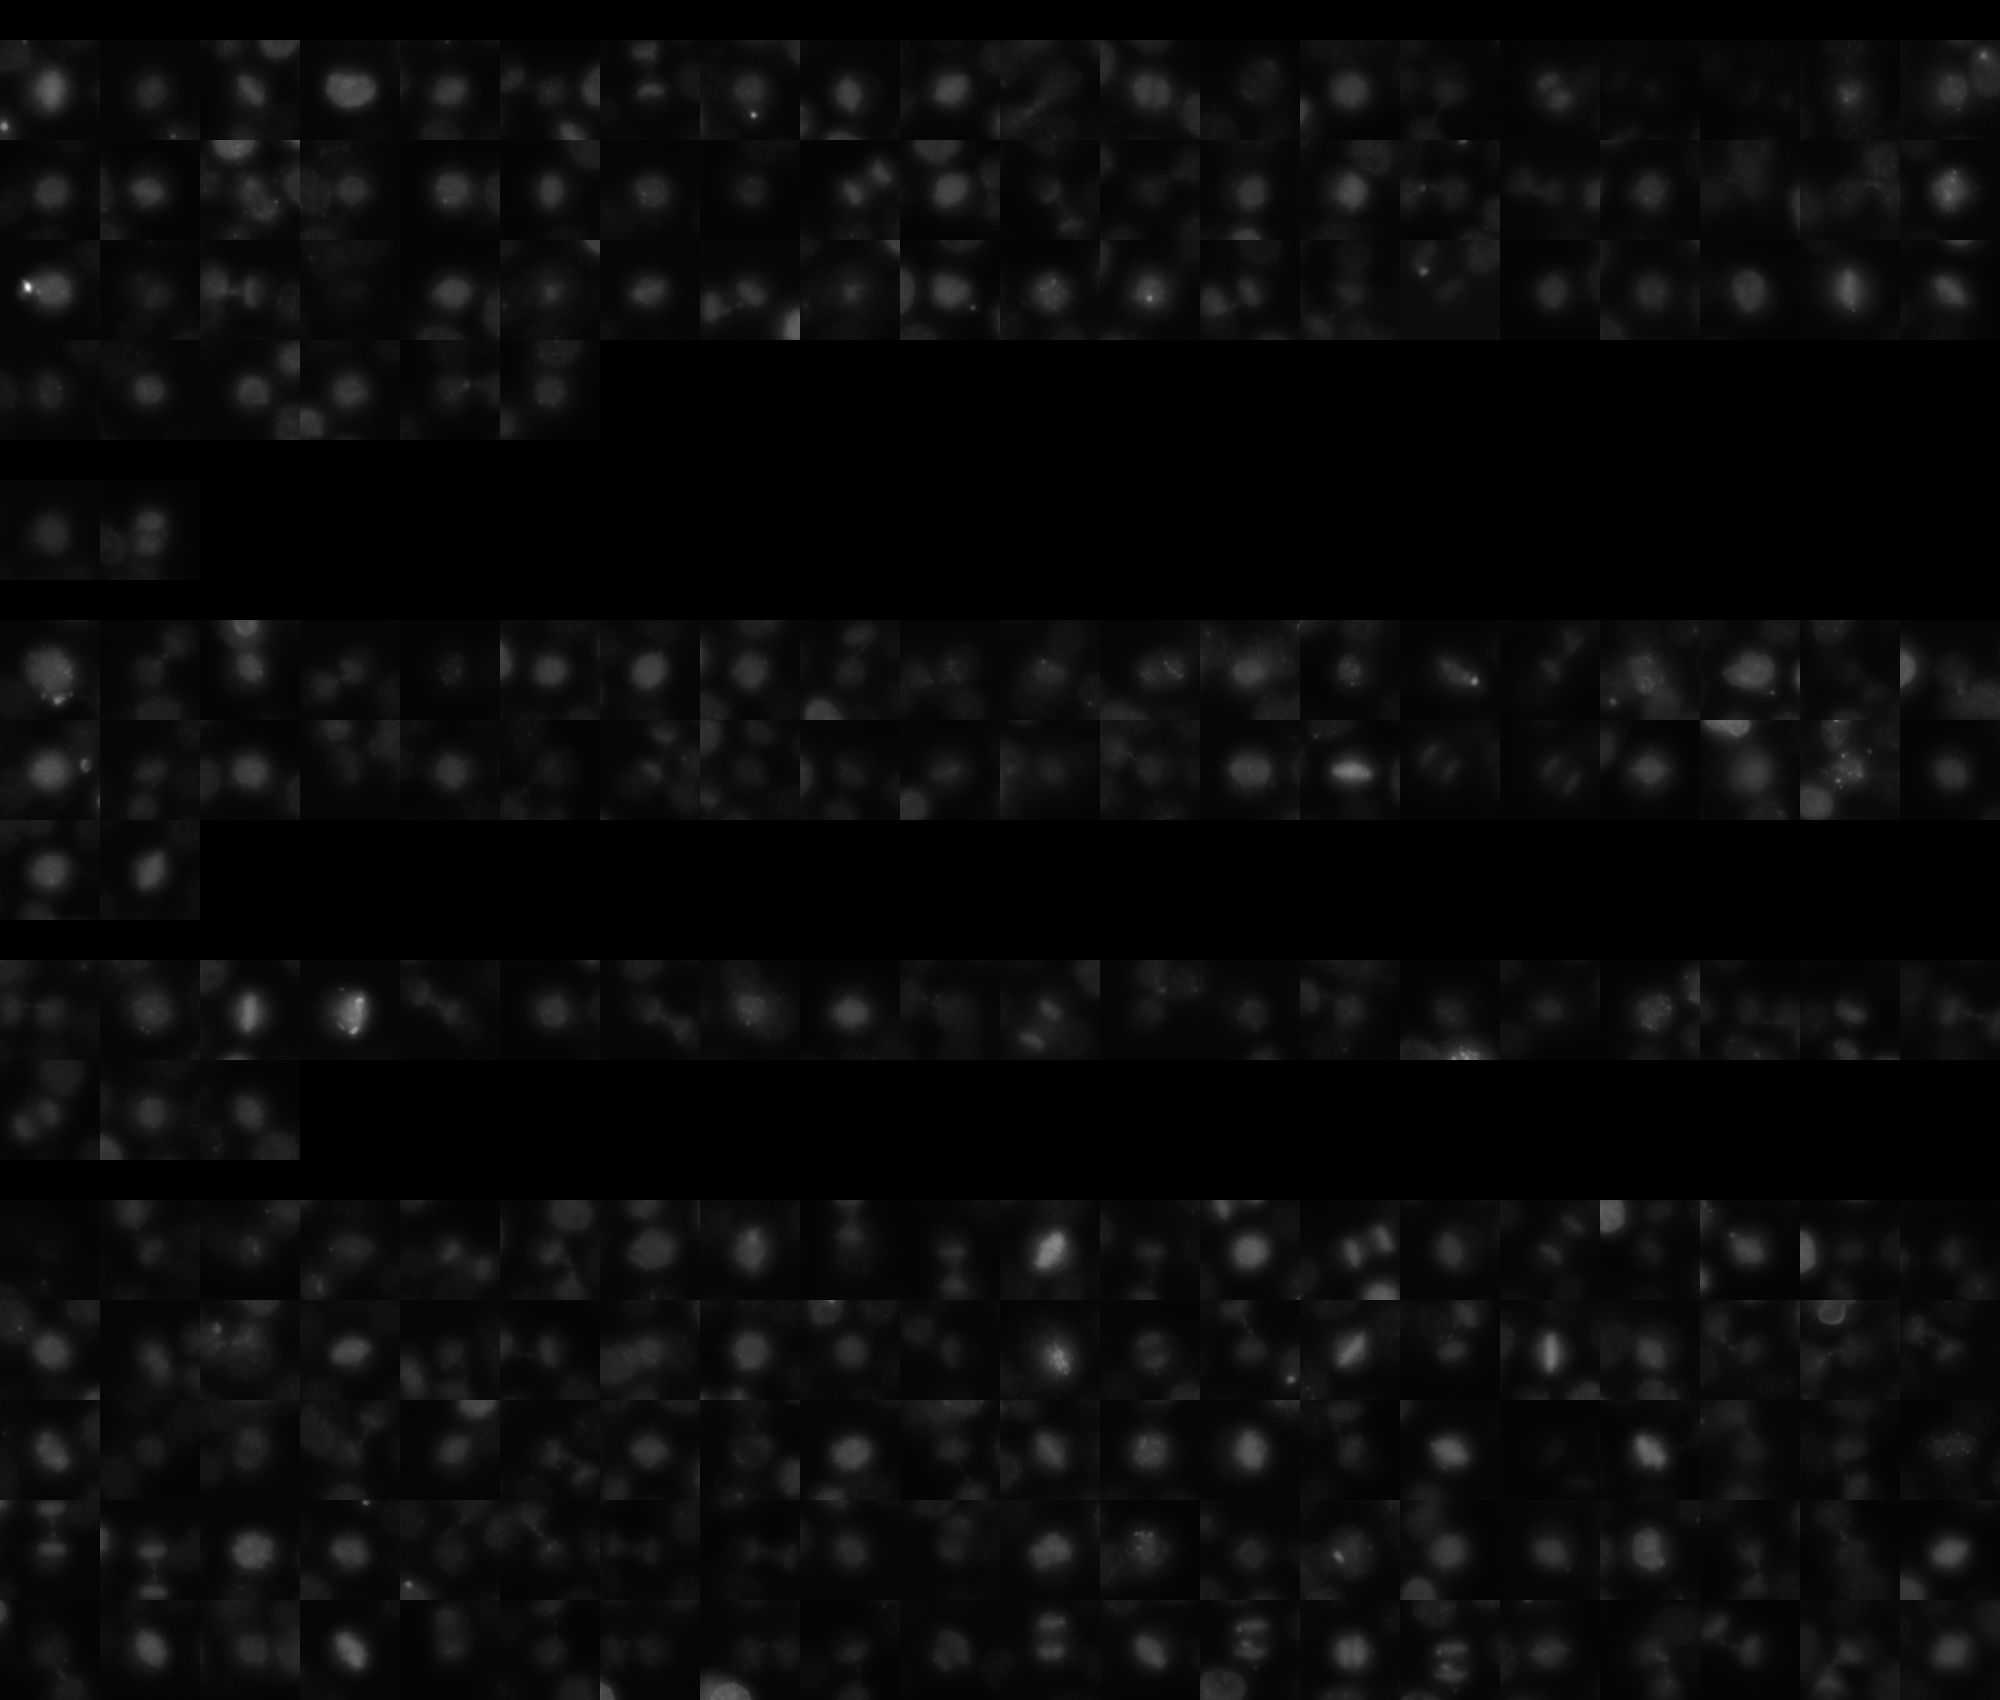
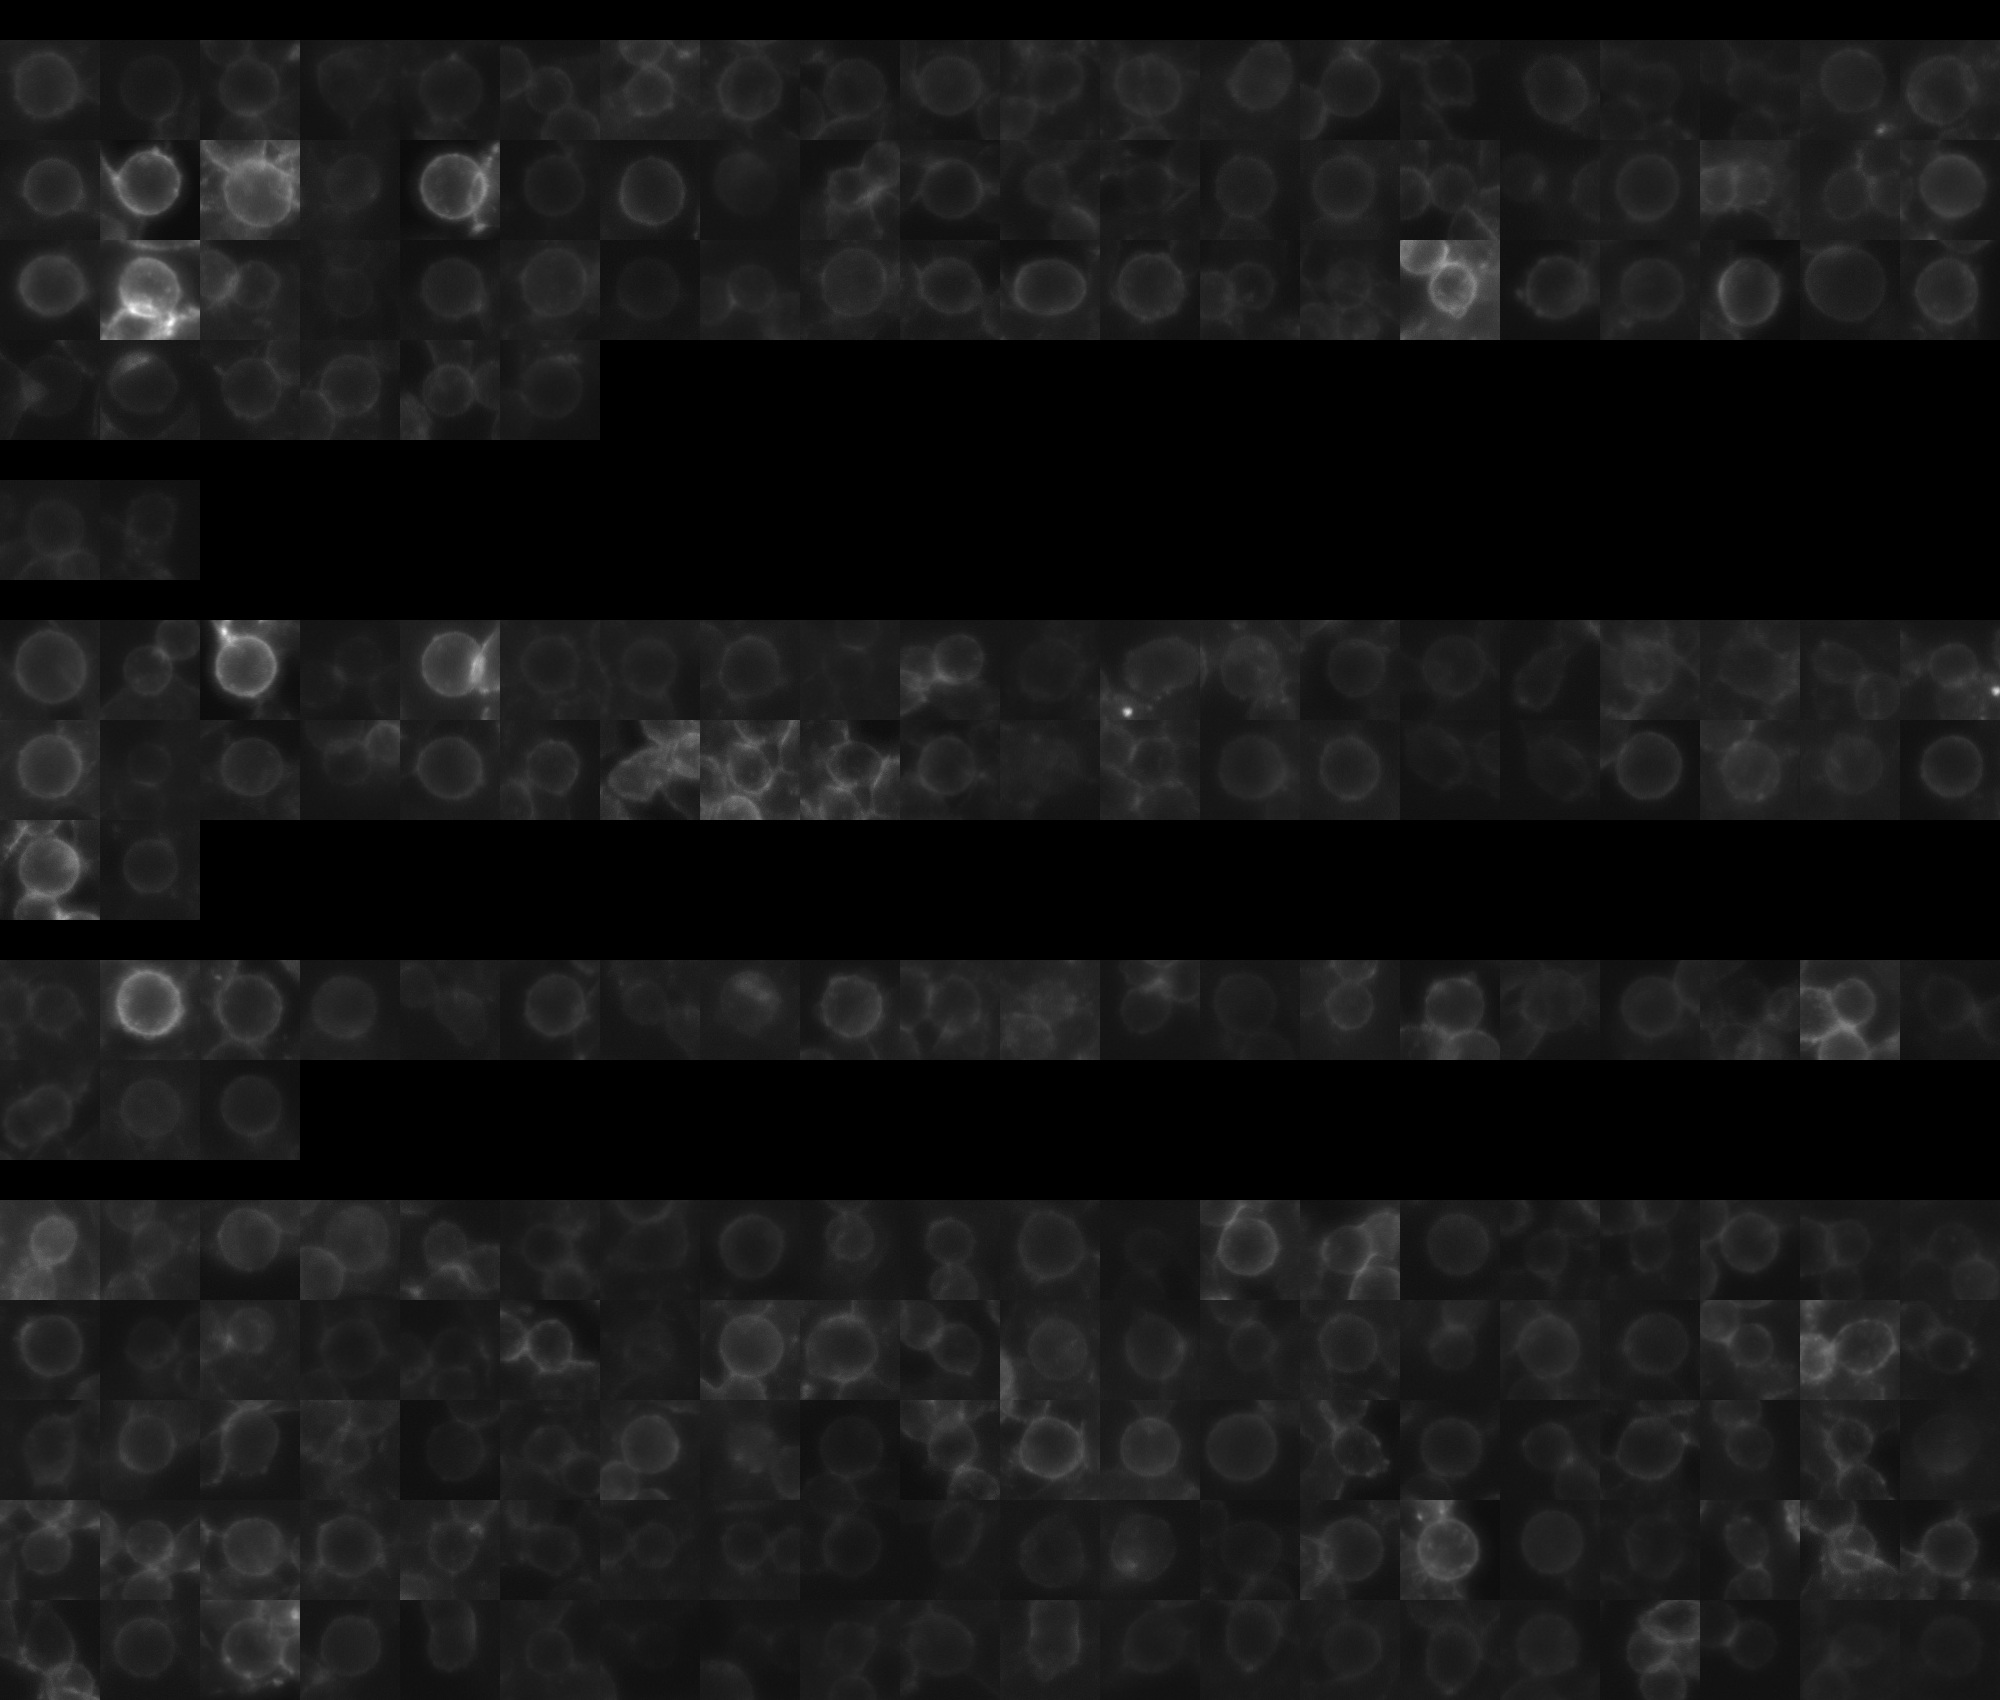
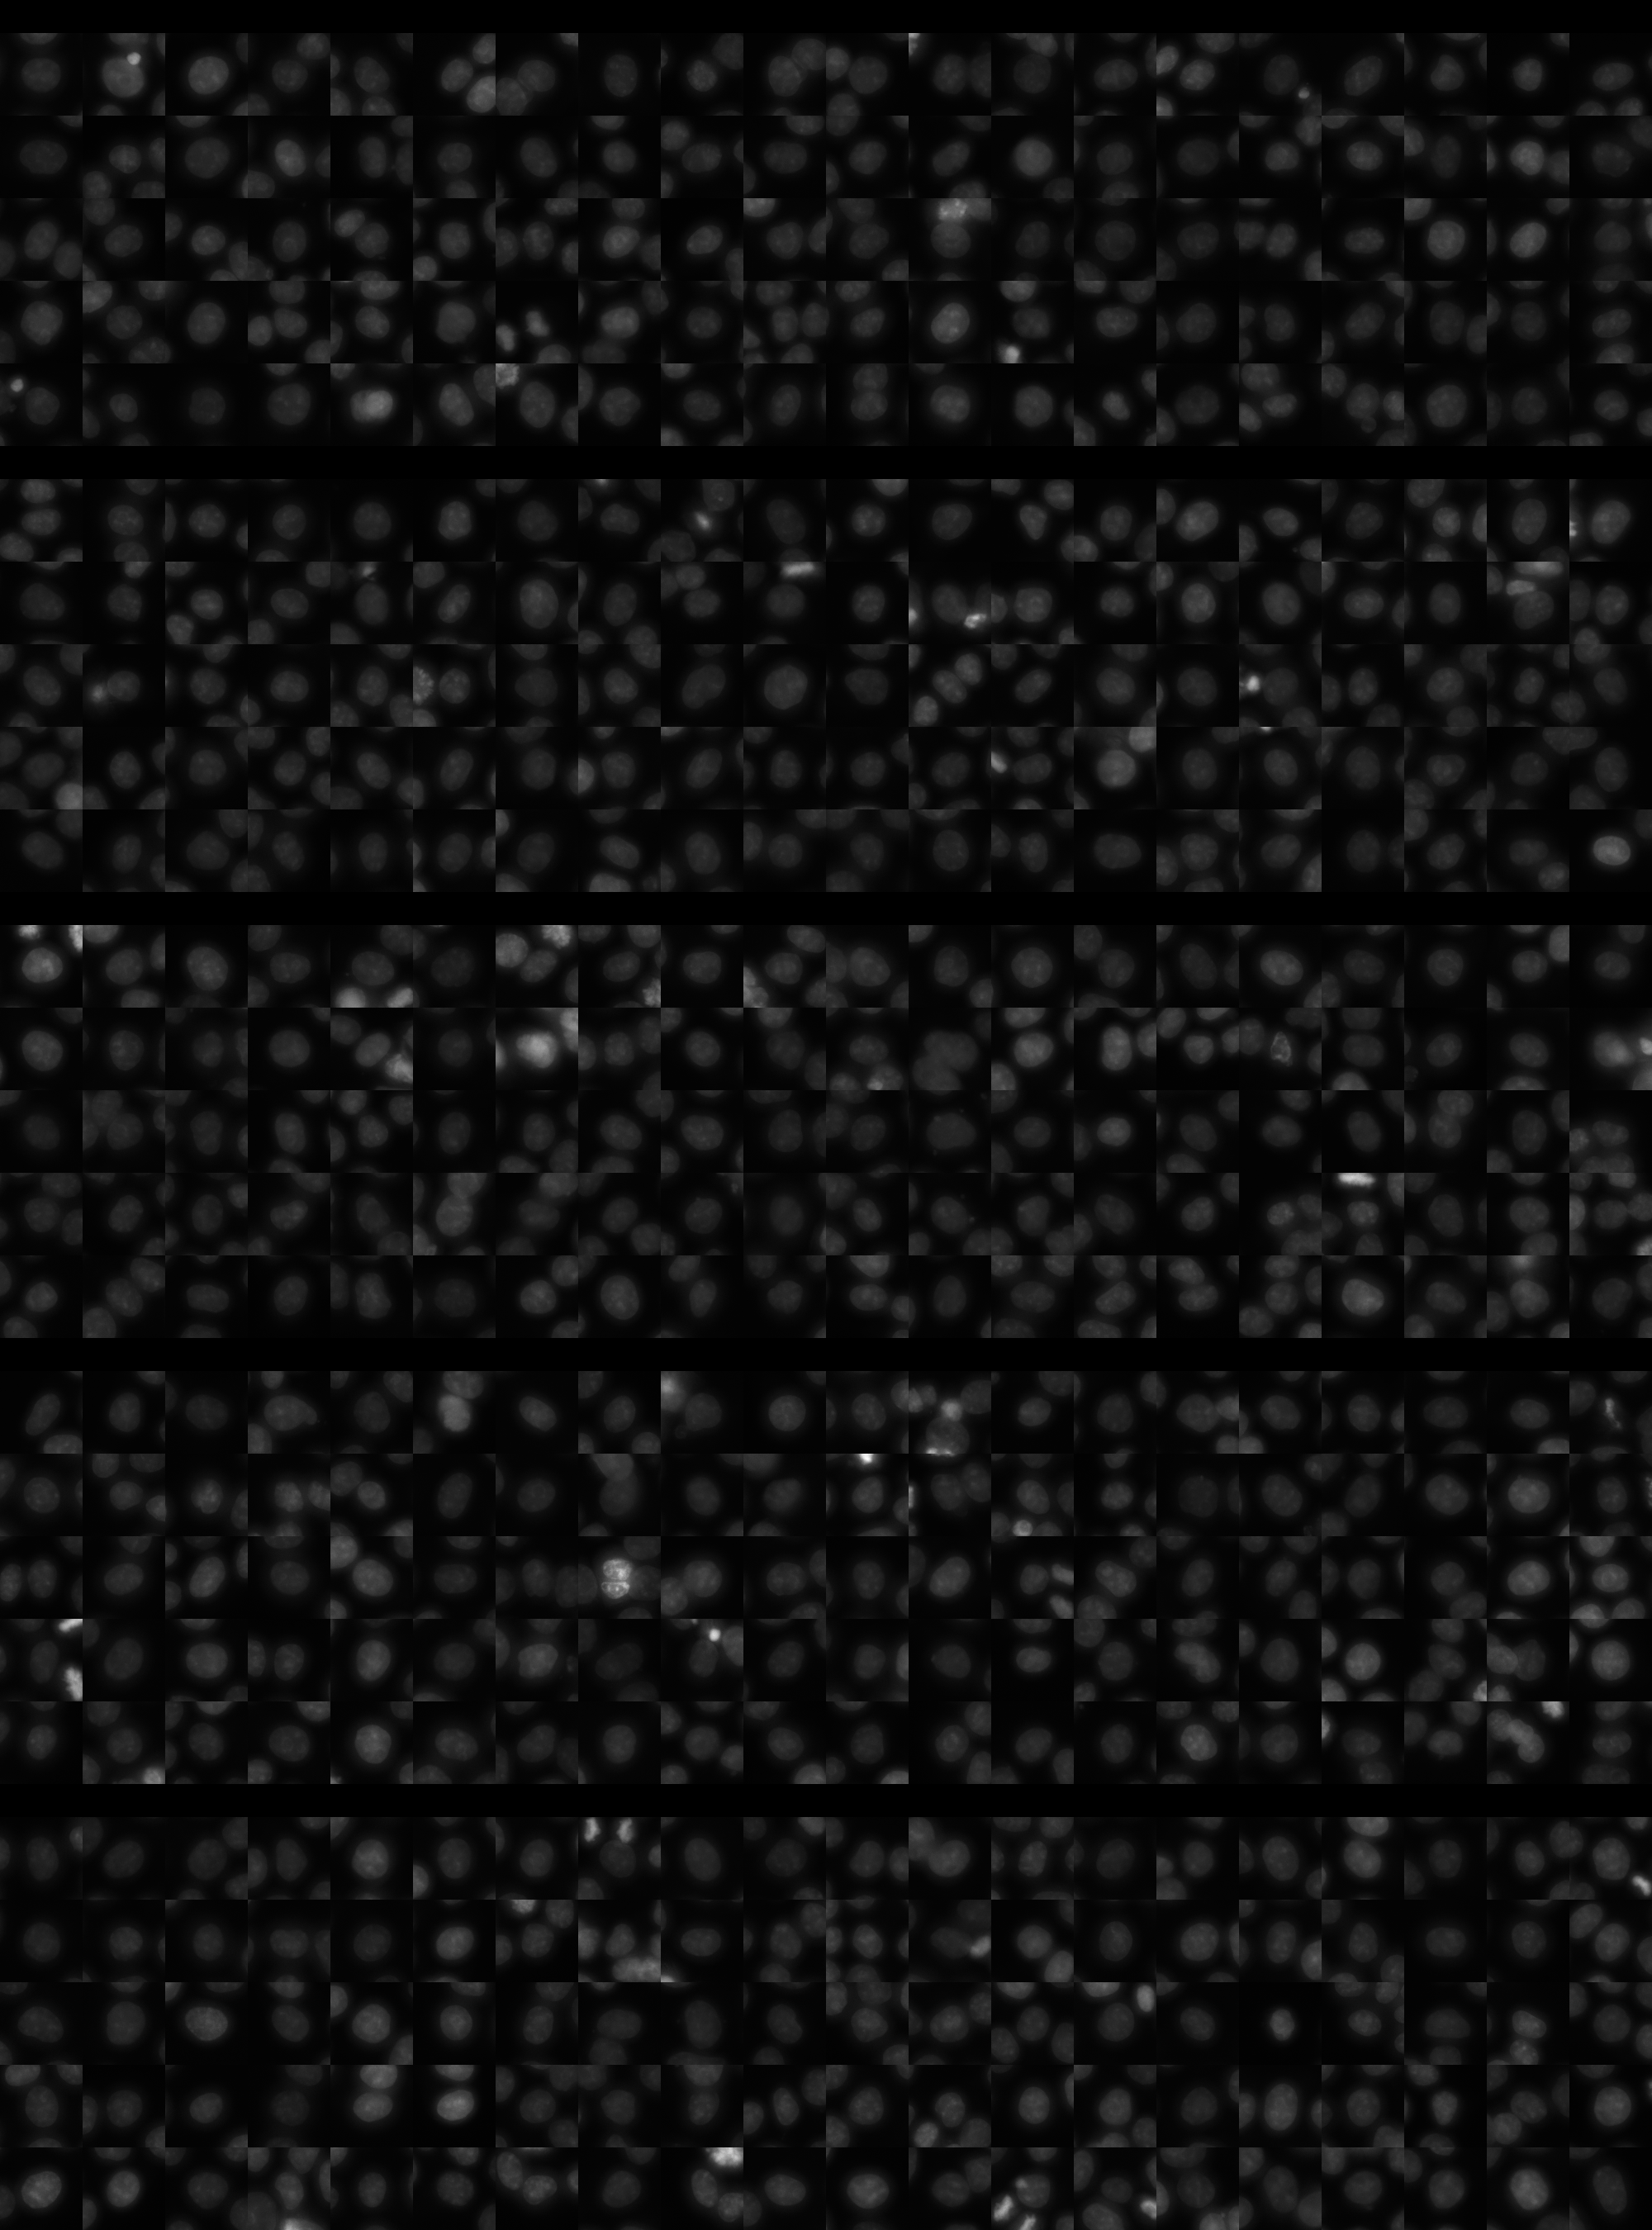
Each montage below shows randomly selected individual cell images for the same target gene separated by sgRNA, along with an example montage of cells expressing a non-targeting negative control sgRNA at the bottom. sgRNA labels in the montages correspond to the numbered sgRNA sequences in the gene info table above. The DNA (blue) and tubulin (green) channels are displayed by default, with gH2AX (grayscale) and actin (yellow) available using the check boxes. Channel brightness, contrast, and opacity are adjustable by clicking the arrow next to the channel name. When only one channel is selected, the display defaults to grayscale. Click the “Zoom” checkbox above the channel controls to enable image zooming (via scrolling) and panning (via click-and-drag).

The cell boxes displayed for this gene are square, 30.36 μm per side for the interphase montage and 30.36 μm per side for the mitotic montage.
Features

Interphase Score Rank FDR q-value
Nucleus DNA Integrated -8.177e-02 5185 of 5322 0.082
Nucleus DNA Mean -8.605e-02 4387 of 5322 0.060
Nucleus gH2AX Mean 0.099 1965 of 5322 0.028
Nucleus DNA - gH2AX Correlation -8.884e-02 3706 of 5322 0.008
Nucleus Shape Area 0.031 2248 of 5322 0.715
Nucleus Shape Eccentricity -2.153e-03 3459 of 5322 0.999
Nucleus Shape Form Factor -1.189e-01 4687 of 5322 0.007
Nucleus Shape Solidity -8.131e-02 3864 of 5322 0.032
Cell DNA Mass Displacement 0.079 404 of 5322 0.136
Cell Tubulin Mean -1.669e-02 3427 of 5322 0.834
Cell Tubulin Mass Displacement 0.056 525 of 5322 0.254
Cell Actin Mean 0.069 1207 of 5322 0.199
Cell Tubulin - Actin Correlation 0.002 3580 of 5322 0.969
Cell DNA - Tubulin Correlation 0.058 1694 of 5322 0.168
Cell Shape Area 0.056 1339 of 5322 0.458
Cell Shape Eccentricity 0.044 766 of 5322 0.529
Mitotic Score Rank FDR q-value
Nucleus DNA Integrated 0.259 773 of 5322 0.837
Nucleus DNA Mean 0.117 1267 of 5322 1.000
Nucleus DNA Mass Displacement 0.267 384 of 5322 0.999
Nucleus DNA Mean Frac 3 0.277 275 of 5322 1.000
Nucleus gH2AX Mean -5.600e-02 3738 of 5322 1.000
Nucleus gH2AX Mean Frac 0 -9.103e-02 3688 of 5322 1.000
Nucleus Tubulin Mean Frac 0 0.228 663 of 5322 0.999
Nucleus Tubulin Mean Edge 0.060 2385 of 5322 0.999
Nucleus Tubulin Std Edge -5.357e-02 3308 of 5322 0.999
Nucleus Shape Area -5.195e-03 4006 of 5322 0.990
Nucleus Shape Eccentricity 0.012 1910 of 5322 1.000
Nucleus Shape Form Factor -1.055e-01 2933 of 5322 0.998
Cell Tubulin Mean 0.304 418 of 5322 0.957
Cell Tubulin Mean Frac 3 -1.454e-01 3501 of 5322 0.999
Cell Actin Mean 0.104 1838 of 5322 0.997
Cell Shape Area 0.037 3435 of 5322 0.999
( Reset Zoom )
Brightness
Contrast
Opacity
Brightness
Contrast
Opacity
Brightness
Contrast
Opacity
Brightness
Contrast
Opacity
Brightness
Contrast
Opacity

( Reset Zoom )
Brightness
Contrast
Opacity
Brightness
Contrast
Opacity
Brightness
Contrast
Opacity
Brightness
Contrast
Opacity
Brightness
Contrast
Opacity

MIT Central Accessability