BUB1B

Due to sgRNA sequence design constraints two or more of the sgRNAs used to target this gene have multiple genomic target sites, potentially impacting the observed phenotype through increased DNA damage.
Gene symbol: BUB1B
Gene: 701
Uniprot Function: Essential component of the mitotic checkpoint. Required for normal mitosis progression. The mitotic checkpoint delays anaphase until all chromosomes are properly attached to the mitotic spindle. One of its checkpoint functions is to inhibit the activity of the anaphase-promoting complex/cyclosome (APC/C) by blocking the binding of CDC20 to APC/C, independently of its kinase activity. The other is to monitor kinetochore activities that depend on the kinetochore motor CENPE. Required for kinetochore localization of CENPE. Negatively regulates PLK1 activity in interphase cells and suppresses centrosome amplification. Also implicated in triggering apoptosis in polyploid cells that exit aberrantly from mitotic arrest. May play a role for tumor suppression.
Mitotic Index 0.014
Interphase Cluster: #148 (19 genes)
Mitotic Cluster: #13 (43 genes)
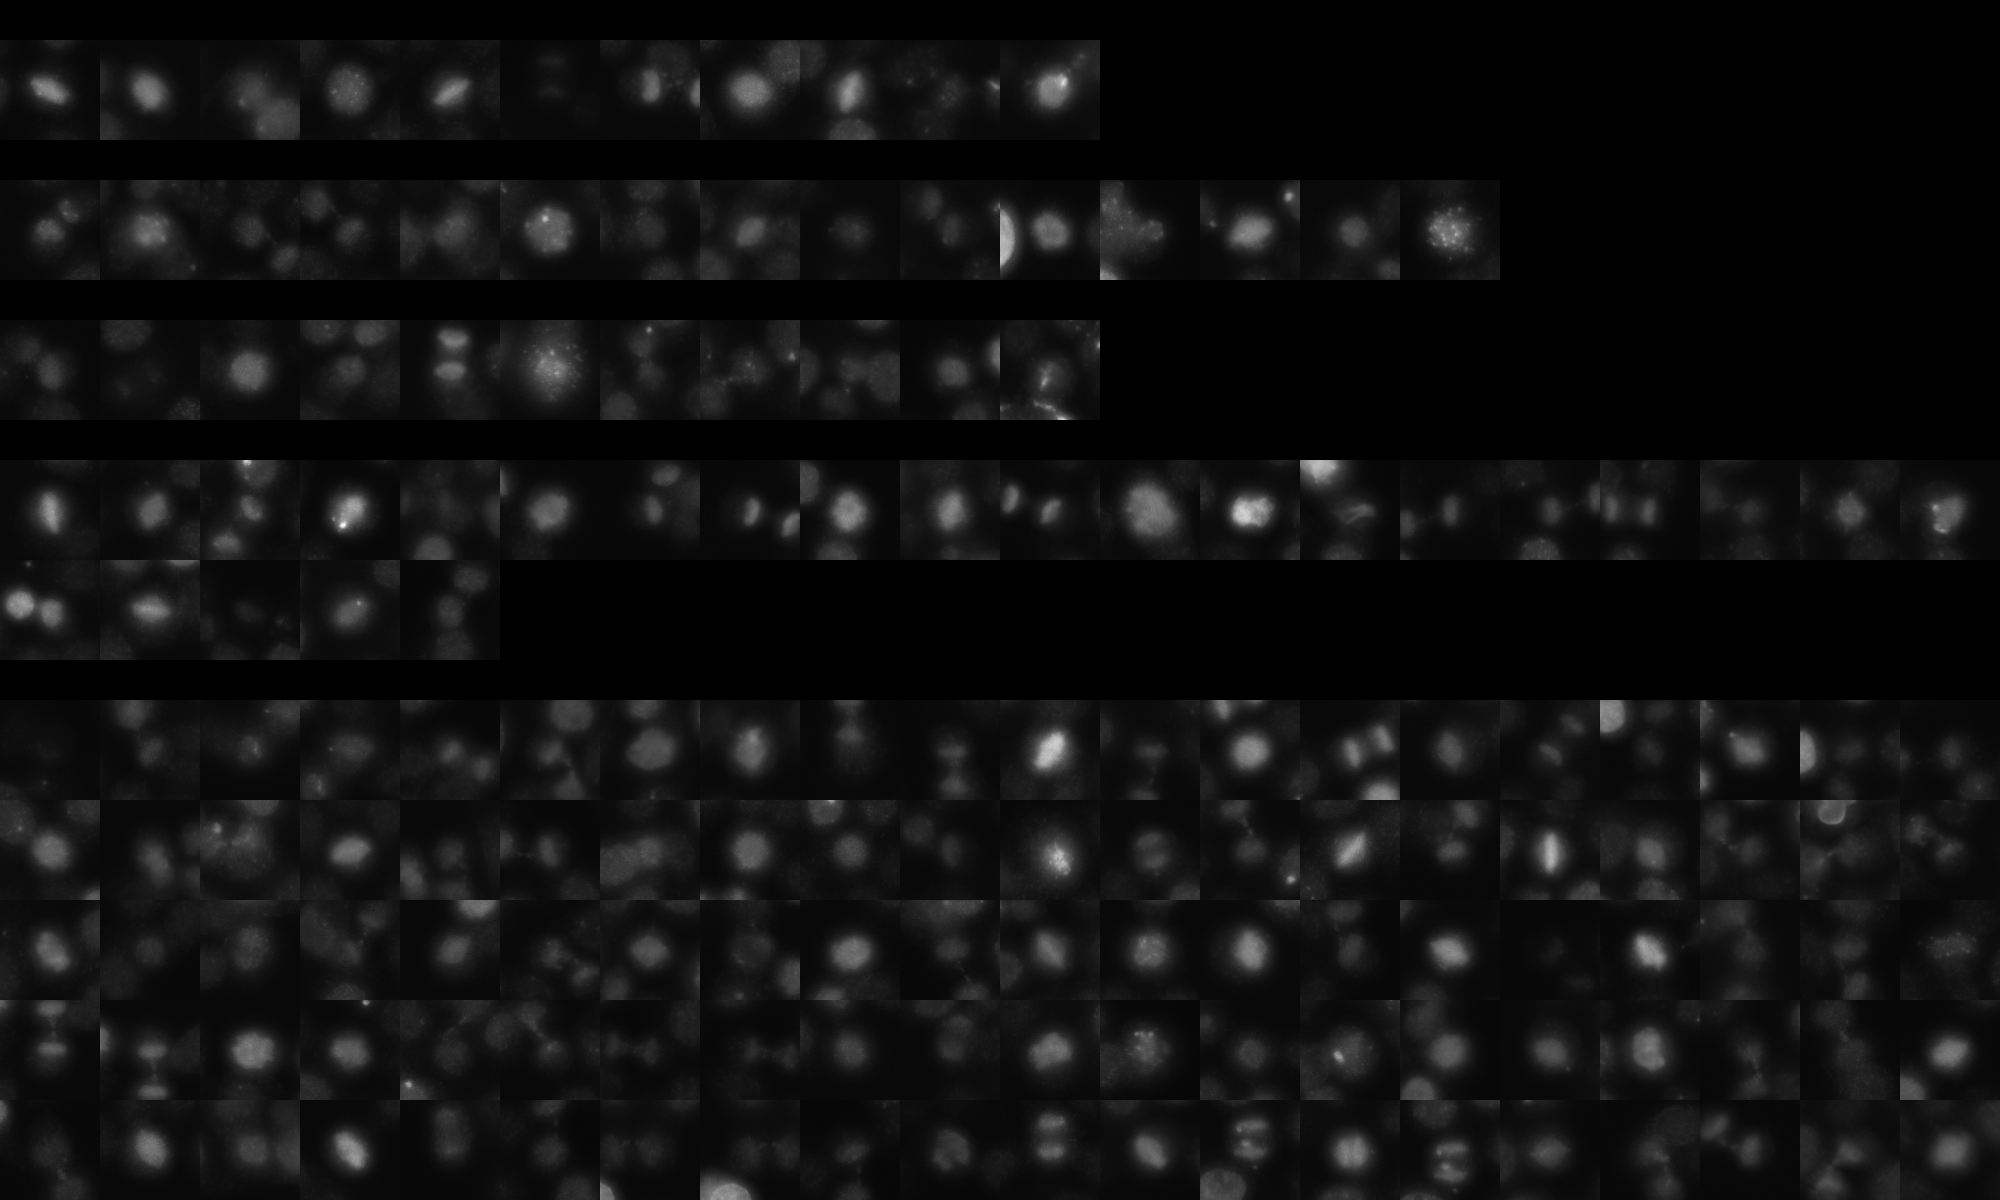
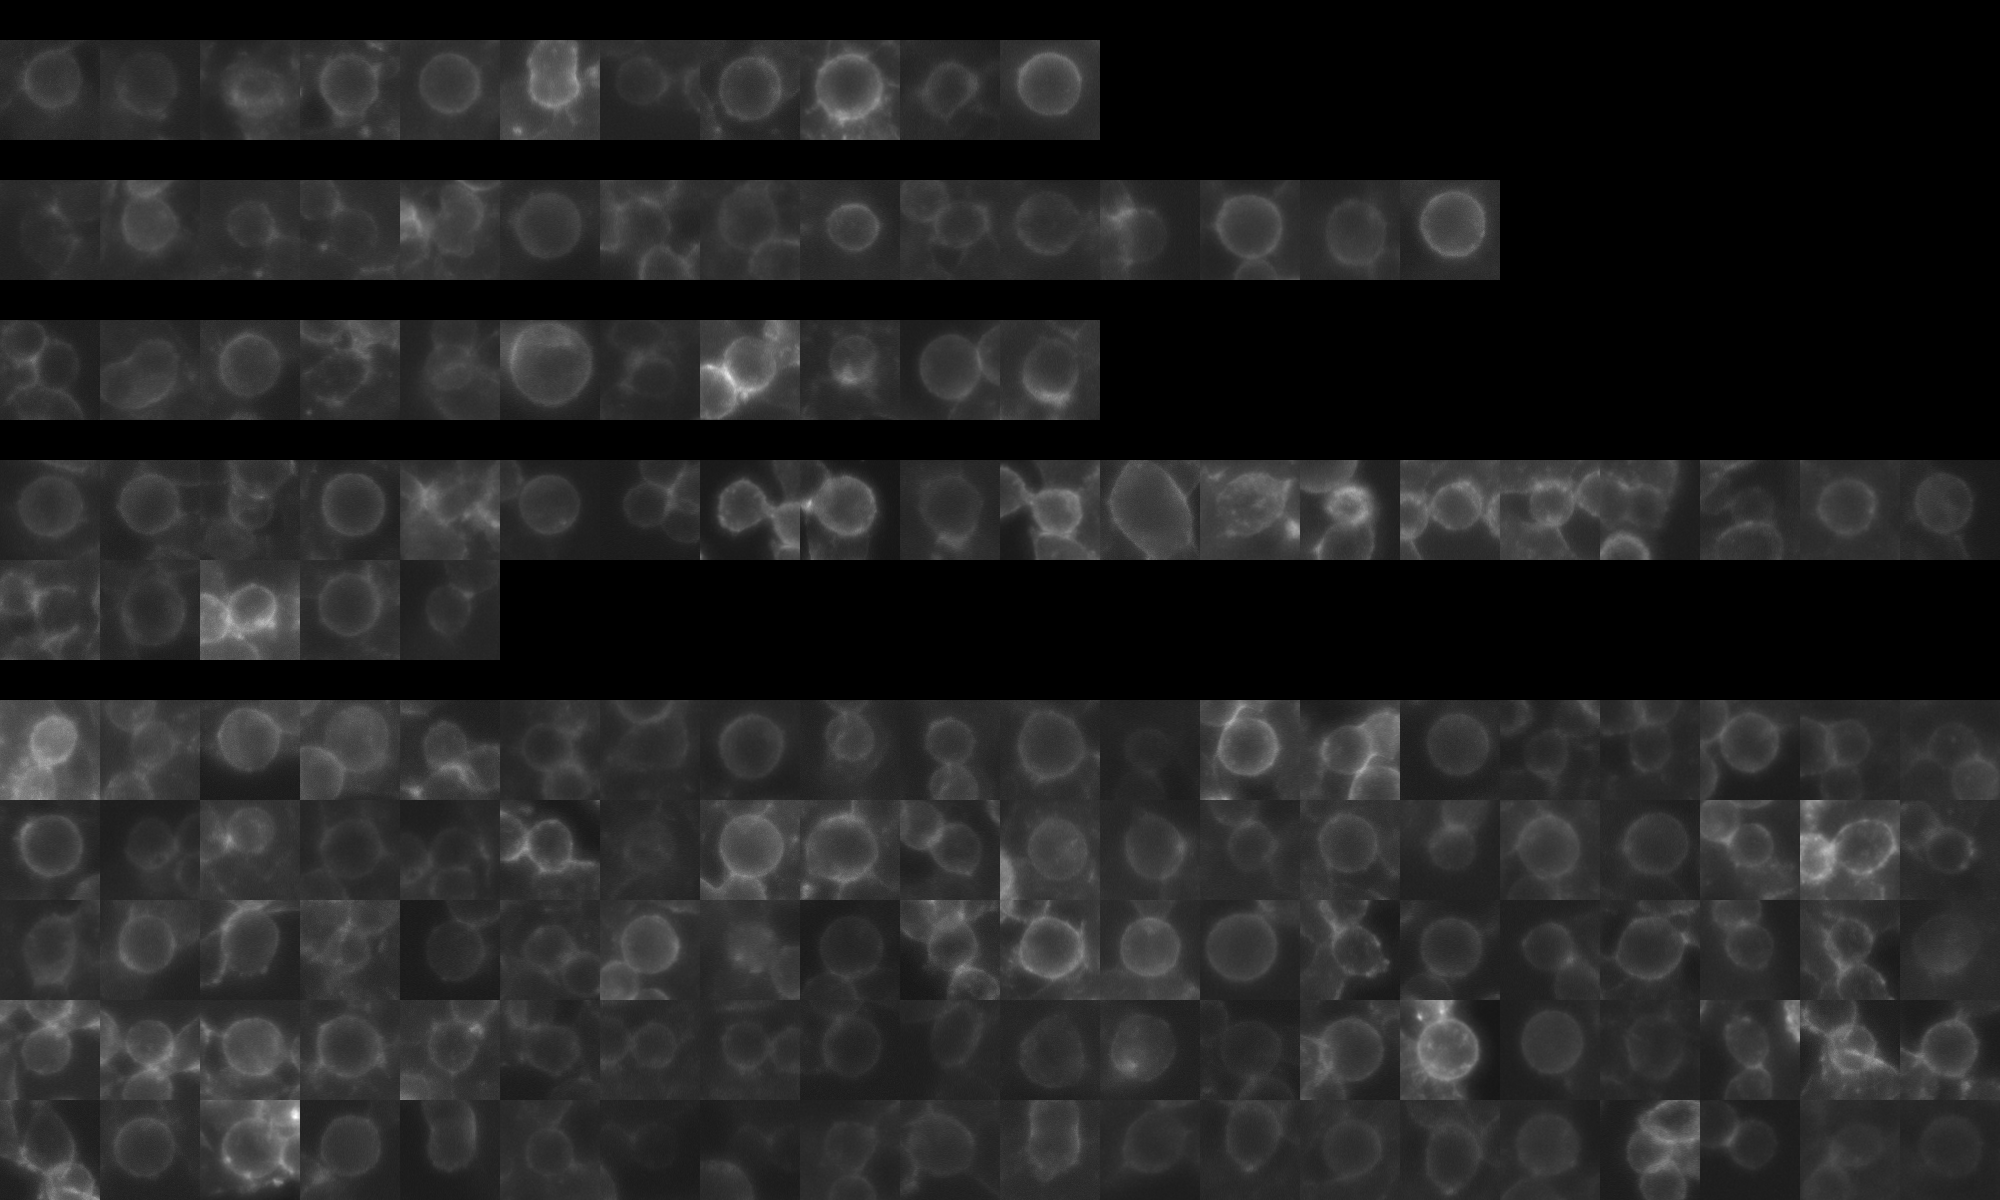
sgRNA 1: AGTGAAGCTGTATTGCCACG (interphase cells: 859, mitotic cells: 11)
sgRNA 2: GAGCAGAACTATCCTCAAGG (interphase cells: 1219, mitotic cells: 15)
sgRNA 3: GCAGATGCGATATTTCAGGA (interphase cells: 839, mitotic cells: 11)
sgRNA 4: TCACAGTGAAGCCATGTCCC (interphase cells: 1435, mitotic cells: 25)

Interphase Cluster

Mitotic Cluster

Overview

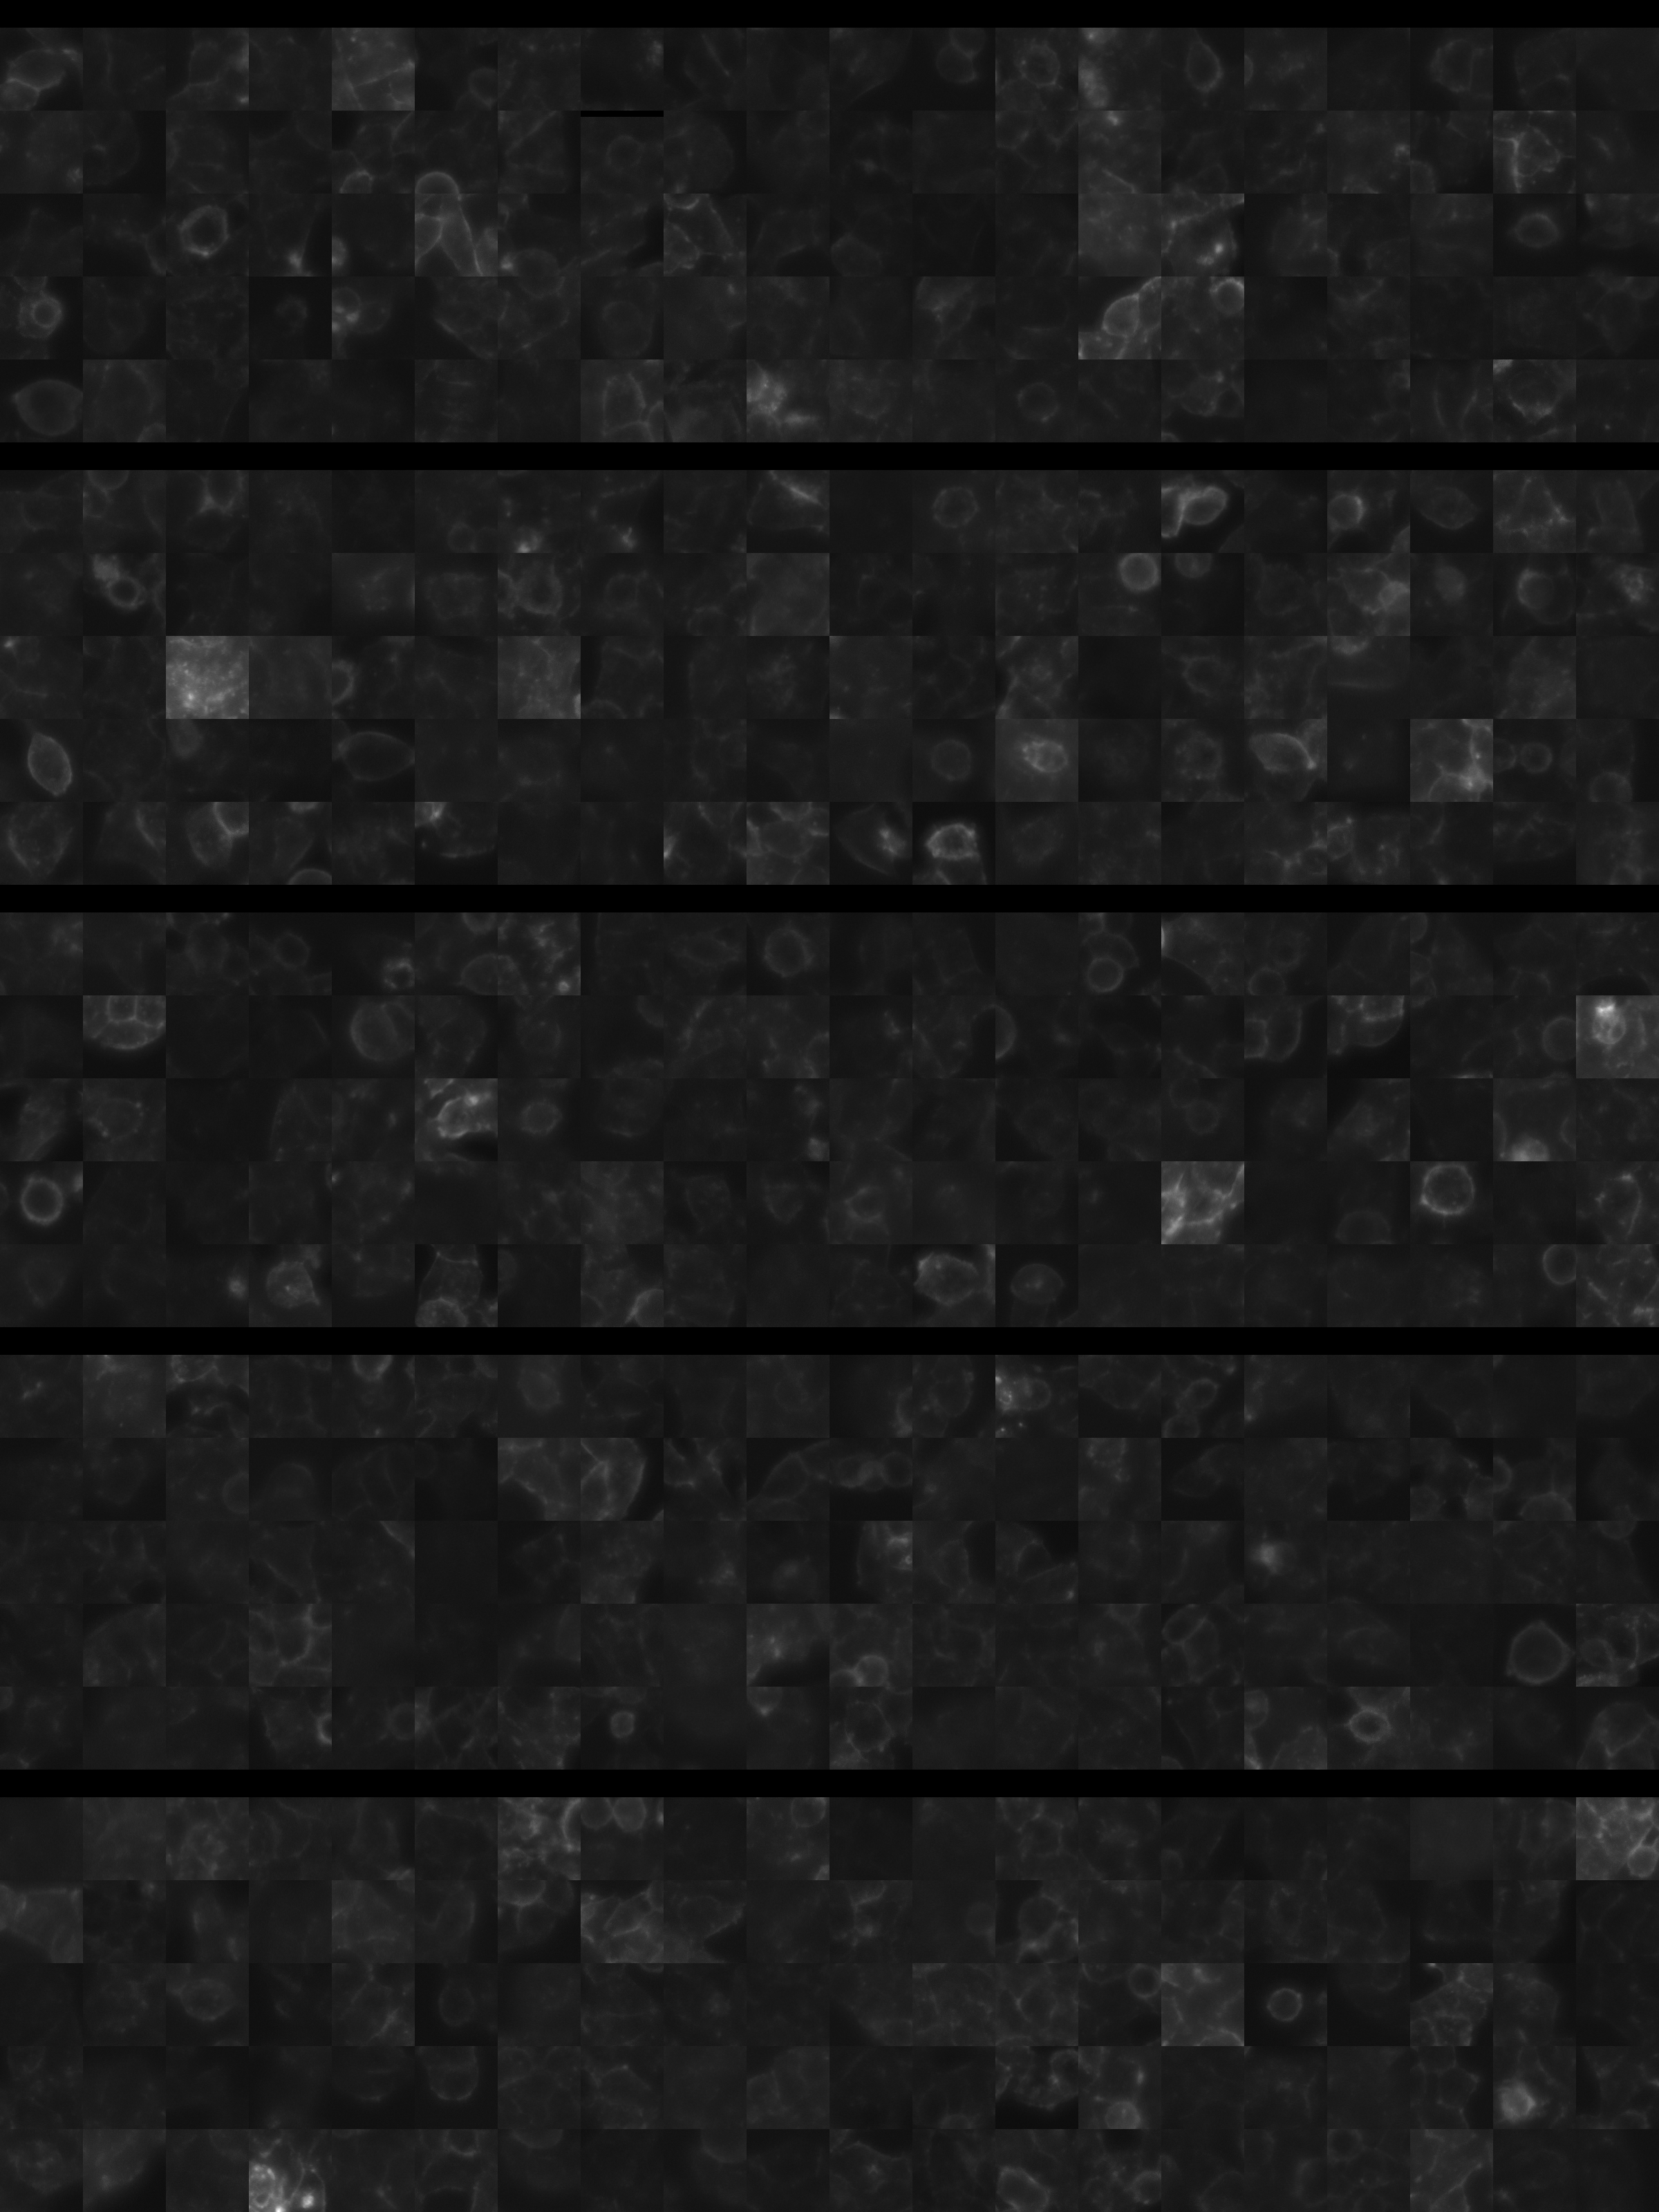
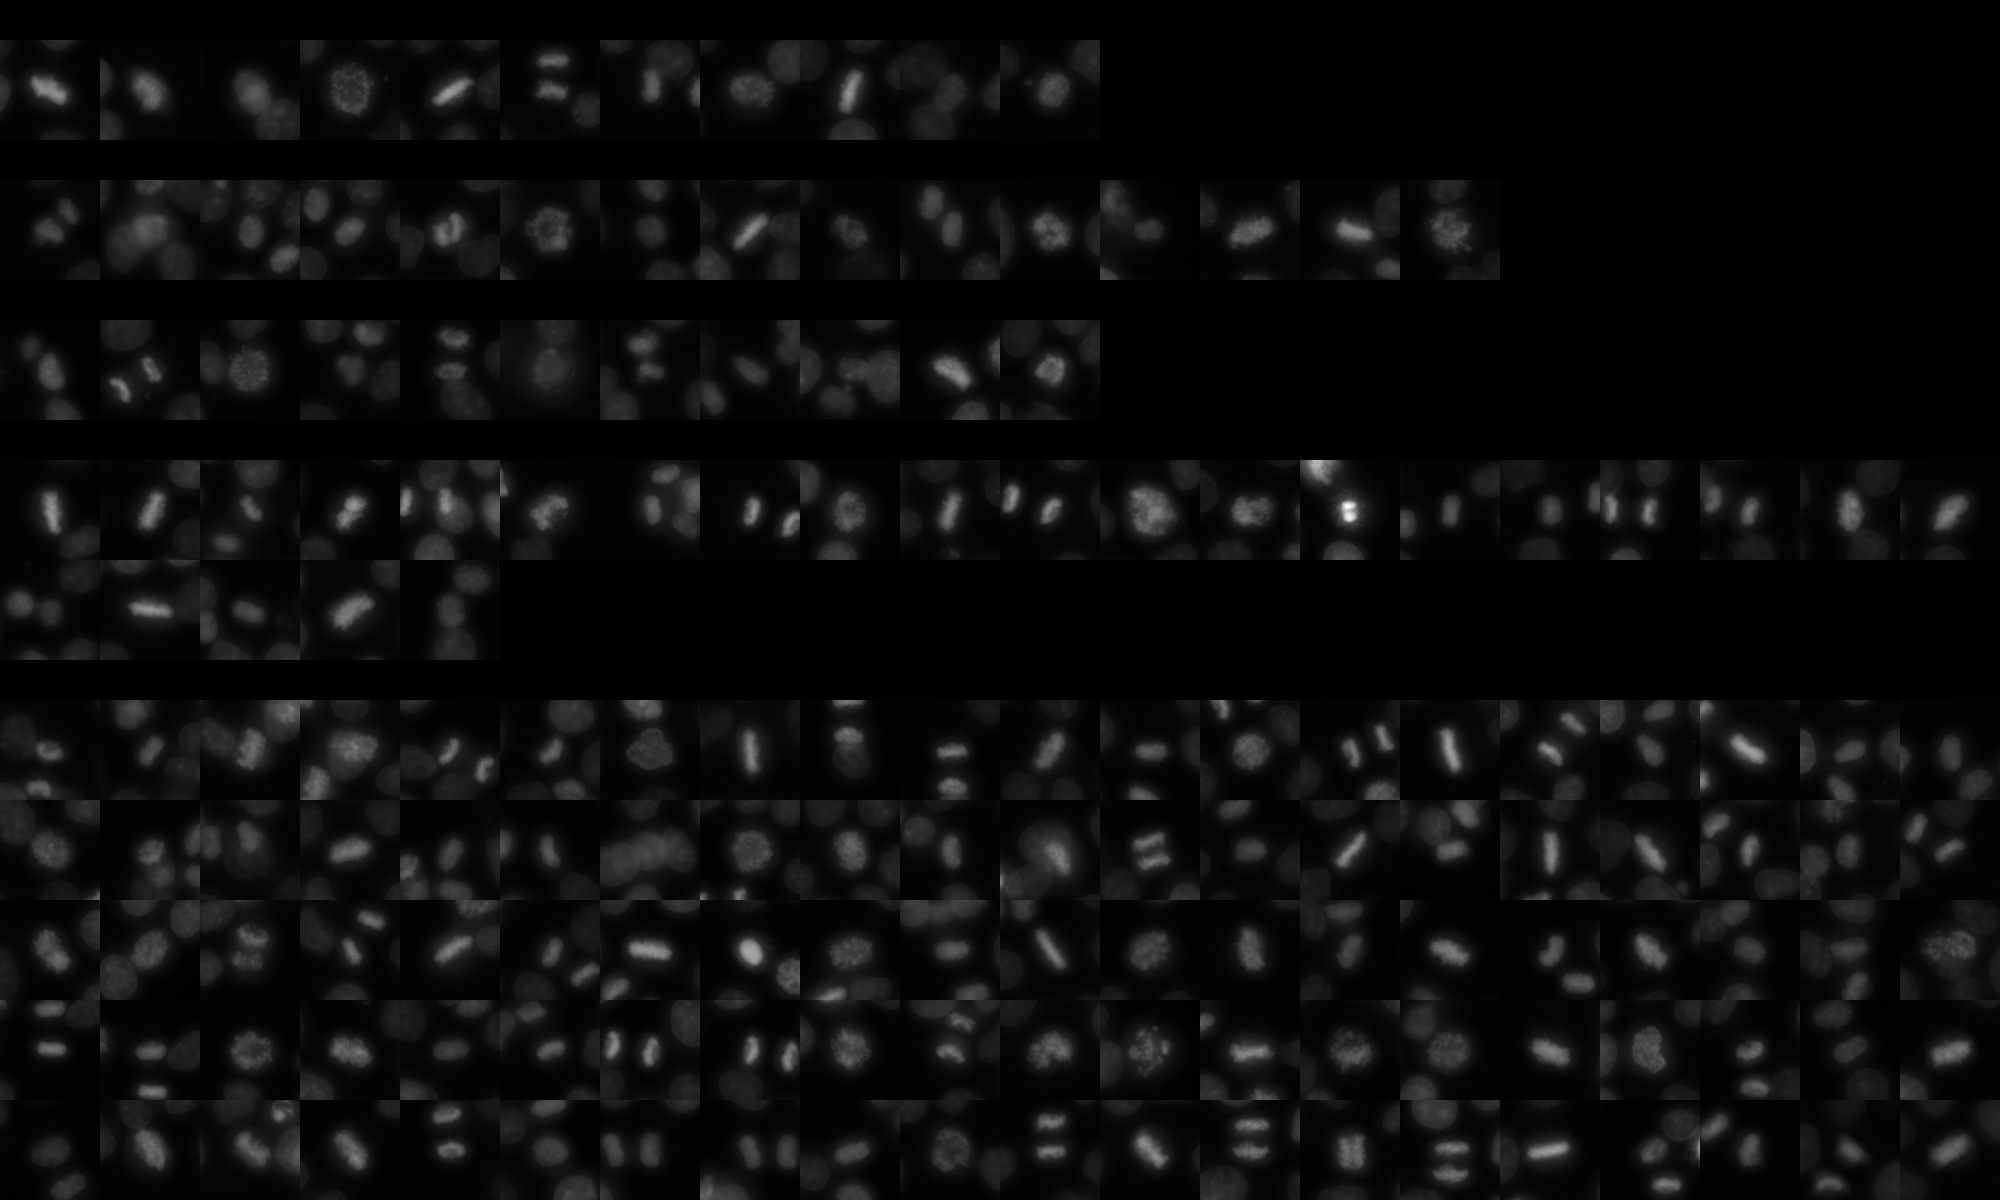
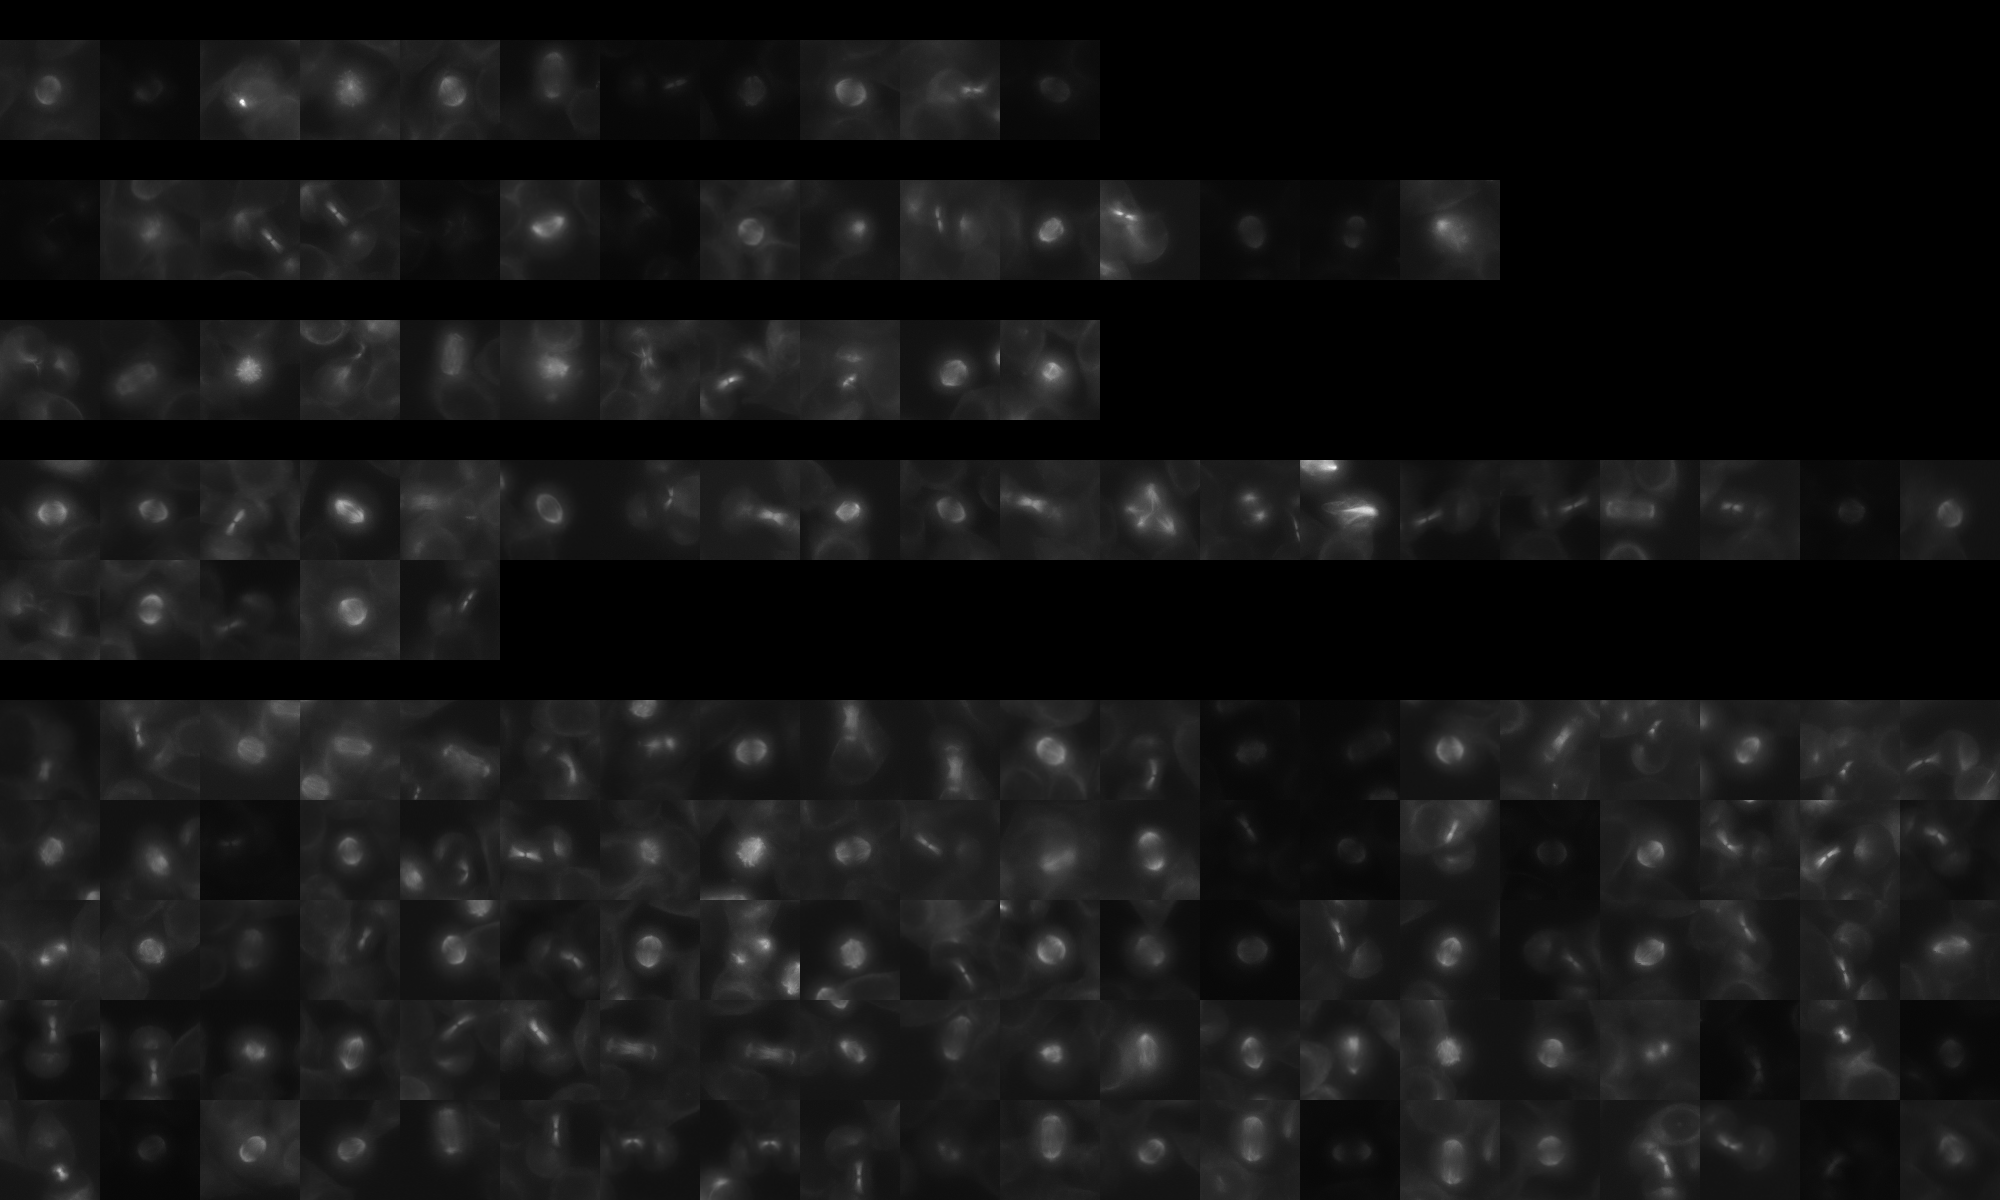
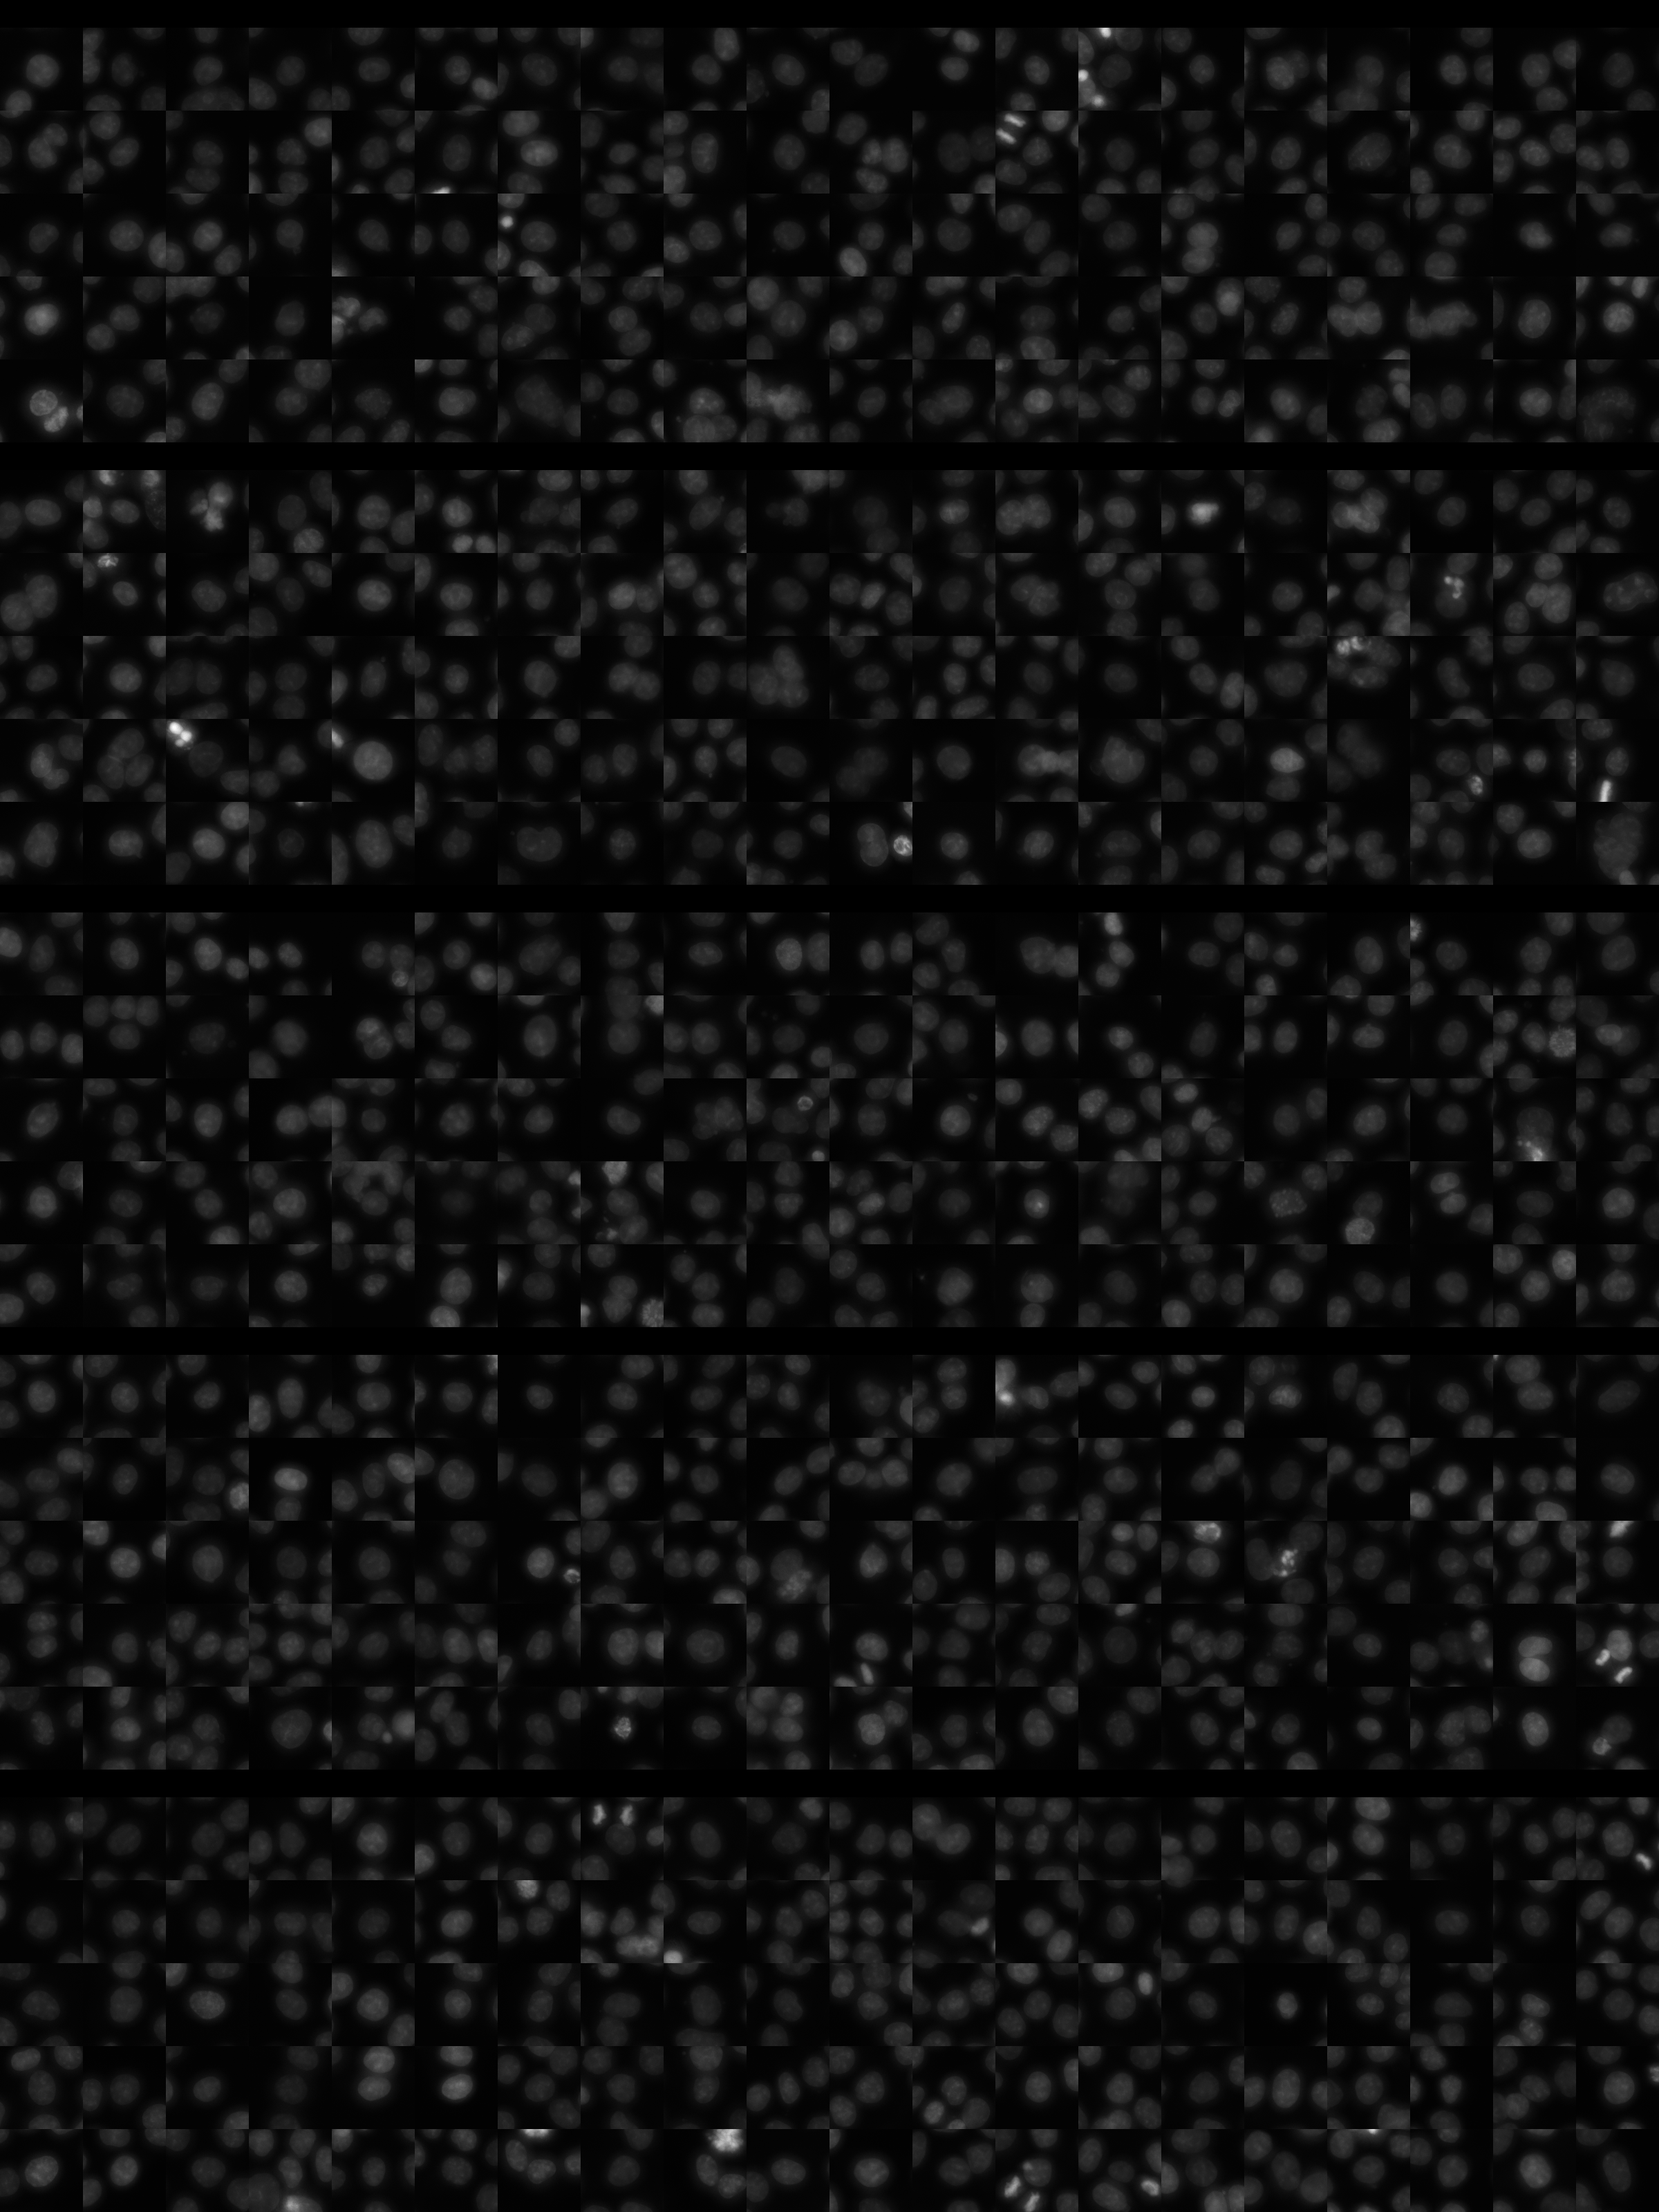
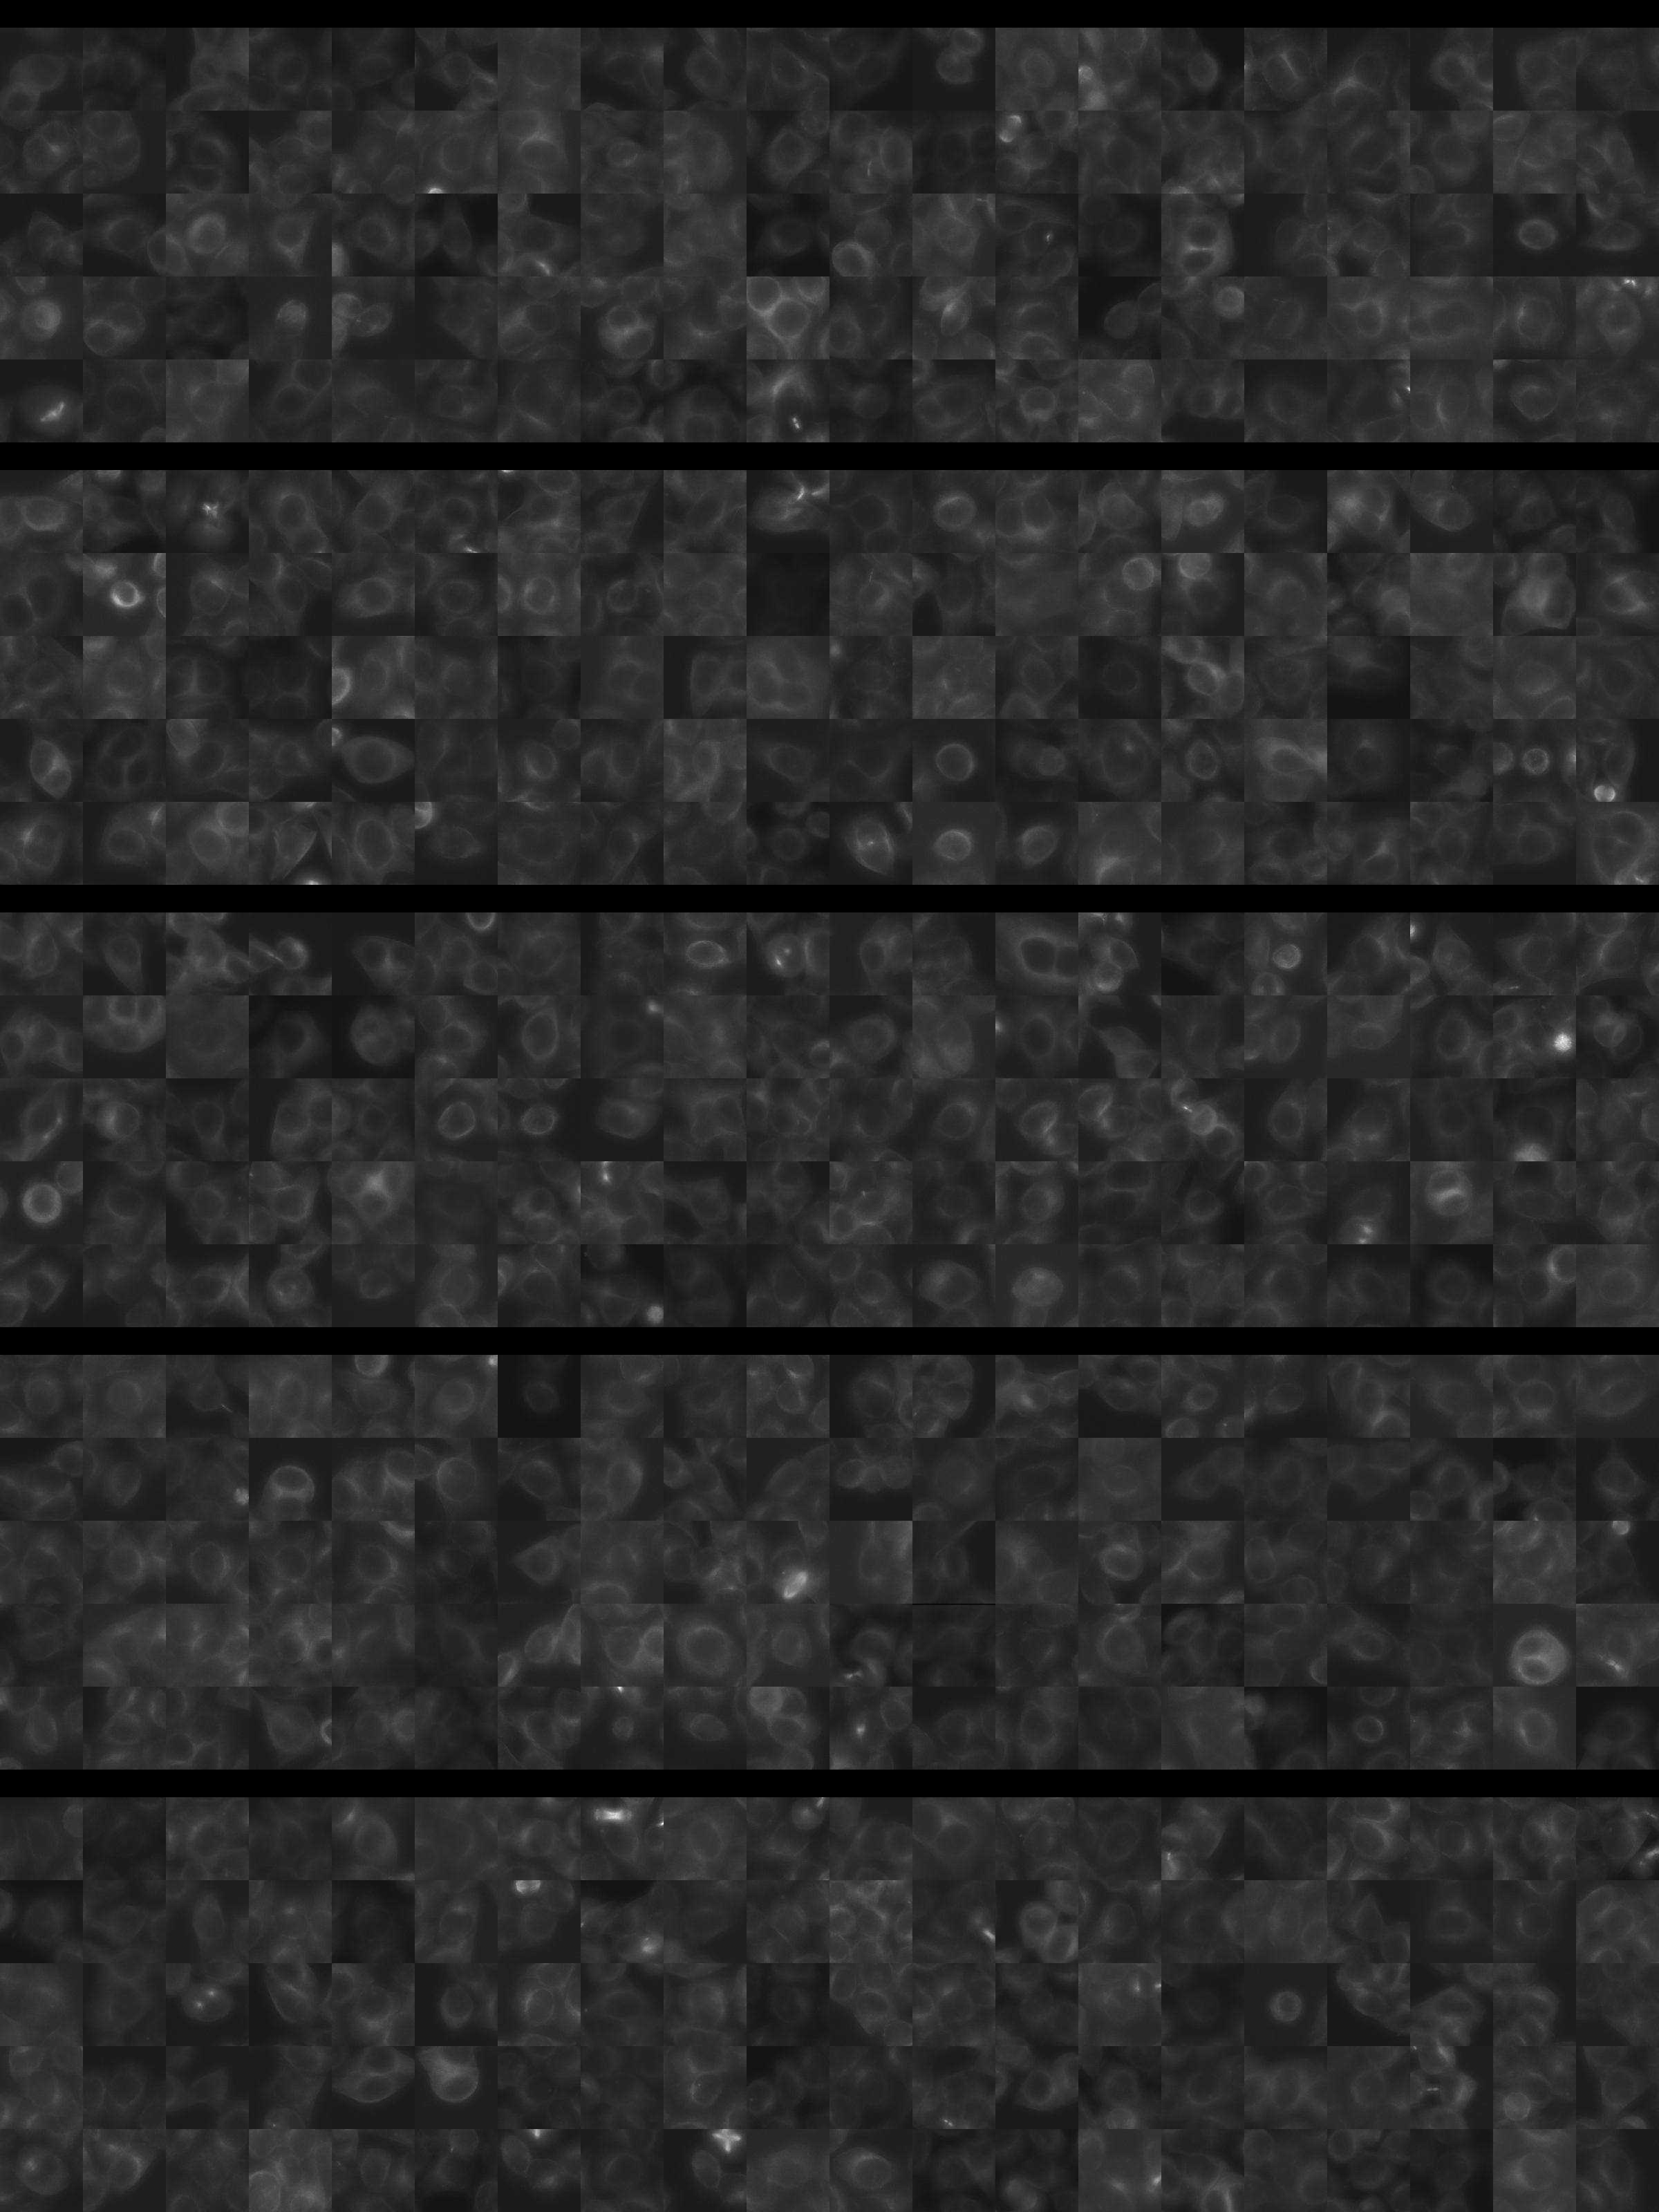
Each montage below shows randomly selected individual cell images for the same target gene separated by sgRNA, along with an example montage of cells expressing a non-targeting negative control sgRNA at the bottom. sgRNA labels in the montages correspond to the numbered sgRNA sequences in the gene info table above. The DNA (blue) and tubulin (green) channels are displayed by default, with gH2AX (grayscale) and actin (yellow) available using the check boxes. Channel brightness, contrast, and opacity are adjustable by clicking the arrow next to the channel name. When only one channel is selected, the display defaults to grayscale. Click the “Zoom” checkbox above the channel controls to enable image zooming (via scrolling) and panning (via click-and-drag).

The cell boxes displayed for this gene are square, 36.43 μm per side for the interphase montage and 30.36 μm per side for the mitotic montage.
Features

Interphase Score Rank FDR q-value
Nucleus DNA Integrated 0.225 146 of 5322 5.407e-04
Nucleus DNA Mean 0.099 496 of 5322 0.016
Nucleus gH2AX Mean 0.327 243 of 5322 1.367e-04
Nucleus DNA - gH2AX Correlation -2.542e-01 5230 of 5322 1.021e-04
Nucleus Shape Area 0.091 810 of 5322 0.088
Nucleus Shape Eccentricity -2.540e-02 4376 of 5322 0.657
Nucleus Shape Form Factor -2.034e-01 5197 of 5322 2.872e-04
Nucleus Shape Solidity -1.497e-01 4879 of 5322 1.903e-04
Cell DNA Mass Displacement 0.164 60 of 5322 0.001
Cell Tubulin Mean 0.067 817 of 5322 0.117
Cell Tubulin Mass Displacement 0.128 127 of 5322 3.984e-04
Cell Actin Mean 0.152 468 of 5322 3.322e-04
Cell Tubulin - Actin Correlation 0.122 421 of 5322 7.831e-04
Cell DNA - Tubulin Correlation 0.038 2313 of 5322 0.372
Cell Shape Area 0.178 252 of 5322 0.001
Cell Shape Eccentricity 0.054 467 of 5322 0.365
Mitotic Score Rank FDR q-value
Nucleus DNA Integrated 0.017 3706 of 5322 0.996
Nucleus DNA Mean -1.603e-01 4763 of 5322 1.000
Nucleus DNA Mass Displacement 0.018 3230 of 5322 0.999
Nucleus DNA Mean Frac 3 0.112 1418 of 5322 1.000
Nucleus gH2AX Mean 0.314 313 of 5322 1.000
Nucleus gH2AX Mean Frac 0 -1.333e-01 4221 of 5322 1.000
Nucleus Tubulin Mean Frac 0 -8.908e-02 4595 of 5322 0.999
Nucleus Tubulin Mean Edge 0.069 2263 of 5322 0.999
Nucleus Tubulin Std Edge -1.683e-01 4461 of 5322 0.999
Nucleus Shape Area -2.832e-02 4248 of 5322 0.990
Nucleus Shape Eccentricity -8.497e-01 5295 of 5322 0.768
Nucleus Shape Form Factor -7.810e-02 2542 of 5322 0.998
Cell Tubulin Mean 0.116 1841 of 5322 0.997
Cell Tubulin Mean Frac 3 0.088 814 of 5322 0.999
Cell Actin Mean -5.442e-03 3280 of 5322 1.000
Cell Shape Area 0.120 2322 of 5322 0.998
( Reset Zoom )
Brightness
Contrast
Opacity
Brightness
Contrast
Opacity
Brightness
Contrast
Opacity
Brightness
Contrast
Opacity
Brightness
Contrast
Opacity

( Reset Zoom )
Brightness
Contrast
Opacity
Brightness
Contrast
Opacity
Brightness
Contrast
Opacity
Brightness
Contrast
Opacity
Brightness
Contrast
Opacity

Day 3

Day 4

MIT Central Accessability