BOLA2B

Genes BOLA2 and BOLA2B have high sequence homology and were thus targeted with one combined set of sgRNA sequences; the data and image montages are identical among this set of genes.
Due to sgRNA sequence design constraints two or more of the sgRNAs used to target this gene have multiple genomic target sites, potentially impacting the observed phenotype through increased DNA damage.
Gene symbol: BOLA2B
Gene: 654483
Uniprot Function: Acts as a cytosolic iron-sulfur (Fe-S) cluster assembly factor that facilitates [2Fe-2S] cluster insertion into a subset of cytosolic proteins (PubMed:26613676, PubMed:27519415). Acts together with the monothiol glutaredoxin GLRX3 (PubMed:26613676, PubMed:27519415).
Mitotic Index 0.034
Interphase Cluster: #219 (7 genes)
Mitotic Cluster: #68 (28 genes)
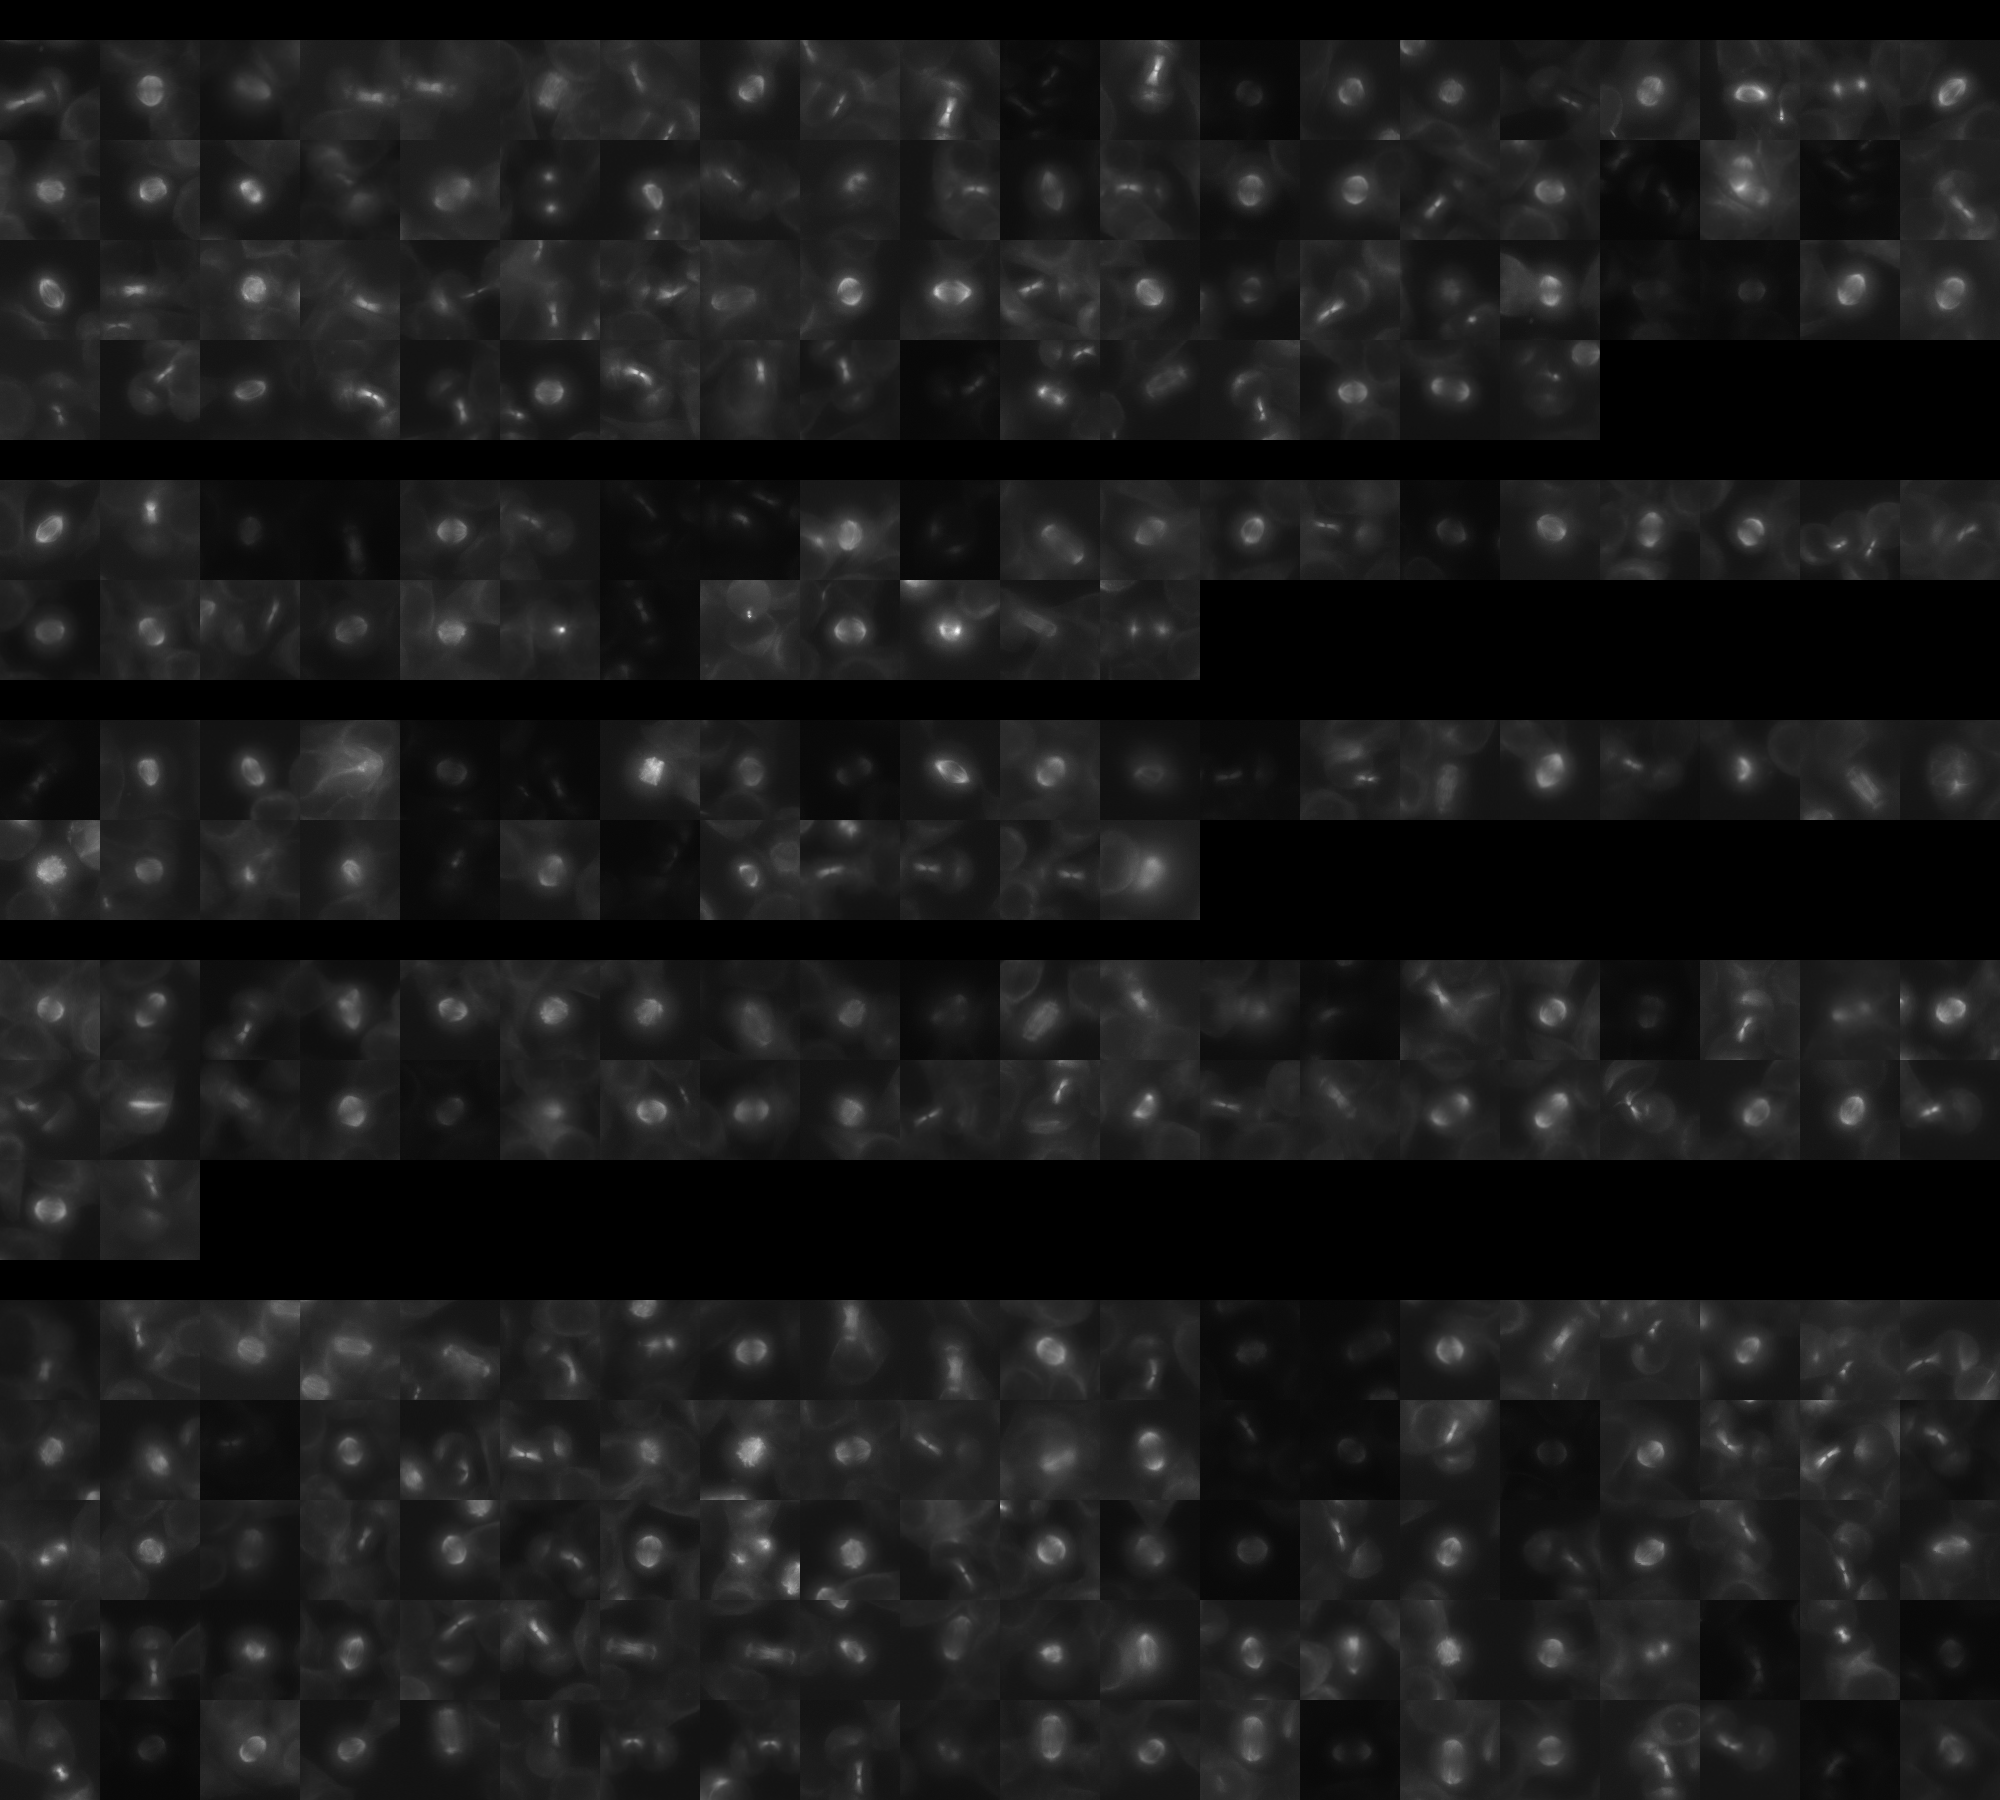
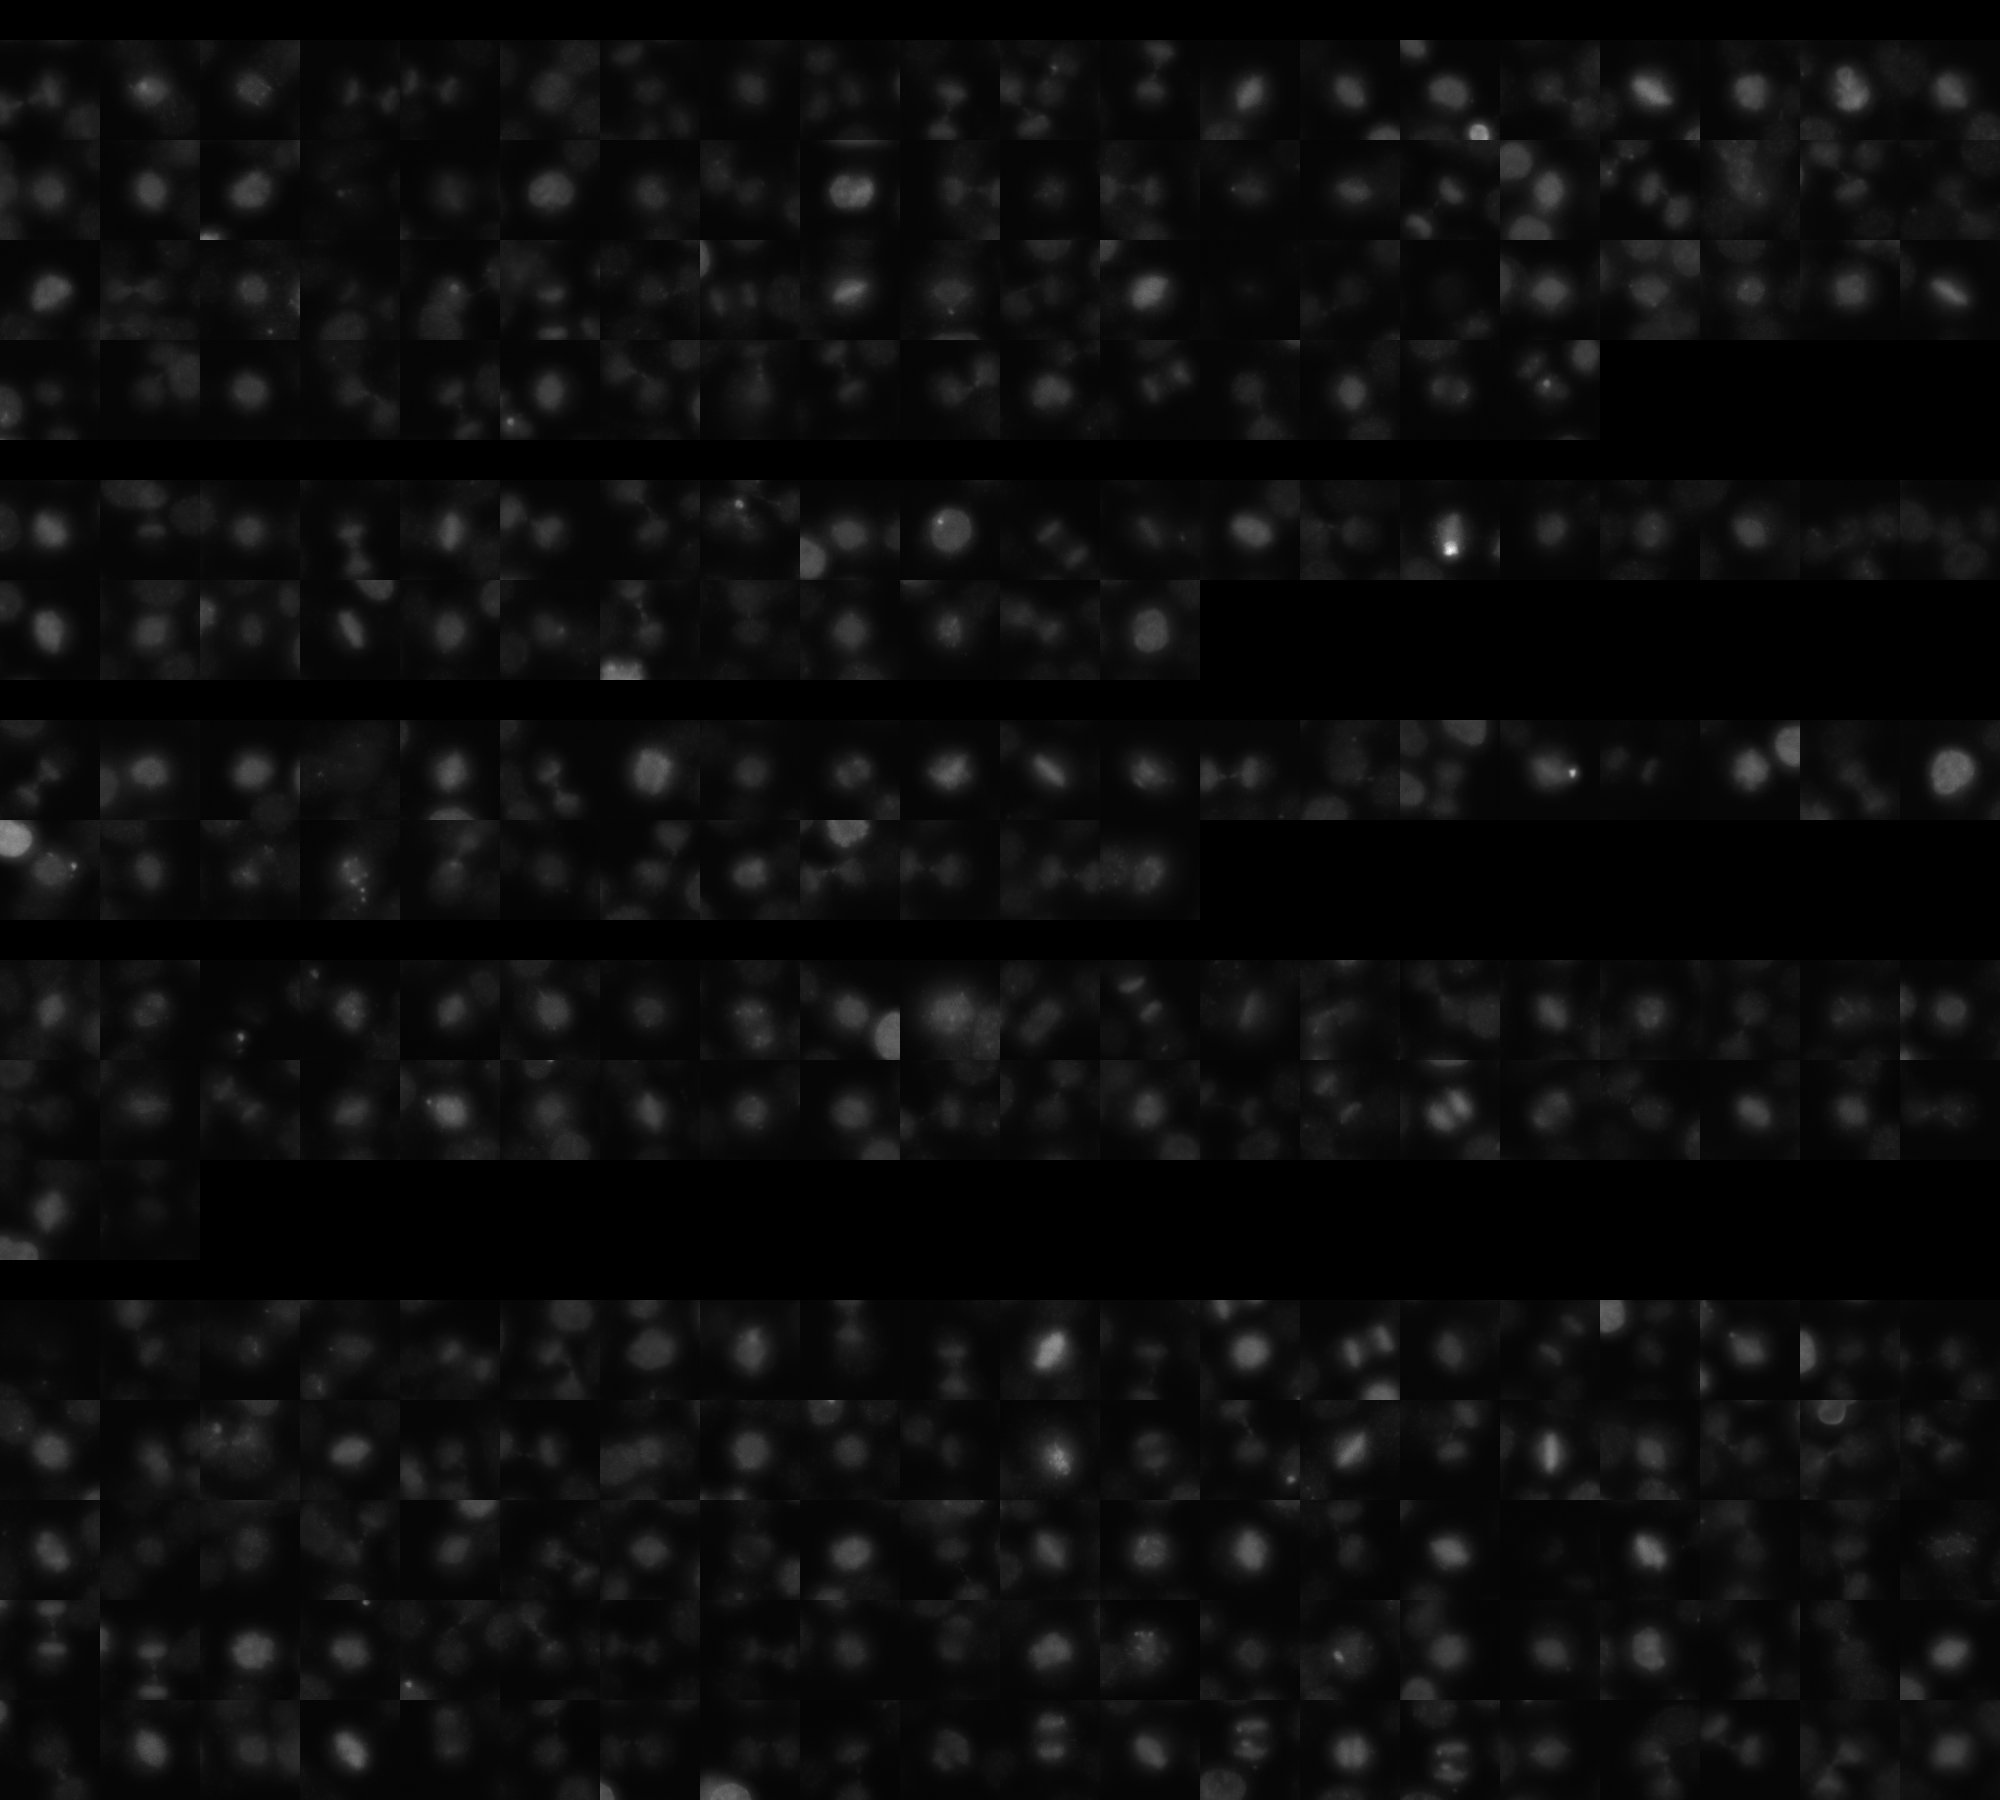
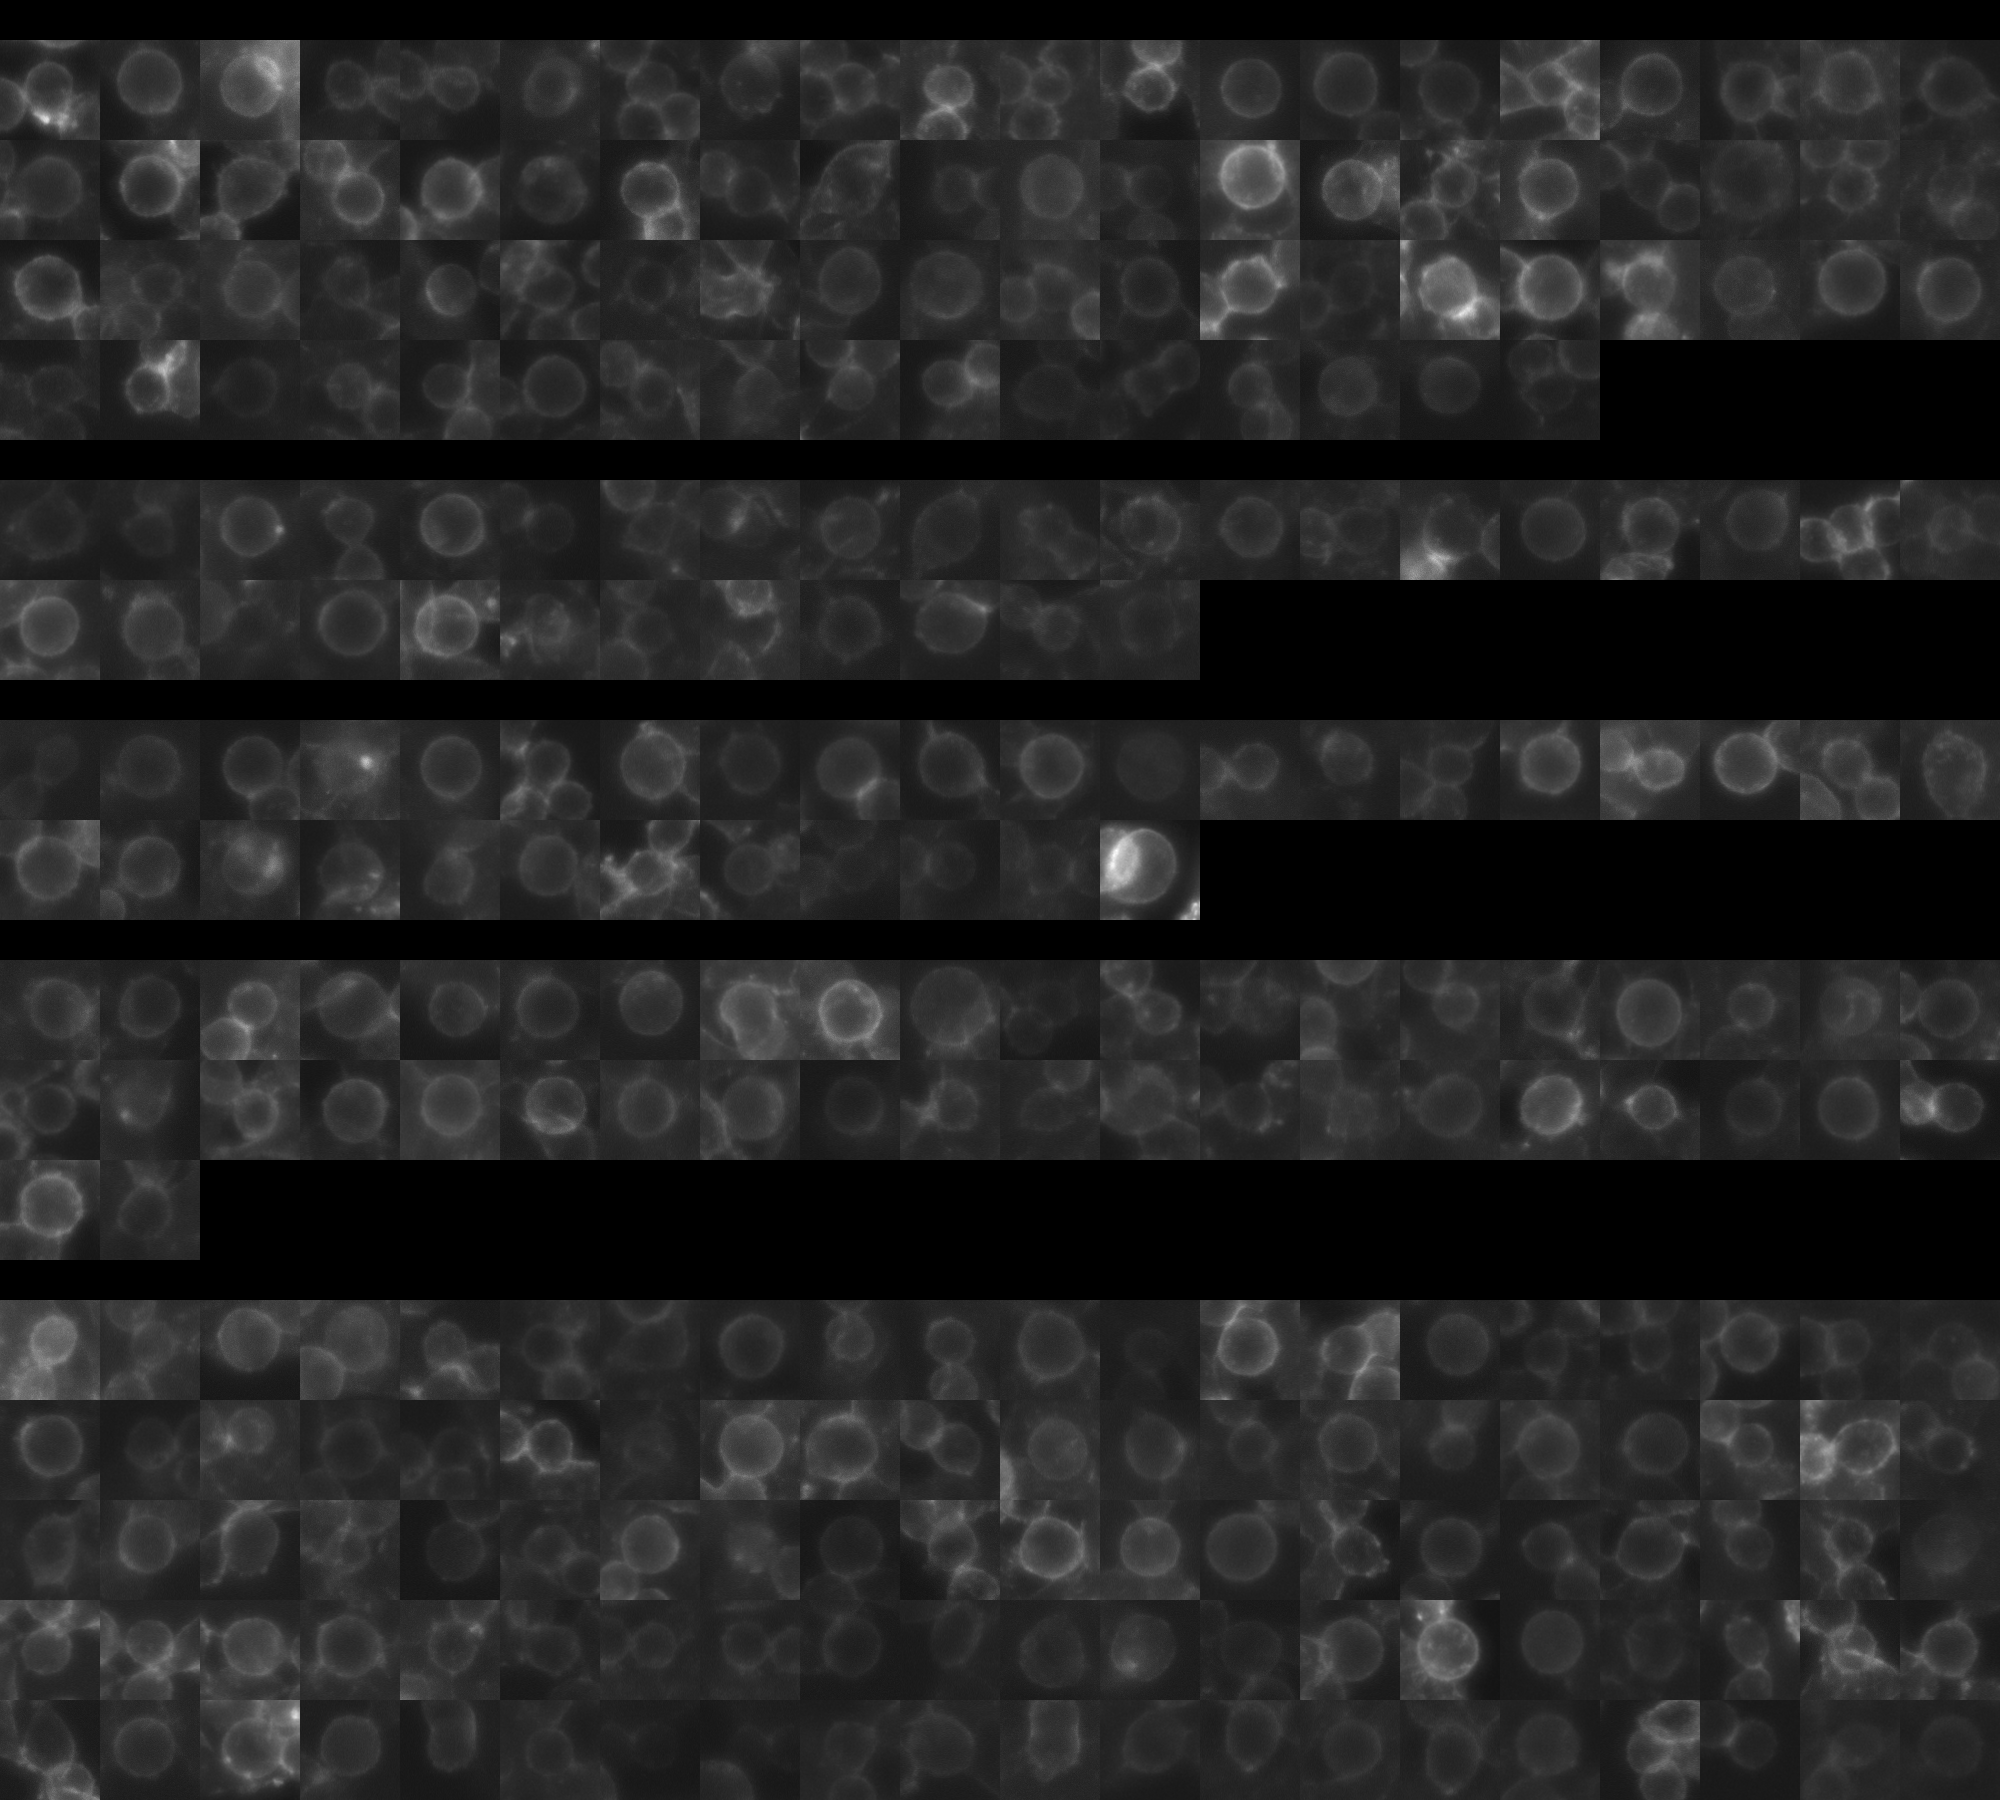
sgRNA 1: GACGTACGCCTTAGTAAGGG (interphase cells: 1930, mitotic cells: 76)
sgRNA 2: GTTGACGTACGCCTTAGTAA (interphase cells: 795, mitotic cells: 32)
sgRNA 3: TGTAAGGCAGCAAGGTAGCG (interphase cells: 1216, mitotic cells: 32)
sgRNA 4: TTCGGCGCTGAGTTCCATGG (interphase cells: 1230, mitotic cells: 42)

Interphase Cluster

Mitotic Cluster

Overview

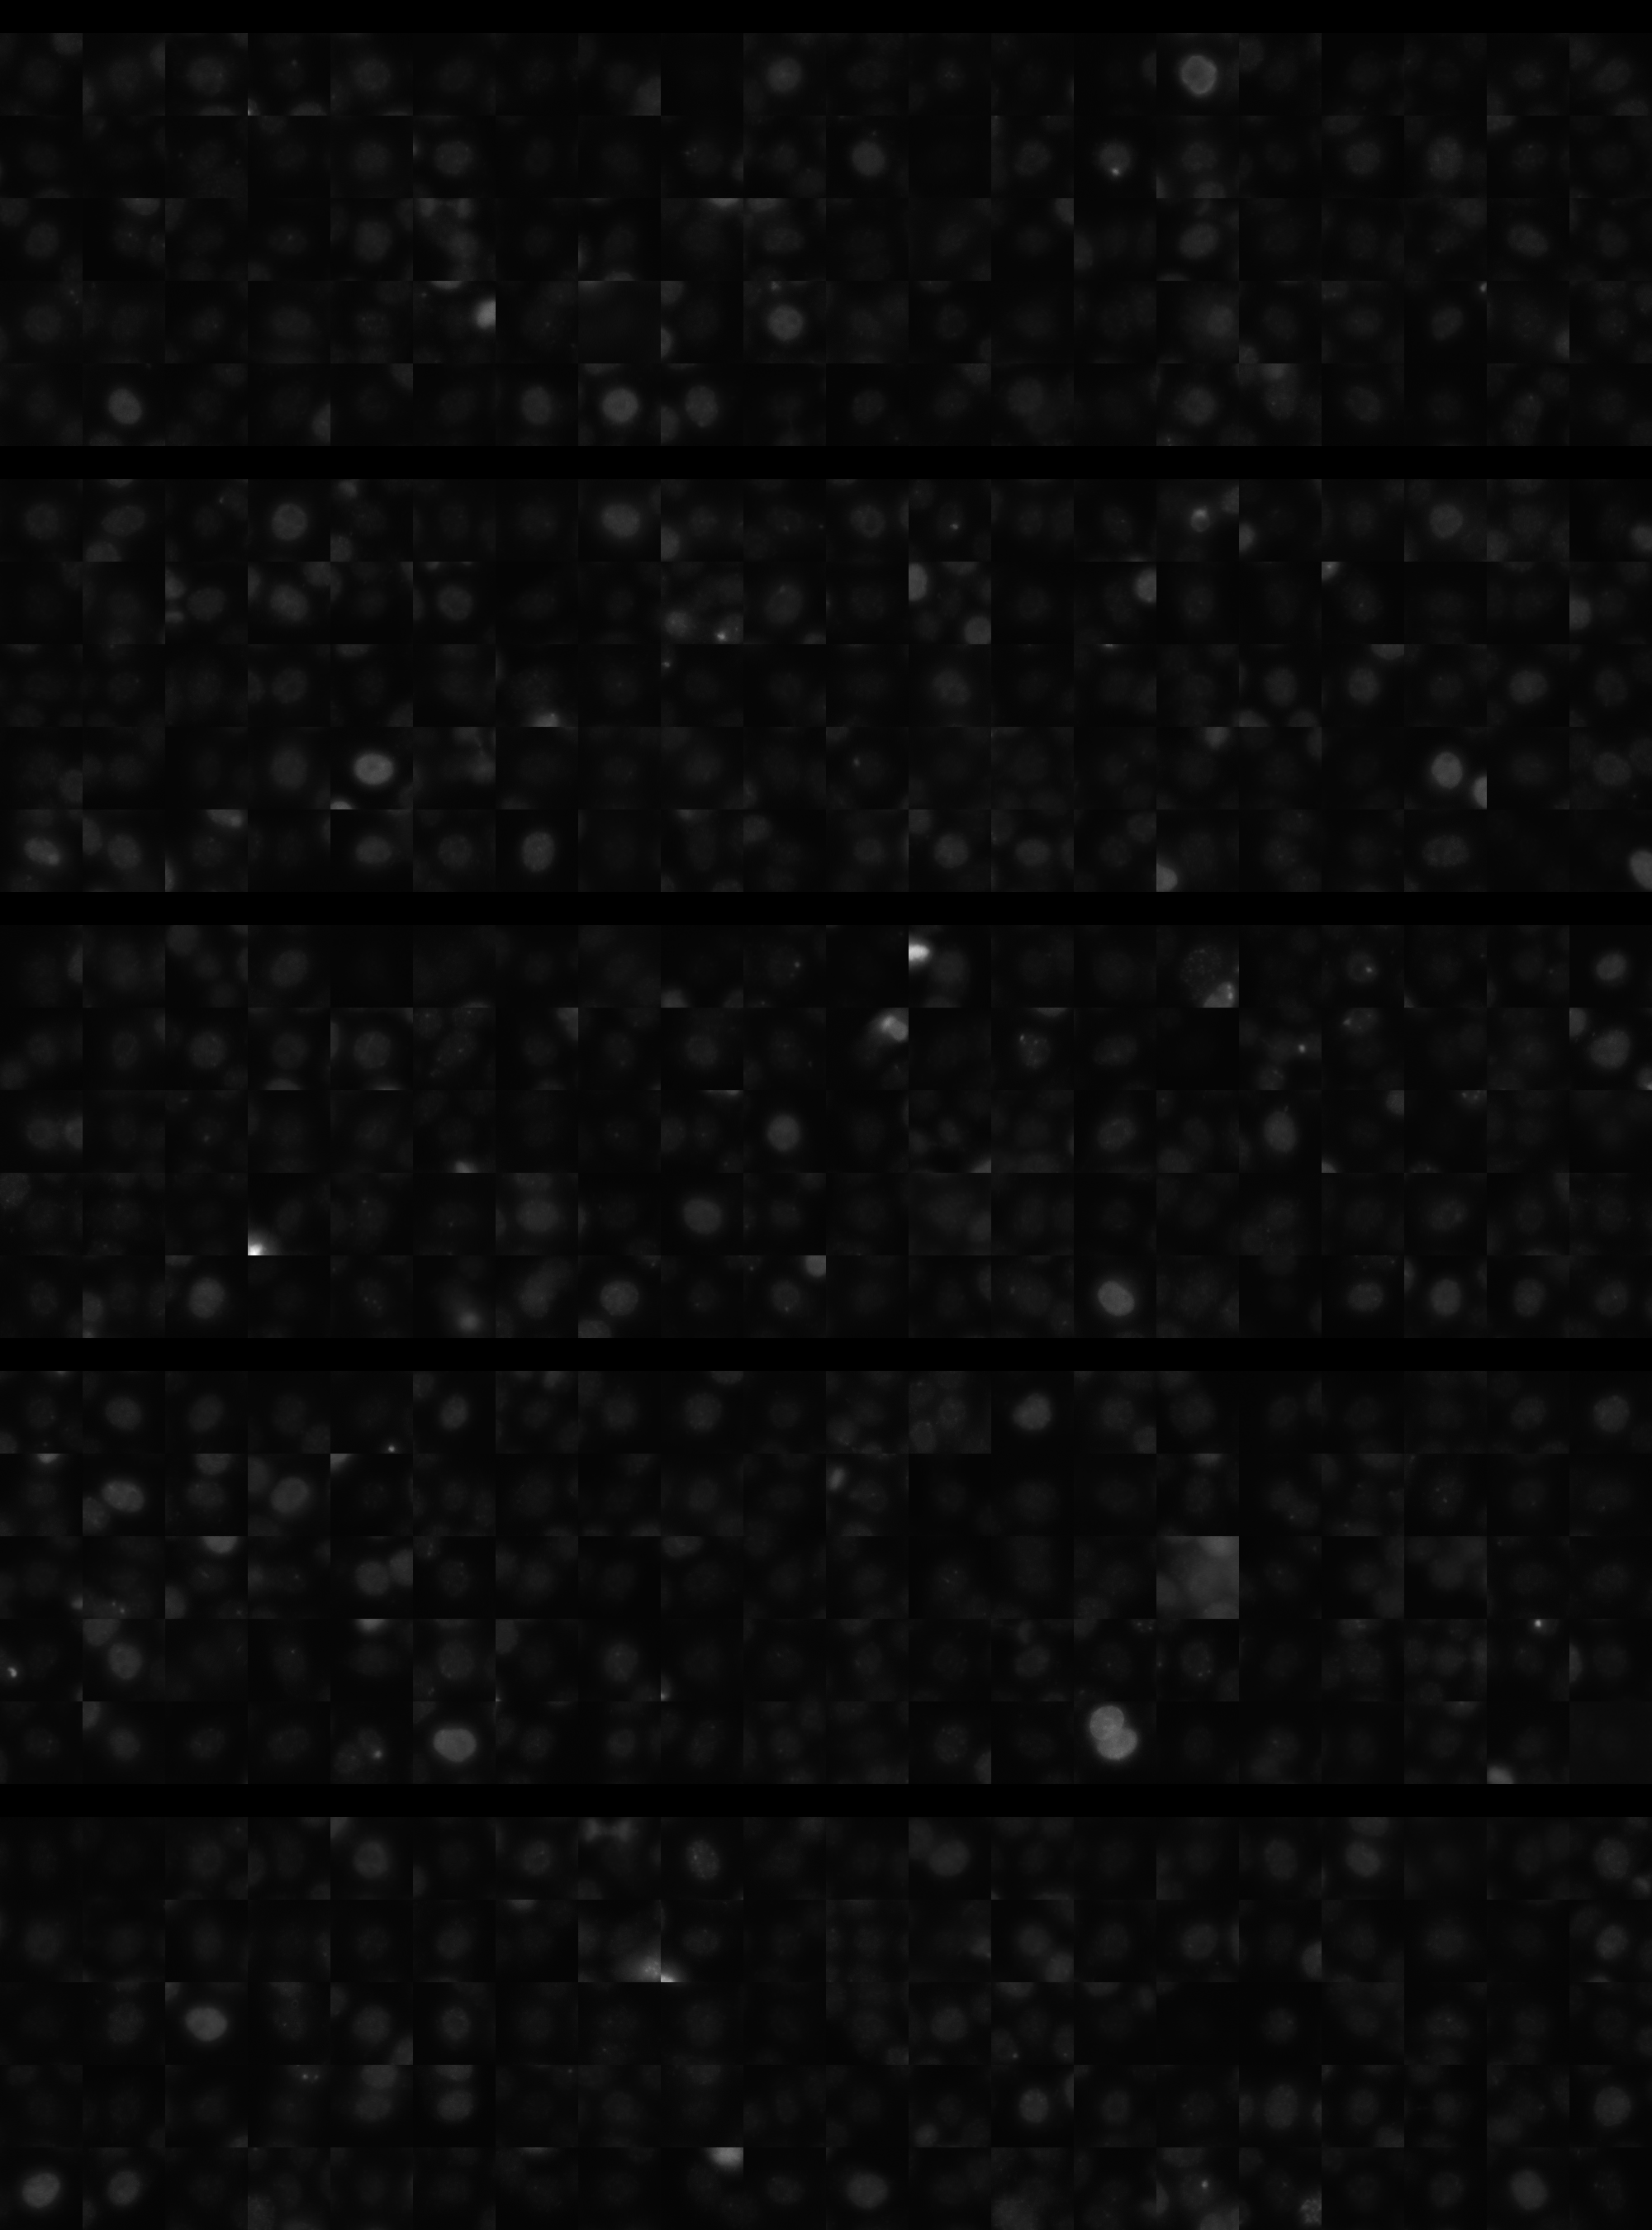
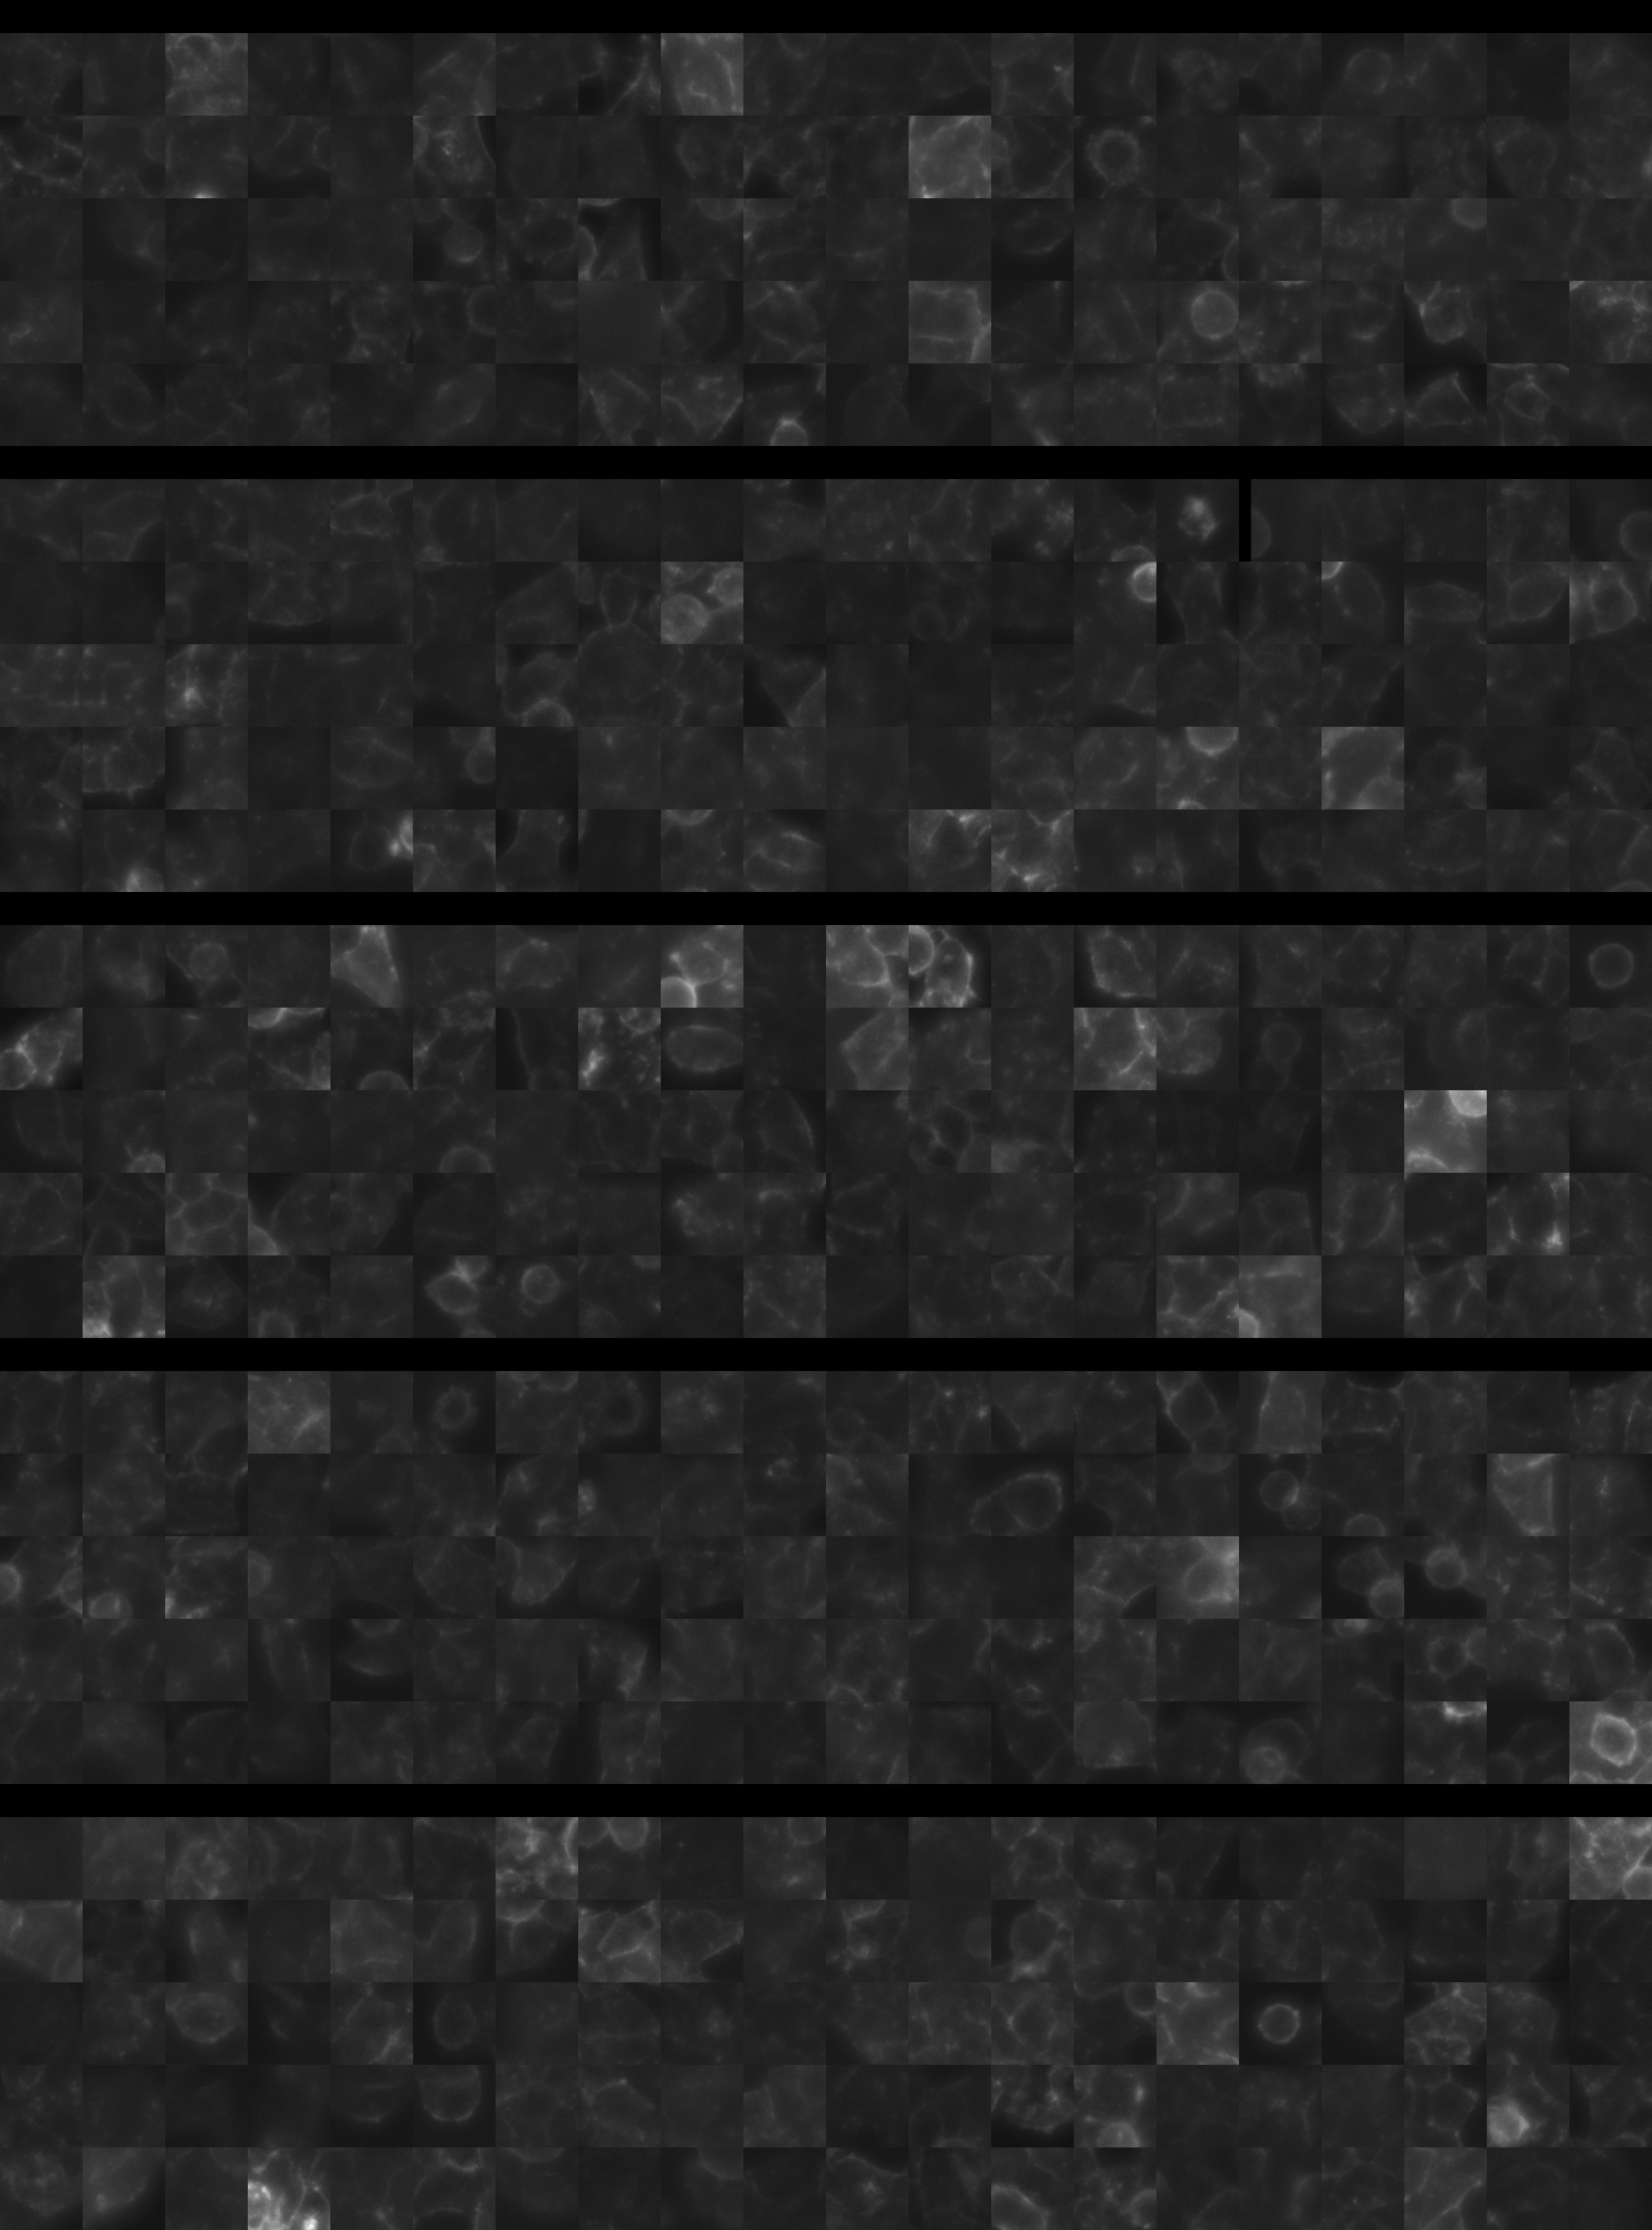
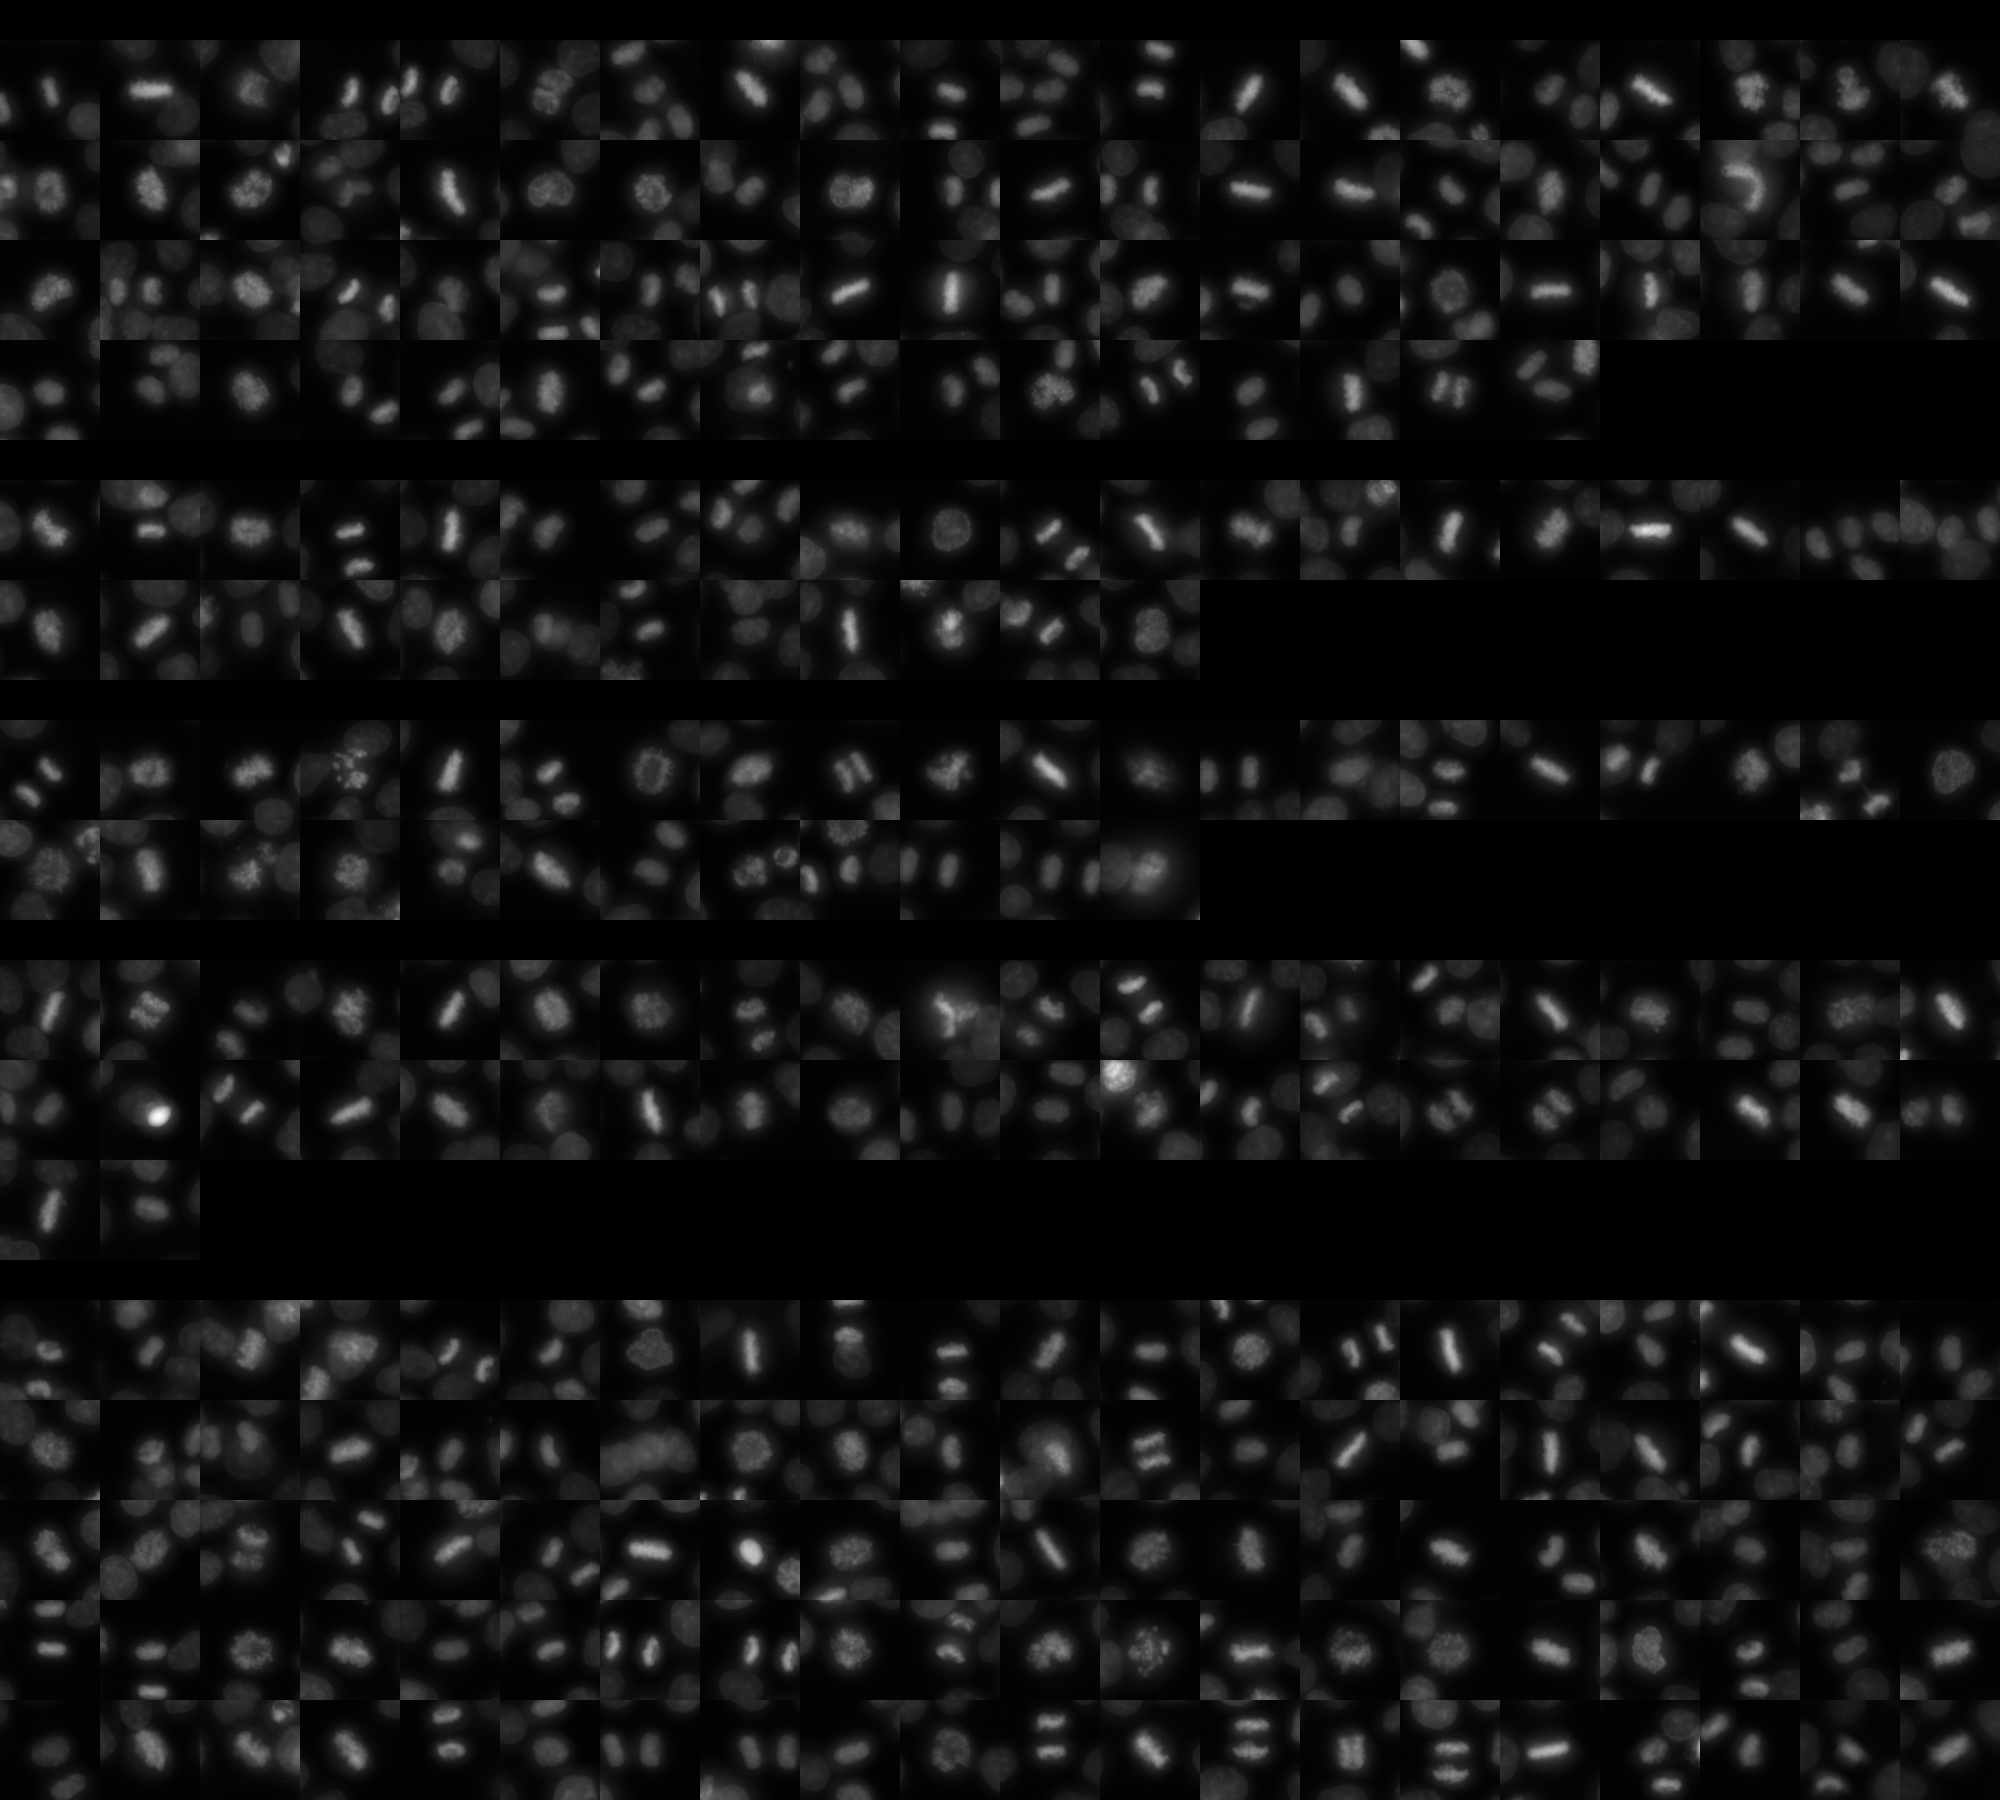
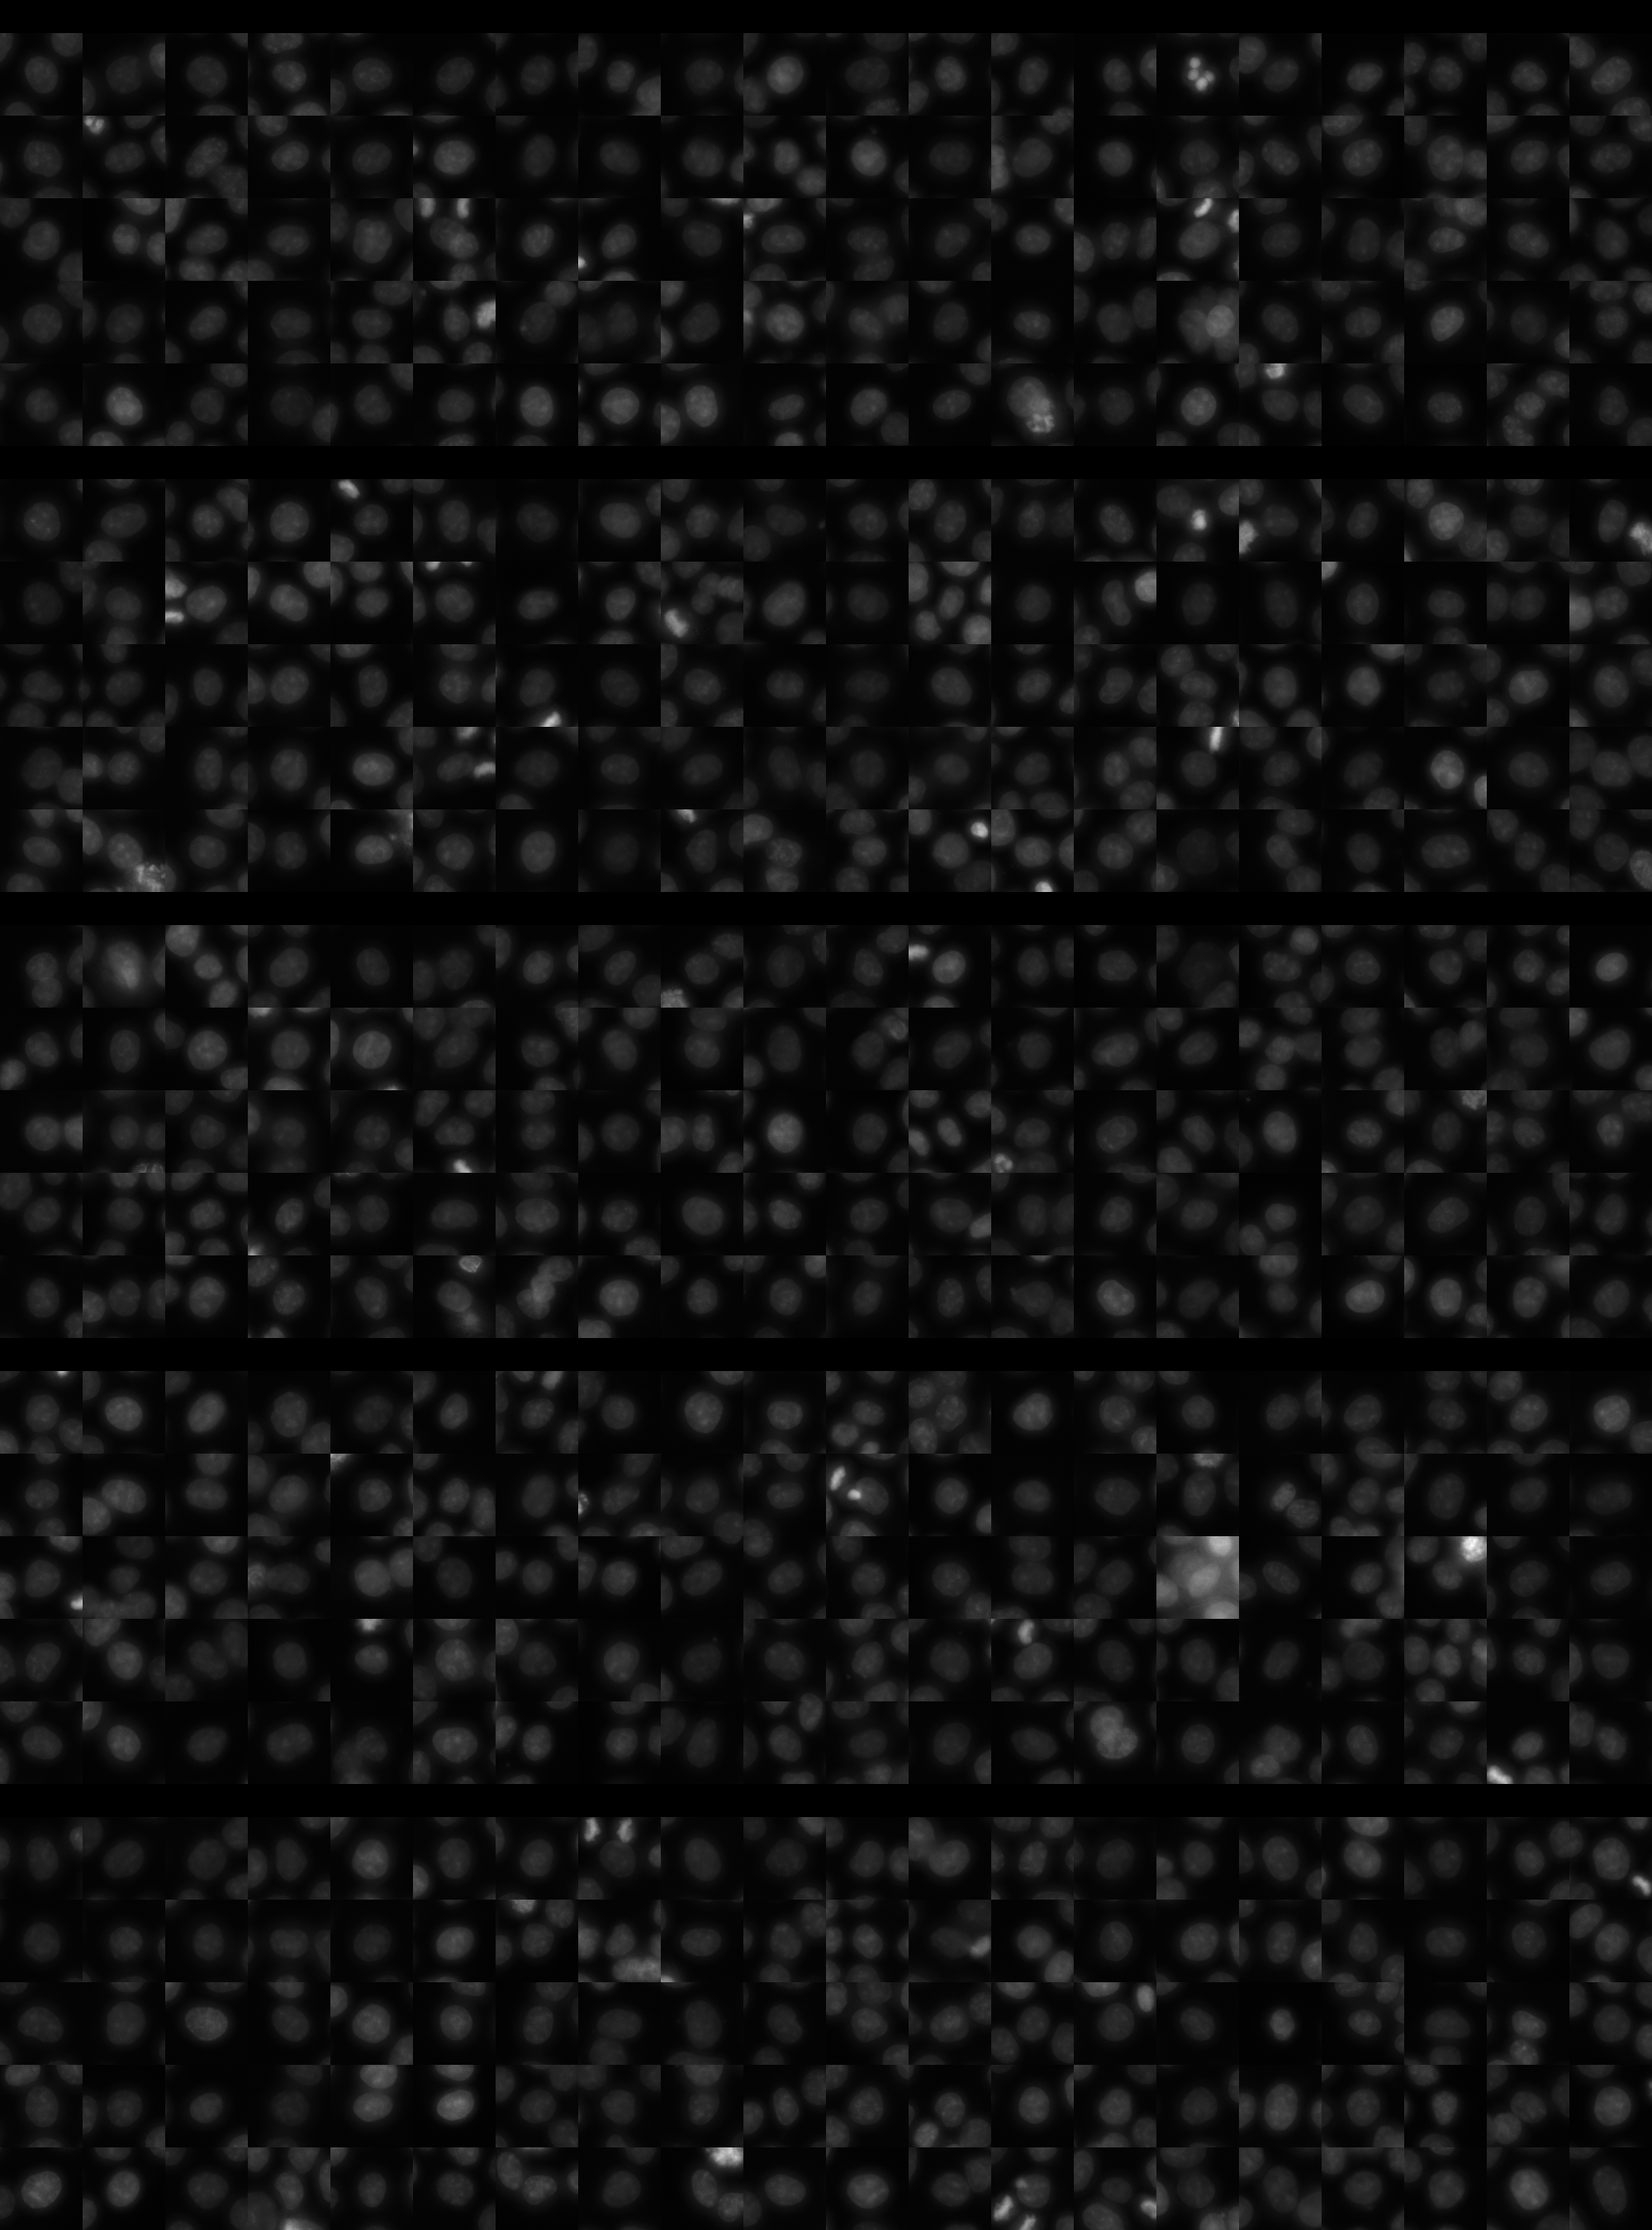
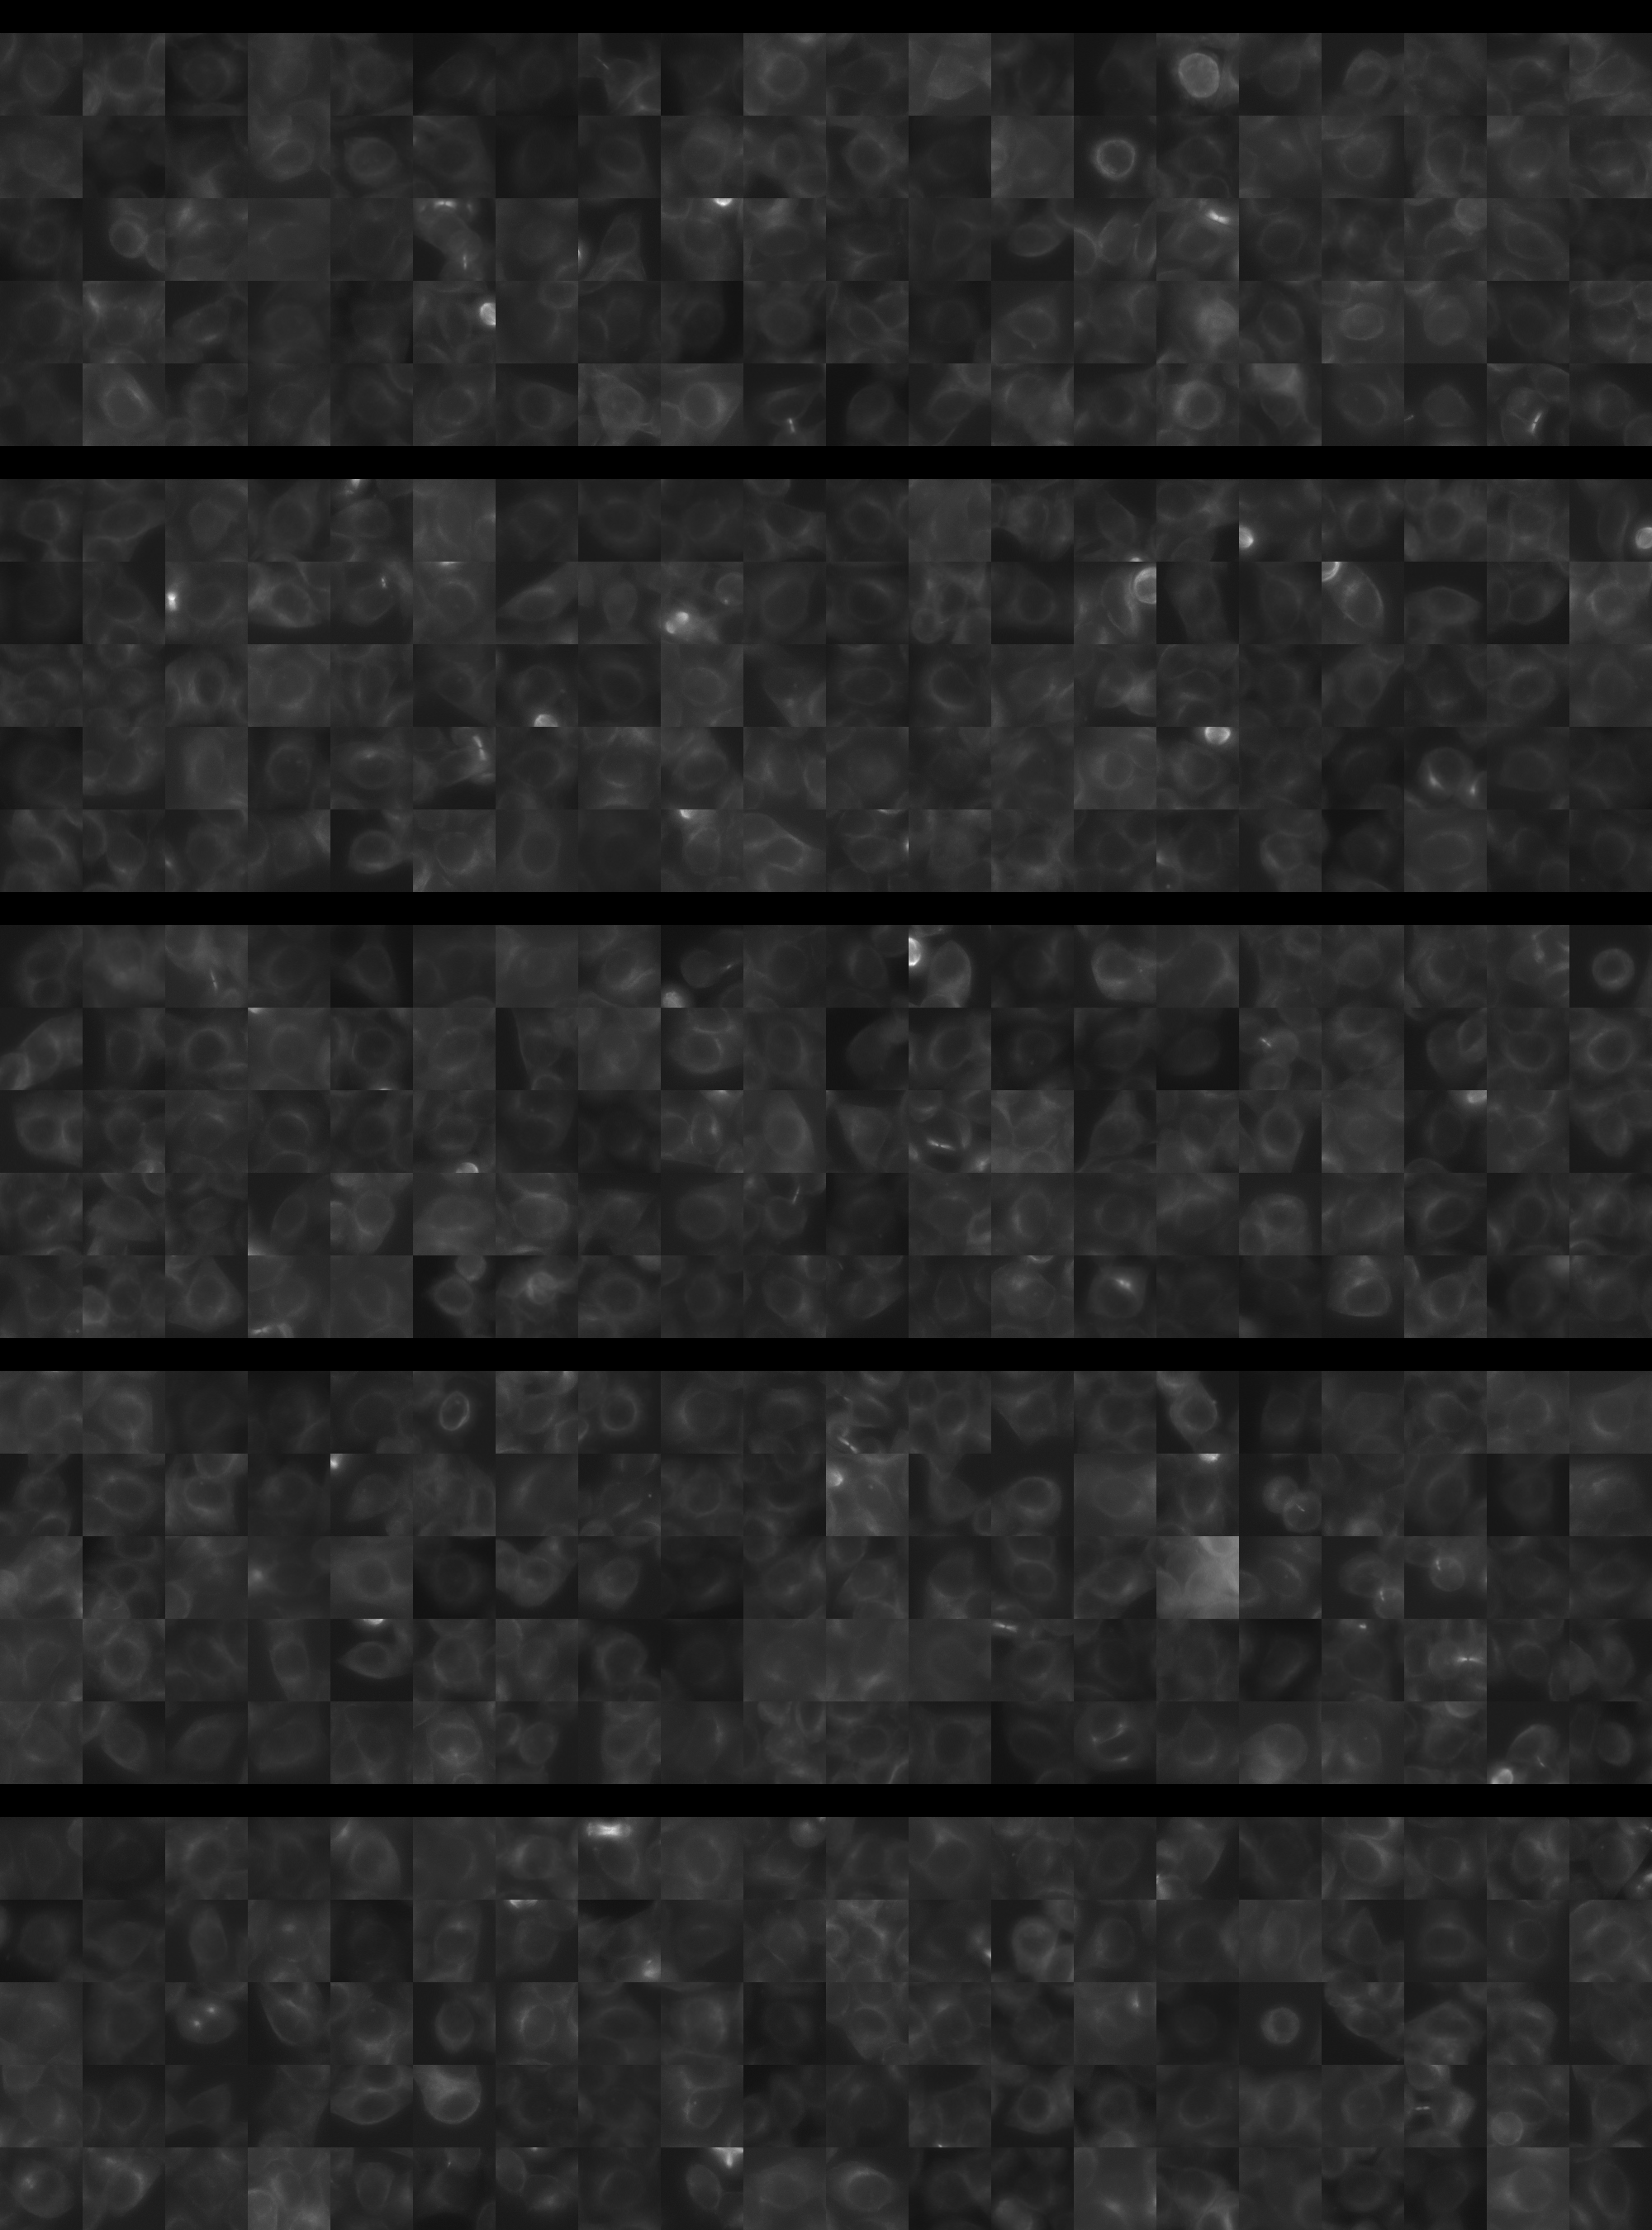
Each montage below shows randomly selected individual cell images for the same target gene separated by sgRNA, along with an example montage of cells expressing a non-targeting negative control sgRNA at the bottom. sgRNA labels in the montages correspond to the numbered sgRNA sequences in the gene info table above. The DNA (blue) and tubulin (green) channels are displayed by default, with gH2AX (grayscale) and actin (yellow) available using the check boxes. Channel brightness, contrast, and opacity are adjustable by clicking the arrow next to the channel name. When only one channel is selected, the display defaults to grayscale. Click the “Zoom” checkbox above the channel controls to enable image zooming (via scrolling) and panning (via click-and-drag).

The cell boxes displayed for this gene are square, 30.36 μm per side for the interphase montage and 30.36 μm per side for the mitotic montage.
Features

Interphase Score Rank FDR q-value
Nucleus DNA Integrated -5.489e-02 4943 of 5322 0.252
Nucleus DNA Mean 0.038 1000 of 5322 0.373
Nucleus gH2AX Mean 0.103 1863 of 5322 0.015
Nucleus DNA - gH2AX Correlation 0.010 759 of 5322 0.839
Nucleus Shape Area -4.237e-02 4360 of 5322 0.331
Nucleus Shape Eccentricity 0.035 1501 of 5322 0.399
Nucleus Shape Form Factor -2.017e-02 1280 of 5322 0.692
Nucleus Shape Solidity 0.016 302 of 5322 0.625
Cell DNA Mass Displacement 0.012 3650 of 5322 0.897
Cell Tubulin Mean 0.091 550 of 5322 0.028
Cell Tubulin Mass Displacement 0.033 1127 of 5322 0.547
Cell Actin Mean 0.043 1709 of 5322 0.404
Cell Tubulin - Actin Correlation -2.558e-02 4646 of 5322 0.620
Cell DNA - Tubulin Correlation -5.984e-04 3854 of 5322 0.983
Cell Shape Area -3.152e-02 4063 of 5322 0.487
Cell Shape Eccentricity 0.052 534 of 5322 0.363
Mitotic Score Rank FDR q-value
Nucleus DNA Integrated -1.180e-01 4898 of 5322 0.965
Nucleus DNA Mean -4.247e-02 3614 of 5322 1.000
Nucleus DNA Mass Displacement -4.847e-02 4202 of 5322 0.999
Nucleus DNA Mean Frac 3 0.038 2528 of 5322 1.000
Nucleus gH2AX Mean -9.972e-02 4234 of 5322 1.000
Nucleus gH2AX Mean Frac 0 -1.731e-02 2536 of 5322 1.000
Nucleus Tubulin Mean Frac 0 -4.980e-02 4162 of 5322 0.999
Nucleus Tubulin Mean Edge 0.140 1358 of 5322 0.999
Nucleus Tubulin Std Edge 0.224 358 of 5322 0.999
Nucleus Shape Area -8.625e-02 4714 of 5322 0.990
Nucleus Shape Eccentricity -1.839e-02 2401 of 5322 1.000
Nucleus Shape Form Factor 0.039 917 of 5322 0.998
Cell Tubulin Mean -1.216e-01 4724 of 5322 0.997
Cell Tubulin Mean Frac 3 0.229 152 of 5322 0.999
Cell Actin Mean -4.486e-02 3816 of 5322 0.997
Cell Shape Area -1.311e-01 4955 of 5322 0.998
( Reset Zoom )
Brightness
Contrast
Opacity
Brightness
Contrast
Opacity
Brightness
Contrast
Opacity
Brightness
Contrast
Opacity
Brightness
Contrast
Opacity

( Reset Zoom )
Brightness
Contrast
Opacity
Brightness
Contrast
Opacity
Brightness
Contrast
Opacity
Brightness
Contrast
Opacity
Brightness
Contrast
Opacity

MIT Central Accessability