AURKA

Gene symbol: AURKA
Gene: 6790
Uniprot Function: Mitotic serine/threonine kinase that contributes to the regulation of cell cycle progression (PubMed:26246606, PubMed:12390251, PubMed:18615013, PubMed:11039908, PubMed:17125279, PubMed:17360485). Associates with the centrosome and the spindle microtubules during mitosis and plays a critical role in various mitotic events including the establishment of mitotic spindle, centrosome duplication, centrosome separation as well as maturation, chromosomal alignment, spindle assembly checkpoint, and cytokinesis (PubMed:26246606, PubMed:14523000). Required for normal spindle positioning during mitosis and for the localization of NUMA1 and DCTN1 to the cell cortex during metaphase (PubMed:27335426). Required for initial activation of CDK1 at centrosomes (PubMed:13678582, PubMed:15128871). Phosphorylates numerous target proteins, including ARHGEF2, BORA, BRCA1, CDC25B, DLGP5, HDAC6, KIF2A, LATS2, NDEL1, PARD3, PPP1R2, PLK1, RASSF1, TACC3, p53/TP53 and TPX2 (PubMed:18056443, PubMed:15128871, PubMed:14702041, PubMed:11551964, PubMed:15147269, PubMed:15987997, PubMed:17604723, PubMed:18615013). Regulates KIF2A tubulin depolymerase activity (PubMed:19351716). Important for microtubule formation and/or stabilization (PubMed:18056443). Required for normal axon formation (PubMed:19812038). Plays a role in microtubule remodeling during neurite extension (PubMed:19668197). Also acts as a key regulatory component of the p53/TP53 pathway, and particularly the checkpoint-response pathways critical for oncogenic transformation of cells, by phosphorylating and destabilizing p53/TP53 (PubMed:14702041). Phosphorylates its own inhibitors, the protein phosphatase type 1 (PP1) isoforms, to inhibit their activity (PubMed:11551964). Necessary for proper cilia disassembly prior to mitosis (PubMed:17604723, PubMed:20643351). Regulates protein levels of the anti-apoptosis protein BIRC5 by suppressing the expression of the SCF(FBXL7) E3 ubiquitin-protein ligase substrate adapter FBXL7 through the phosphorylation of the transcription factor FOXP1 (PubMed:28218735).
Mitotic Index 0.0431
Interphase Cluster: #22 (39 genes)
Mitotic Cluster: #109 (23 genes)
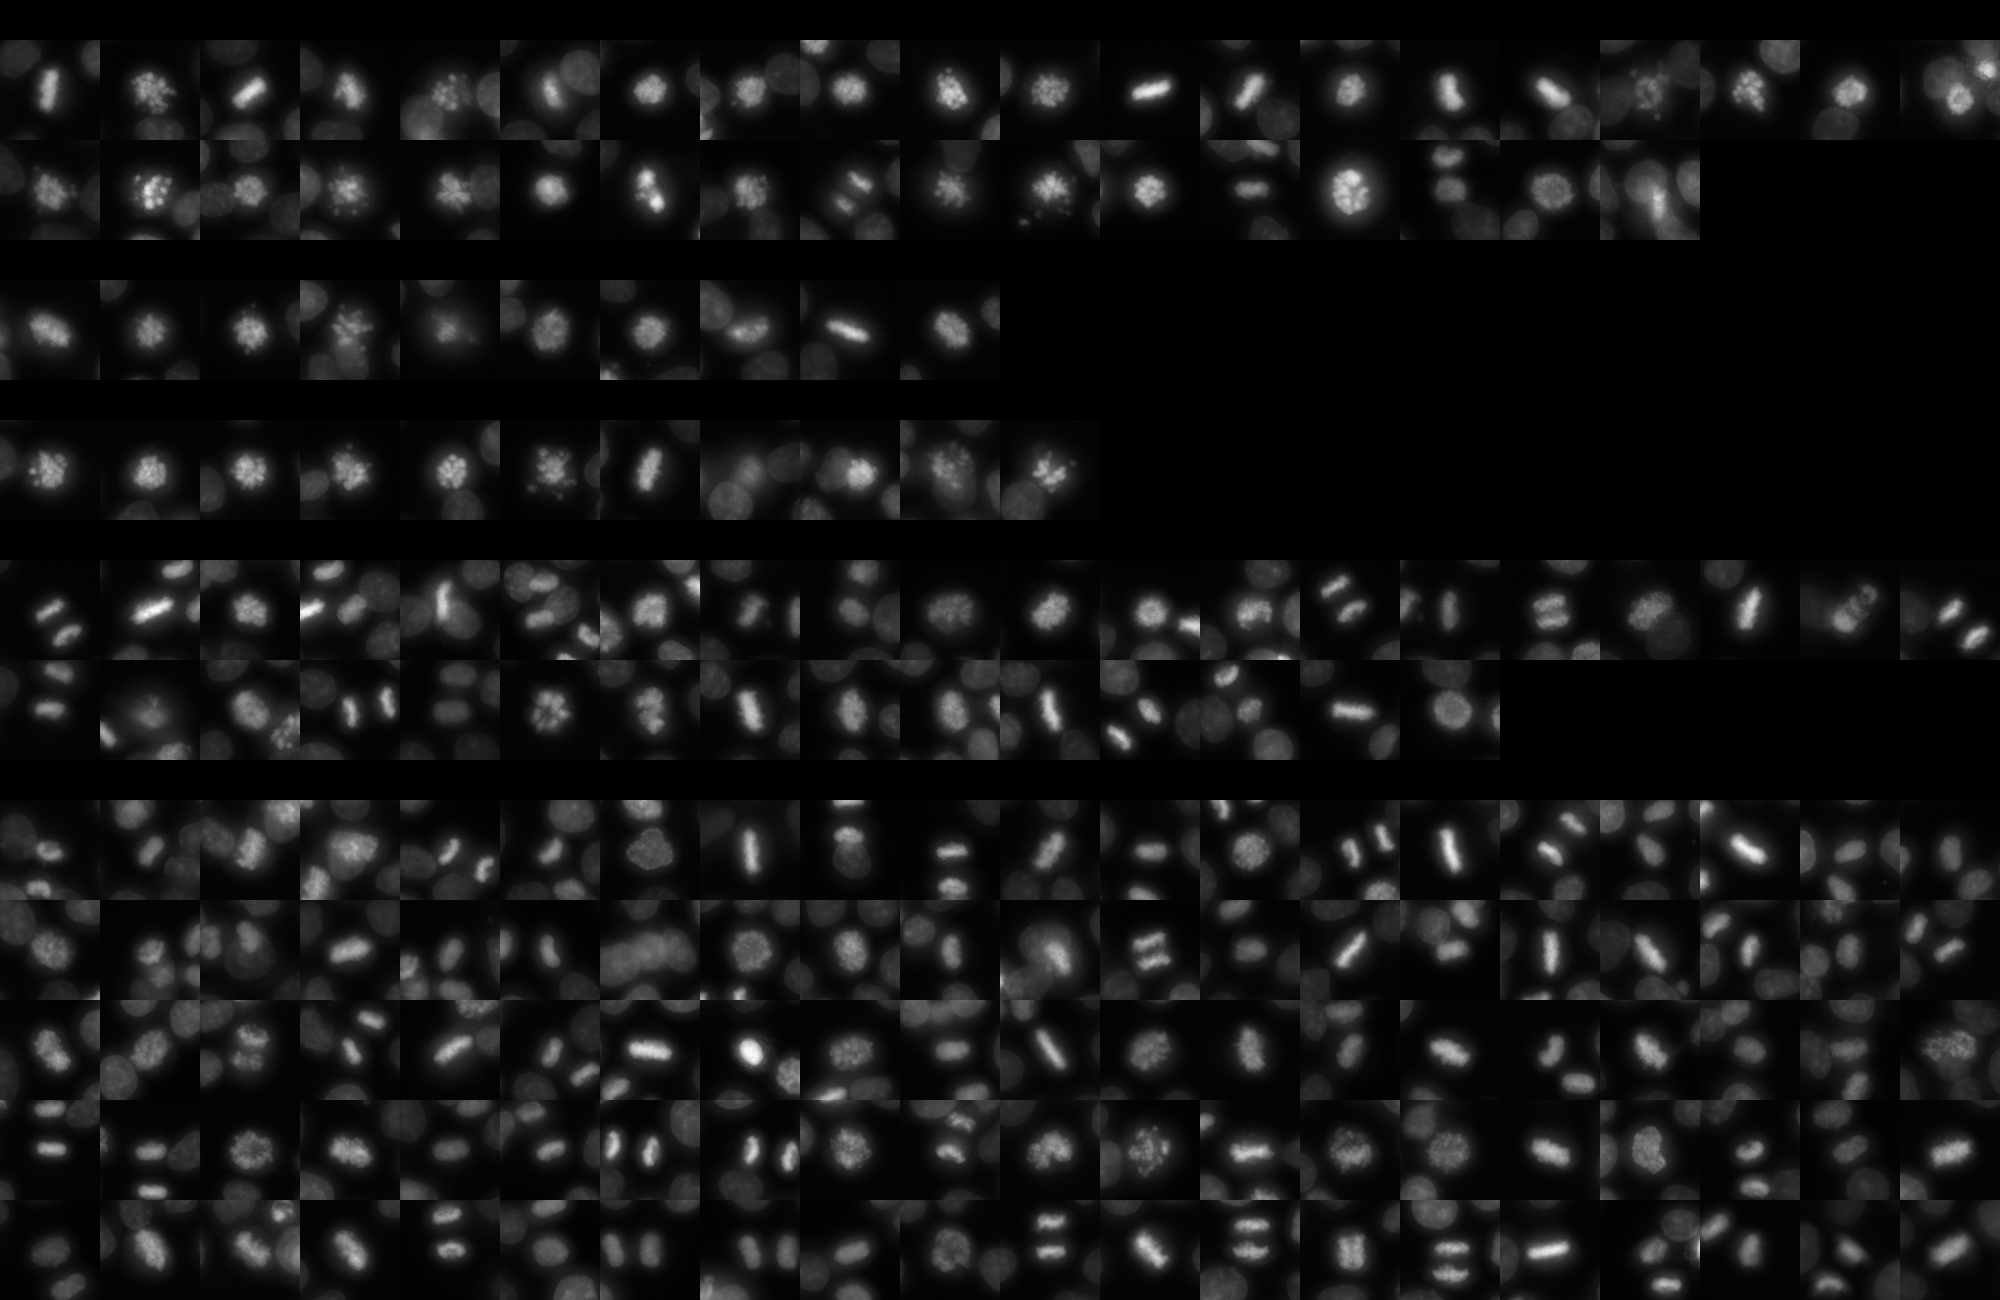
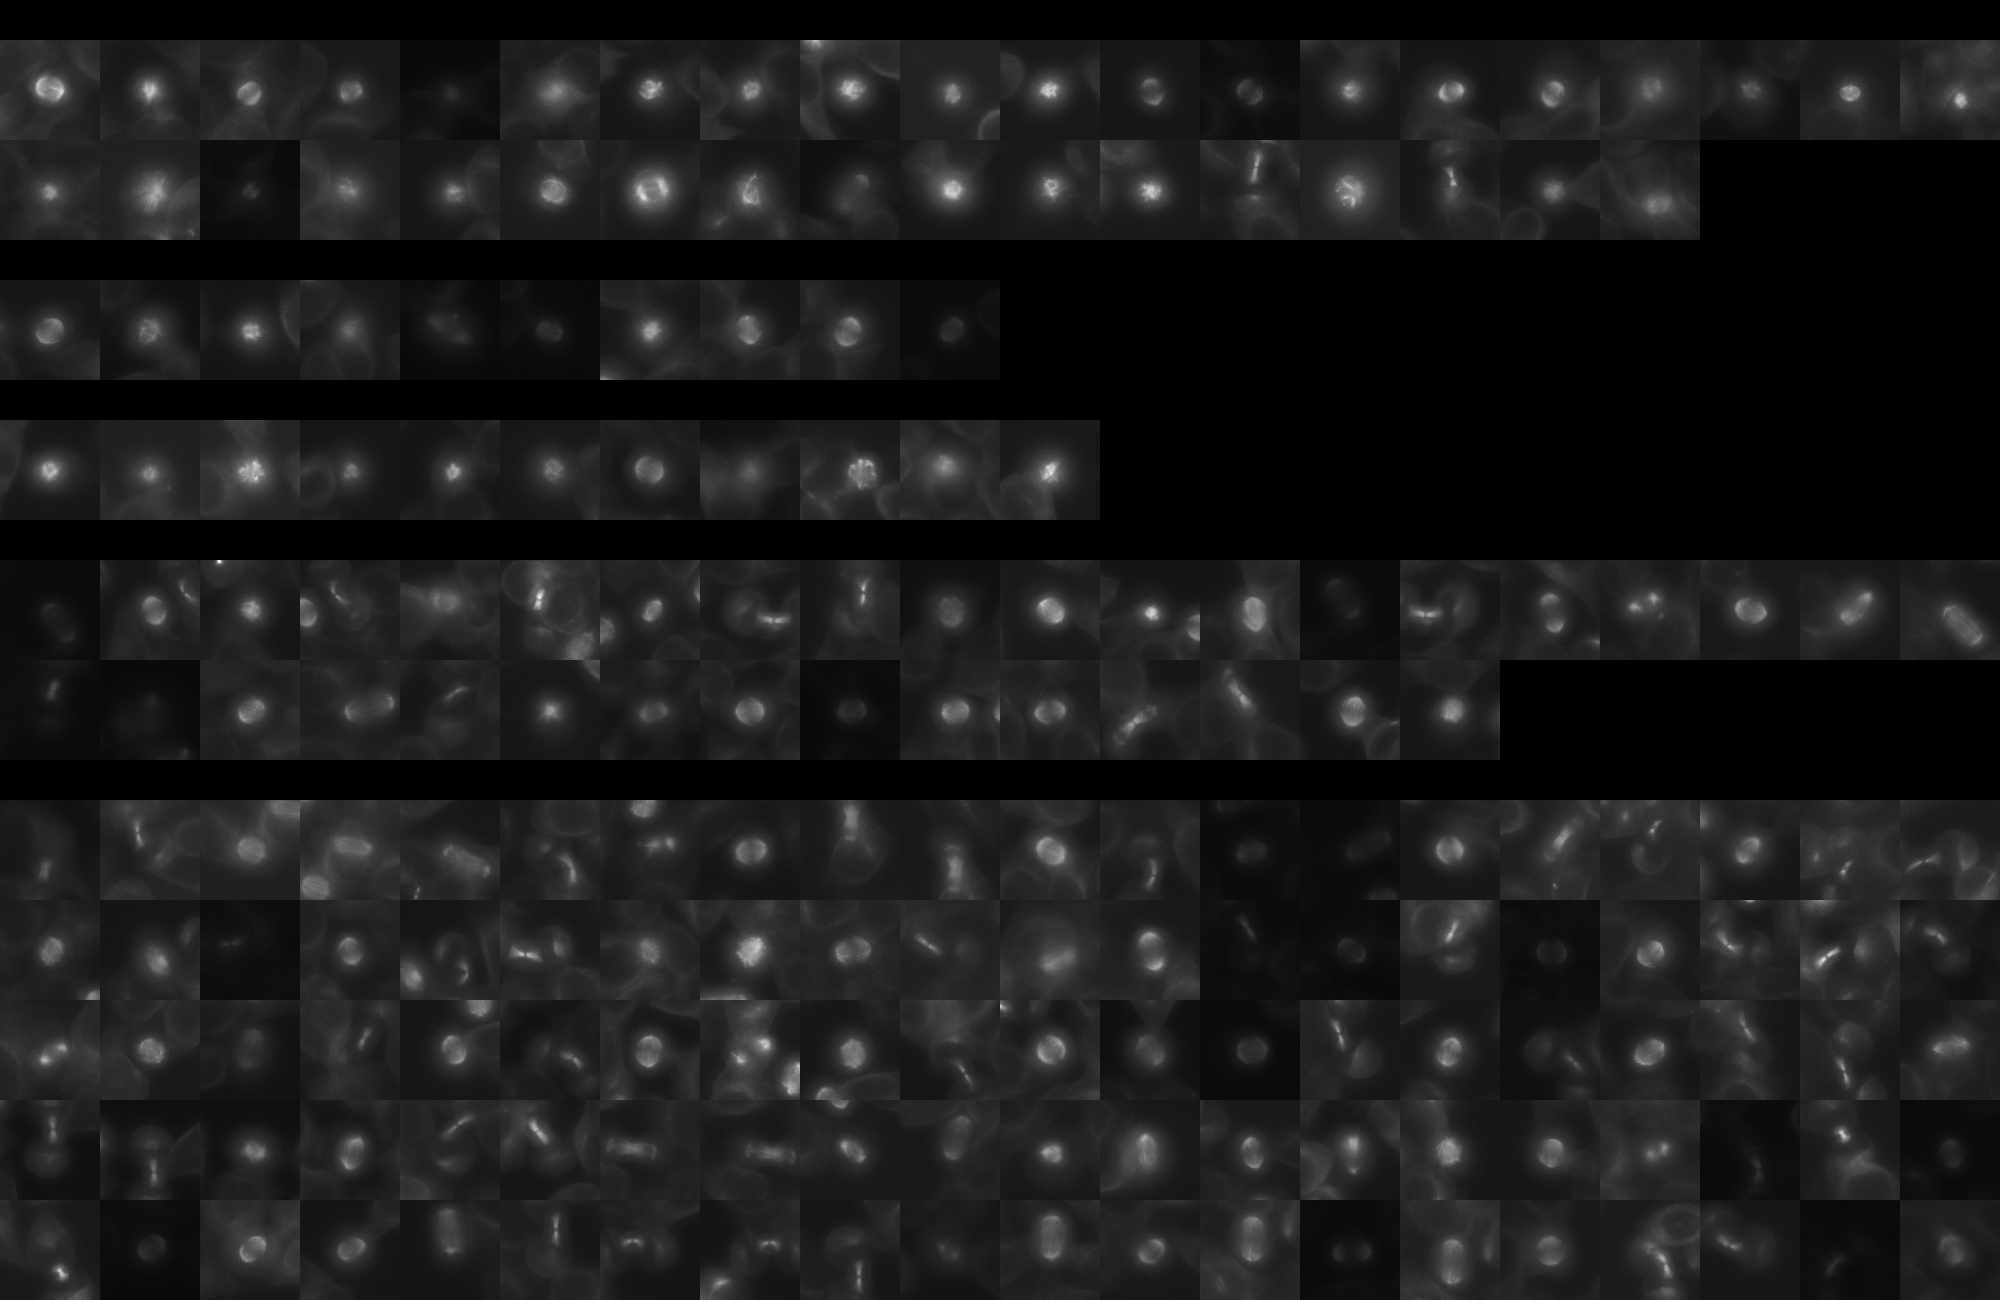
sgRNA 1: CCATATAGAAAATAATCCTG (interphase cells: 589, mitotic cells: 37)
sgRNA 2: CCTGAAAACTCACCGAAGGT (interphase cells: 99, mitotic cells: 10)
sgRNA 3: CTTCGAATGACAGTAAGACA (interphase cells: 93, mitotic cells: 11)
sgRNA 4: TGCTTGCAAAGGAATGCGCT (interphase cells: 1282, mitotic cells: 35)

Interphase Cluster

Mitotic Cluster

Overview

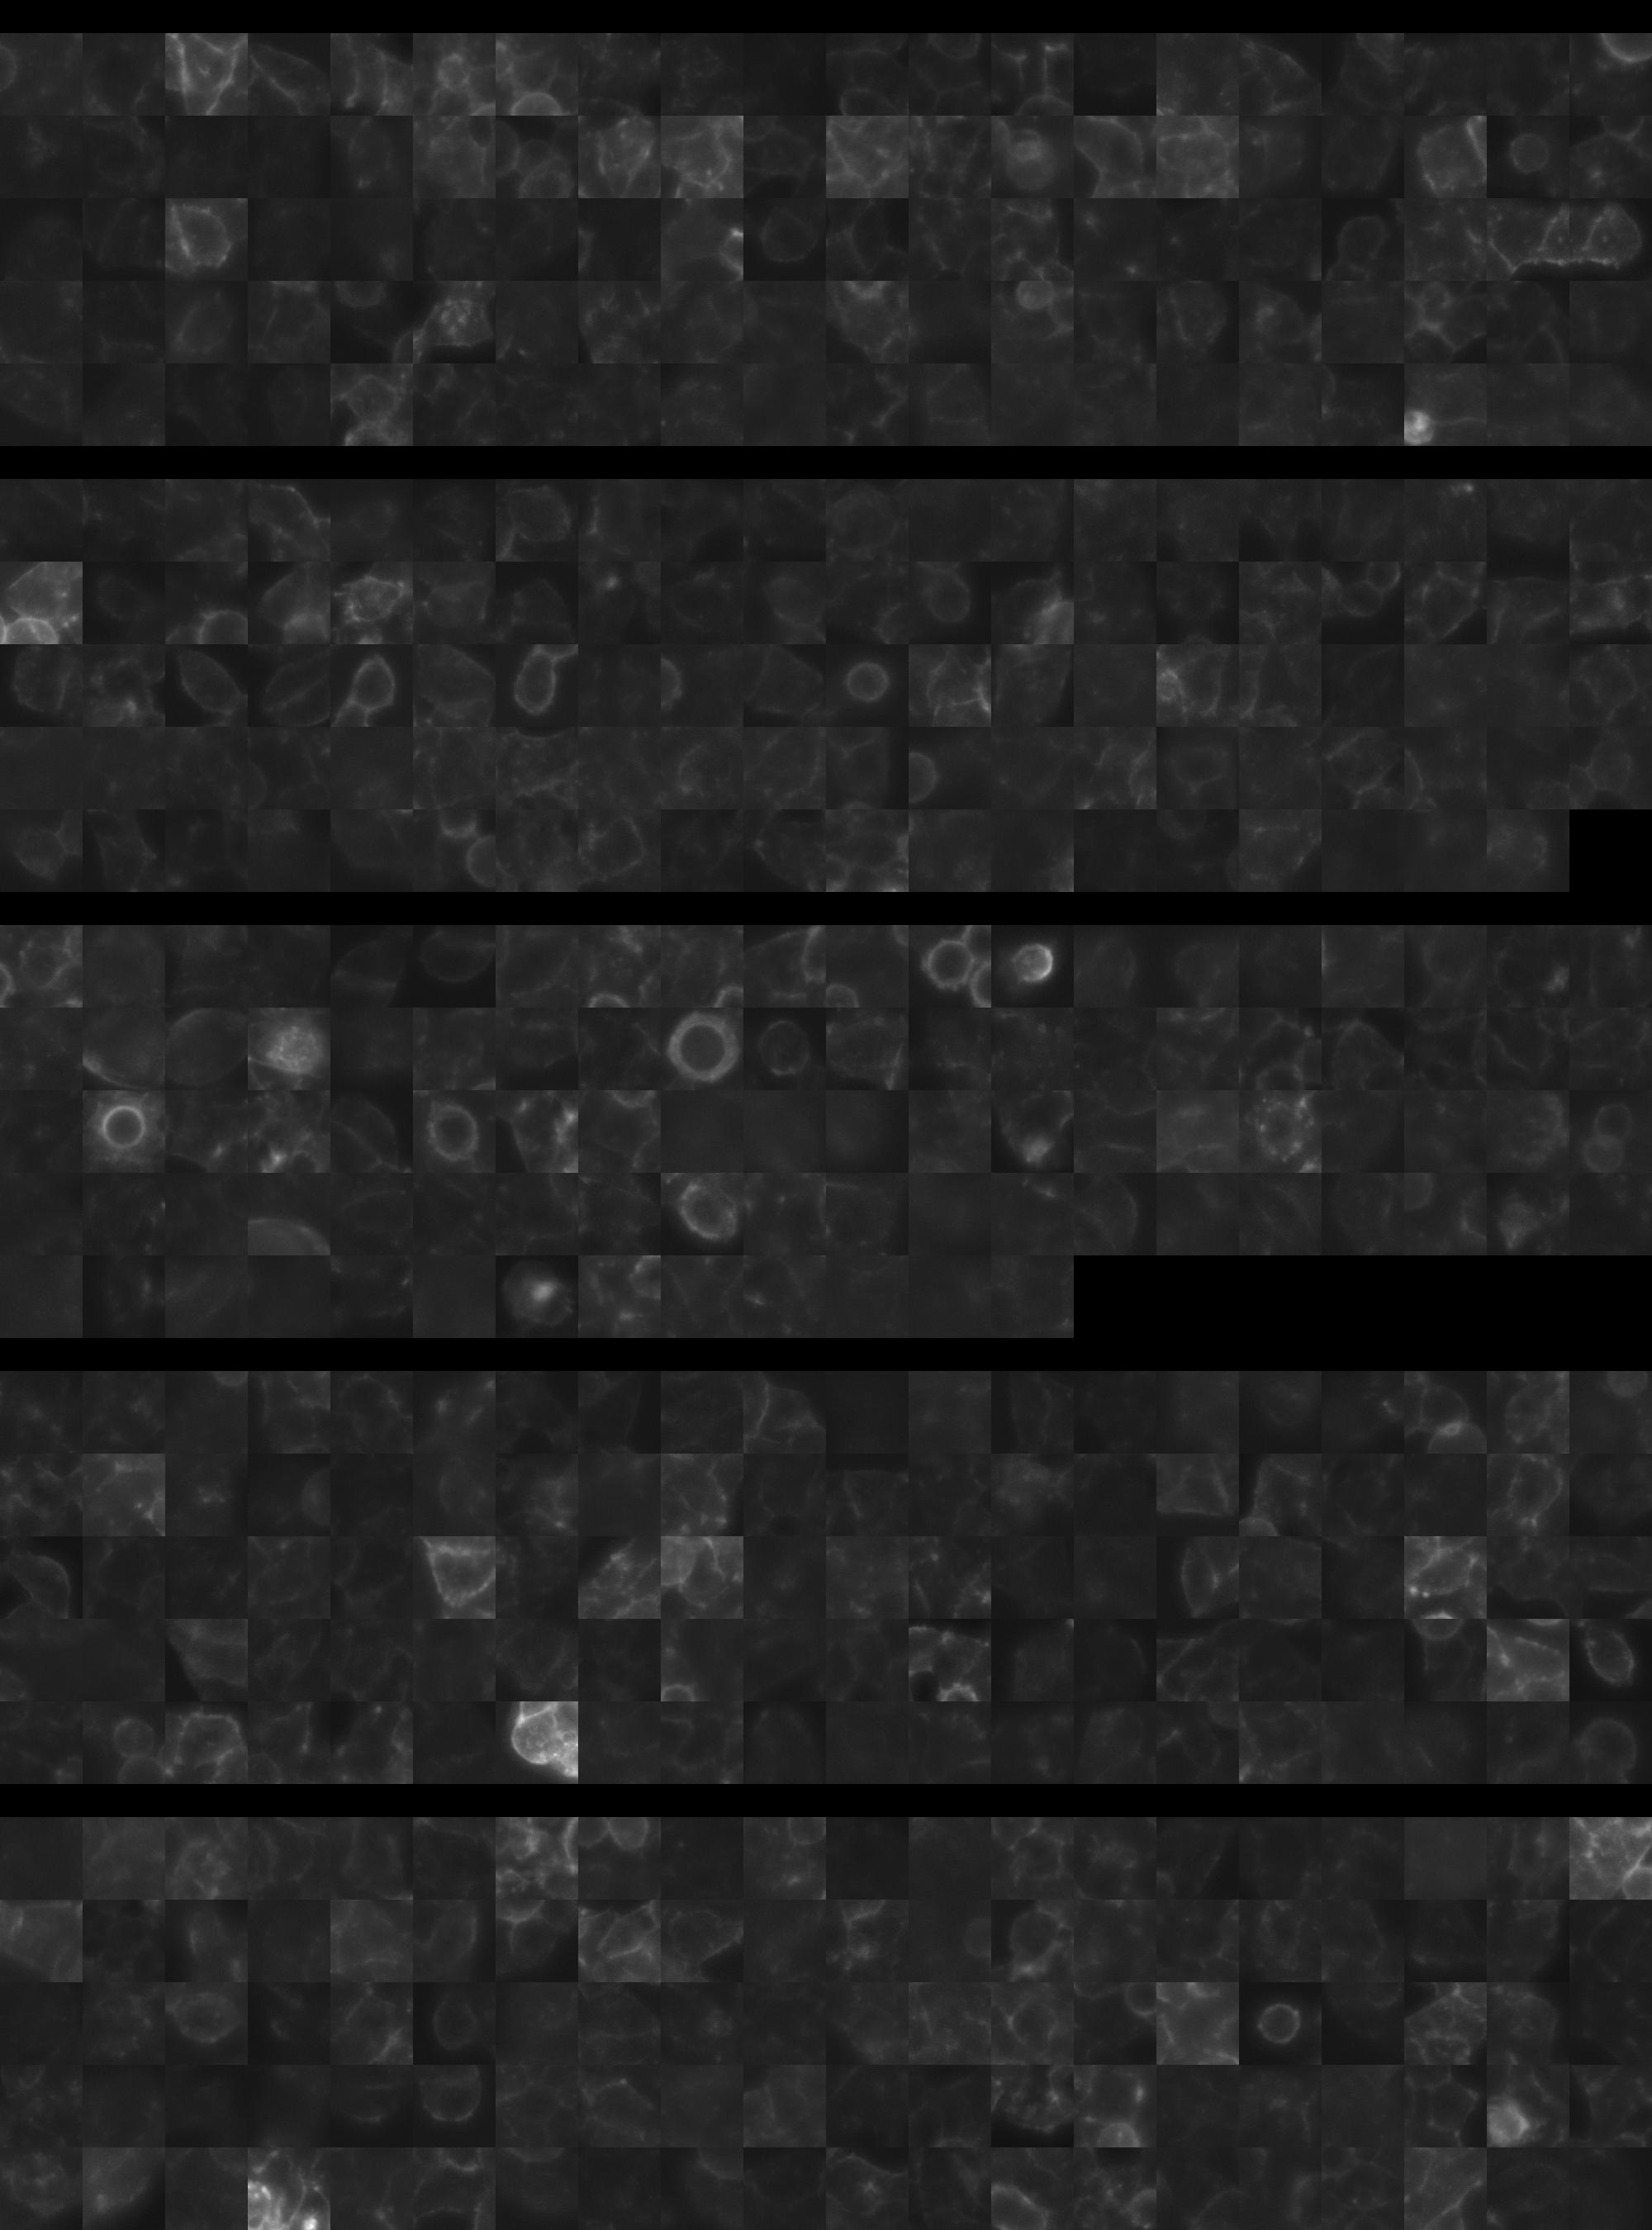
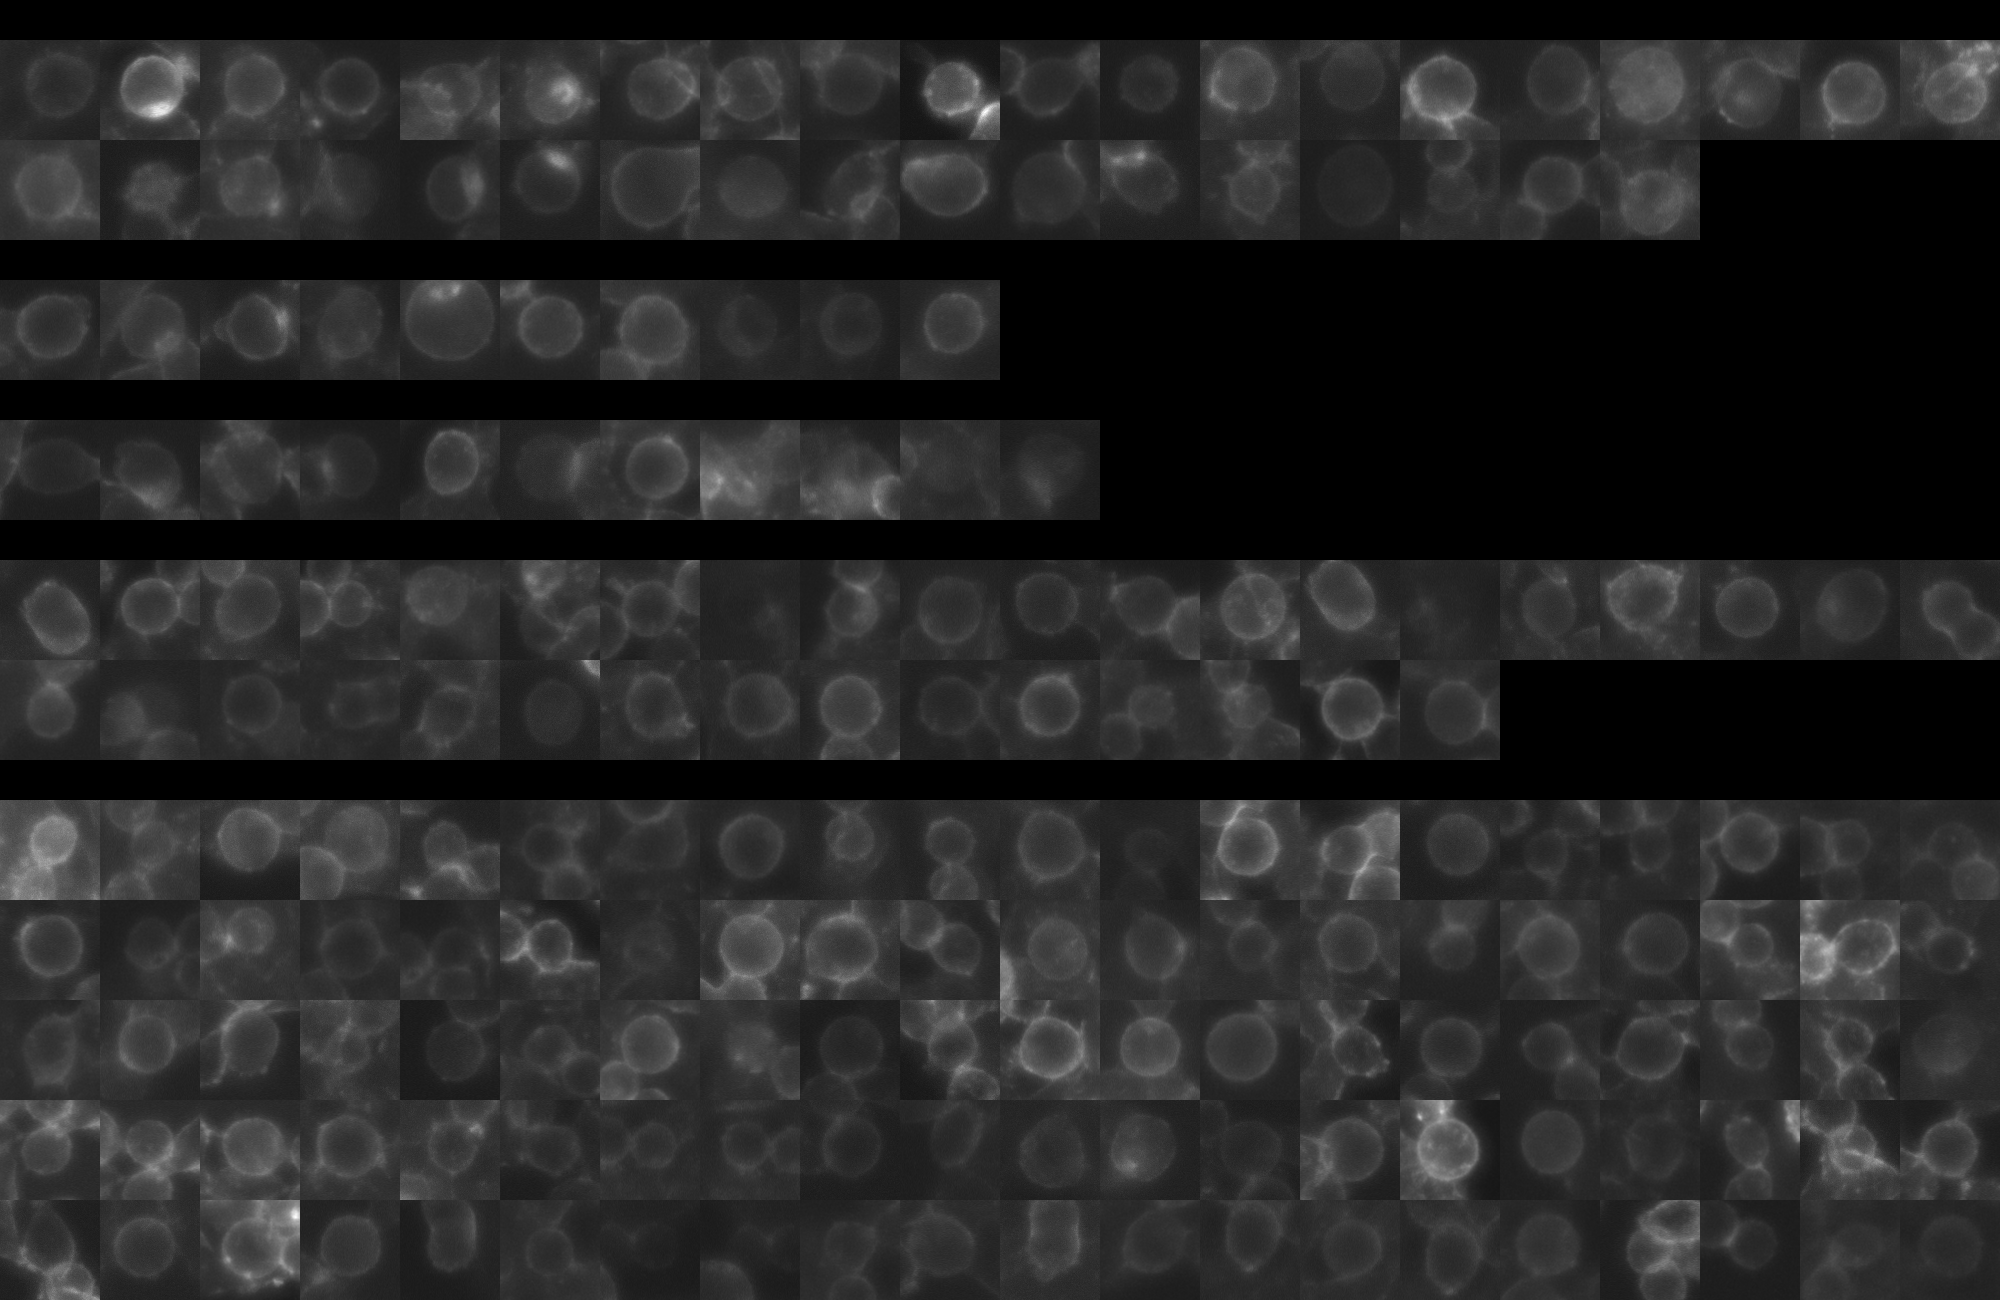
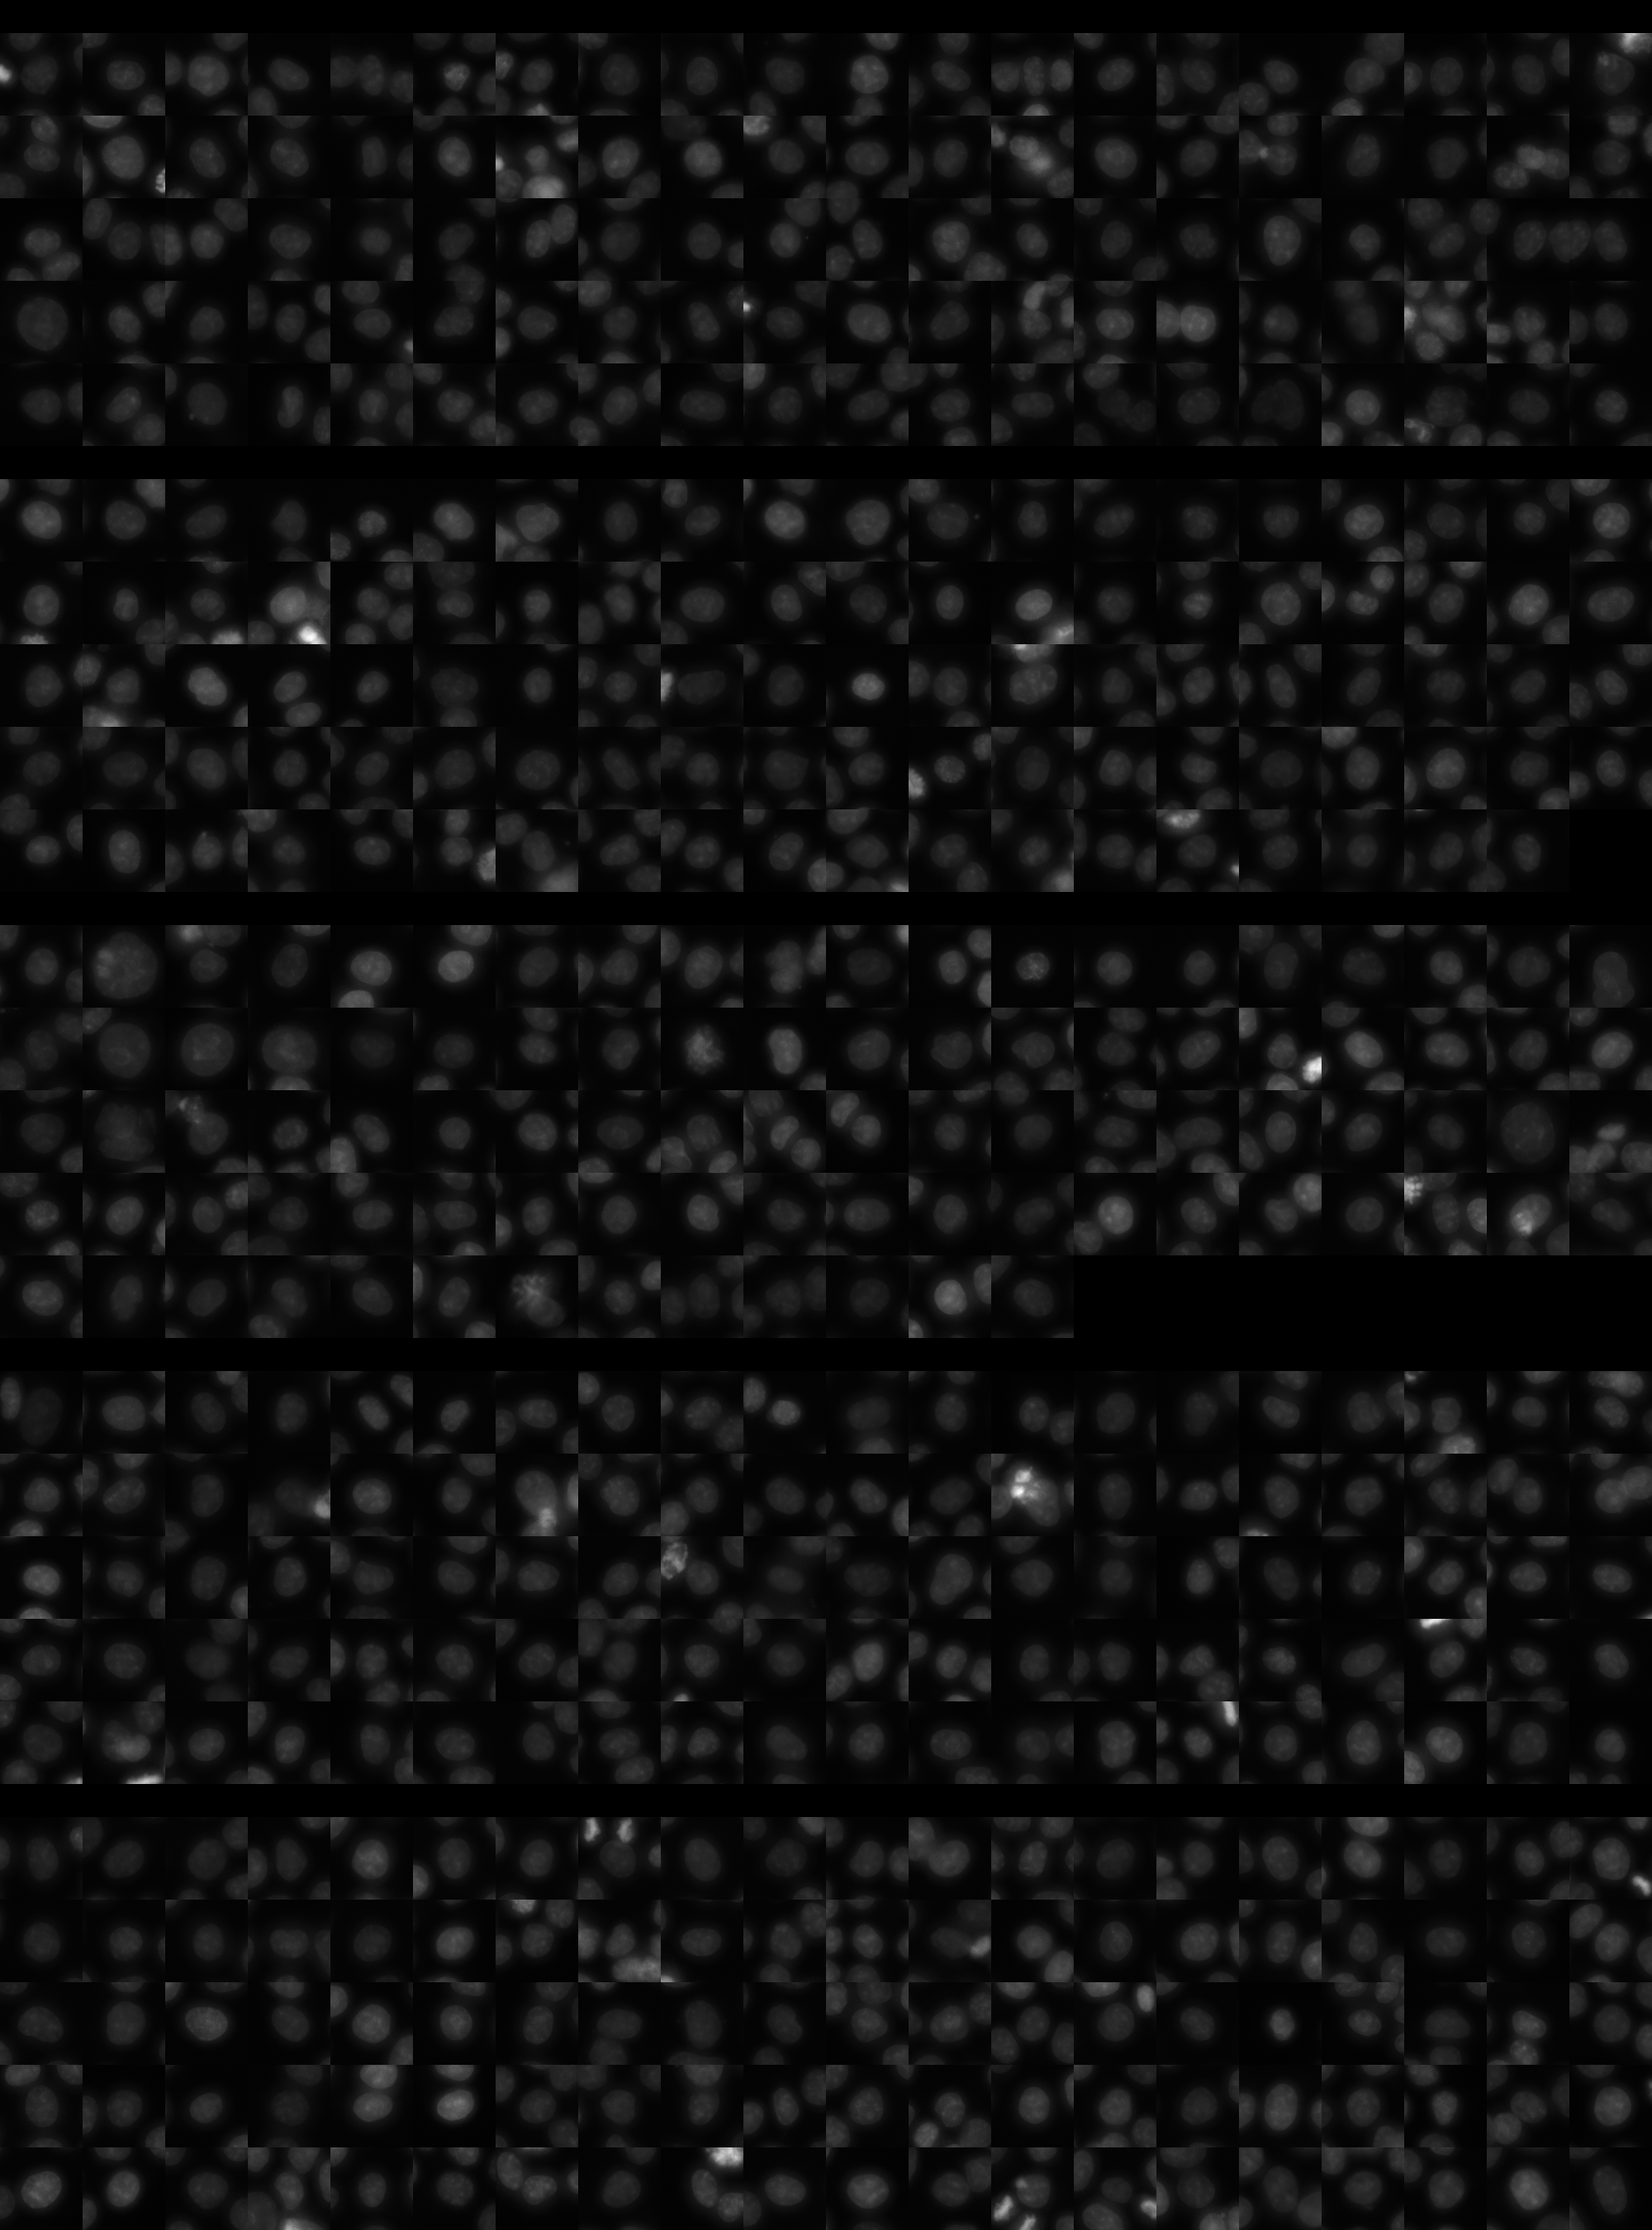
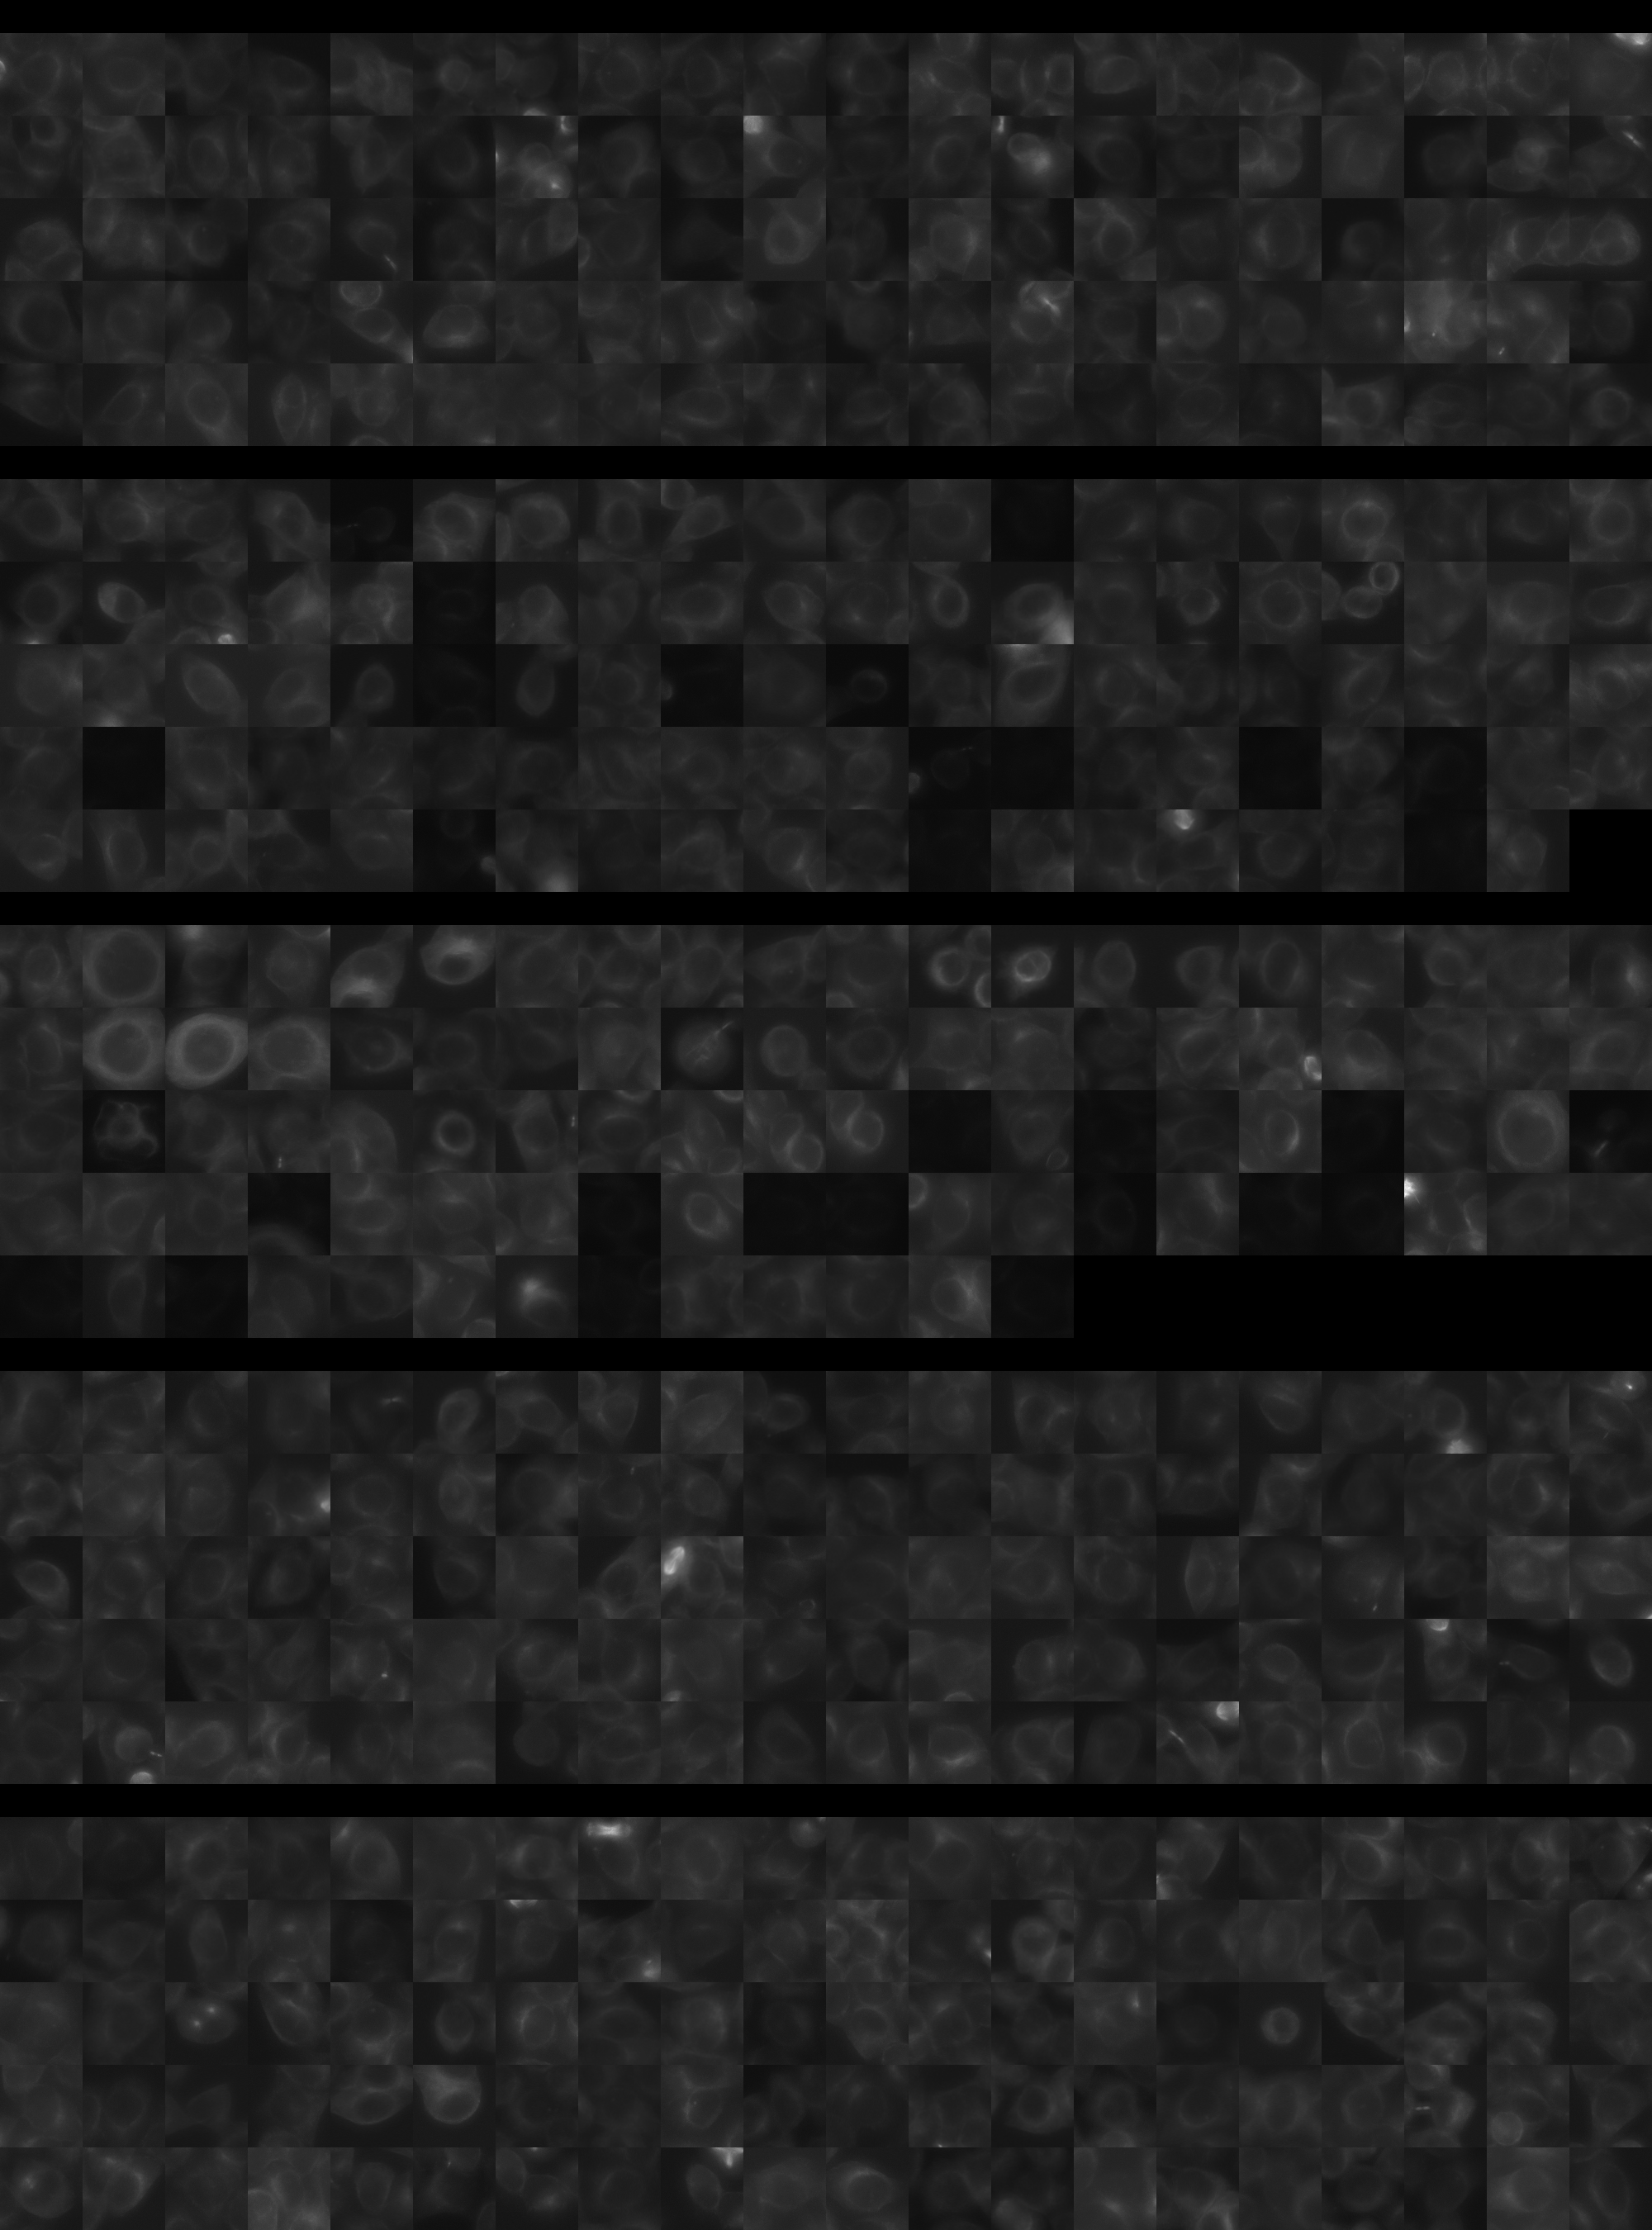
Each montage below shows randomly selected individual cell images for the same target gene separated by sgRNA, along with an example montage of cells expressing a non-targeting negative control sgRNA at the bottom. sgRNA labels in the montages correspond to the numbered sgRNA sequences in the gene info table above. The DNA (blue) and tubulin (green) channels are displayed by default, with gH2AX (grayscale) and actin (yellow) available using the check boxes. Channel brightness, contrast, and opacity are adjustable by clicking the arrow next to the channel name. When only one channel is selected, the display defaults to grayscale. Click the “Zoom” checkbox above the channel controls to enable image zooming (via scrolling) and panning (via click-and-drag).

The cell boxes displayed for this gene are square, 30.36 μm per side for the interphase montage and 30.36 μm per side for the mitotic montage.
Features

Interphase Score Rank FDR q-value
Nucleus DNA Integrated -6.097e-02 5017 of 5322 0.502
Nucleus DNA Mean -3.095e-02 3004 of 5322 0.724
Nucleus gH2AX Mean -3.298e-02 4965 of 5322 0.563
Nucleus DNA - gH2AX Correlation -1.402e-01 4649 of 5322 0.012
Nucleus Shape Area 0.027 2377 of 5322 0.854
Nucleus Shape Eccentricity 0.008 2872 of 5322 0.922
Nucleus Shape Form Factor 0.043 115 of 5322 0.436
Nucleus Shape Solidity -3.905e-03 751 of 5322 0.971
Cell DNA Mass Displacement 0.016 3355 of 5322 0.921
Cell Tubulin Mean -8.665e-03 3128 of 5322 0.957
Cell Tubulin Mass Displacement -1.262e-02 3702 of 5322 0.933
Cell Actin Mean -3.053e-02 3916 of 5322 0.755
Cell Tubulin - Actin Correlation -8.517e-03 4063 of 5322 0.936
Cell DNA - Tubulin Correlation 0.069 1455 of 5322 0.307
Cell Shape Area 1.151e-04 3228 of 5322 0.950
Cell Shape Eccentricity 0.049 617 of 5322 0.732
Mitotic Score Rank FDR q-value
Nucleus DNA Integrated 0.967 2 of 5322 0.026
Nucleus DNA Mean 0.376 113 of 5322 1.000
Nucleus DNA Mass Displacement 0.303 253 of 5322 0.999
Nucleus DNA Mean Frac 3 -3.125e-01 5250 of 5322 1.000
Nucleus gH2AX Mean 0.286 378 of 5322 1.000
Nucleus gH2AX Mean Frac 0 1.230 2 of 5322 0.035
Nucleus Tubulin Mean Frac 0 1.639 7 of 5322 0.005
Nucleus Tubulin Mean Edge -2.007e-01 4894 of 5322 0.996
Nucleus Tubulin Std Edge -8.447e-01 5301 of 5322 0.002
Nucleus Shape Area 0.771 93 of 5322 0.013
Nucleus Shape Eccentricity -6.017e-01 5241 of 5322 0.461
Nucleus Shape Form Factor -8.865e-01 5310 of 5322 0.042
Cell Tubulin Mean 0.298 442 of 5322 0.958
Cell Tubulin Mean Frac 3 -5.823e-01 5257 of 5322 0.144
Cell Actin Mean -1.795e-01 4958 of 5322 0.997
Cell Shape Area 0.440 279 of 5322 0.688
( Reset Zoom )
Brightness
Contrast
Opacity
Brightness
Contrast
Opacity
Brightness
Contrast
Opacity
Brightness
Contrast
Opacity
Brightness
Contrast
Opacity

( Reset Zoom )
Brightness
Contrast
Opacity
Brightness
Contrast
Opacity
Brightness
Contrast
Opacity
Brightness
Contrast
Opacity
Brightness
Contrast
Opacity

Day 3

Day 4

MIT Central Accessability