ANAPC1

Gene symbol: ANAPC1
Gene: 64682
Uniprot Function: Component of the anaphase promoting complex/cyclosome (APC/C), a cell cycle-regulated E3 ubiquitin ligase that controls progression through mitosis and the G1 phase of the cell cycle. The APC/C complex acts by mediating ubiquitination and subsequent degradation of target proteins: it mainly mediates the formation of 'Lys-11'-linked polyubiquitin chains and, to a lower extent, the formation of 'Lys-48'- and 'Lys-63'-linked polyubiquitin chains.
Mitotic Index 0.0881
Interphase Cluster: #95 (24 genes)
Mitotic Cluster: #11 (44 genes)
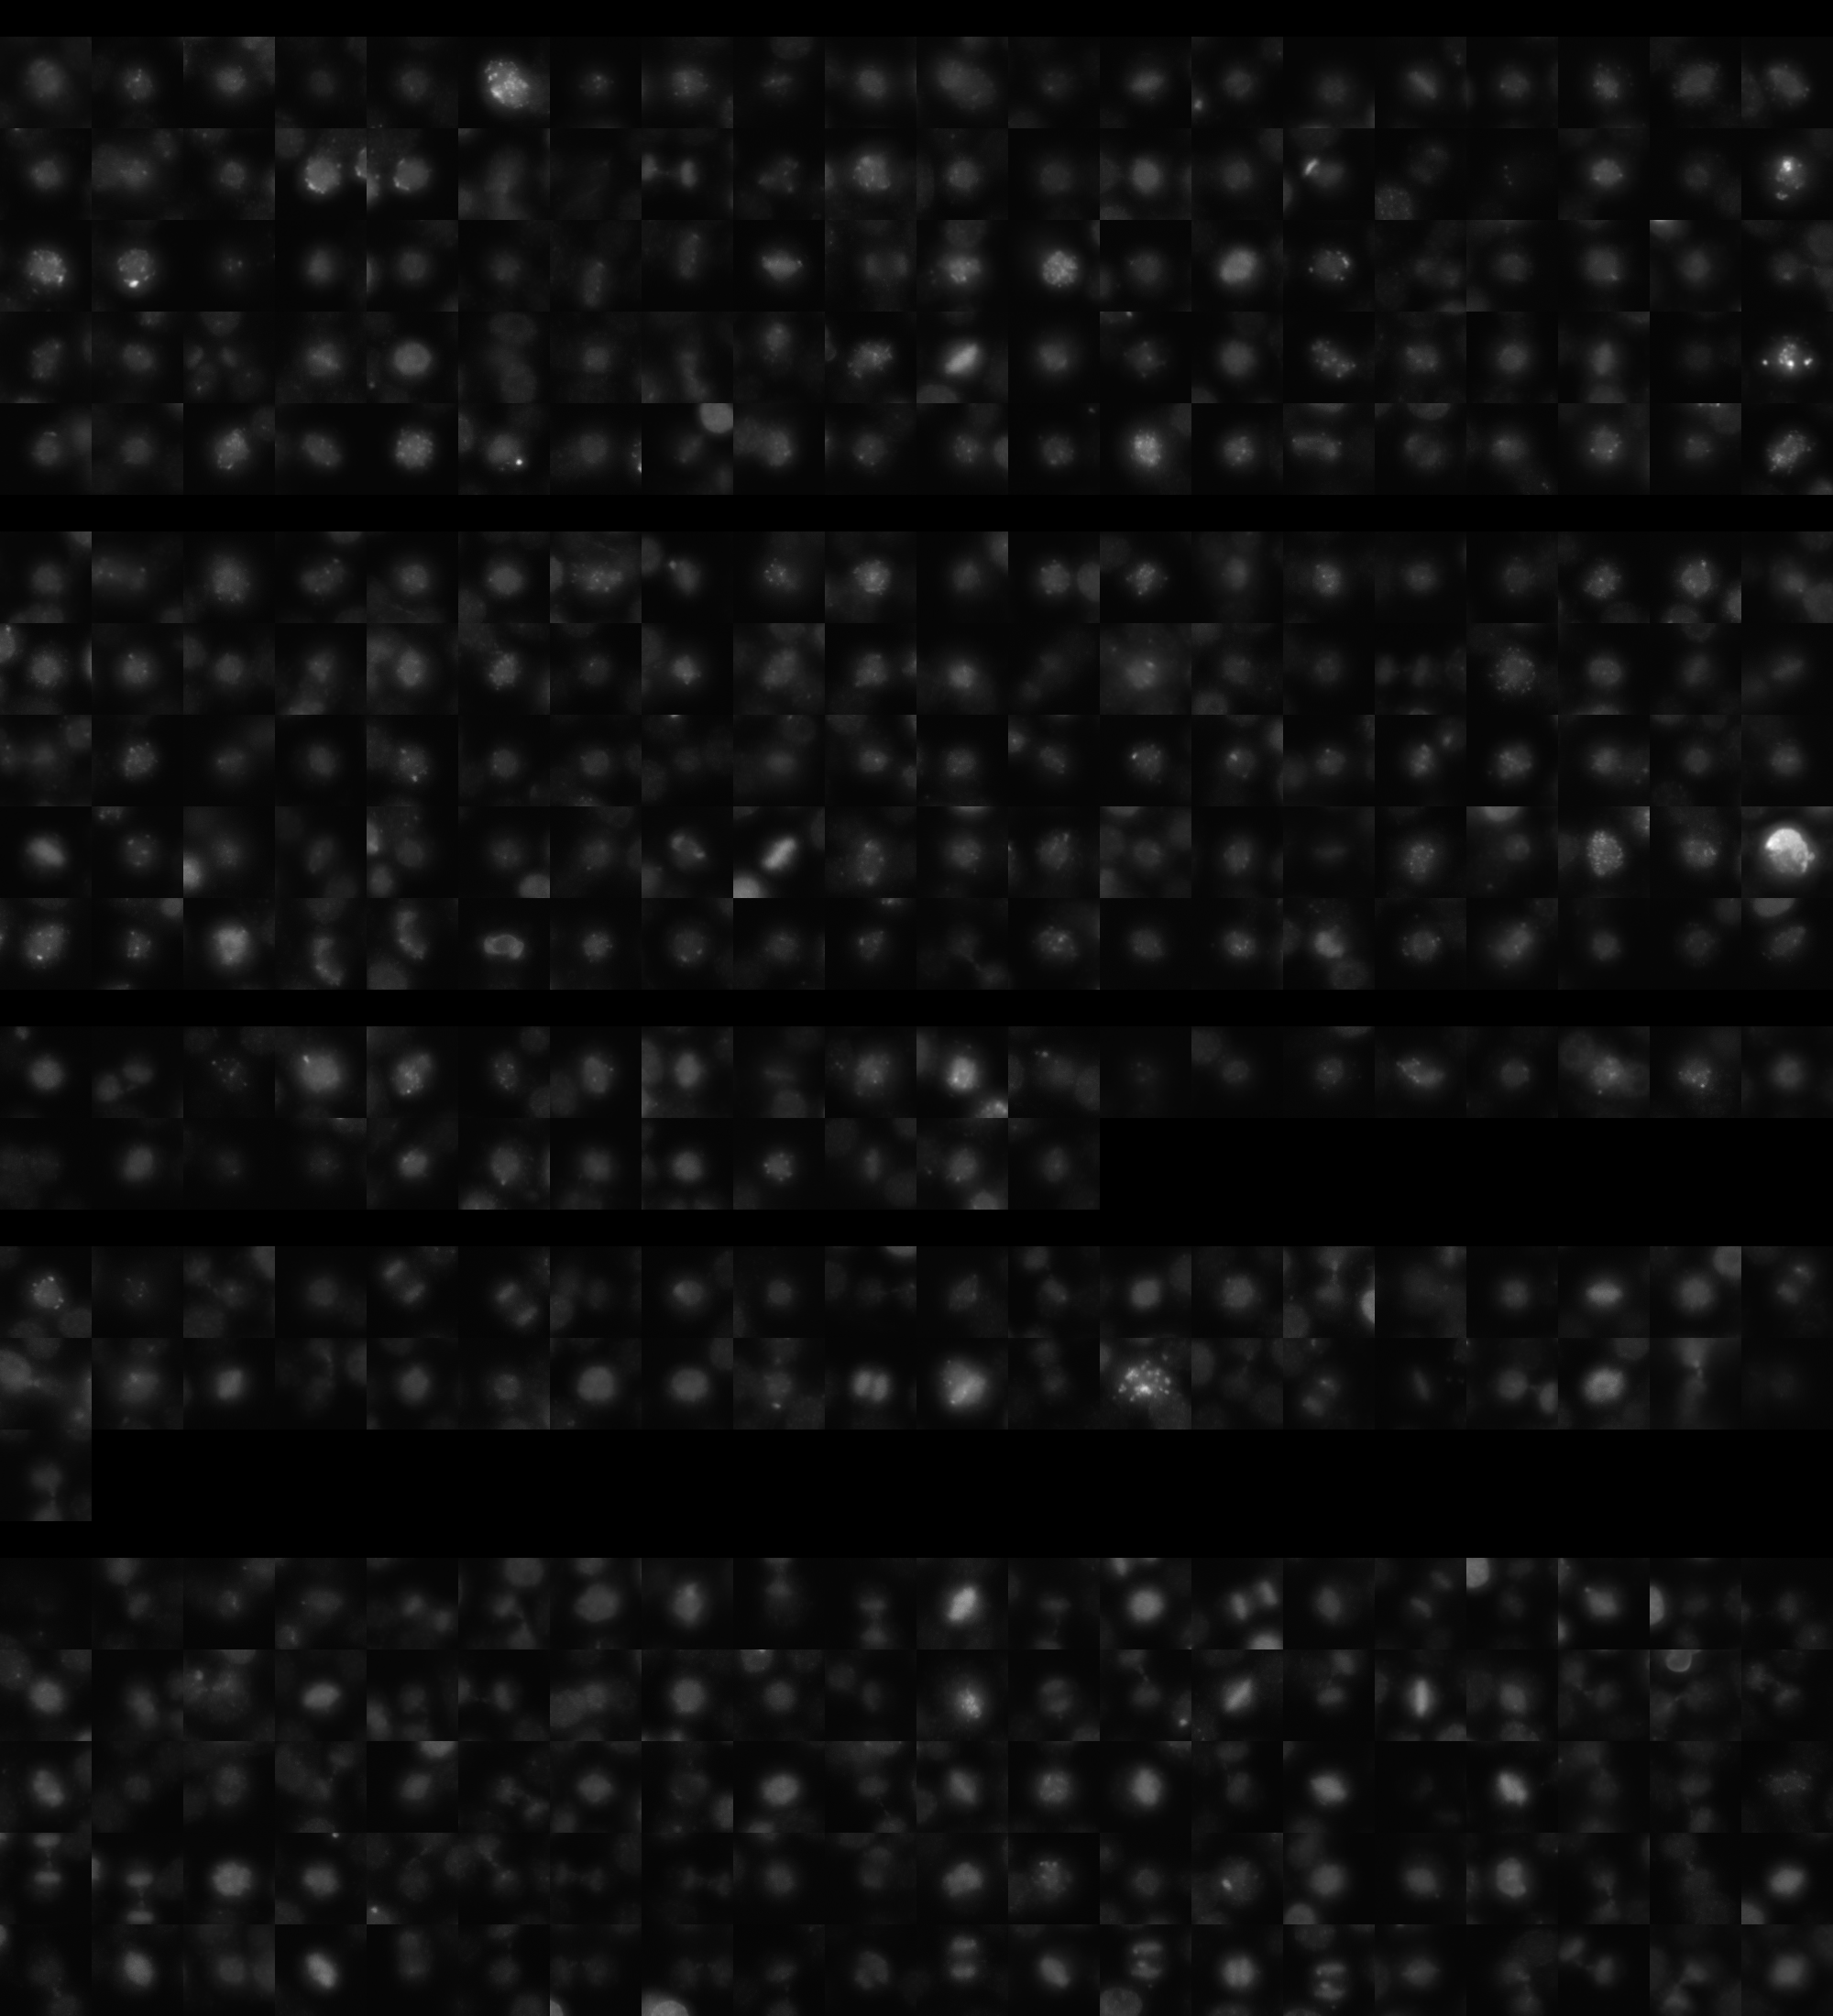
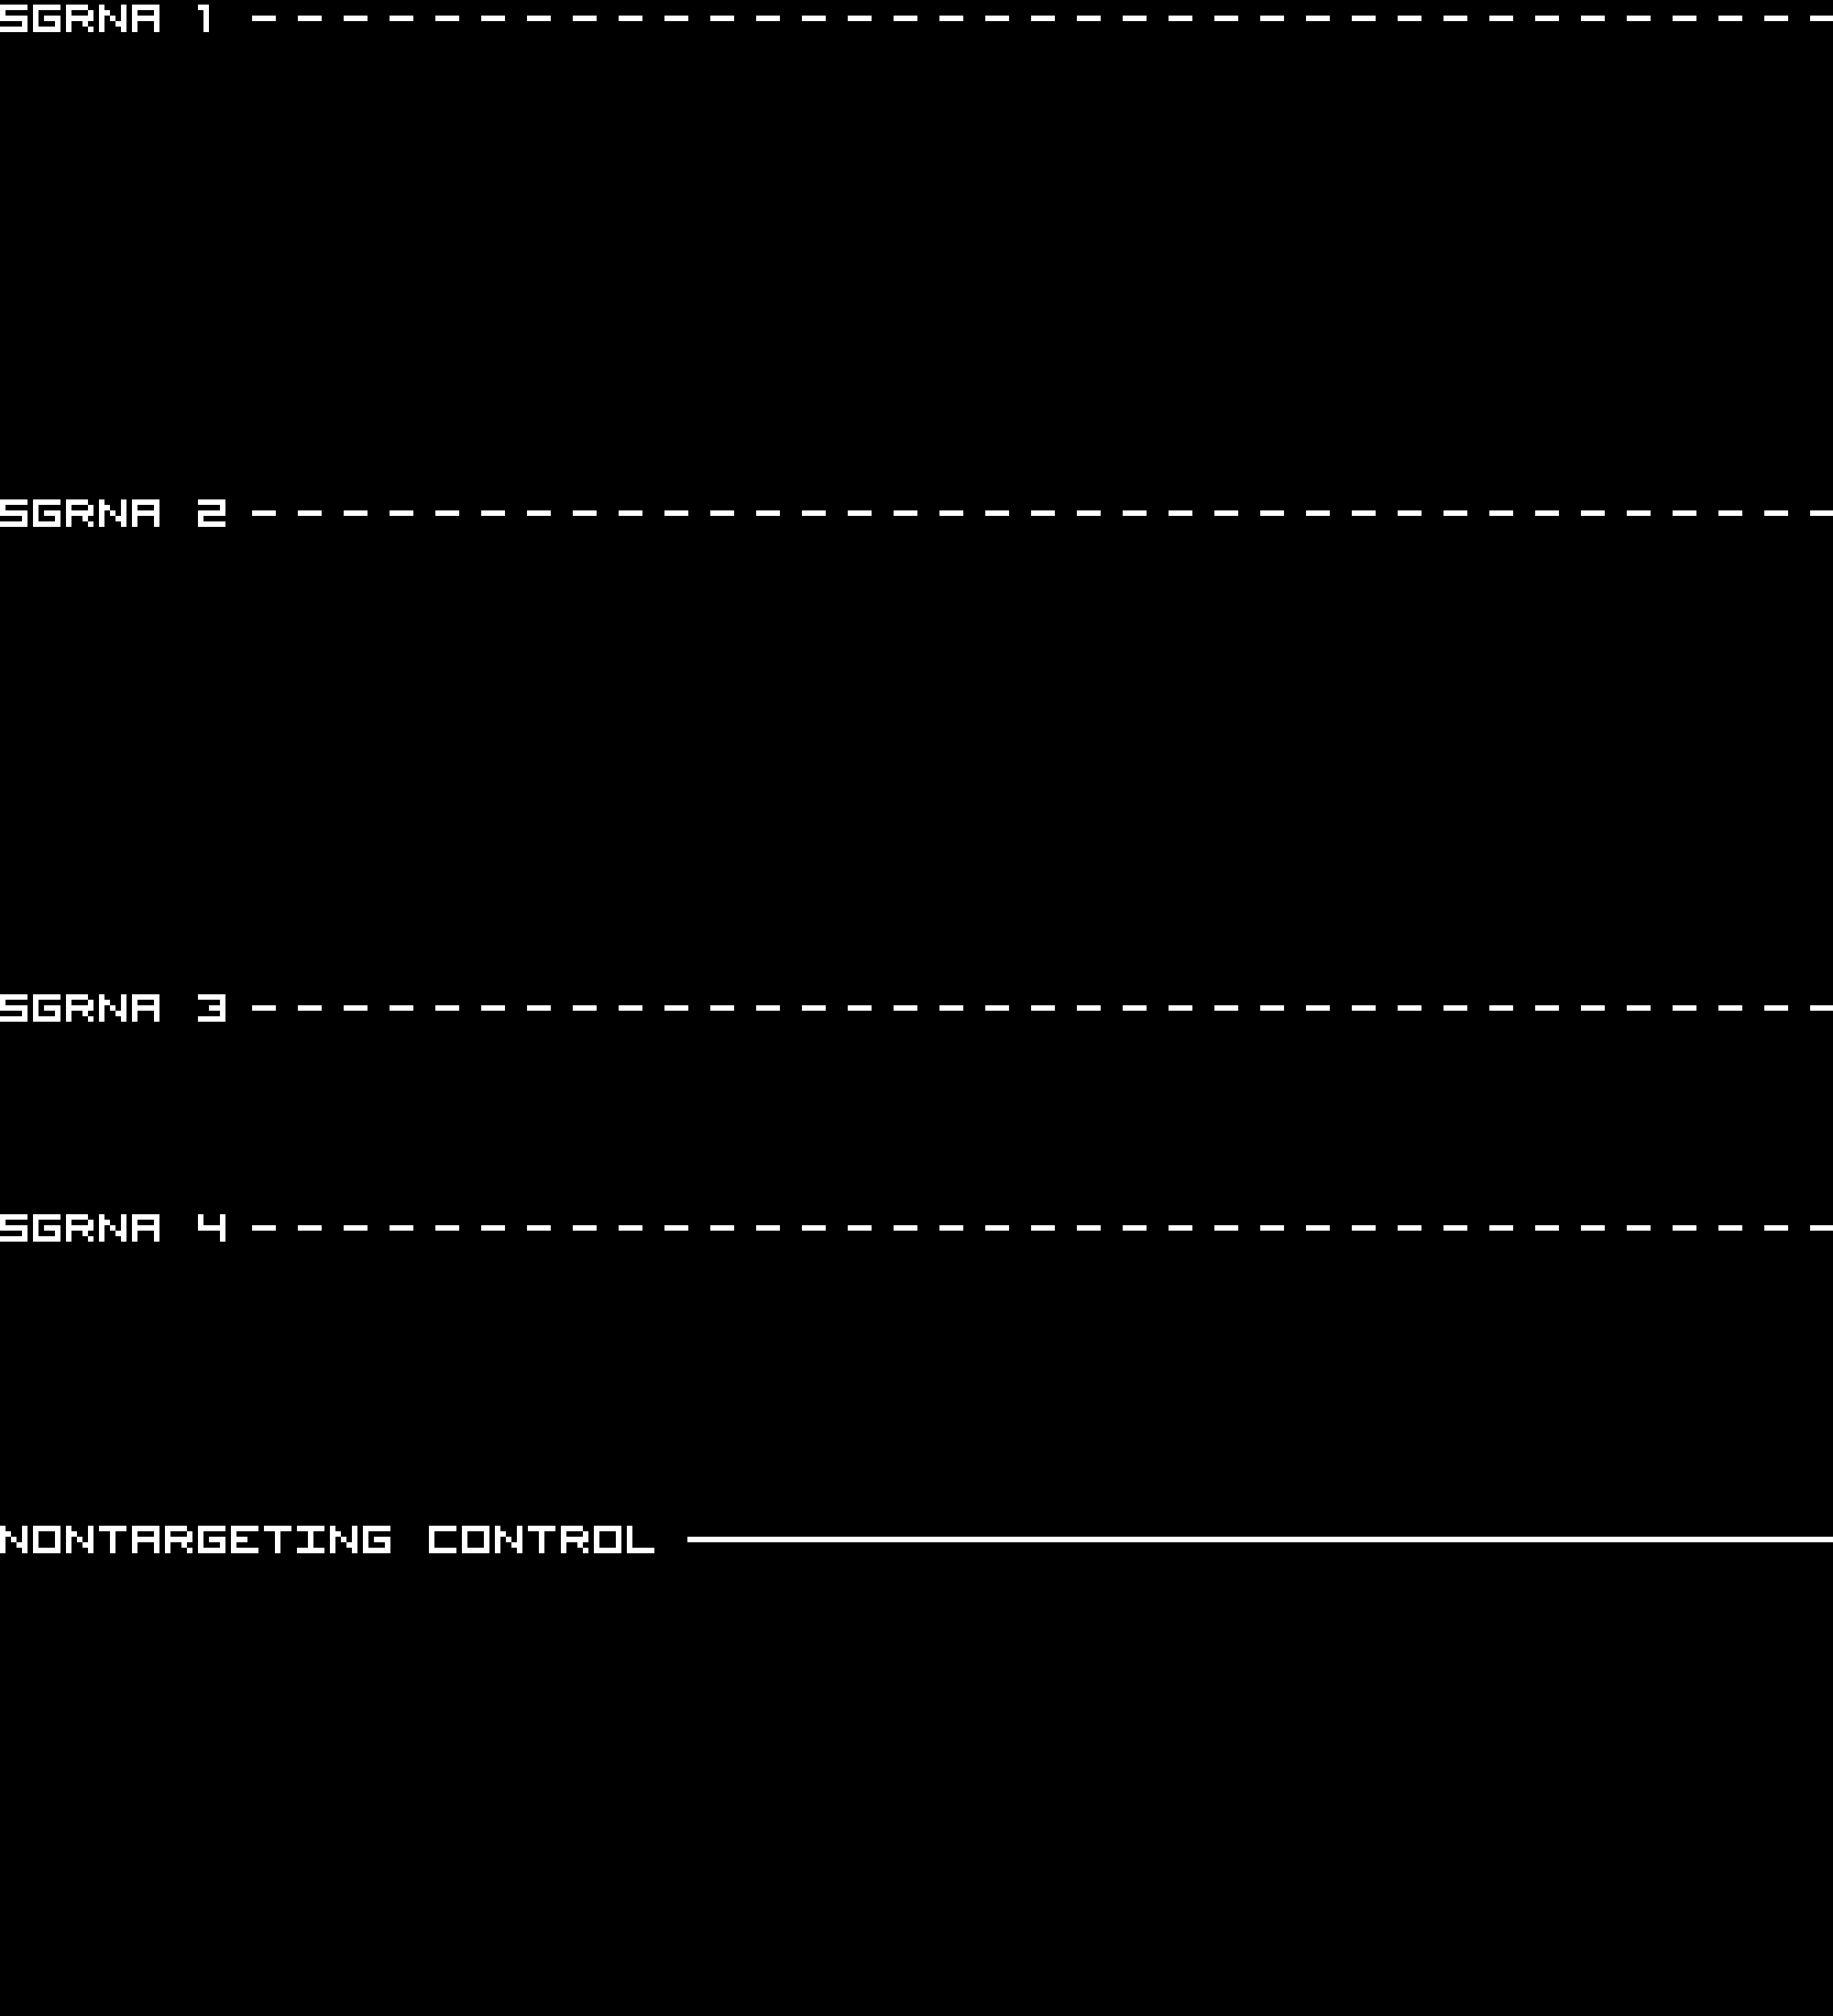
sgRNA 1: GAAGGTTCAAAGCATTAGGG (interphase cells: 1114, mitotic cells: 147)
sgRNA 2: GTCCCAGCTCCAGTTACGGT (interphase cells: 864, mitotic cells: 145)
sgRNA 3: GTTGTCTGGATGACTAATGT (interphase cells: 464, mitotic cells: 32)
sgRNA 4: TGTCCATAACAGAGTCACCC (interphase cells: 1336, mitotic cells: 41)

Interphase Cluster

Mitotic Cluster

Overview

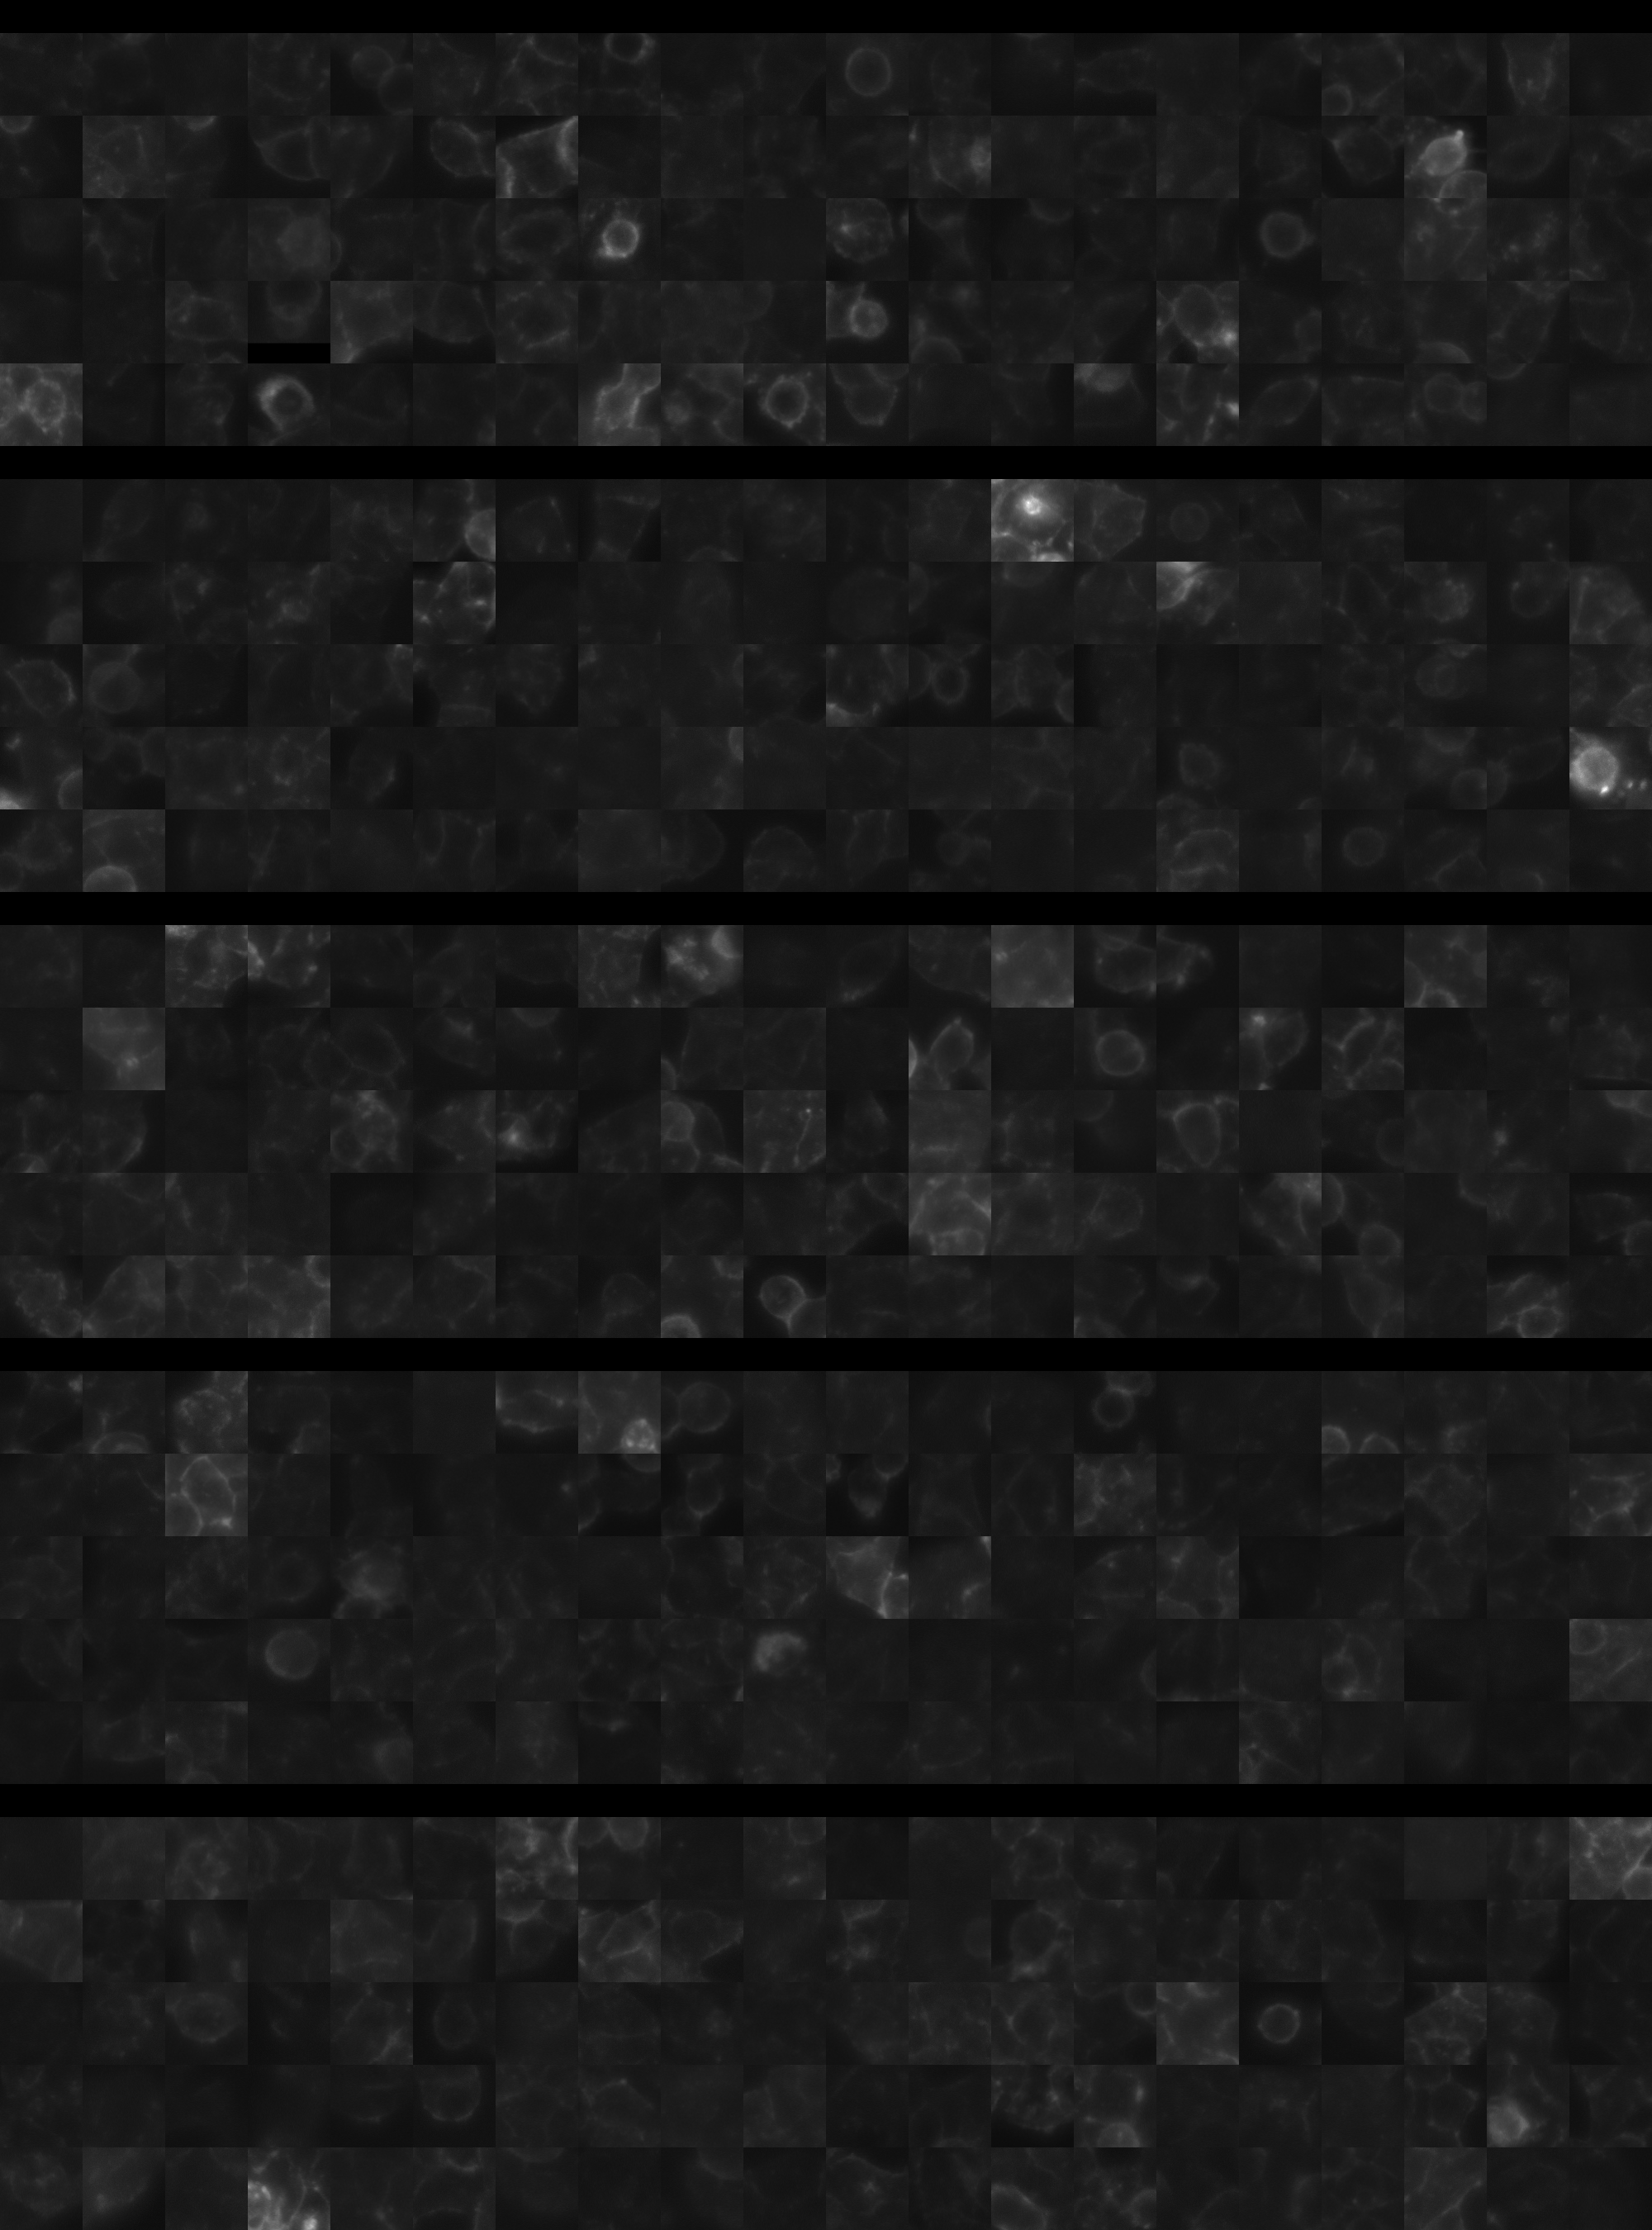
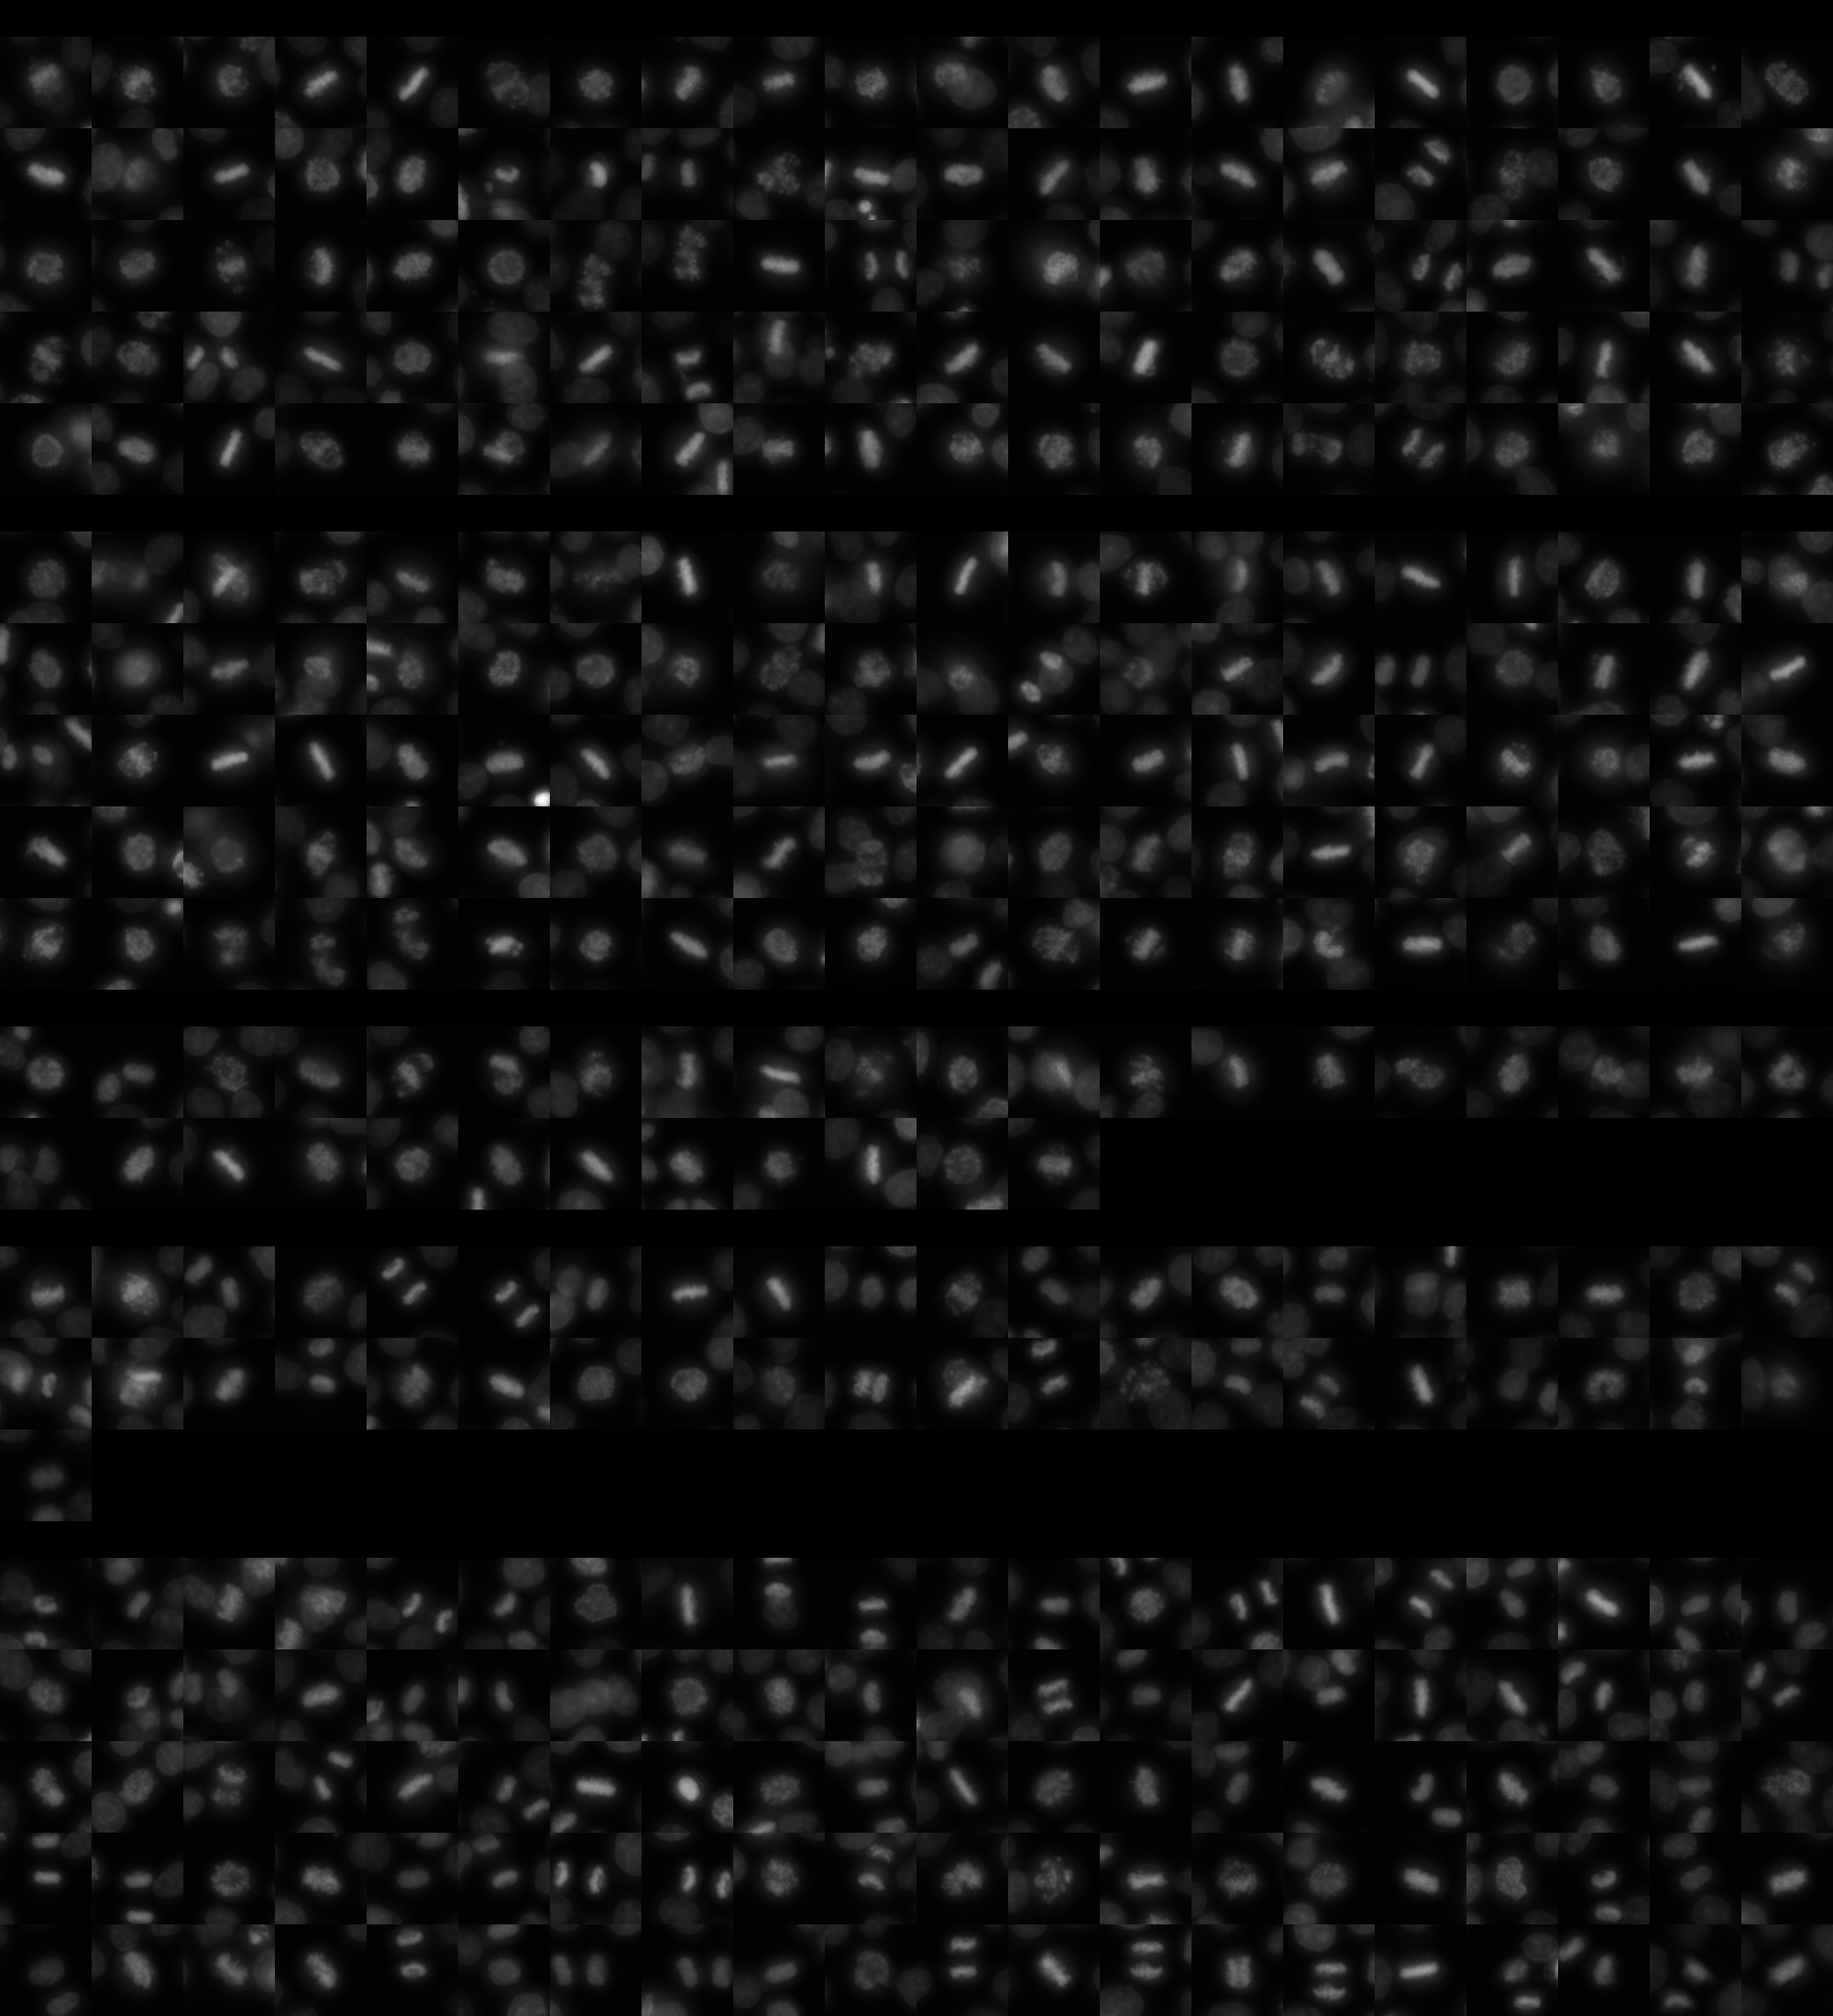
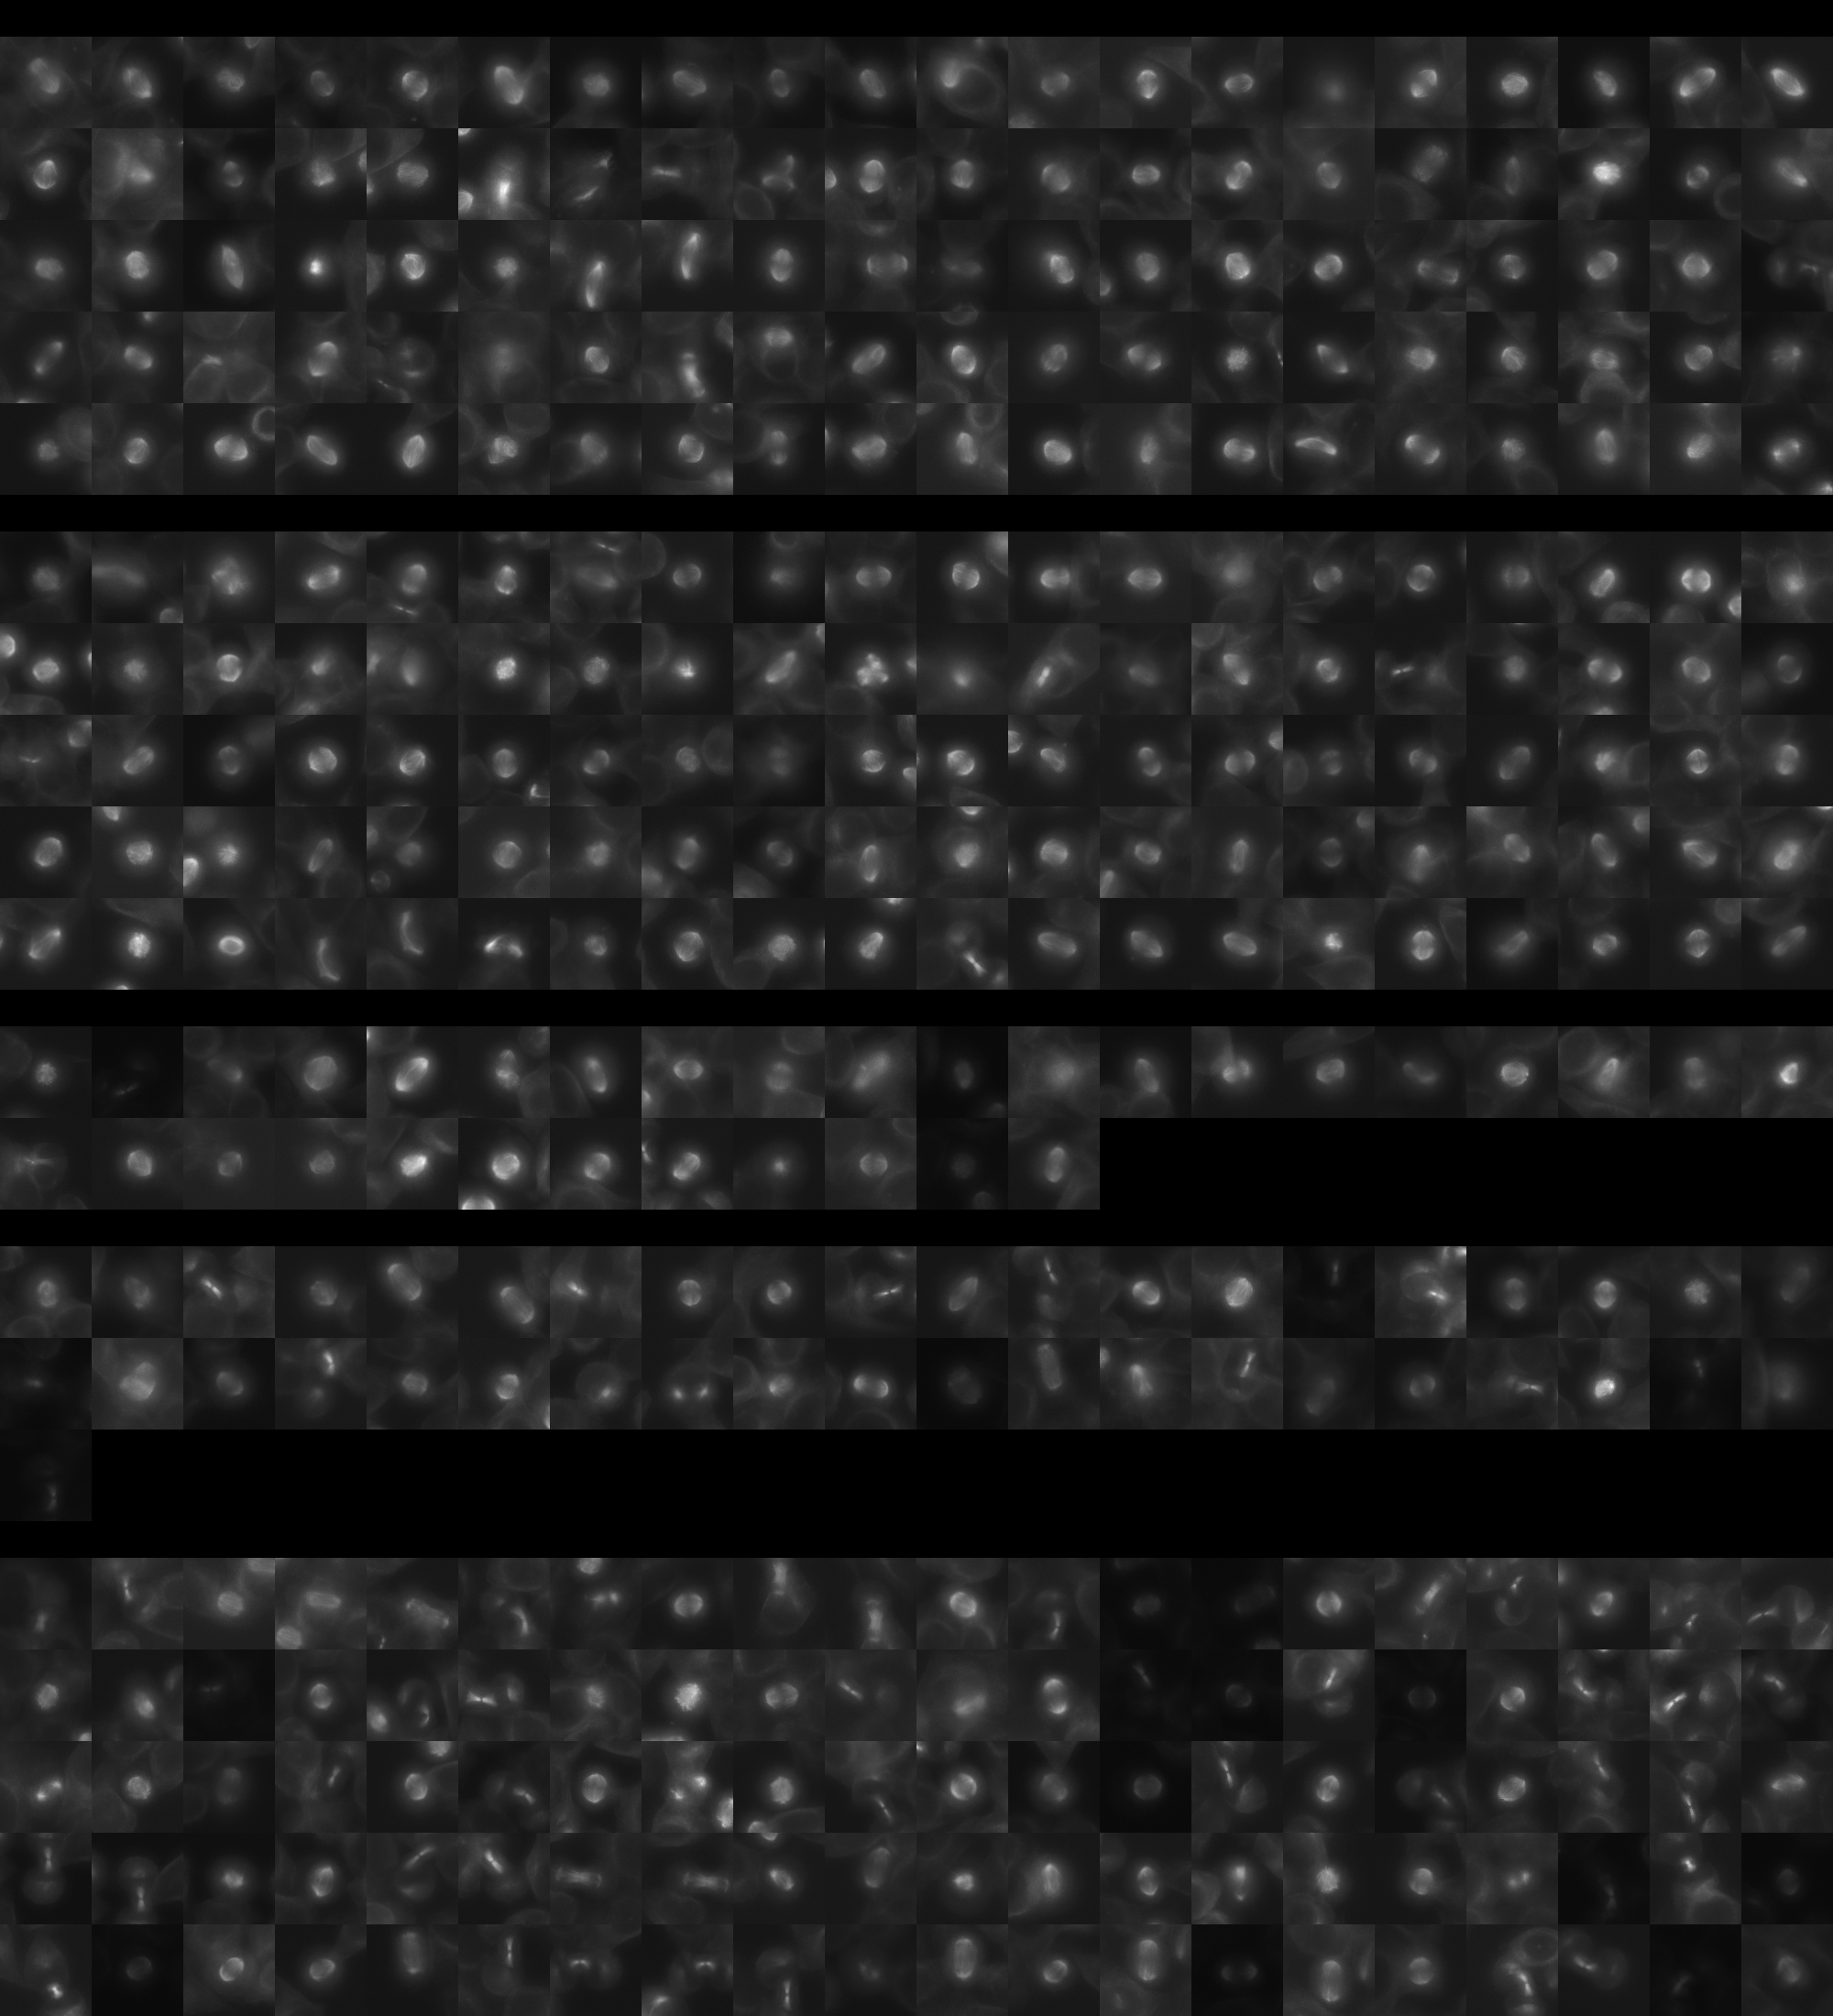
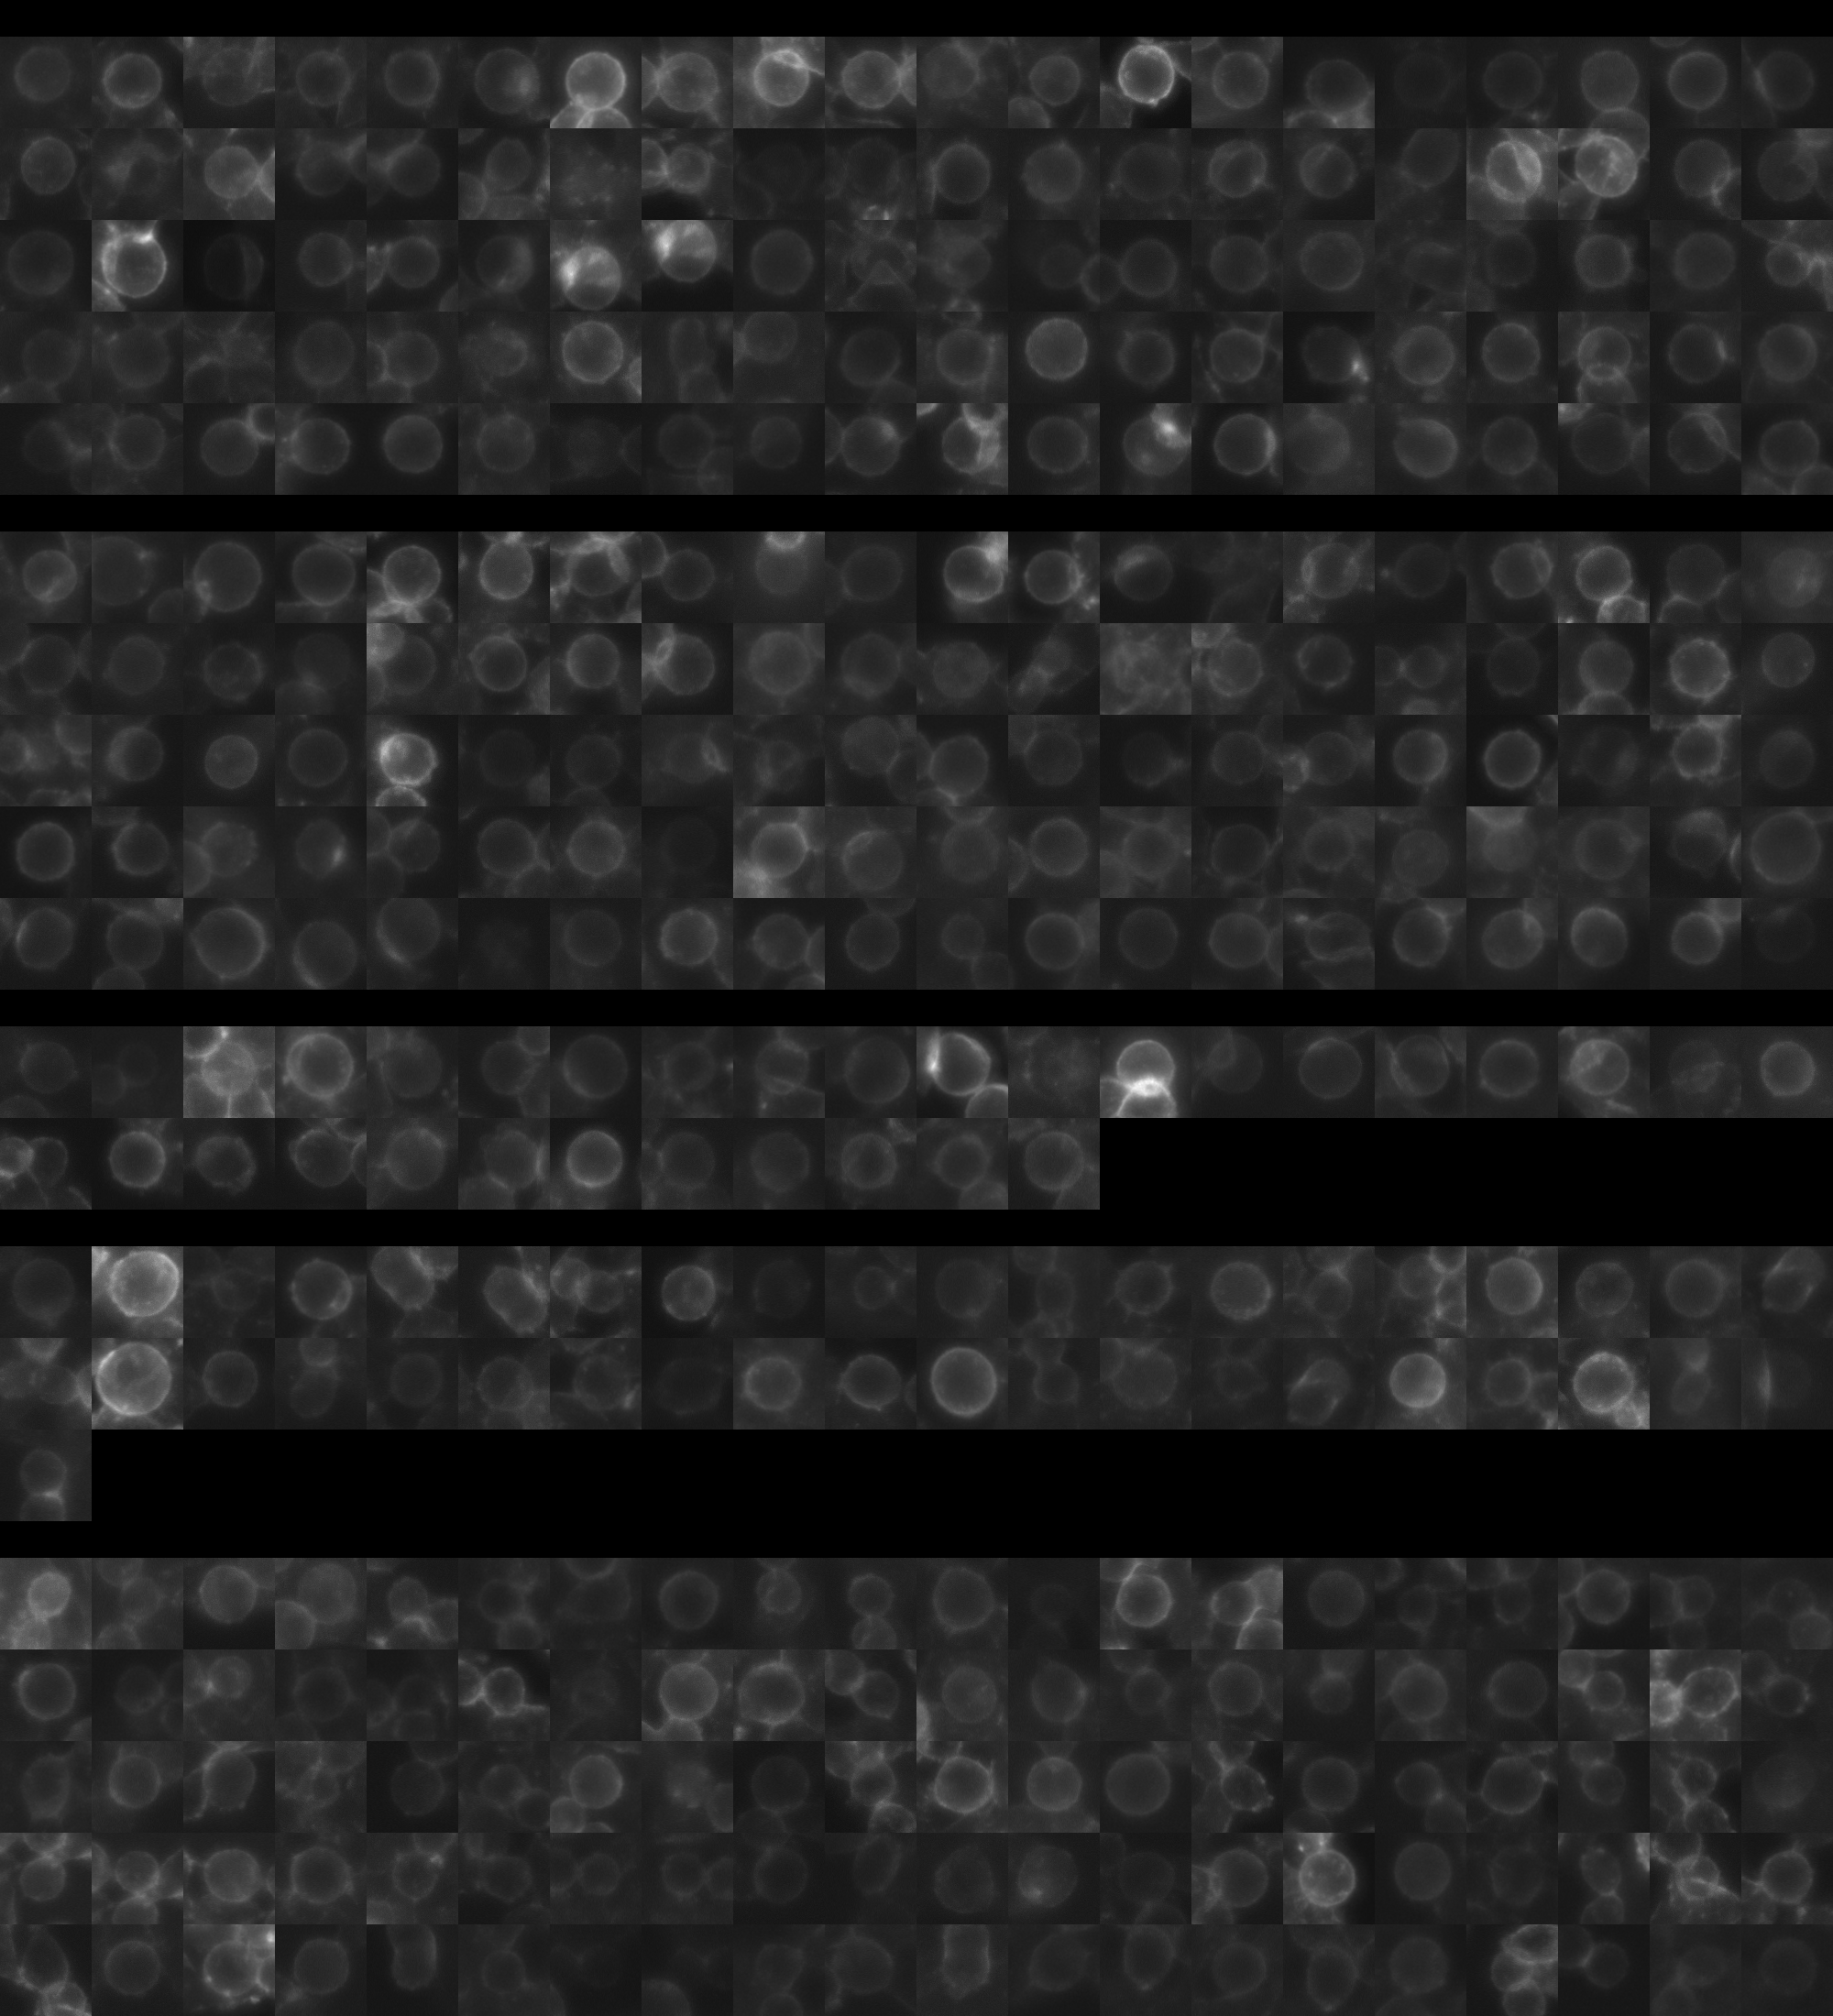
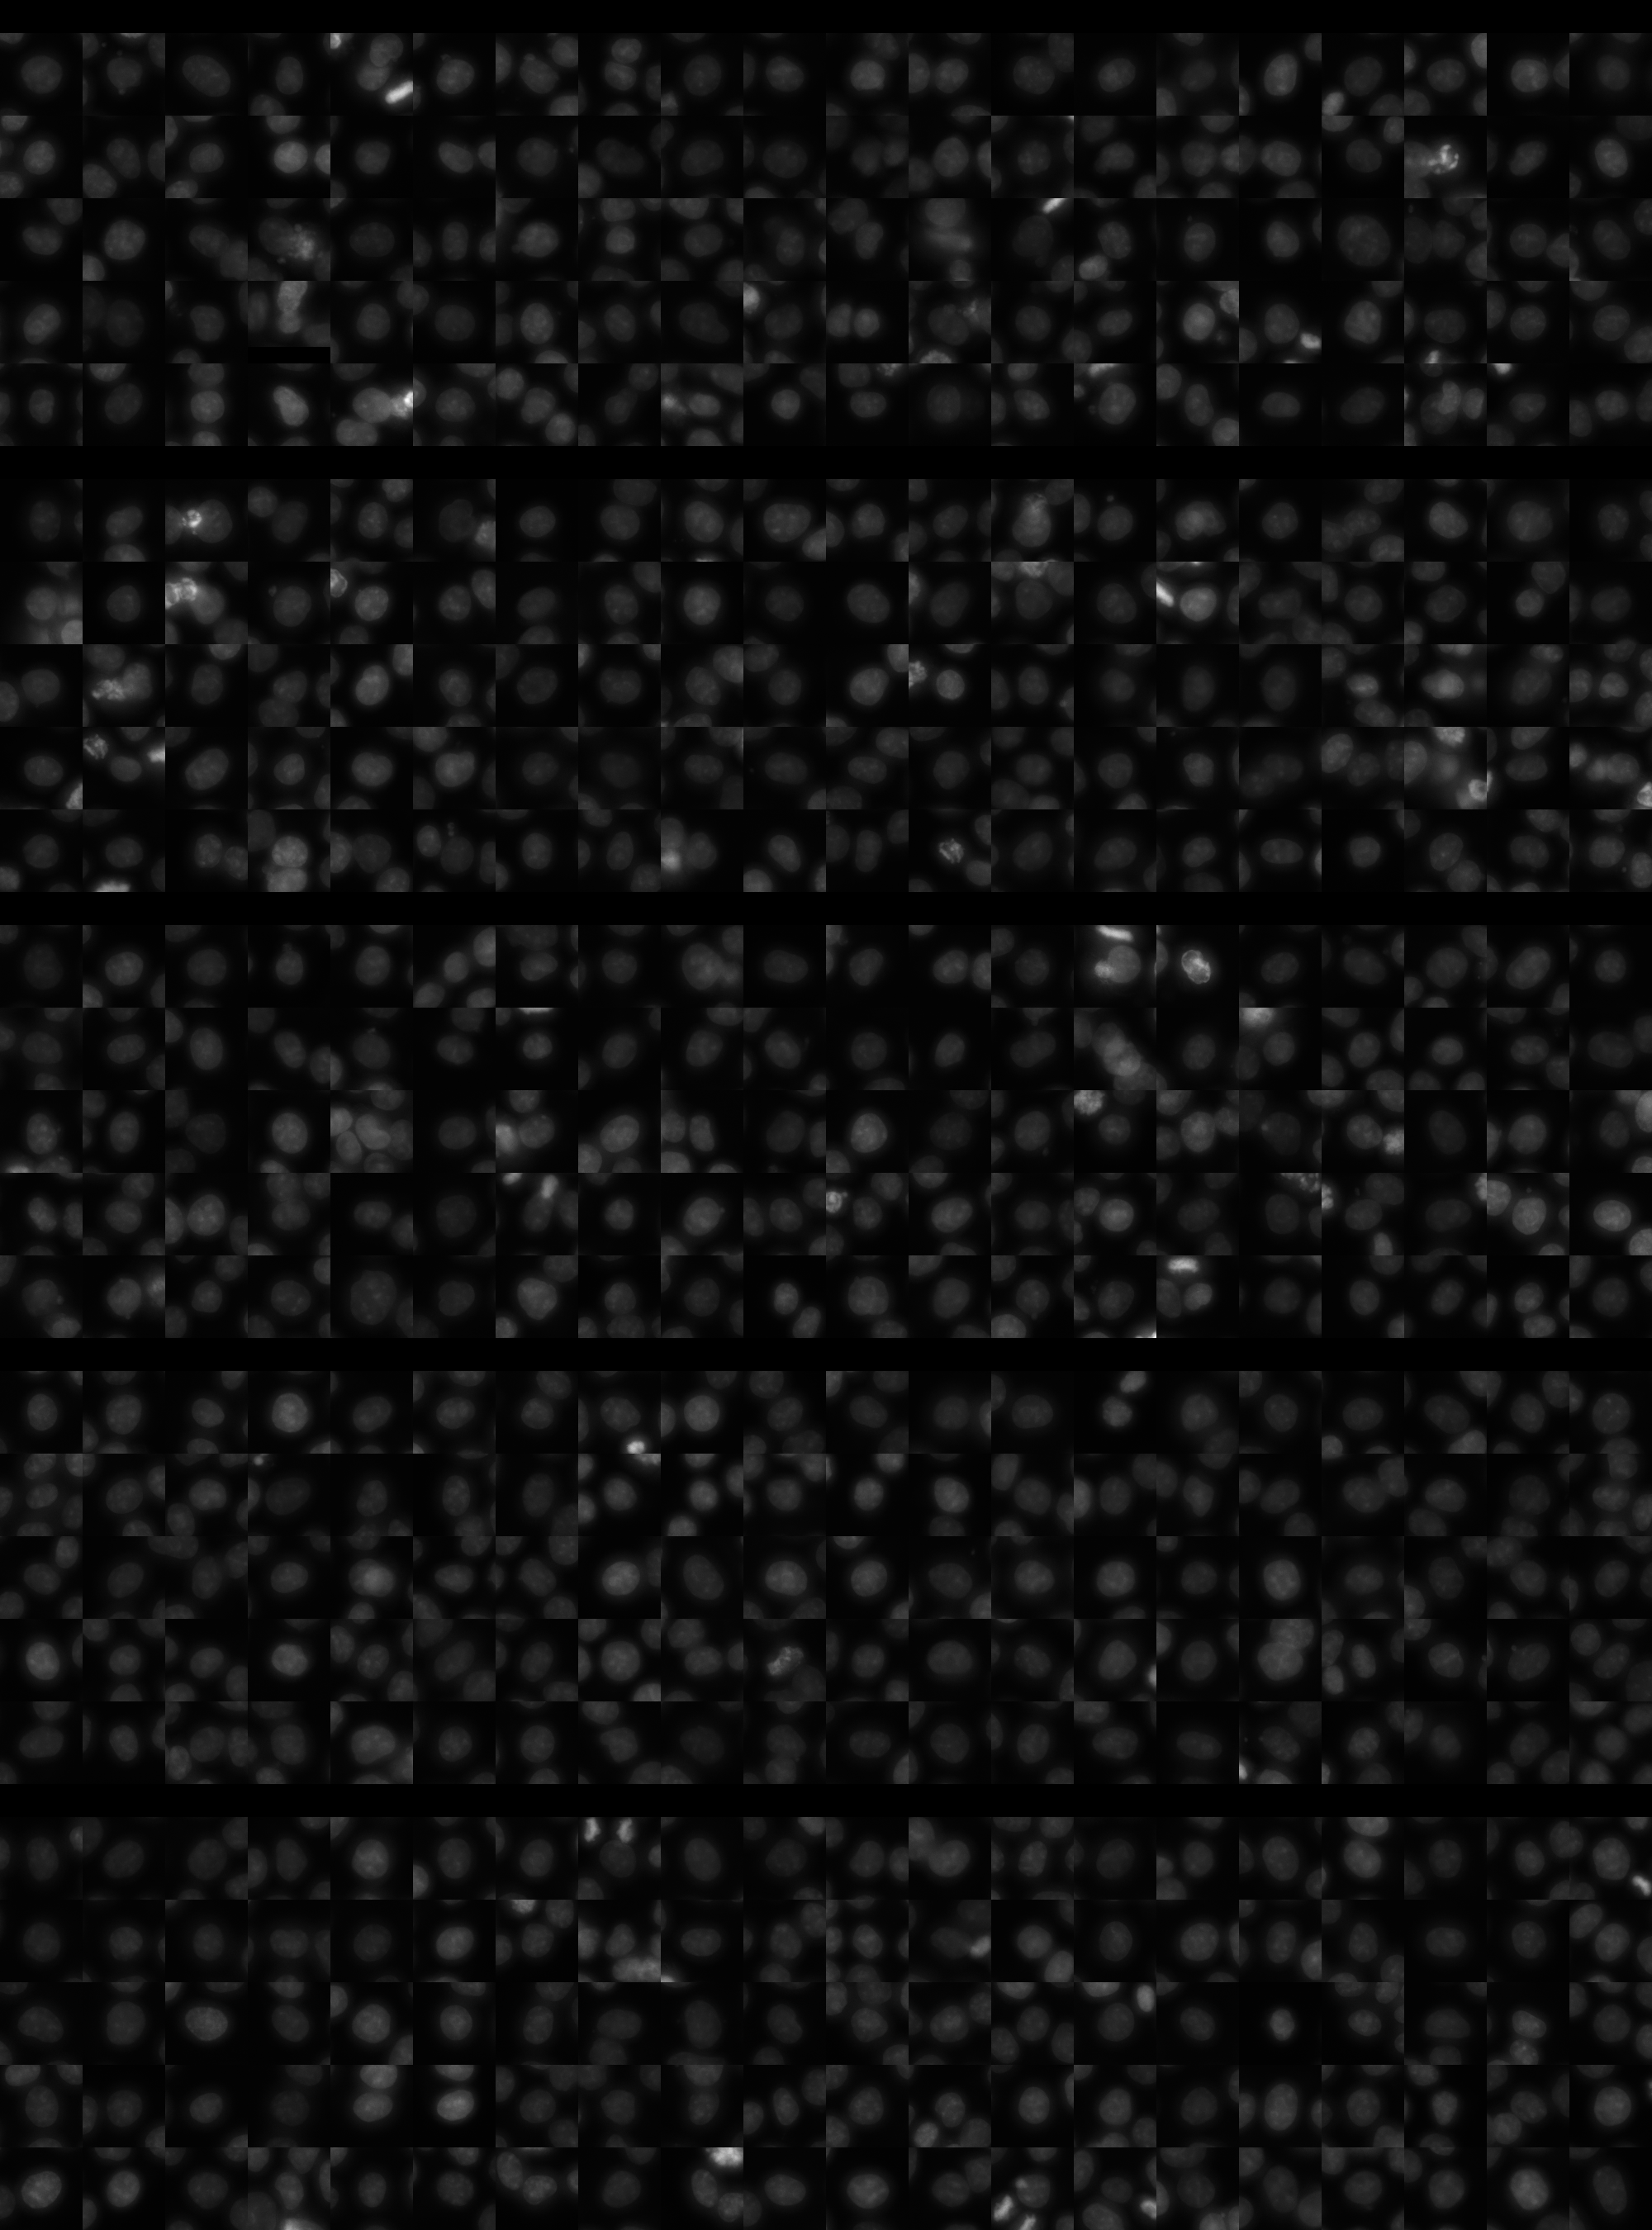
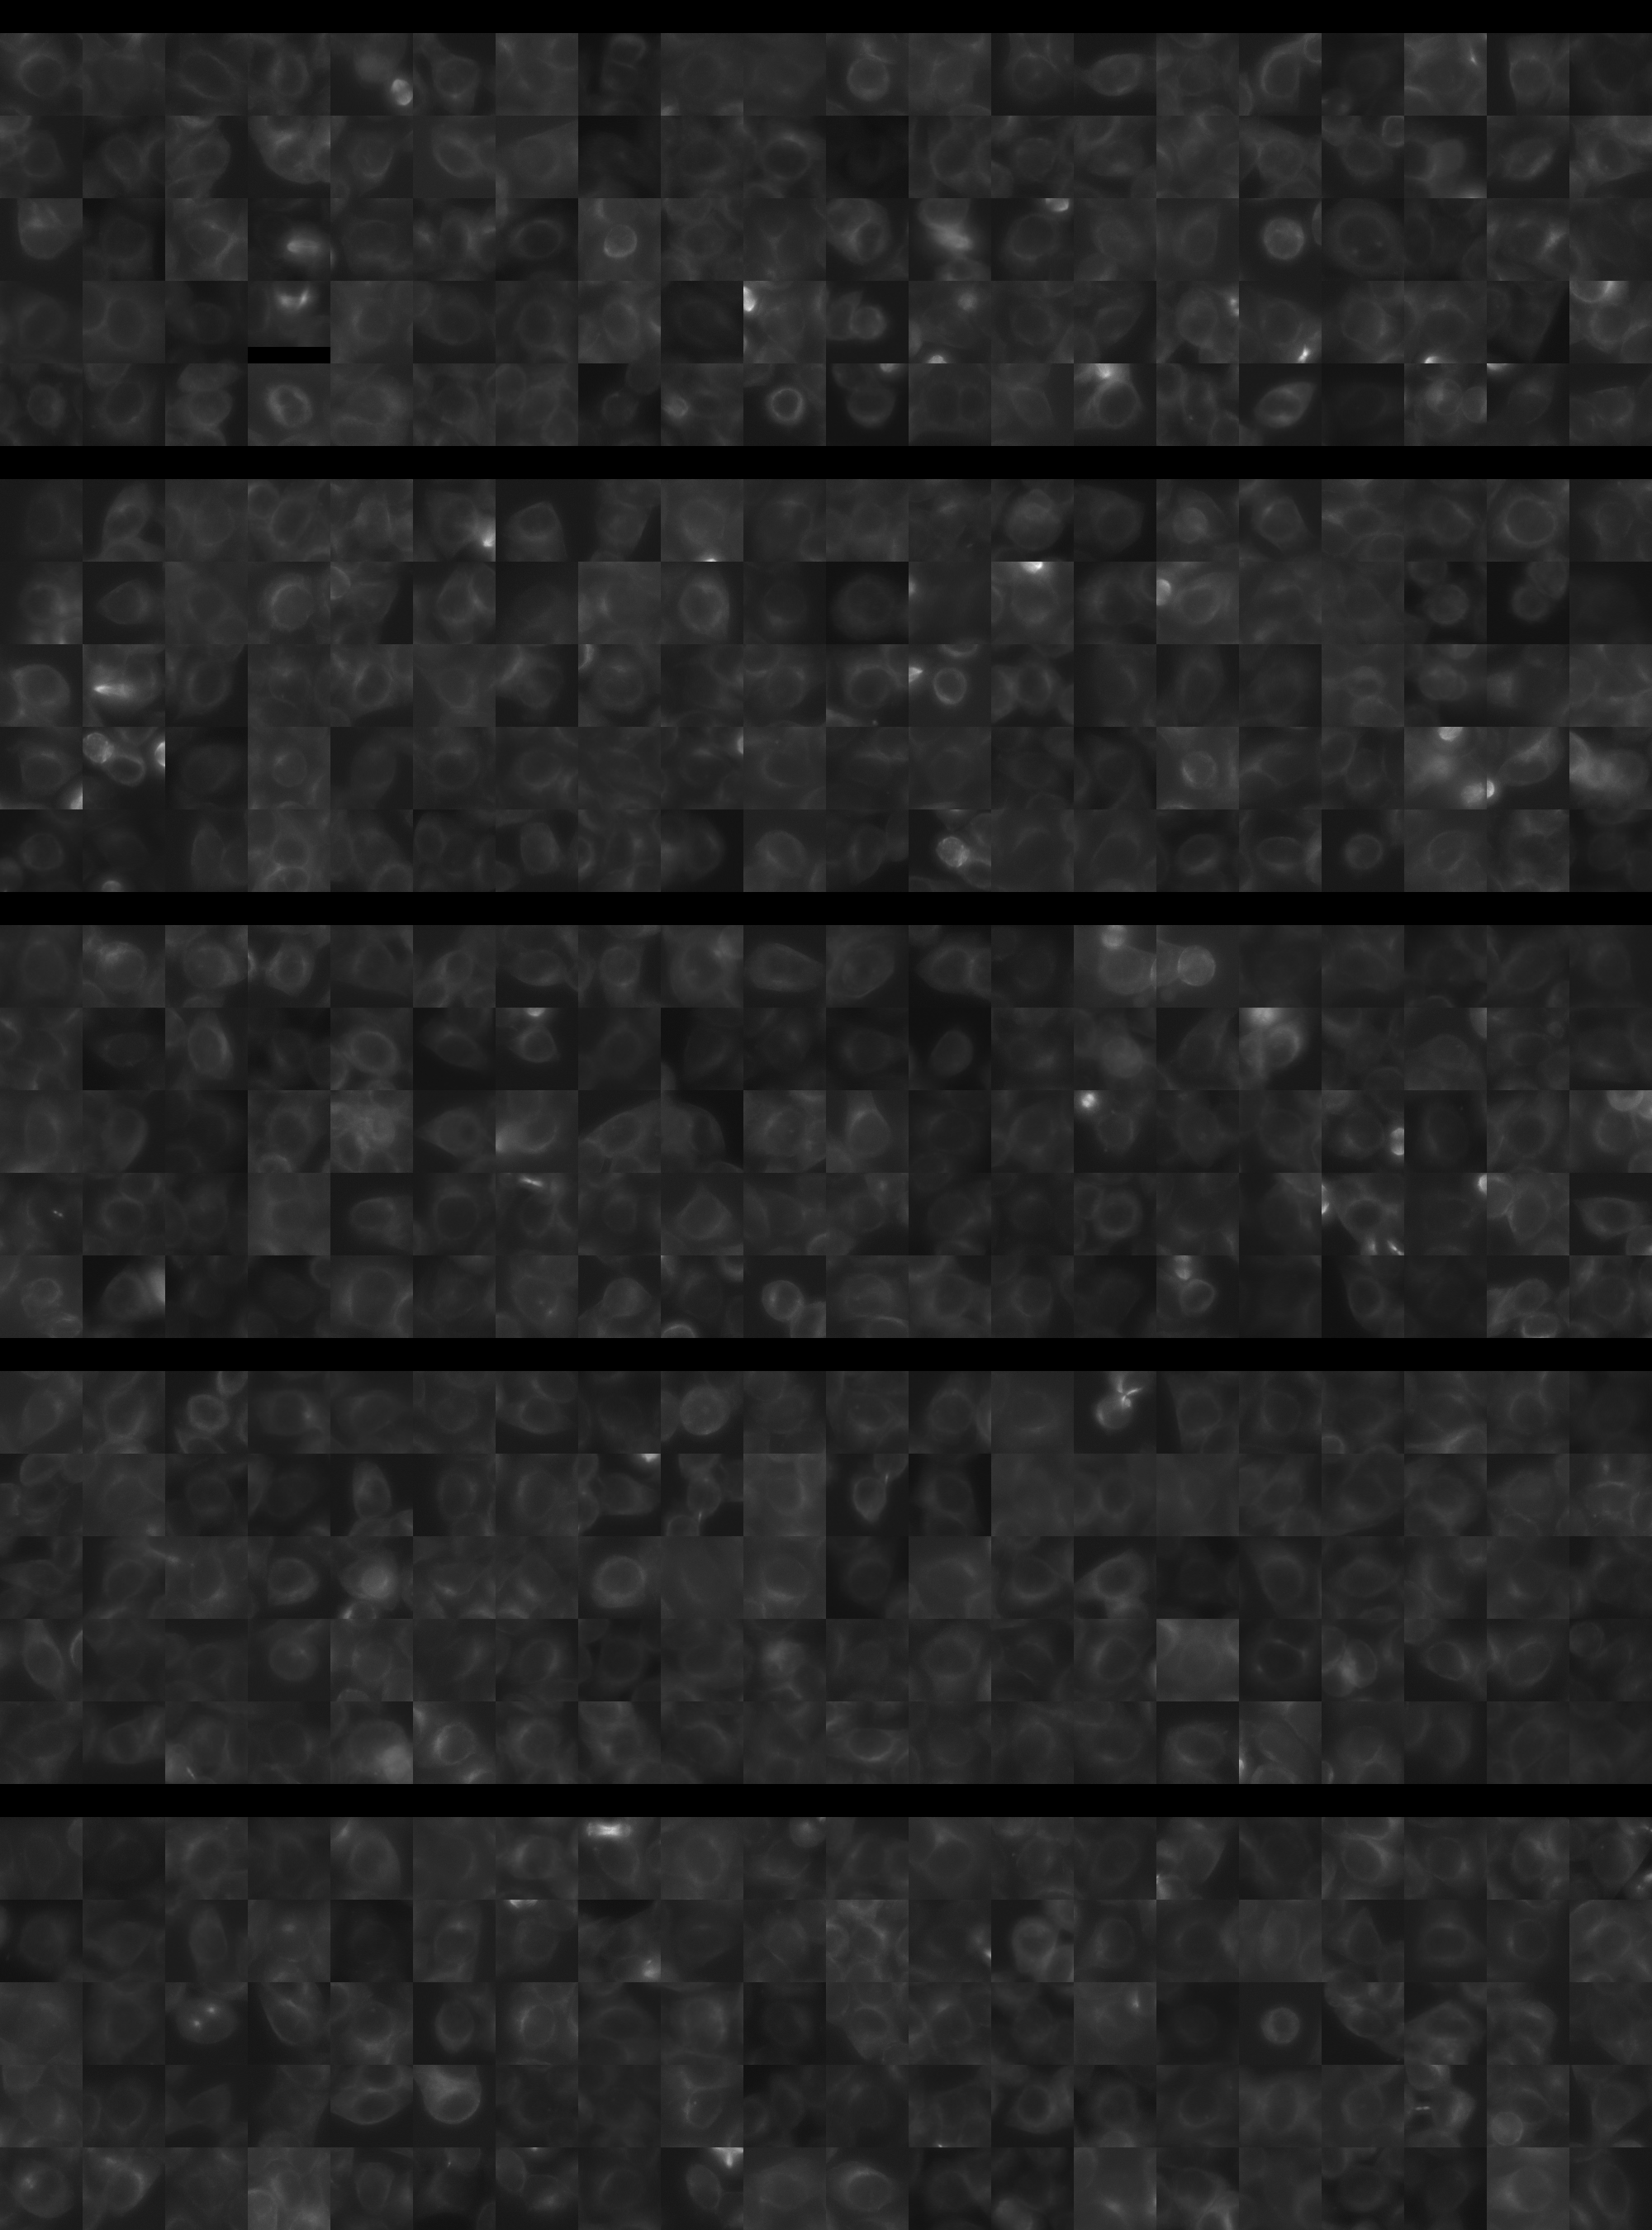
Each montage below shows randomly selected individual cell images for the same target gene separated by sgRNA, along with an example montage of cells expressing a non-targeting negative control sgRNA at the bottom. sgRNA labels in the montages correspond to the numbered sgRNA sequences in the gene info table above. The DNA (blue) and tubulin (green) channels are displayed by default, with gH2AX (grayscale) and actin (yellow) available using the check boxes. Channel brightness, contrast, and opacity are adjustable by clicking the arrow next to the channel name. When only one channel is selected, the display defaults to grayscale. Click the “Zoom” checkbox above the channel controls to enable image zooming (via scrolling) and panning (via click-and-drag).

The cell boxes displayed for this gene are square, 30.36 μm per side for the interphase montage and 30.36 μm per side for the mitotic montage.
Features

Interphase Score Rank FDR q-value
Nucleus DNA Integrated 0.151 237 of 5322 0.006
Nucleus DNA Mean 0.213 294 of 5322 1.505e-04
Nucleus gH2AX Mean 0.265 360 of 5322 1.367e-04
Nucleus DNA - gH2AX Correlation 0.008 782 of 5322 0.900
Nucleus Shape Area 0.003 3190 of 5322 0.962
Nucleus Shape Eccentricity 0.060 677 of 5322 0.165
Nucleus Shape Form Factor -1.380e-01 4889 of 5322 0.001
Nucleus Shape Solidity -1.879e-01 5066 of 5322 1.903e-04
Cell DNA Mass Displacement 0.042 1558 of 5322 0.554
Cell Tubulin Mean 0.134 317 of 5322 7.584e-04
Cell Tubulin Mass Displacement 0.001 2928 of 5322 0.990
Cell Actin Mean 0.092 908 of 5322 0.068
Cell Tubulin - Actin Correlation 0.115 459 of 5322 0.006
Cell DNA - Tubulin Correlation 0.131 627 of 5322 0.001
Cell Shape Area -5.529e-02 4455 of 5322 0.241
Cell Shape Eccentricity 0.063 280 of 5322 0.309
Mitotic Score Rank FDR q-value
Nucleus DNA Integrated 0.512 129 of 5322 0.089
Nucleus DNA Mean 0.056 2089 of 5322 1.000
Nucleus DNA Mass Displacement 0.316 215 of 5322 0.999
Nucleus DNA Mean Frac 3 0.288 239 of 5322 1.000
Nucleus gH2AX Mean 0.040 2380 of 5322 1.000
Nucleus gH2AX Mean Frac 0 -1.216e-02 2464 of 5322 1.000
Nucleus Tubulin Mean Frac 0 0.472 97 of 5322 0.097
Nucleus Tubulin Mean Edge 0.095 1925 of 5322 0.999
Nucleus Tubulin Std Edge -4.135e-01 5102 of 5322 0.104
Nucleus Shape Area 0.694 124 of 5322 0.006
Nucleus Shape Eccentricity -3.285e-01 5027 of 5322 0.872
Nucleus Shape Form Factor -4.206e-01 5121 of 5322 0.344
Cell Tubulin Mean 0.457 126 of 5322 0.126
Cell Tubulin Mean Frac 3 -5.771e-01 5253 of 5322 0.020
Cell Actin Mean 0.152 1279 of 5322 0.997
Cell Shape Area 0.421 314 of 5322 0.388
( Reset Zoom )
Brightness
Contrast
Opacity
Brightness
Contrast
Opacity
Brightness
Contrast
Opacity
Brightness
Contrast
Opacity
Brightness
Contrast
Opacity

( Reset Zoom )
Brightness
Contrast
Opacity
Brightness
Contrast
Opacity
Brightness
Contrast
Opacity
Brightness
Contrast
Opacity
Brightness
Contrast
Opacity

Day 3

Day 4

MIT Central Accessability