AGPAT1

Gene symbol: AGPAT1
Gene: 10554
Uniprot Function: Converts 1-acyl-sn-glycerol-3-phosphate (lysophosphatidic acid or LPA) into 1,2-diacyl-sn-glycerol-3-phosphate (phosphatidic acid or PA) by incorporating an acyl moiety at the sn-2 position of the glycerol backbone.
Mitotic Index 0.0235
Interphase Cluster: #171 (16 genes)
Mitotic Cluster: #18 (40 genes)
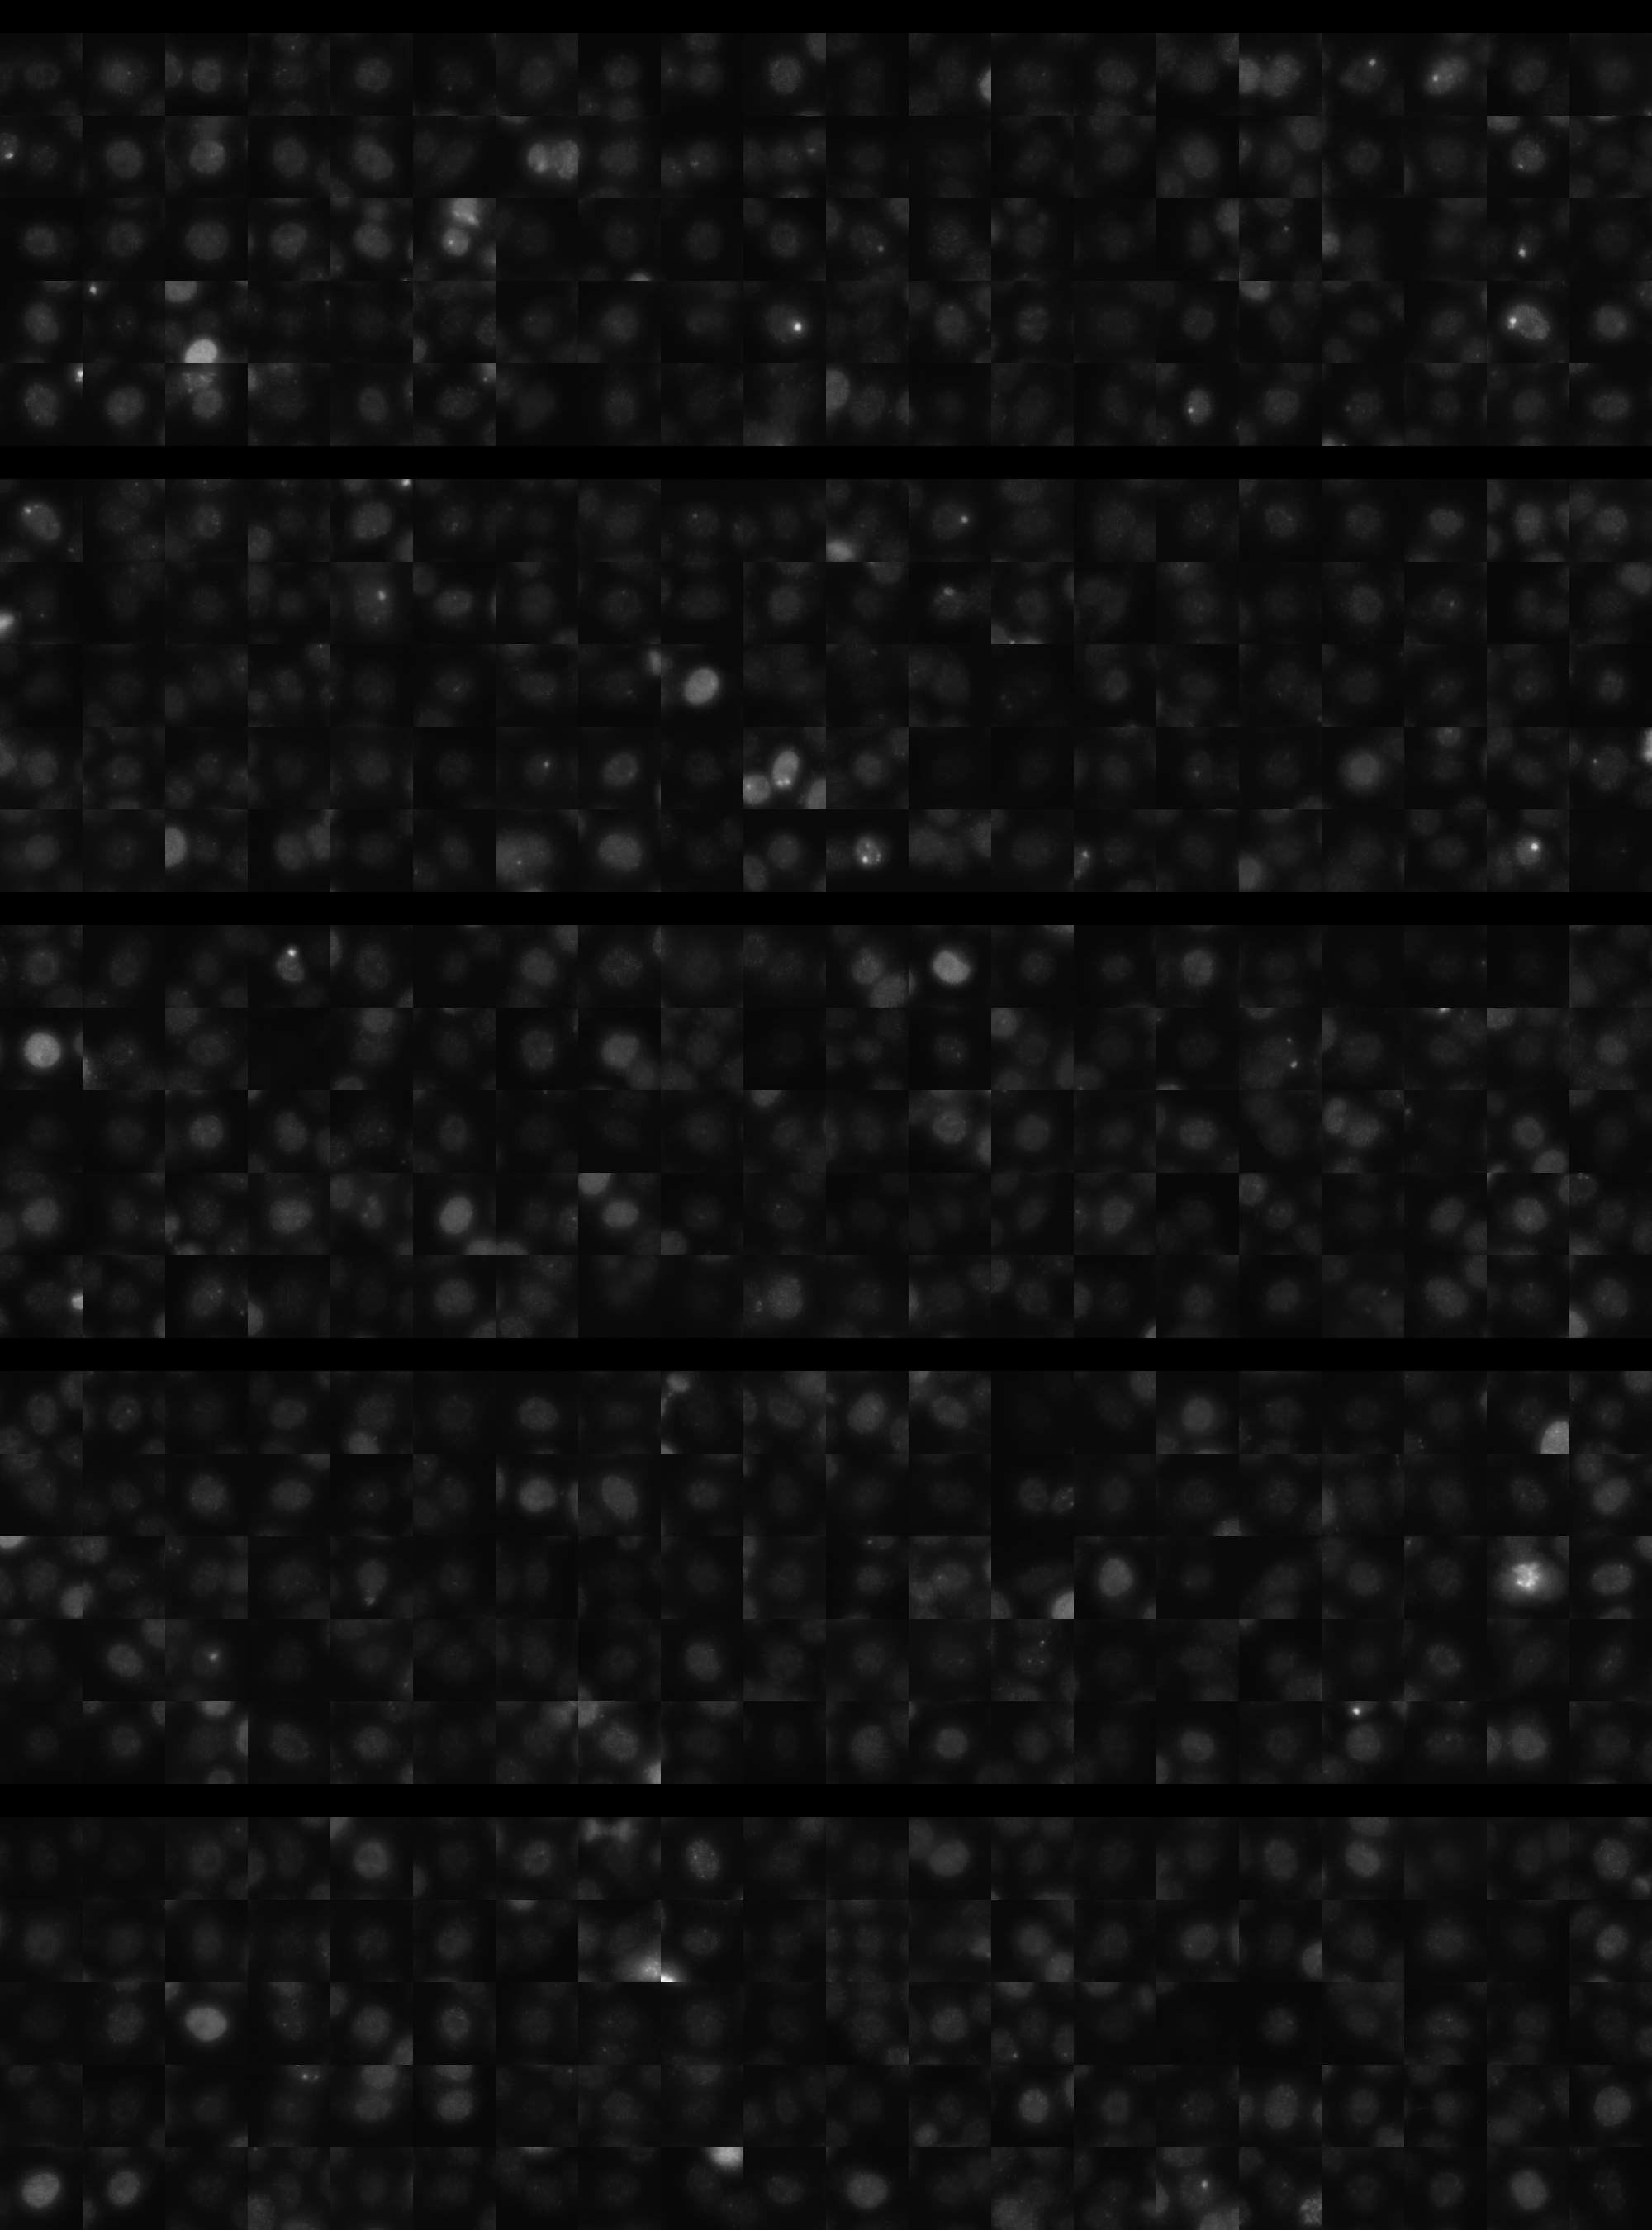
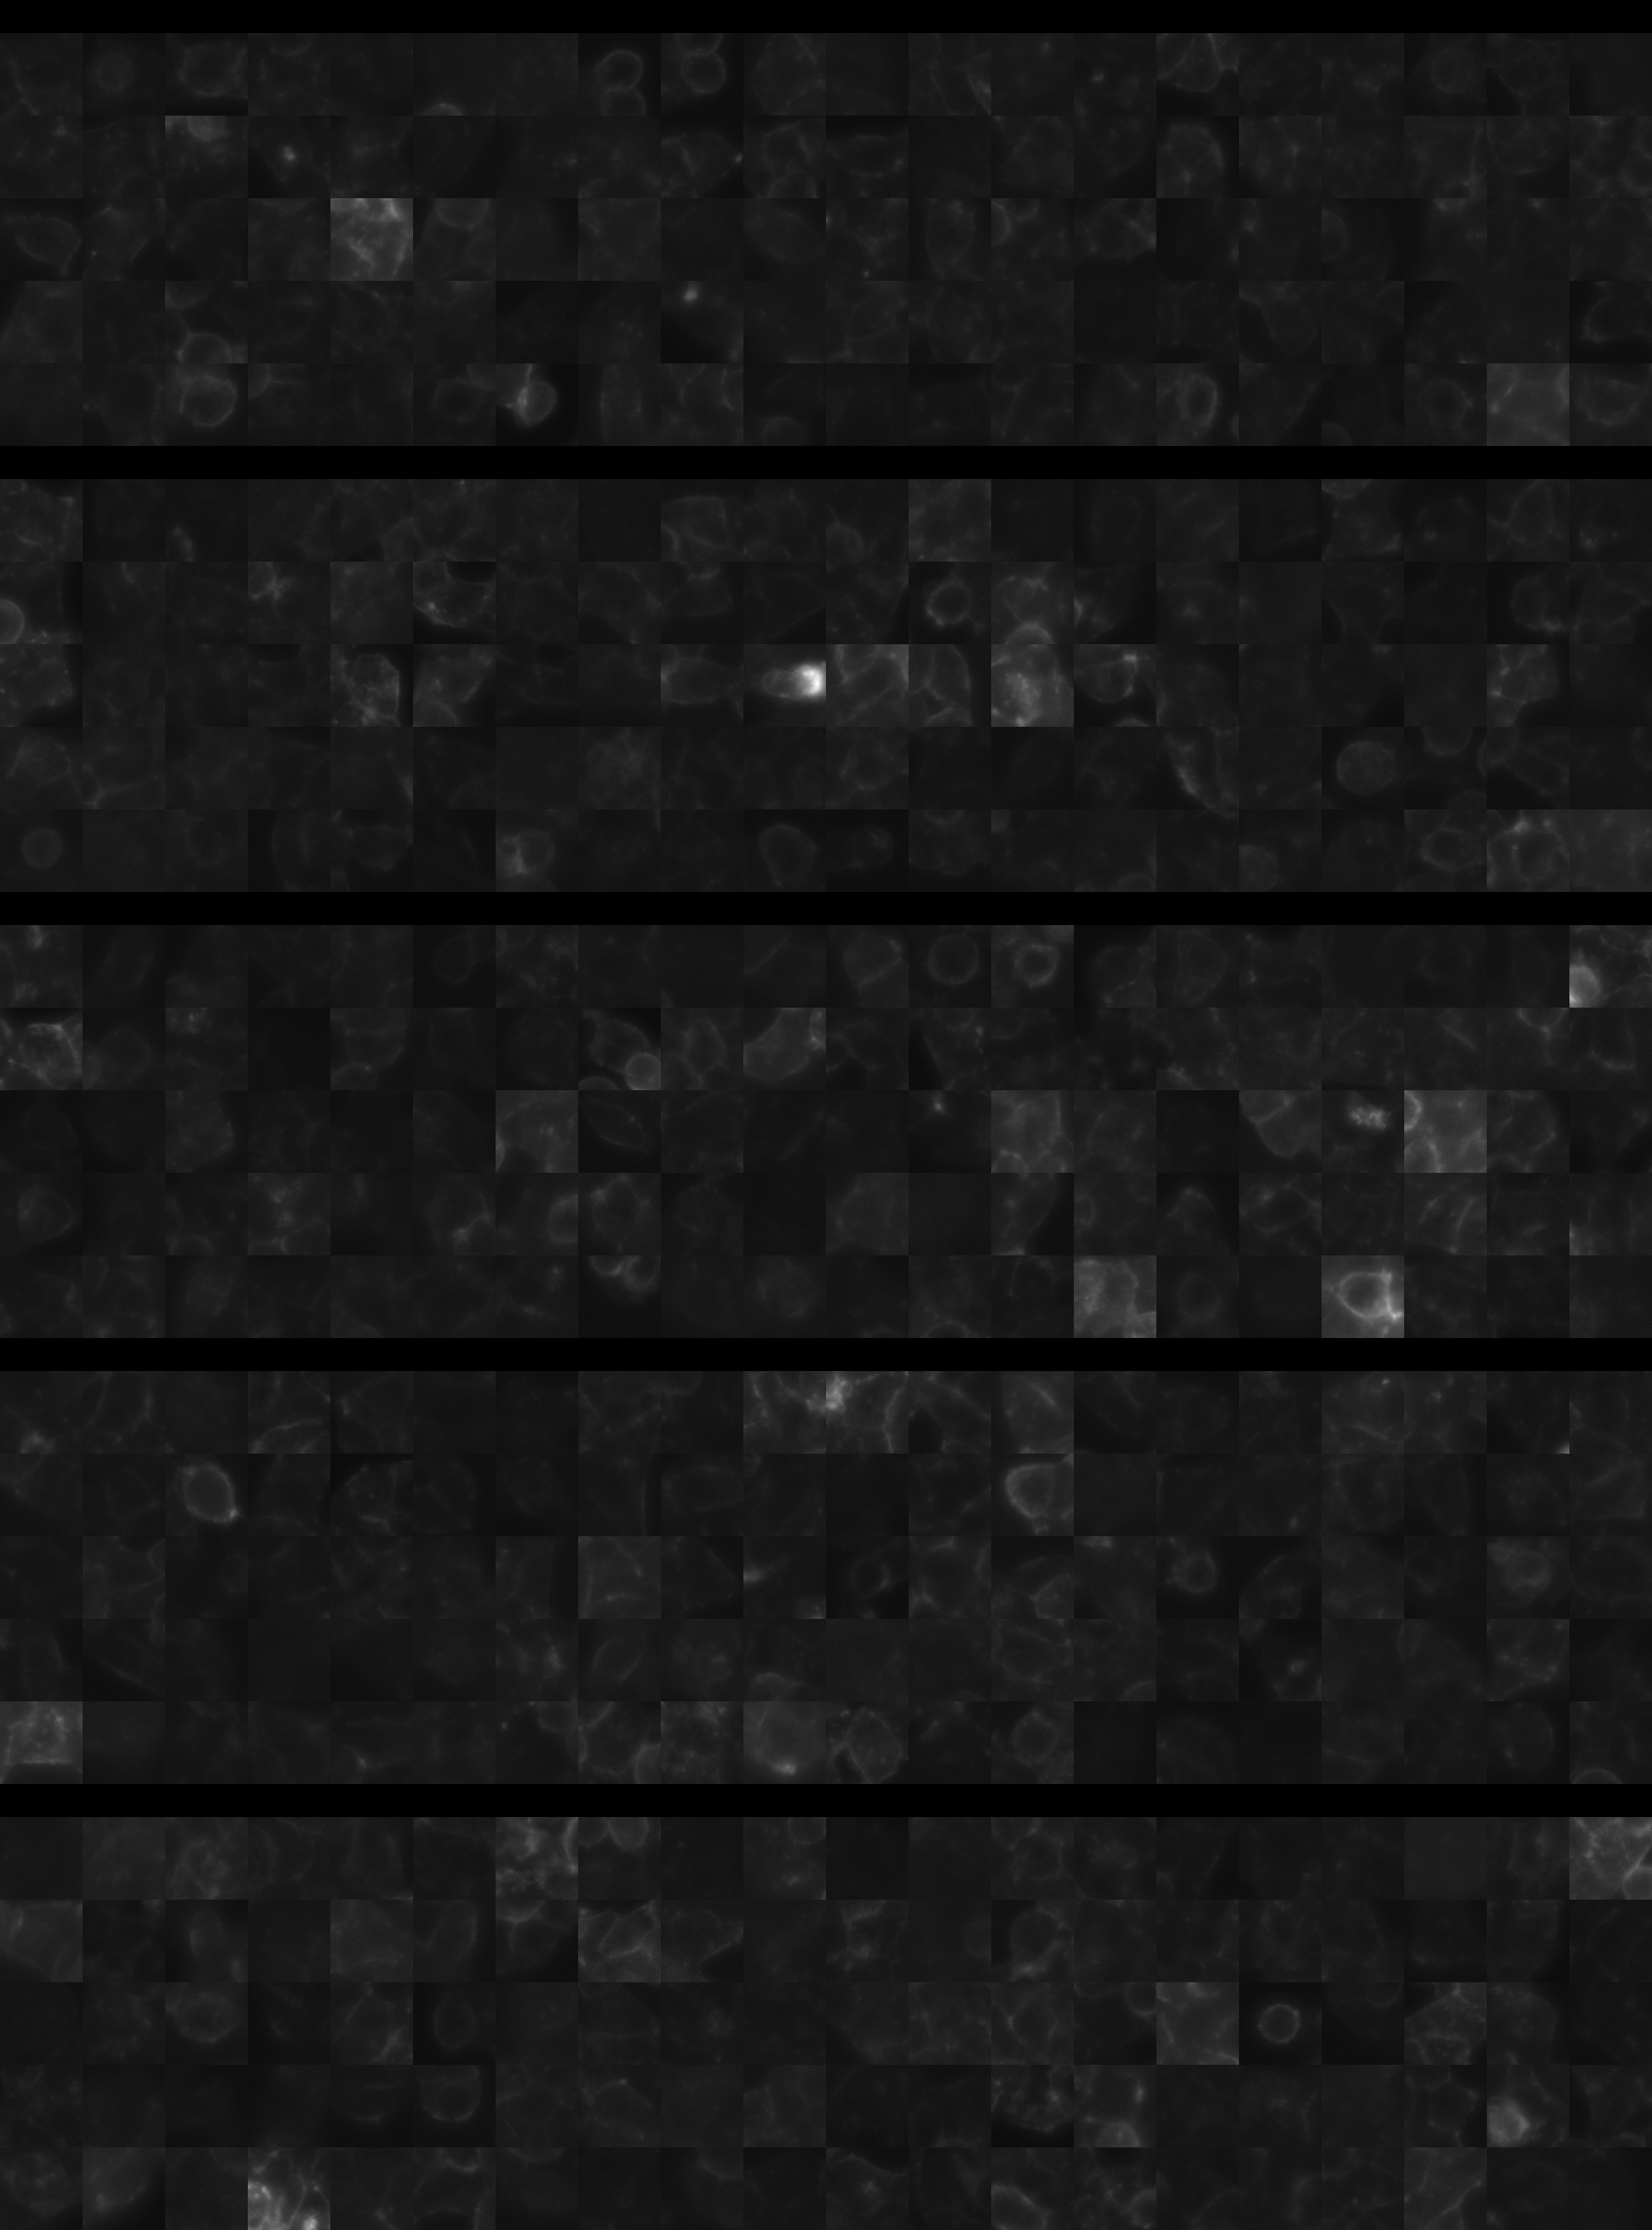
sgRNA 1: ACAACAACATAGGGCTGCGA (interphase cells: 886, mitotic cells: 27)
sgRNA 2: GAGGGAACGAGAAACCACAA (interphase cells: 717, mitotic cells: 14)
sgRNA 3: GTCCTCGCACGGCACACACA (interphase cells: 1830, mitotic cells: 44)
sgRNA 4: TGGTTGGAGACAACAACATA (interphase cells: 632, mitotic cells: 13)

Interphase Cluster

Mitotic Cluster

Overview

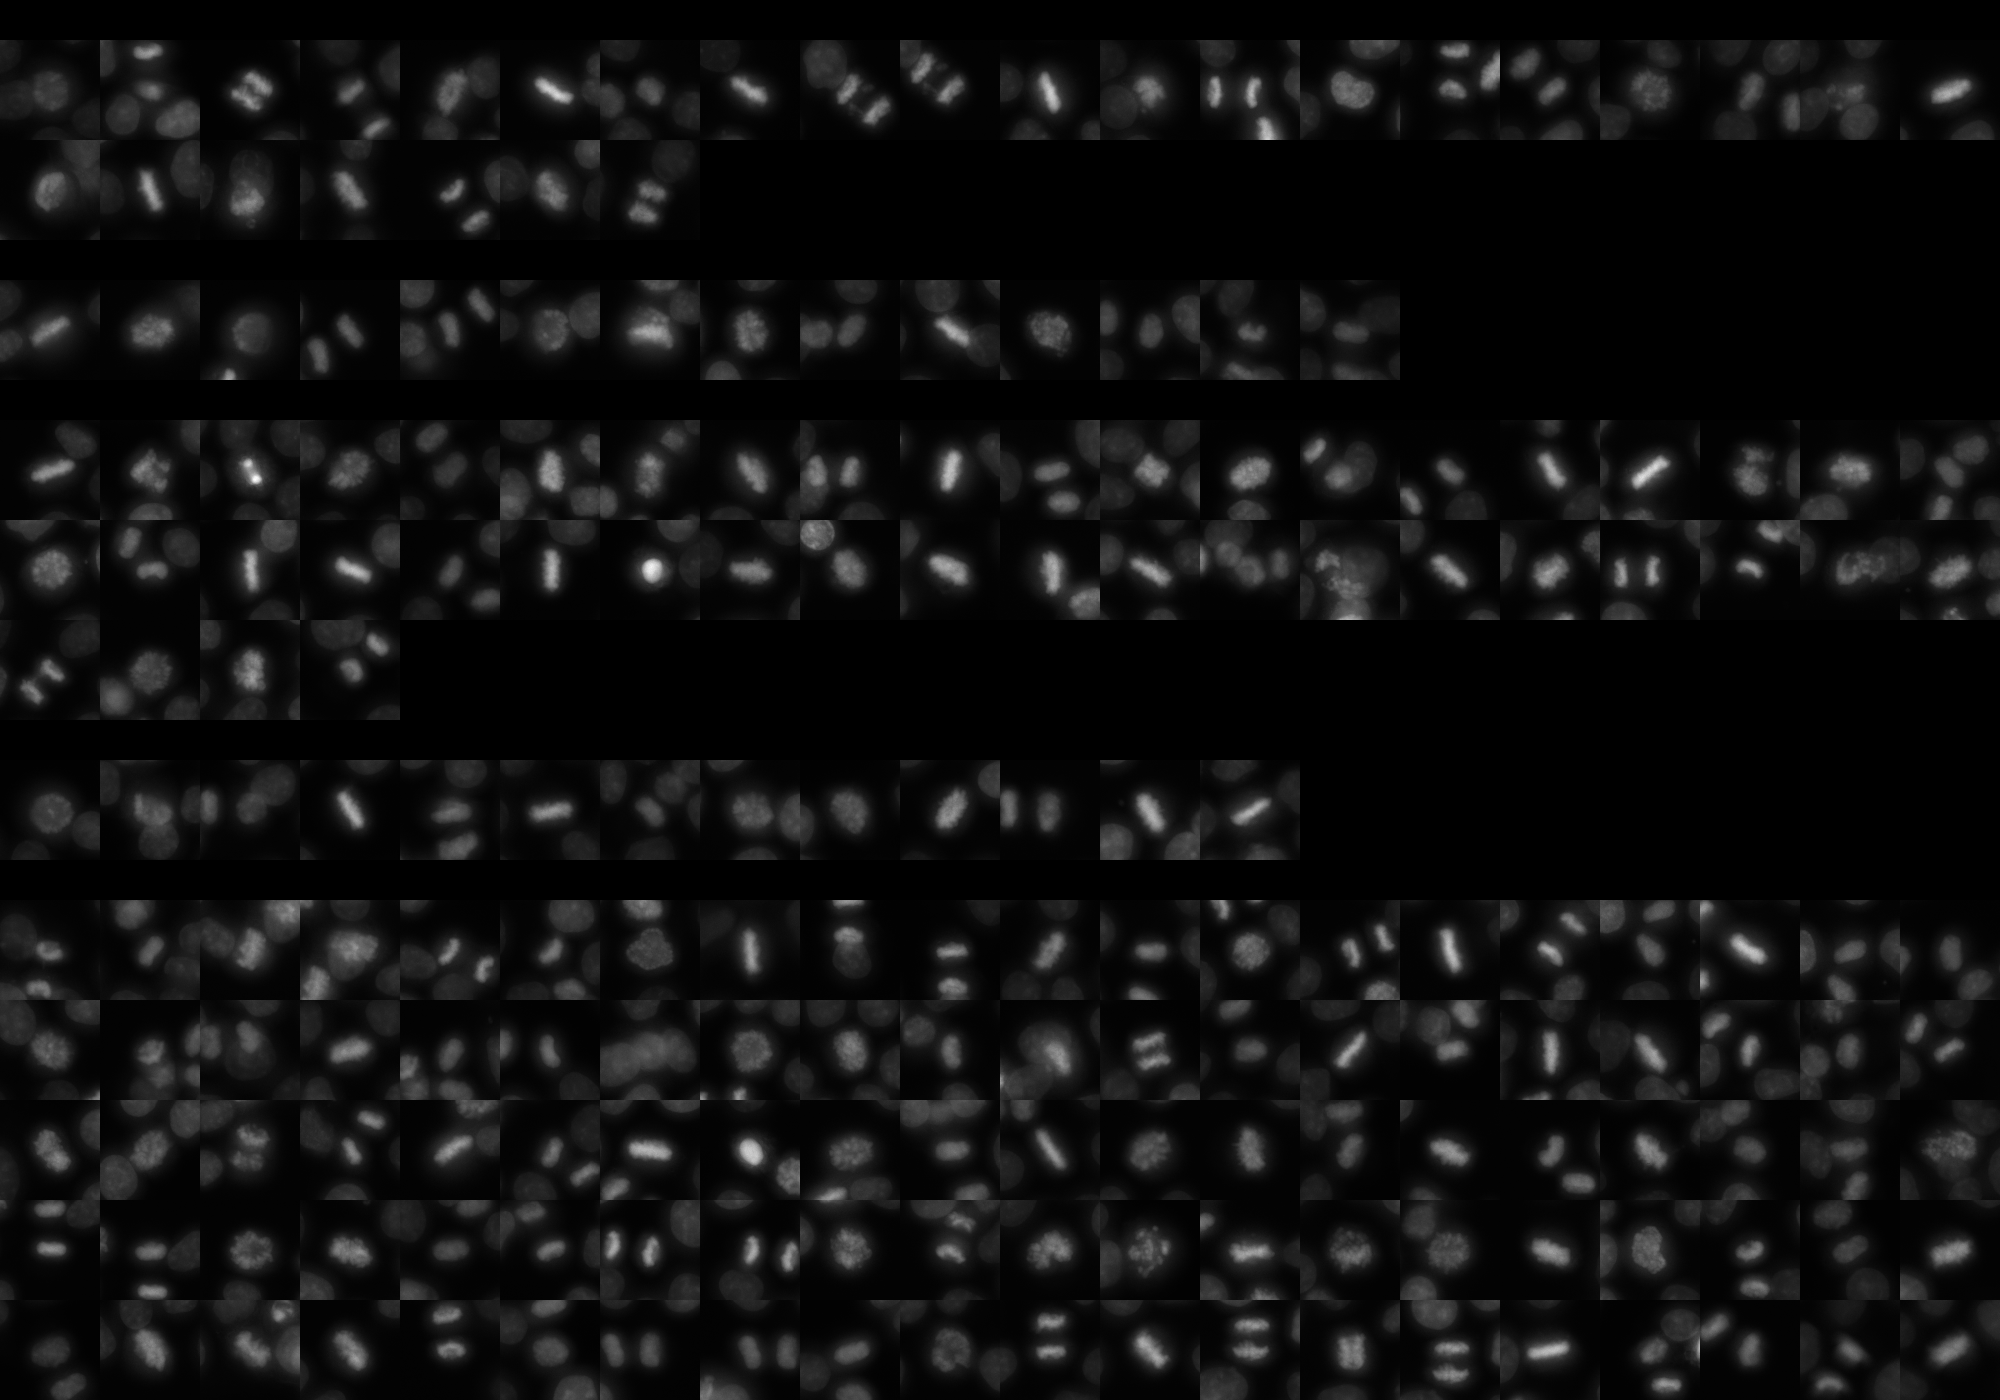
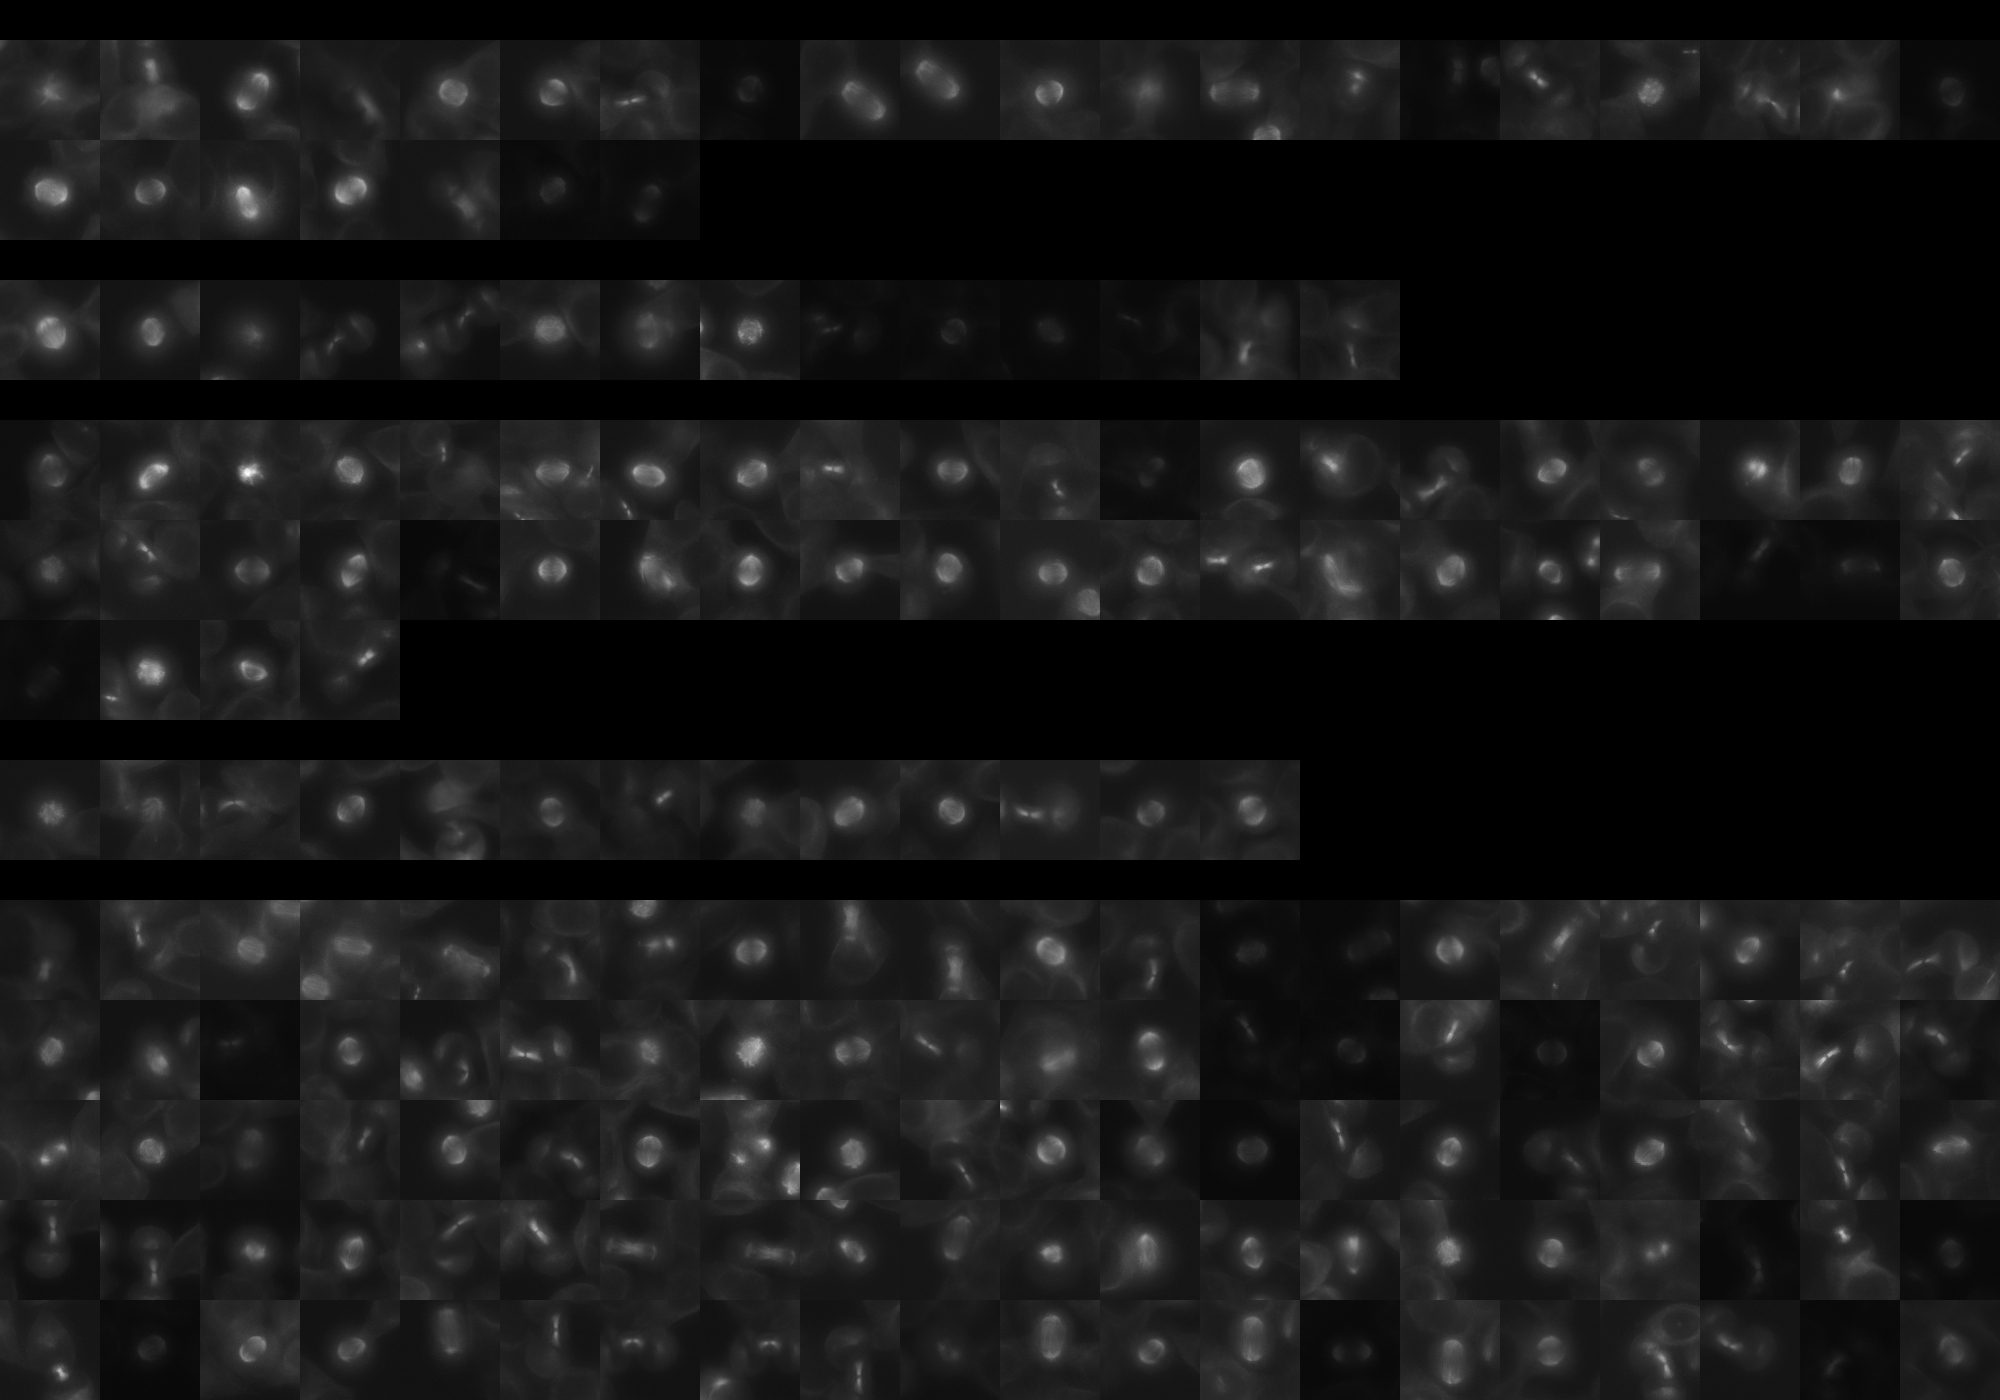
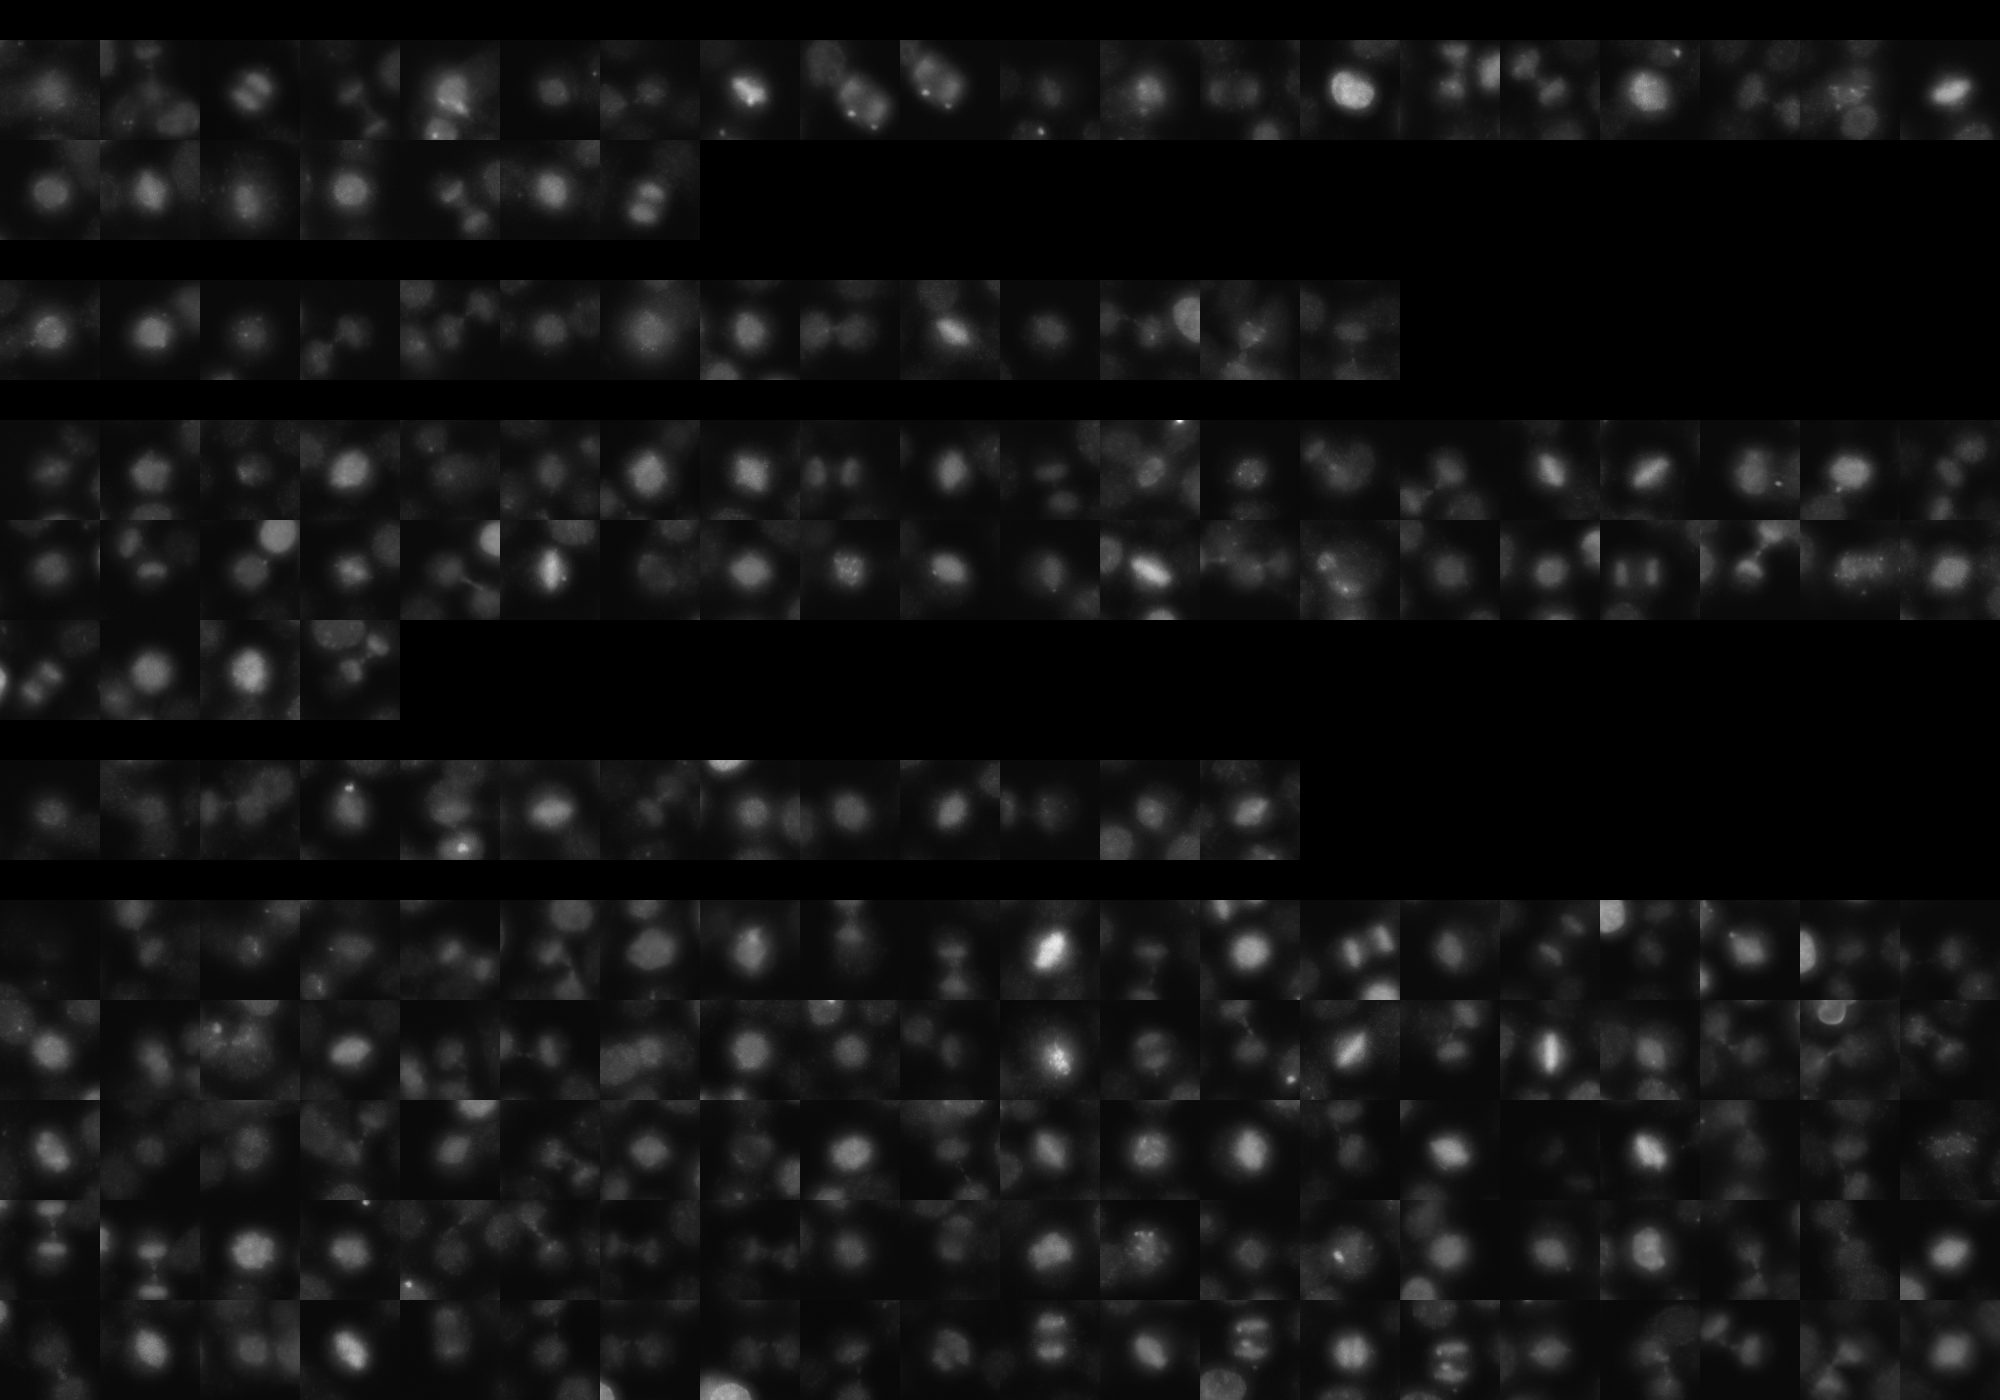
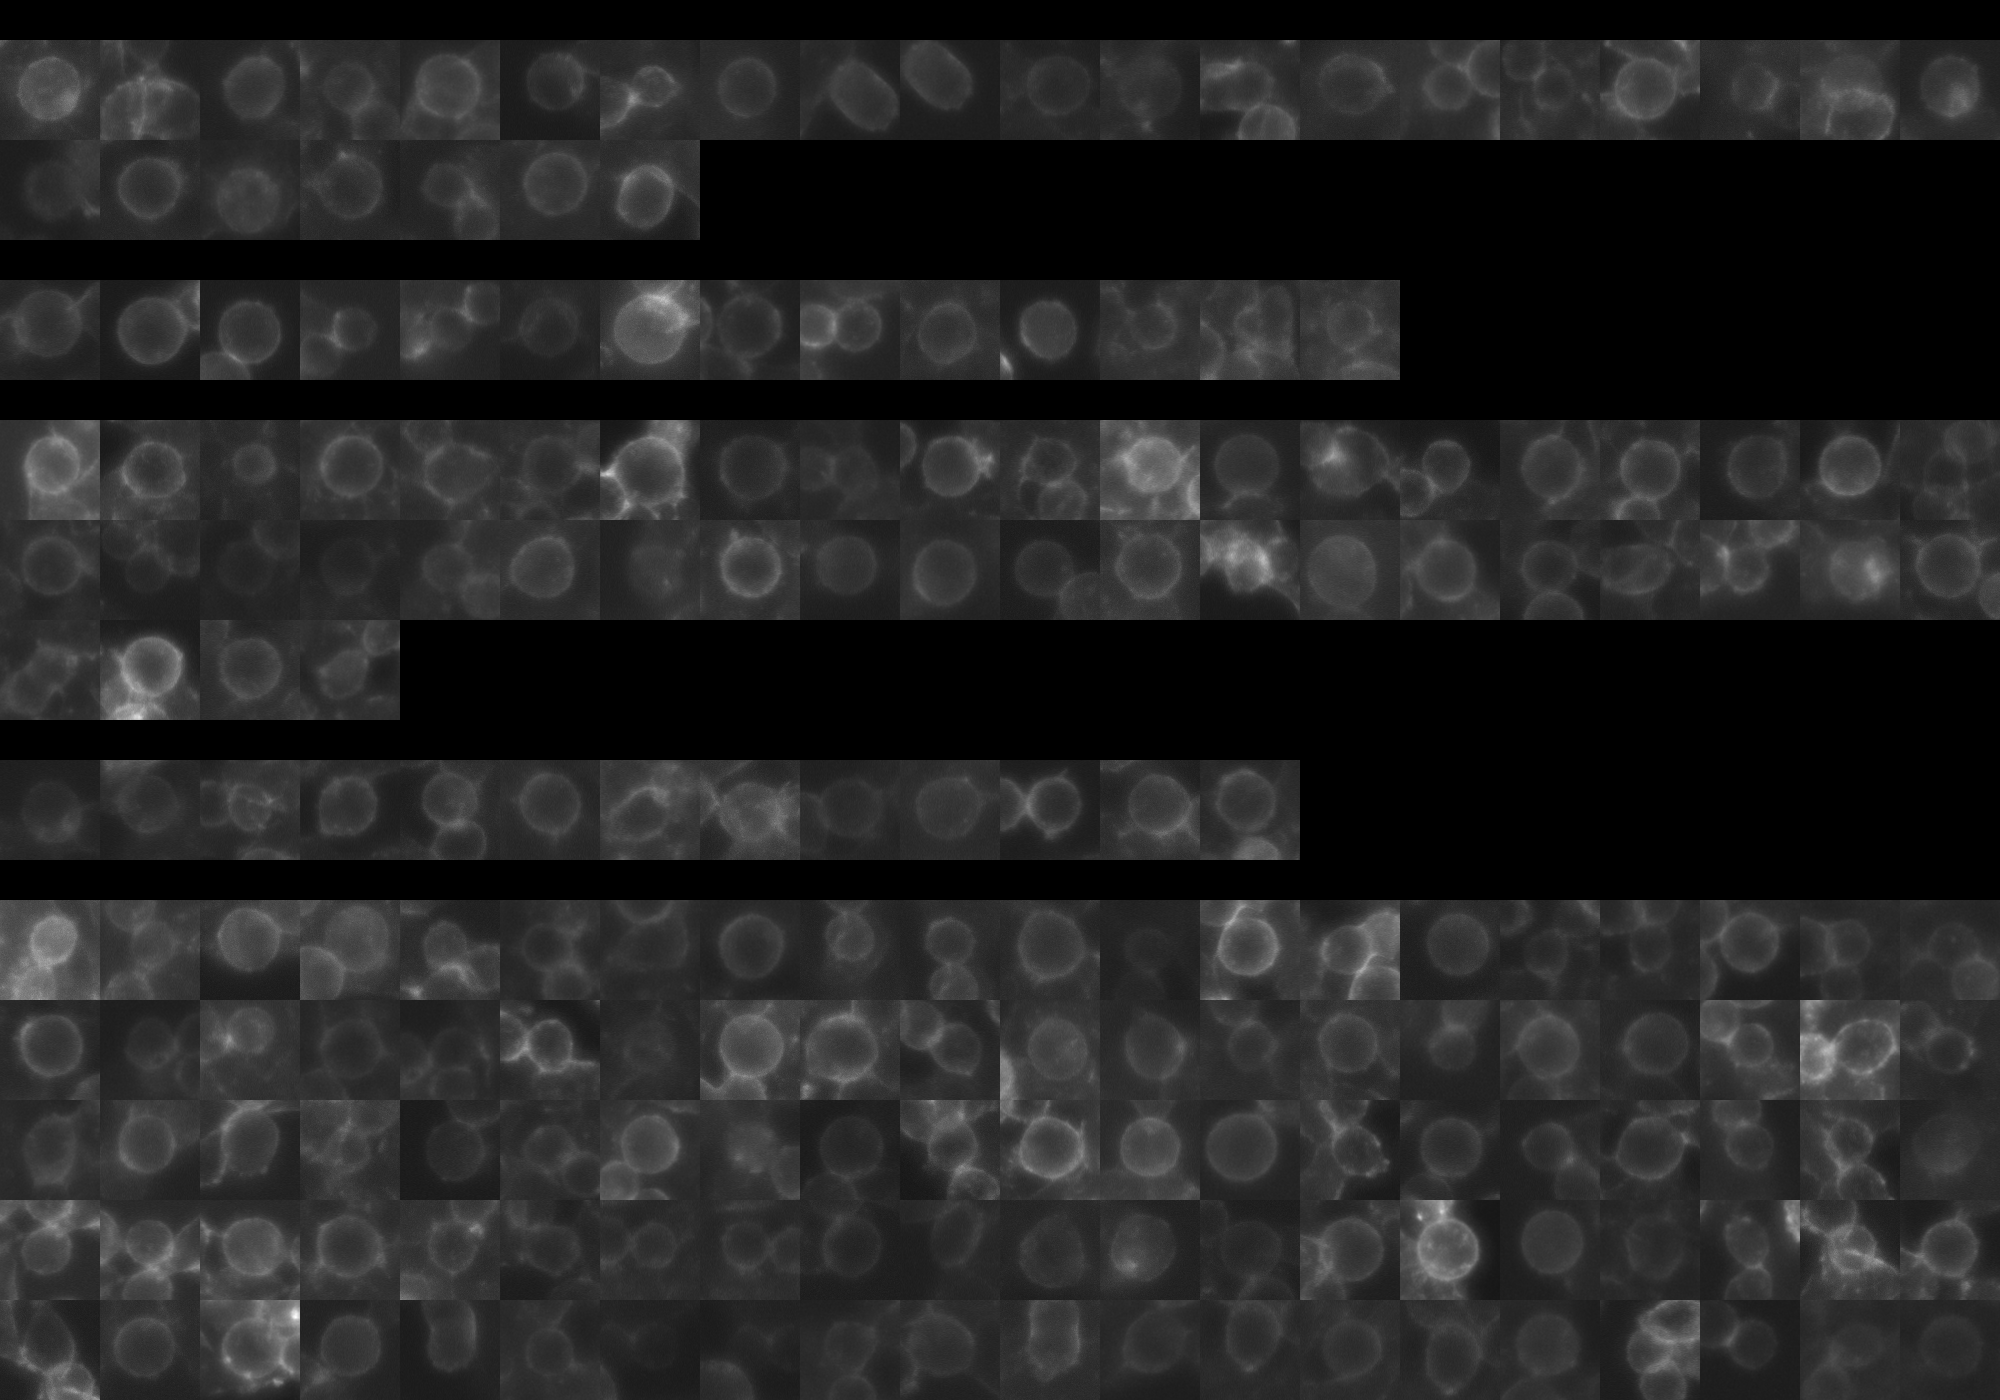
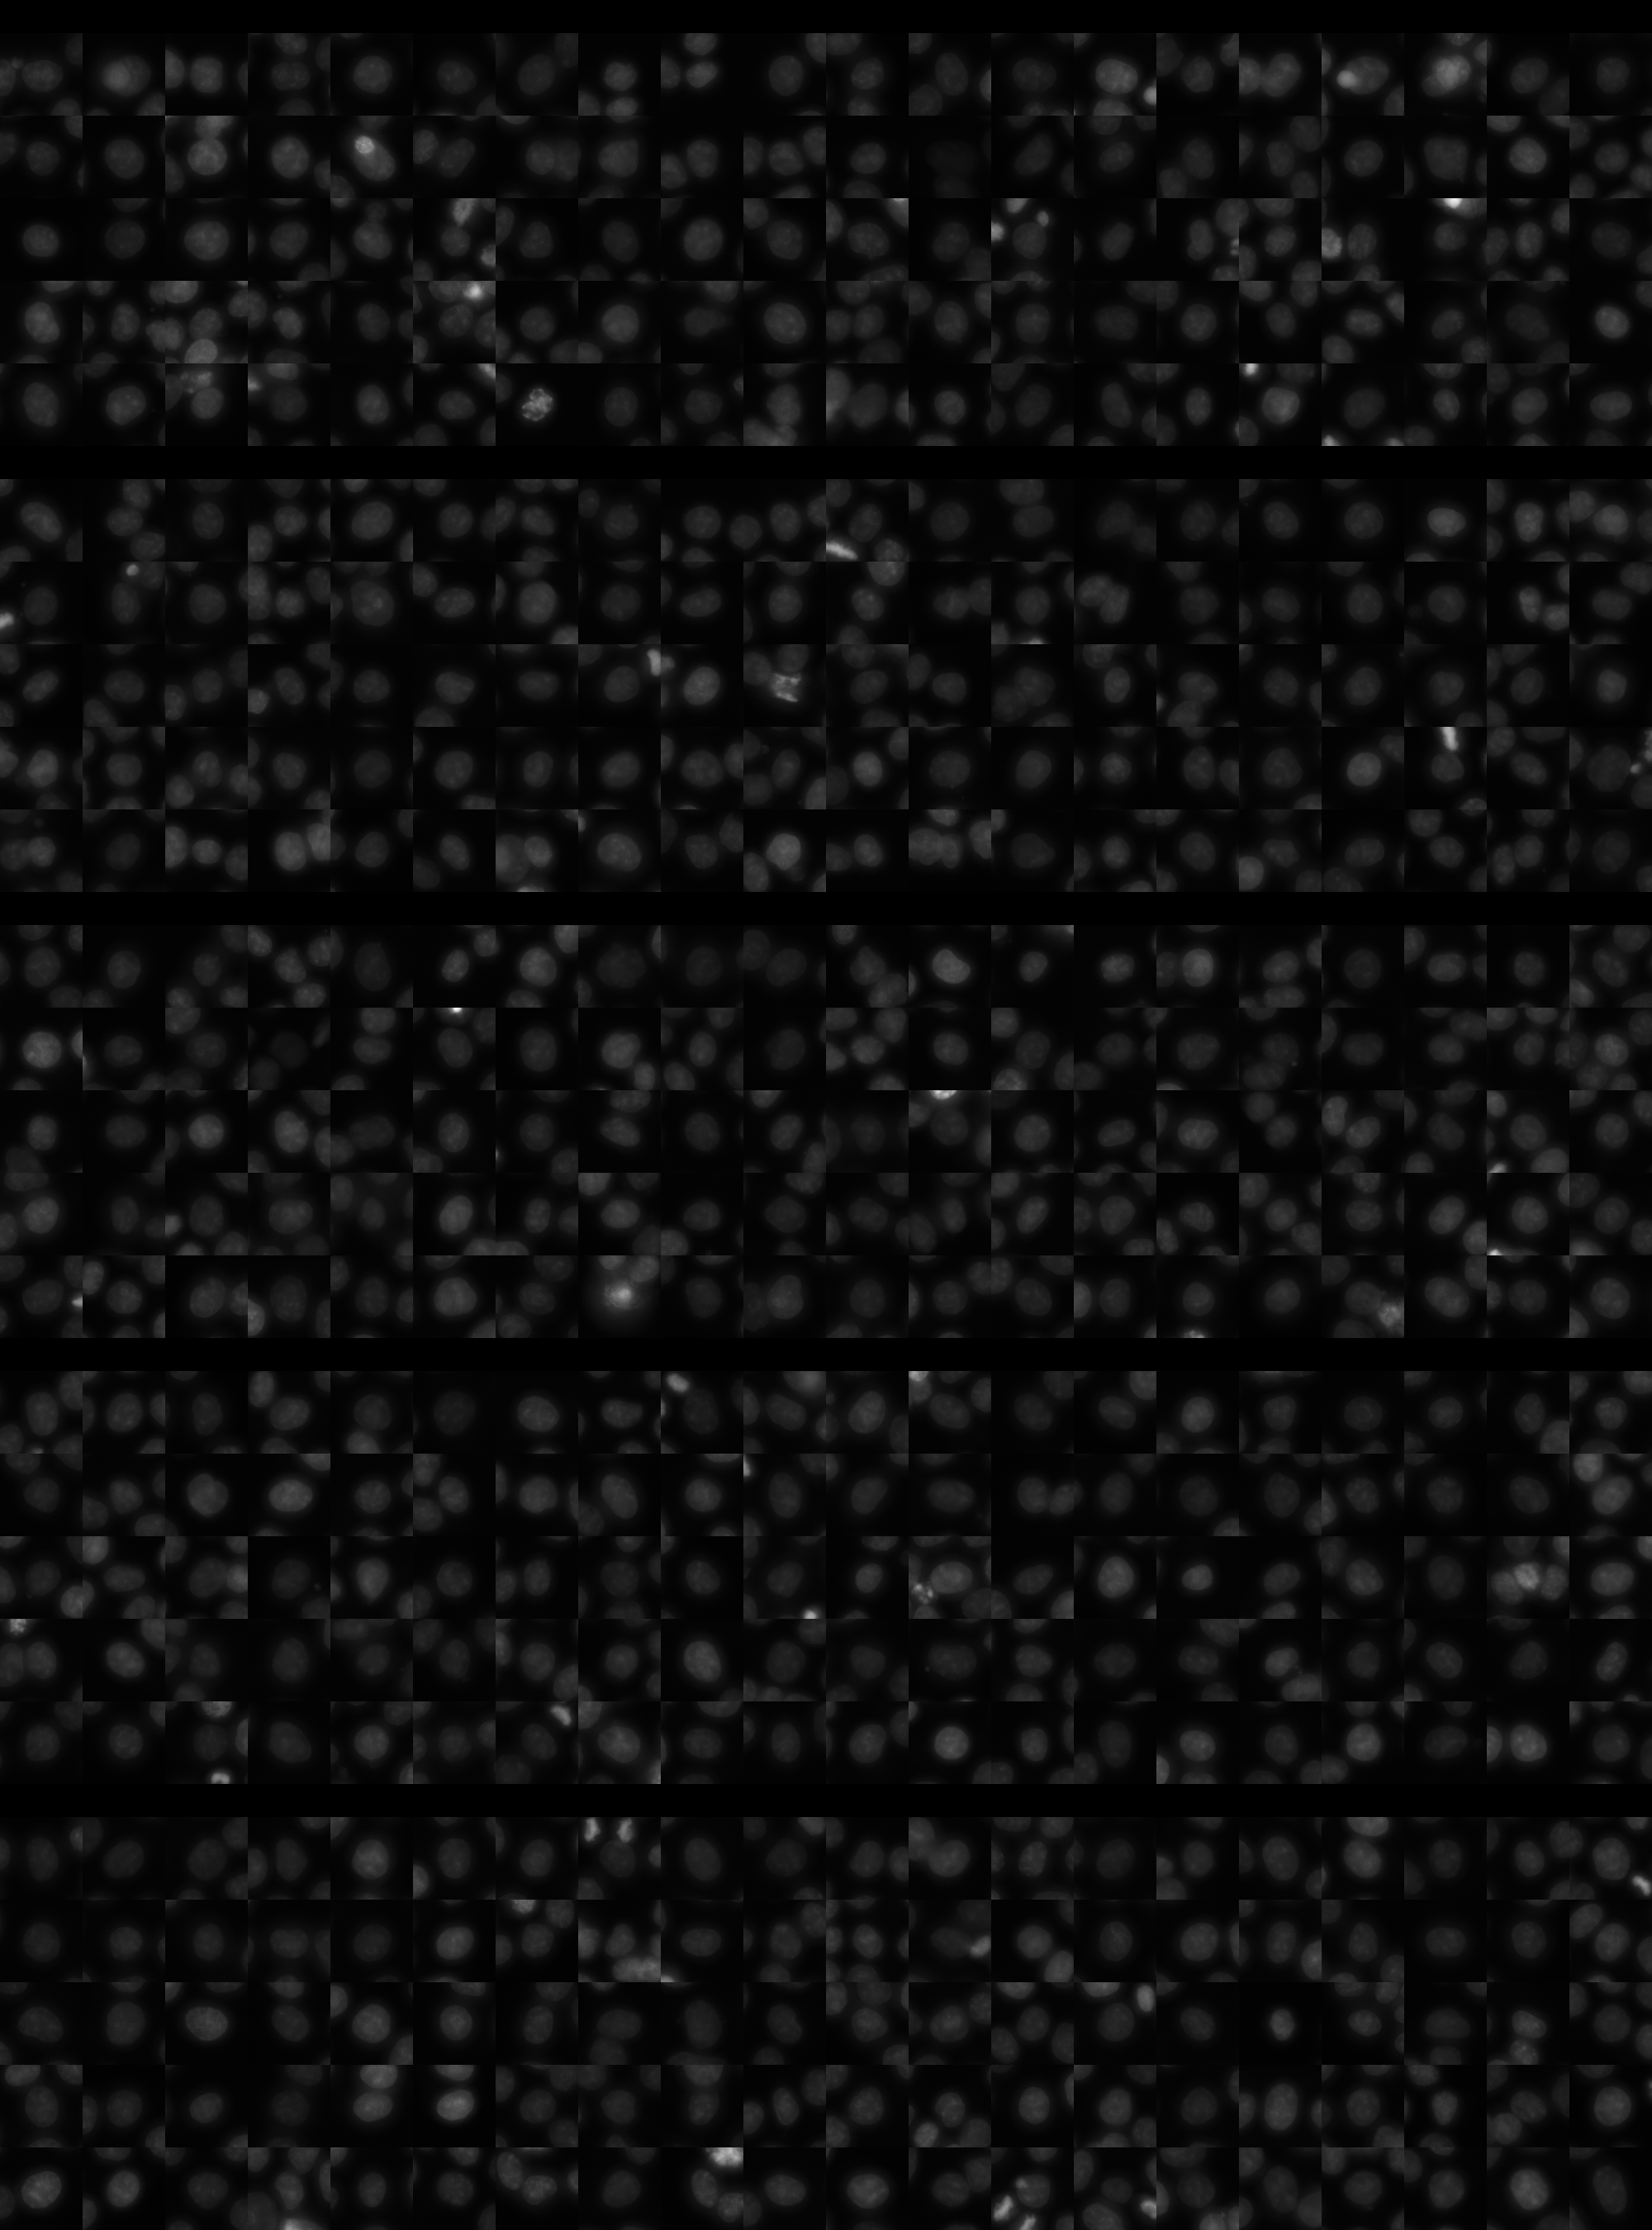
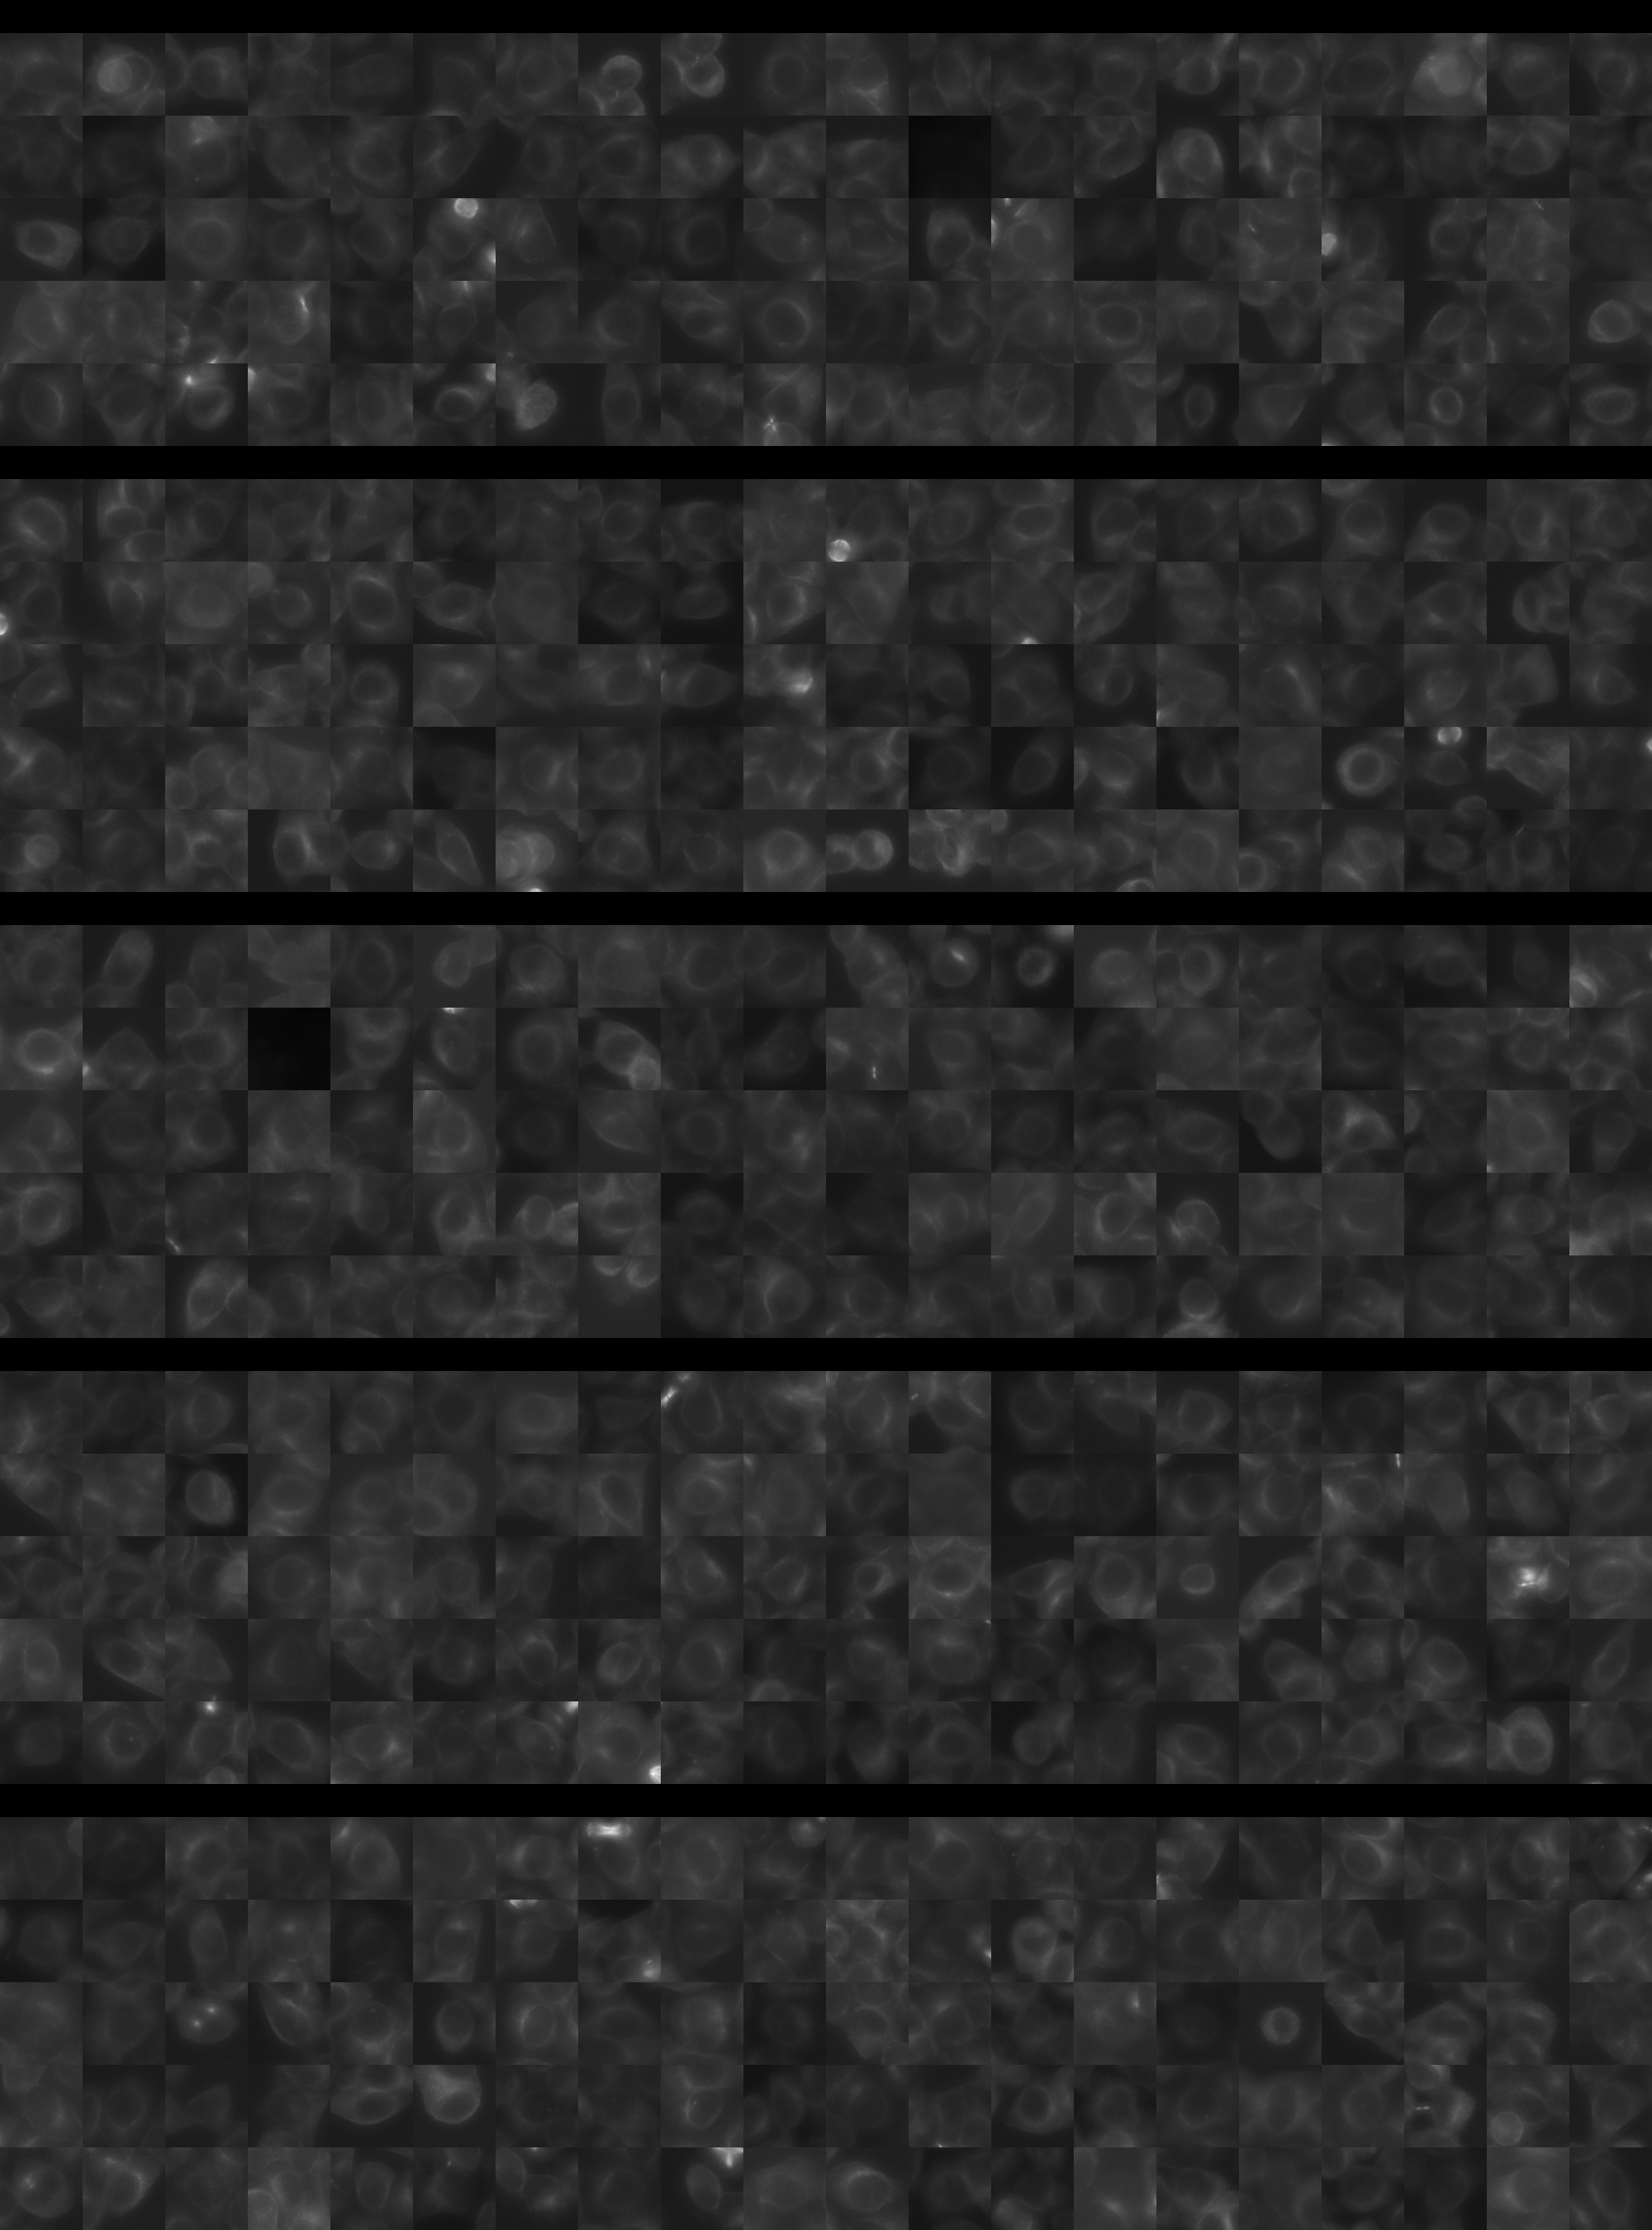
Each montage below shows randomly selected individual cell images for the same target gene separated by sgRNA, along with an example montage of cells expressing a non-targeting negative control sgRNA at the bottom. sgRNA labels in the montages correspond to the numbered sgRNA sequences in the gene info table above. The DNA (blue) and tubulin (green) channels are displayed by default, with gH2AX (grayscale) and actin (yellow) available using the check boxes. Channel brightness, contrast, and opacity are adjustable by clicking the arrow next to the channel name. When only one channel is selected, the display defaults to grayscale. Click the “Zoom” checkbox above the channel controls to enable image zooming (via scrolling) and panning (via click-and-drag).

The cell boxes displayed for this gene are square, 30.36 μm per side for the interphase montage and 30.36 μm per side for the mitotic montage.
Features

Interphase Score Rank FDR q-value
Nucleus DNA Integrated -3.116e-02 4432 of 5322 0.638
Nucleus DNA Mean 0.029 1184 of 5322 0.545
Nucleus gH2AX Mean 0.106 1809 of 5322 0.018
Nucleus DNA - gH2AX Correlation -8.377e-02 3576 of 5322 0.011
Nucleus Shape Area -4.758e-02 4440 of 5322 0.301
Nucleus Shape Eccentricity 0.033 1610 of 5322 0.494
Nucleus Shape Form Factor -3.560e-02 1975 of 5322 0.456
Nucleus Shape Solidity -3.865e-02 2183 of 5322 0.325
Cell DNA Mass Displacement -2.125e-02 5082 of 5322 0.726
Cell Tubulin Mean 0.063 892 of 5322 0.164
Cell Tubulin Mass Displacement -1.192e-03 3086 of 5322 0.997
Cell Actin Mean 0.048 1616 of 5322 0.391
Cell Tubulin - Actin Correlation 0.045 1583 of 5322 0.355
Cell DNA - Tubulin Correlation 1.905e-04 3818 of 5322 0.990
Cell Shape Area -8.127e-02 4696 of 5322 0.056
Cell Shape Eccentricity 0.041 891 of 5322 0.588
Mitotic Score Rank FDR q-value
Nucleus DNA Integrated -2.799e-02 4249 of 5322 0.995
Nucleus DNA Mean 0.122 1212 of 5322 1.000
Nucleus DNA Mass Displacement 0.122 1593 of 5322 0.999
Nucleus DNA Mean Frac 3 0.152 968 of 5322 1.000
Nucleus gH2AX Mean -2.821e-04 2951 of 5322 1.000
Nucleus gH2AX Mean Frac 0 0.092 1058 of 5322 1.000
Nucleus Tubulin Mean Frac 0 0.149 1331 of 5322 0.999
Nucleus Tubulin Mean Edge -4.181e-03 3225 of 5322 0.999
Nucleus Tubulin Std Edge -2.693e-02 2930 of 5322 0.999
Nucleus Shape Area 0.158 1907 of 5322 0.988
Nucleus Shape Eccentricity 0.091 934 of 5322 1.000
Nucleus Shape Form Factor -1.073e-01 2953 of 5322 0.998
Cell Tubulin Mean 0.209 907 of 5322 0.997
Cell Tubulin Mean Frac 3 -2.360e-01 4341 of 5322 0.999
Cell Actin Mean 0.040 2660 of 5322 0.997
Cell Shape Area -6.385e-02 4543 of 5322 0.998
( Reset Zoom )
Brightness
Contrast
Opacity
Brightness
Contrast
Opacity
Brightness
Contrast
Opacity
Brightness
Contrast
Opacity
Brightness
Contrast
Opacity

( Reset Zoom )
Brightness
Contrast
Opacity
Brightness
Contrast
Opacity
Brightness
Contrast
Opacity
Brightness
Contrast
Opacity
Brightness
Contrast
Opacity

MIT Central Accessability