ADPRHL2

Gene symbol: ADPRHL2
Gene: 54936
Uniprot Function: ADP-ribose glycohydrolase that preferentially hydrolyzes the scissile alpha-O-linkage attached to the anomeric C1'' position of ADP-ribose and acts on different substrates, such as proteins ADP-ribosylated on serine, free poly(ADP-ribose) and O-acetyl-ADP-D-ribose (PubMed:21498885, PubMed:30045870, PubMed:29907568, PubMed:30401461, PubMed:33186521). Specifically acts as a serine mono-ADP-ribosylhydrolase by mediating the removal of mono-ADP-ribose attached to serine residues on proteins, thereby playing a key role in DNA damage response (PubMed:28650317, PubMed:29234005, PubMed:30045870, PubMed:33186521). Serine ADP-ribosylation of proteins constitutes the primary form of ADP-ribosylation of proteins in response to DNA damage (PubMed:29480802, PubMed:33186521). Does not hydrolyze ADP-ribosyl-arginine, -cysteine, -diphthamide, or -asparagine bonds (PubMed:16278211). Also able to degrade protein free poly(ADP-ribose), which is synthesized in response to DNA damage: free poly(ADP-ribose) acts as a potent cell death signal and its degradation by ADPRHL2 protects cells from poly(ADP-ribose)-dependent cell death, a process named parthanatos (PubMed:16278211). Also hydrolyzes free poly(ADP-ribose) in mitochondria (PubMed:22433848). Specifically digests O-acetyl-ADP-D-ribose, a product of deacetylation reactions catalyzed by sirtuins (PubMed:17075046, PubMed:21498885). Specifically degrades 1''-O-acetyl-ADP-D-ribose isomer, rather than 2''-O-acetyl-ADP-D-ribose or 3''-O-acetyl-ADP-D-ribose isomers (PubMed:21498885).
Mitotic Index 0.023
Interphase Cluster: #131 (21 genes)
Mitotic Cluster: #140 (20 genes)
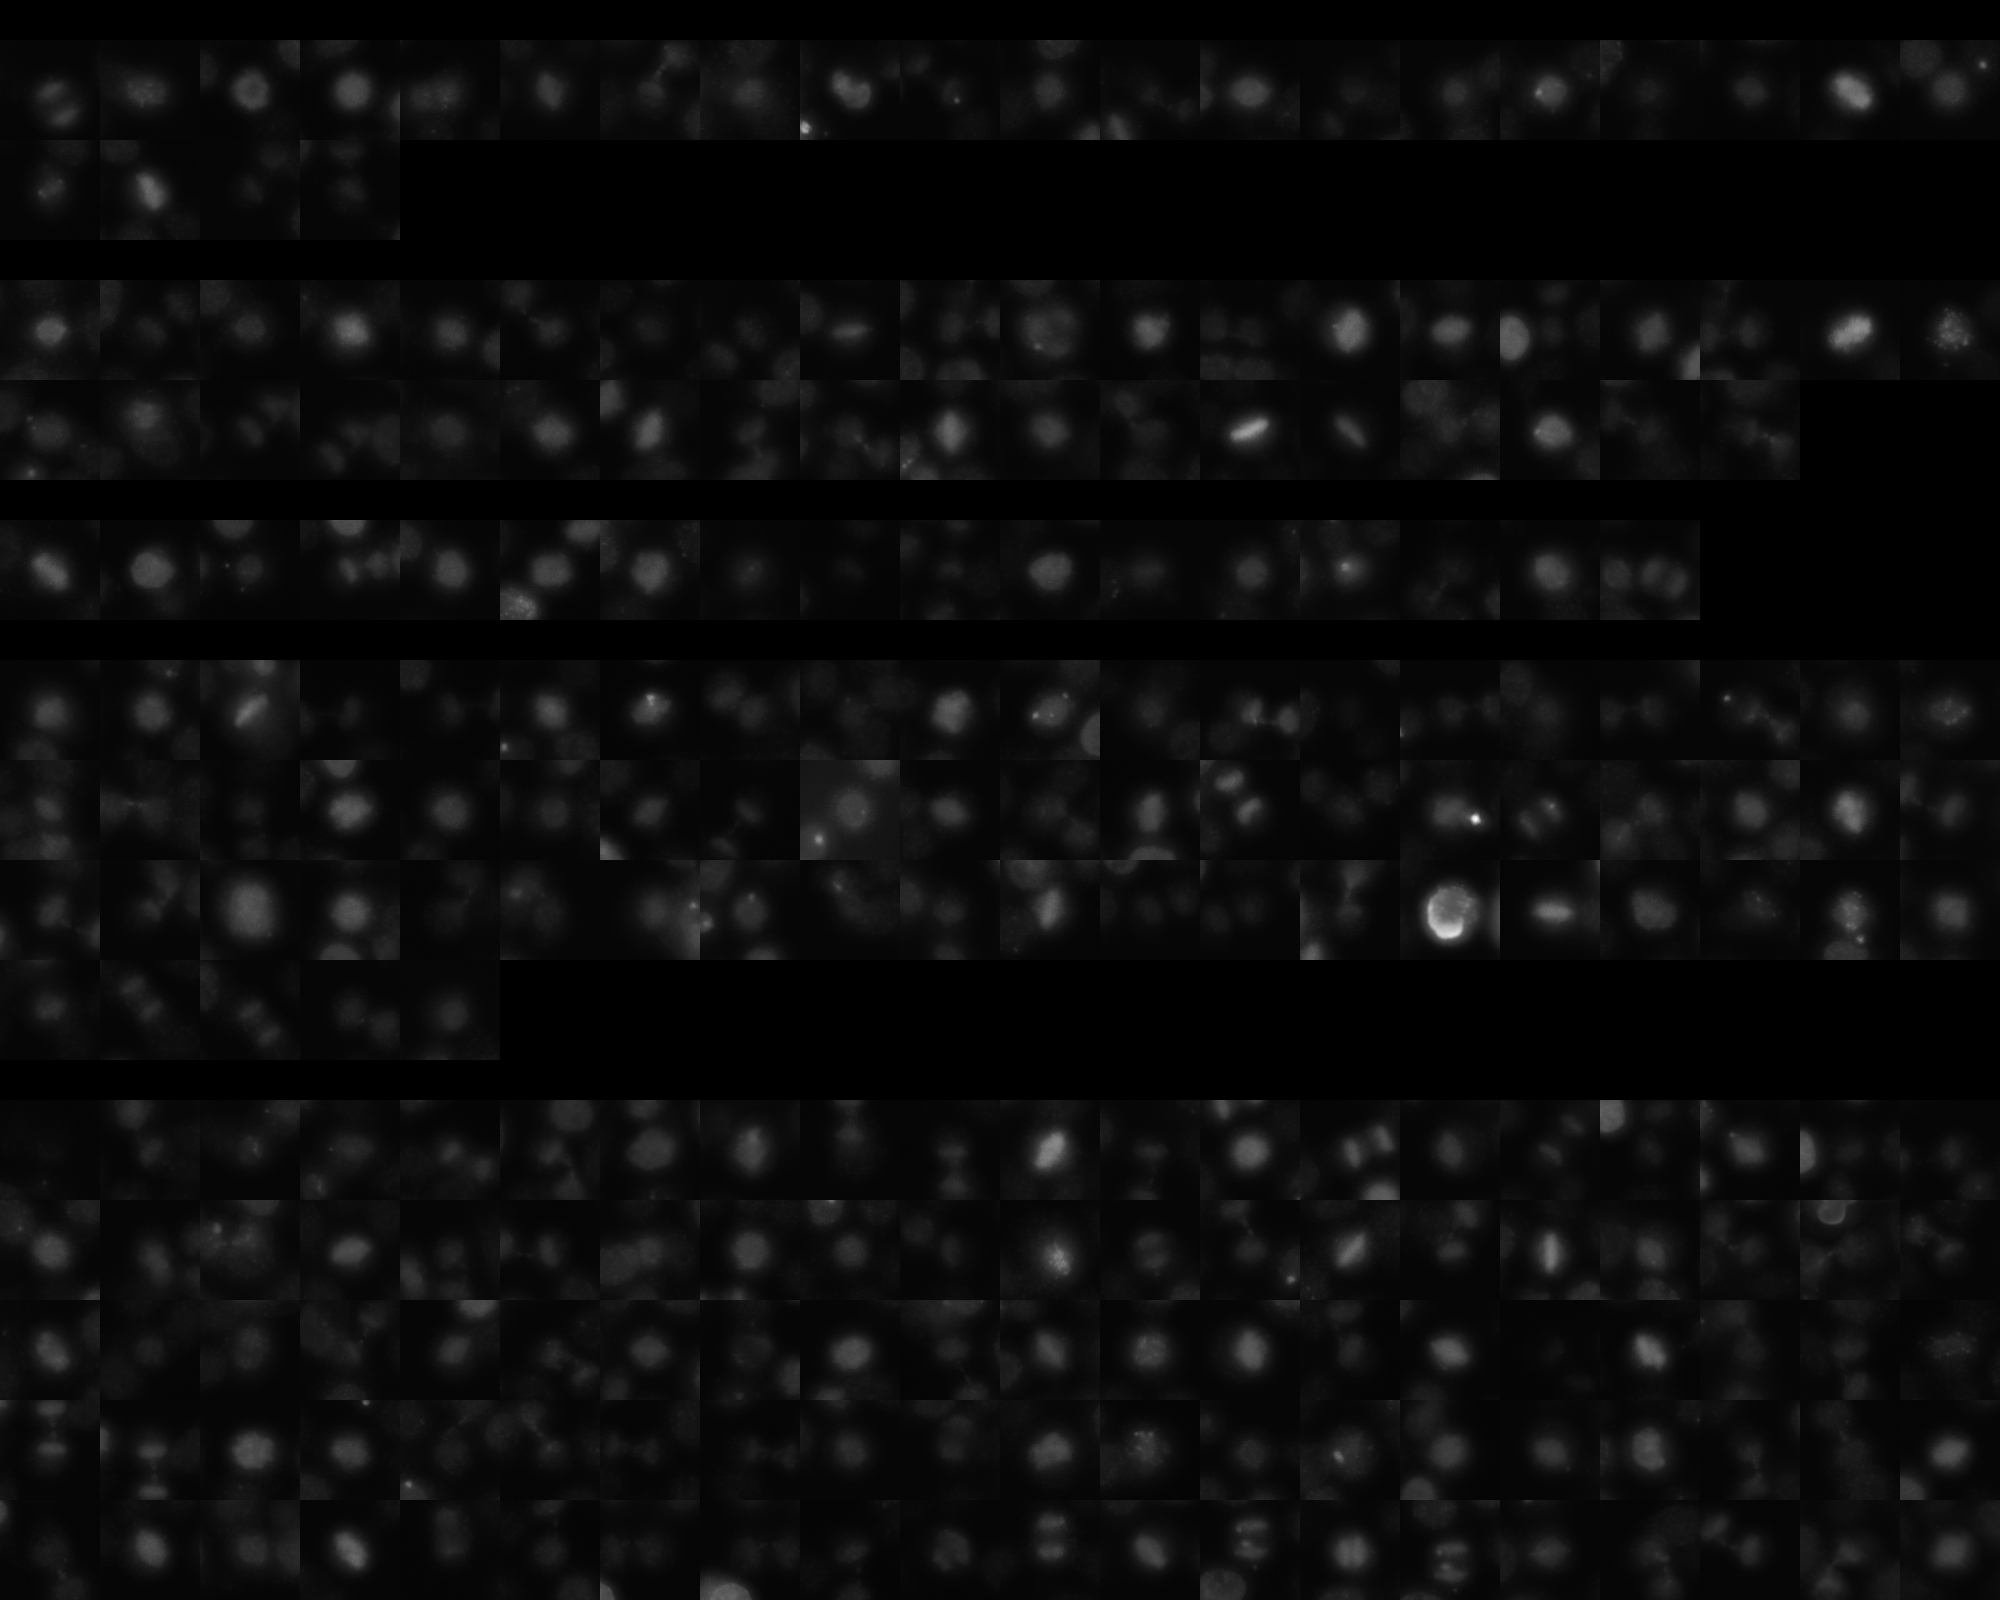
sgRNA 1: ATGGCAATGGAGGTGCCATG (interphase cells: 930, mitotic cells: 24)
sgRNA 2: CAGGACTGACGTCAGGTCGA (interphase cells: 1792, mitotic cells: 38)
sgRNA 3: GGCTAGCAGGGACTGCACCA (interphase cells: 884, mitotic cells: 17)
sgRNA 4: TACAAGAAAGACCCTGACAG (interphase cells: 2516, mitotic cells: 65)

Interphase Cluster

Mitotic Cluster

Overview

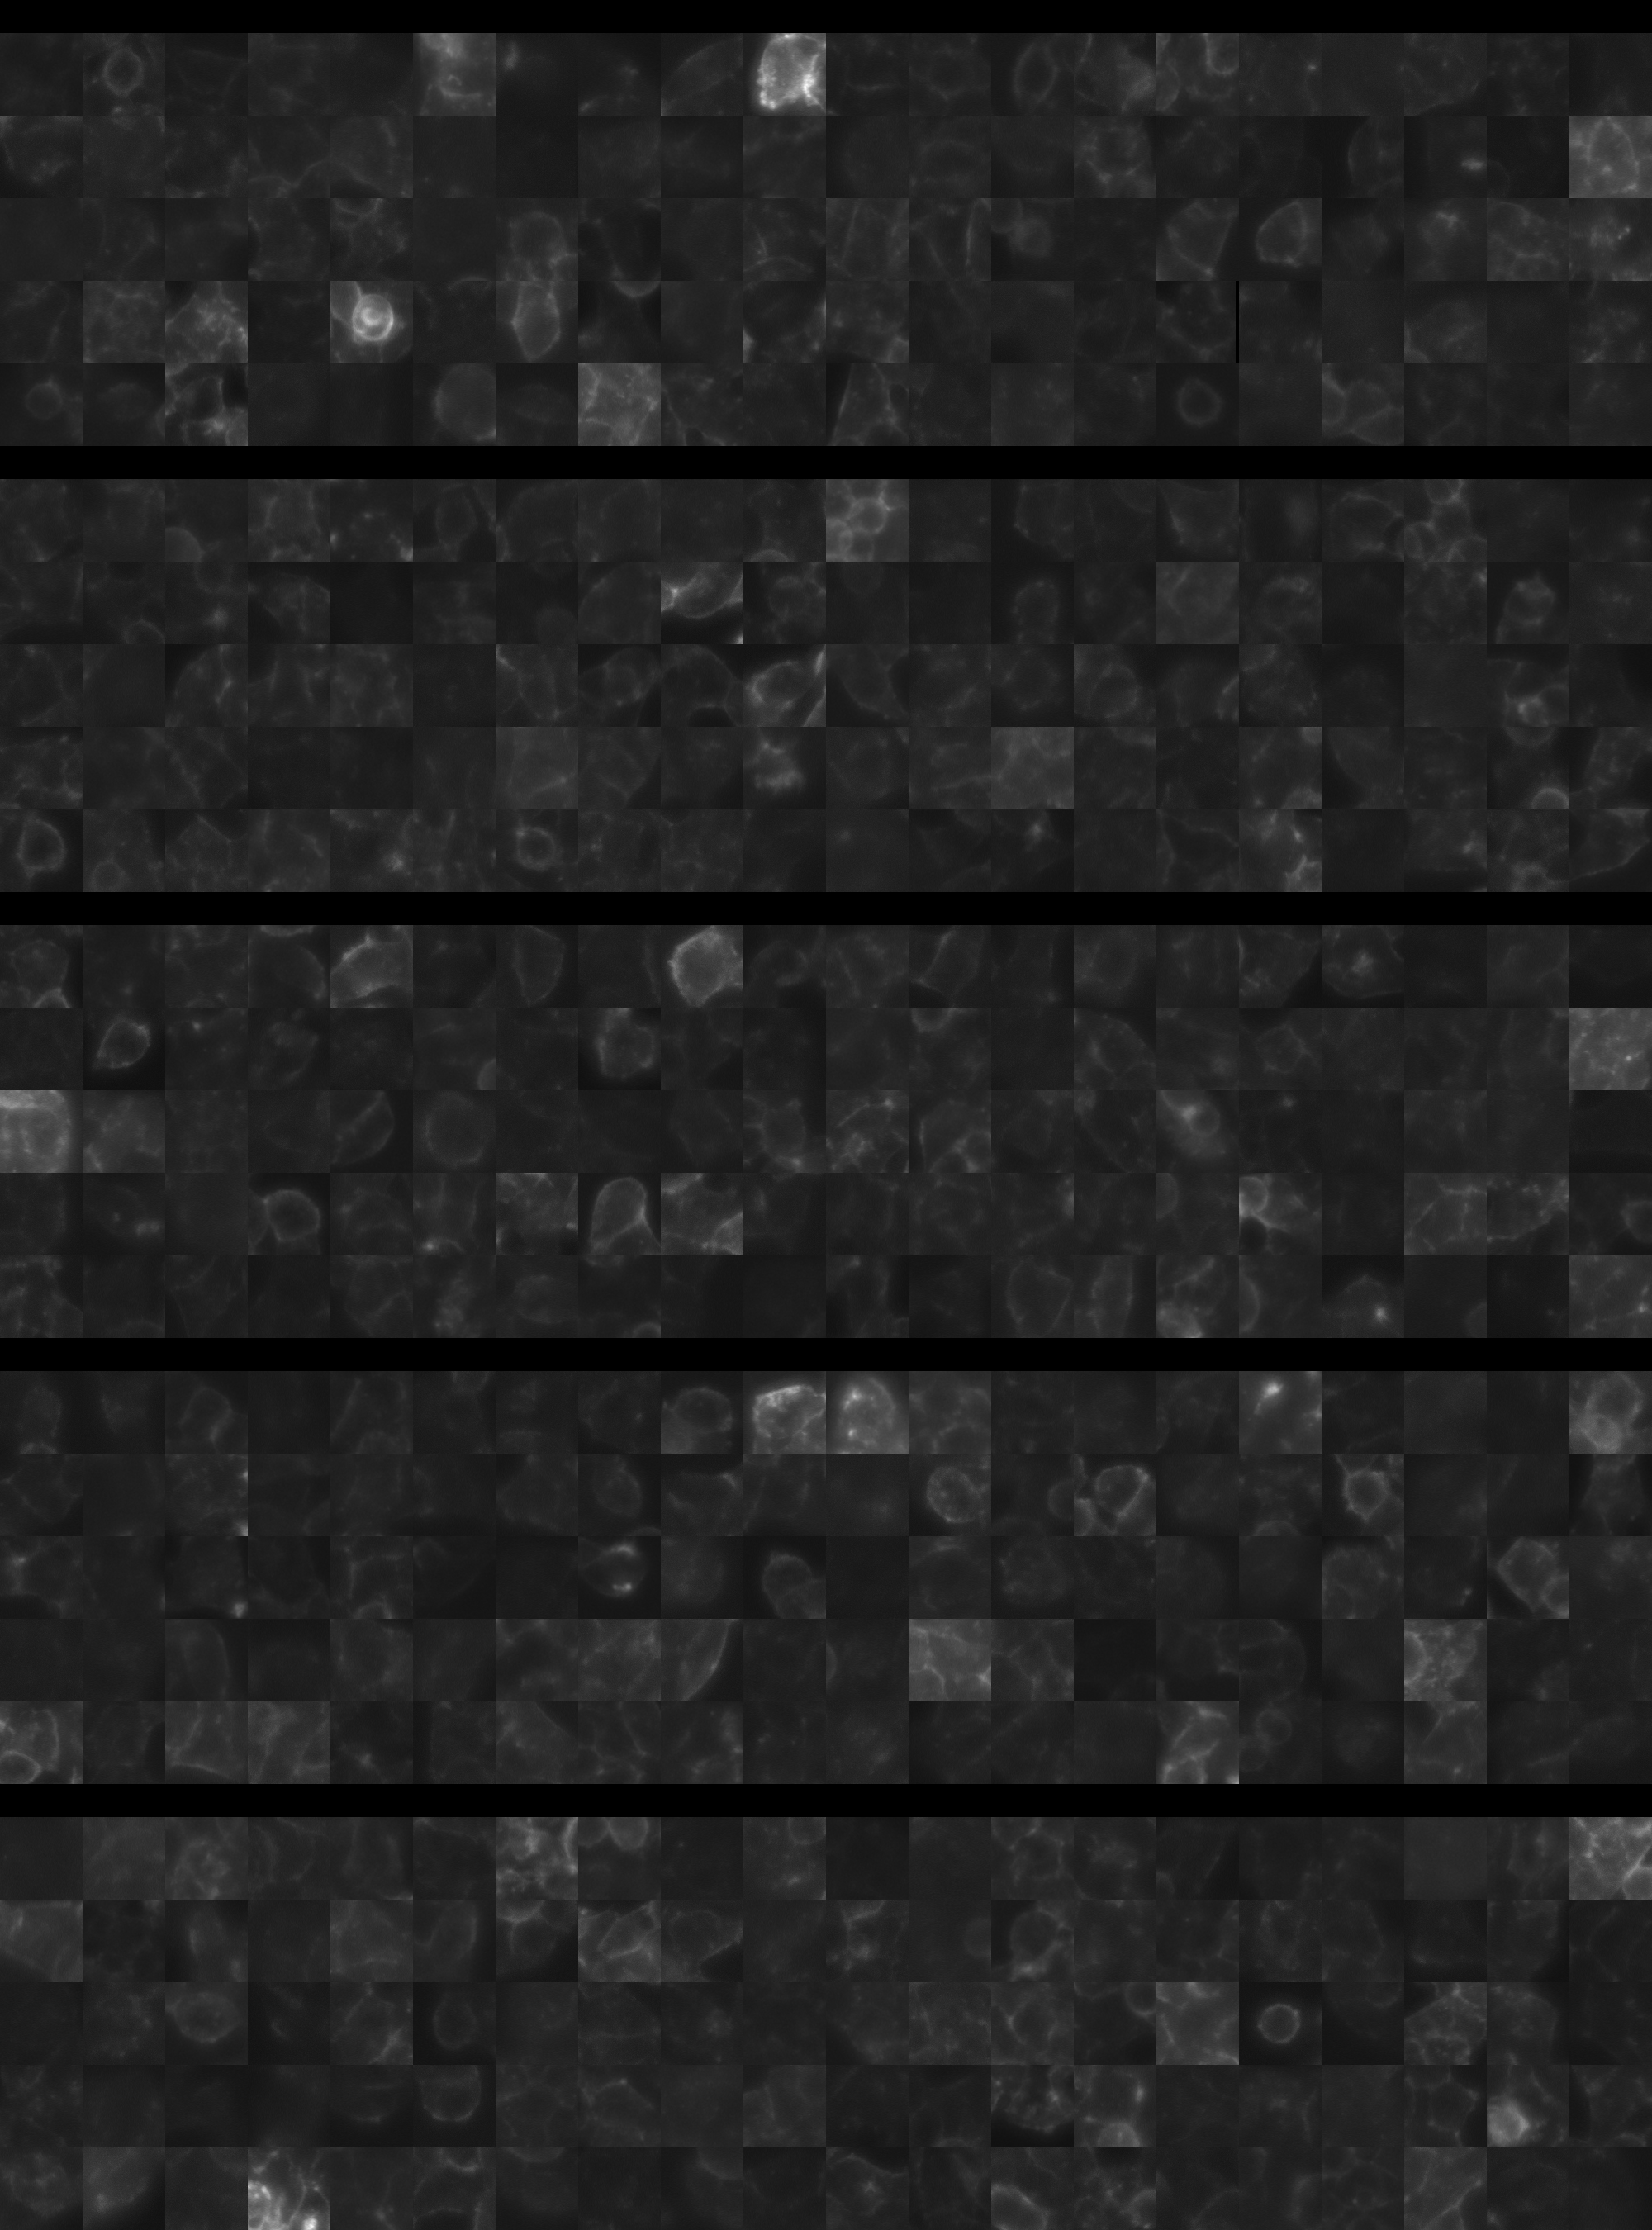
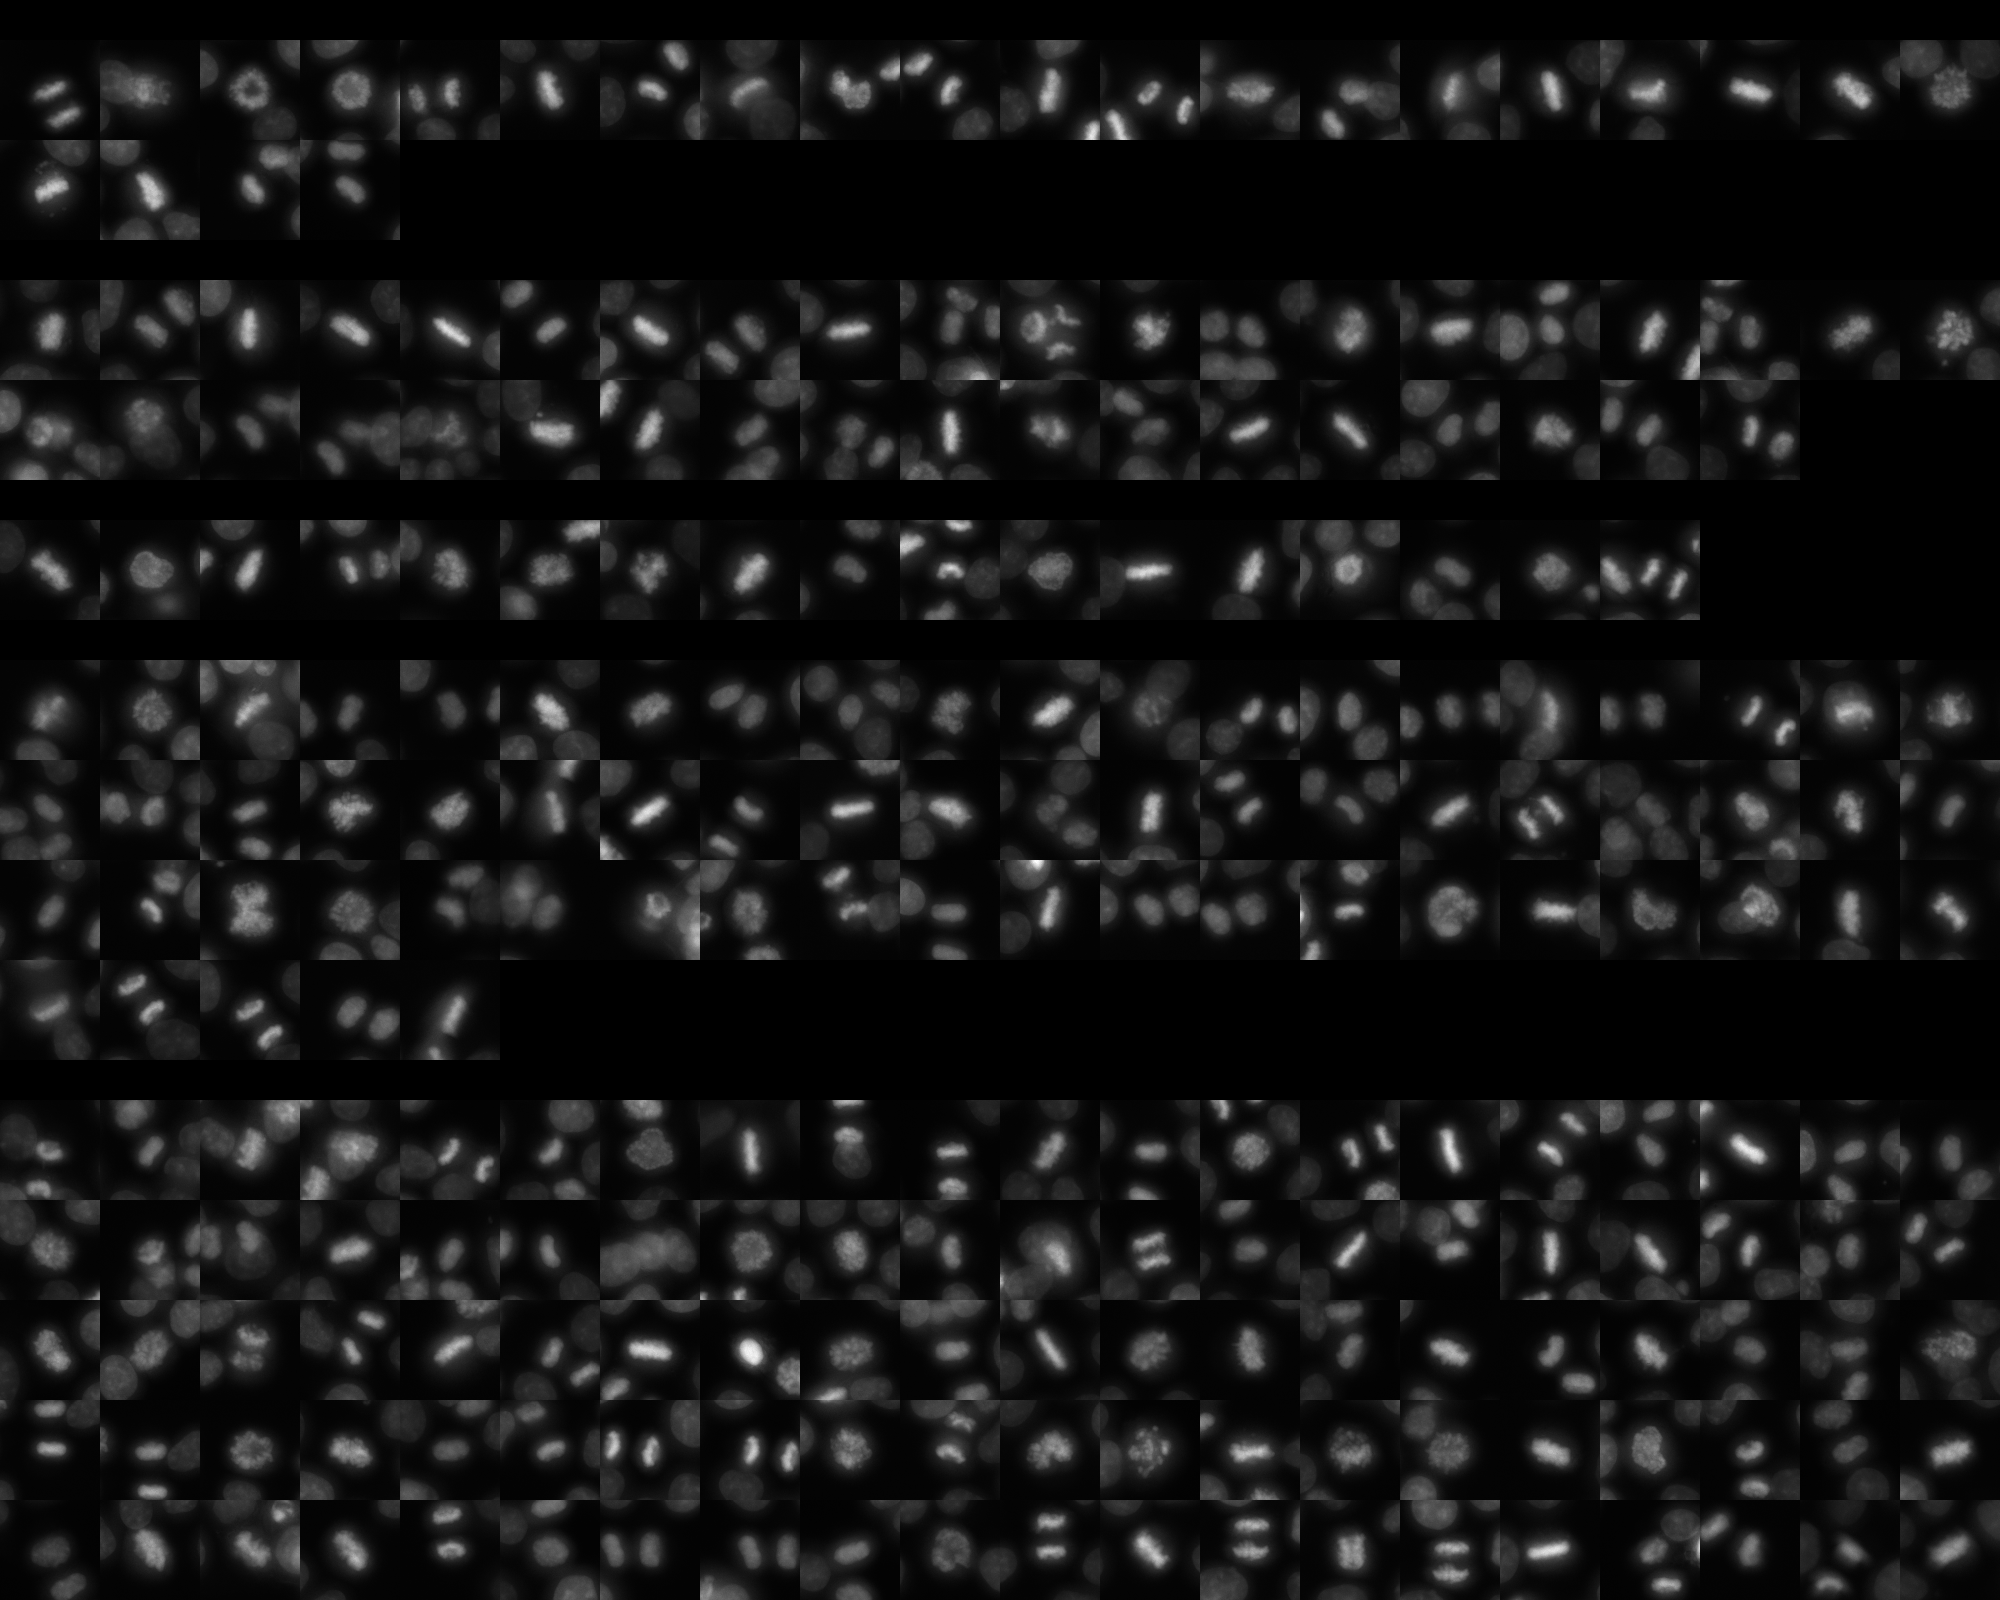
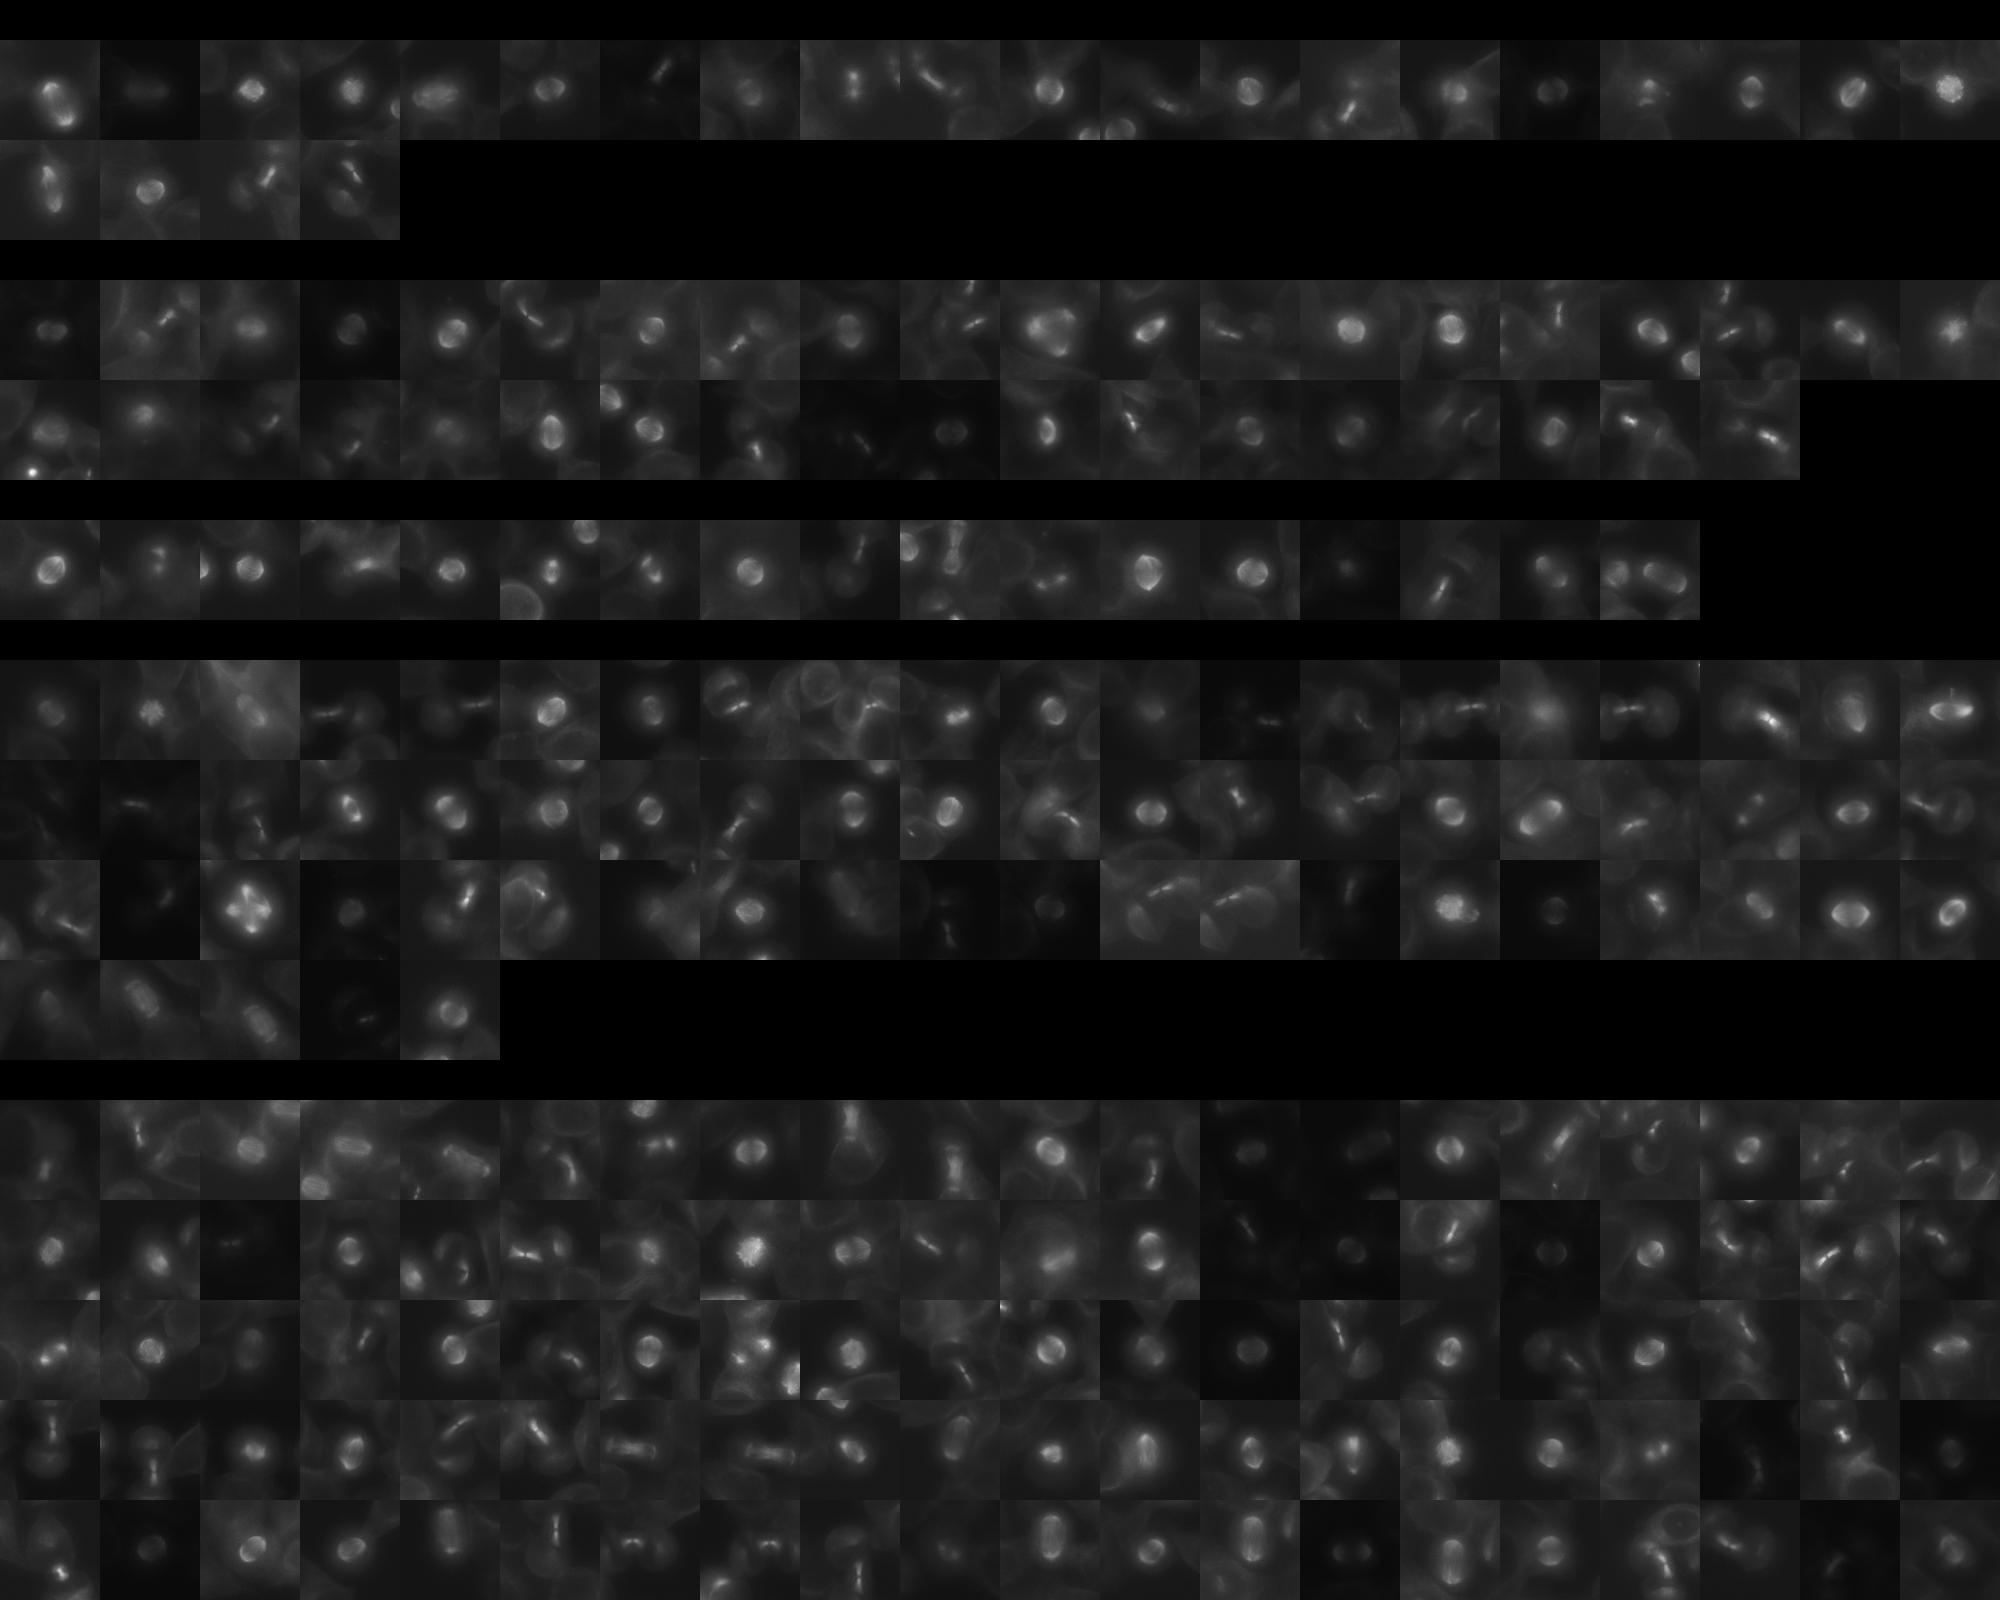
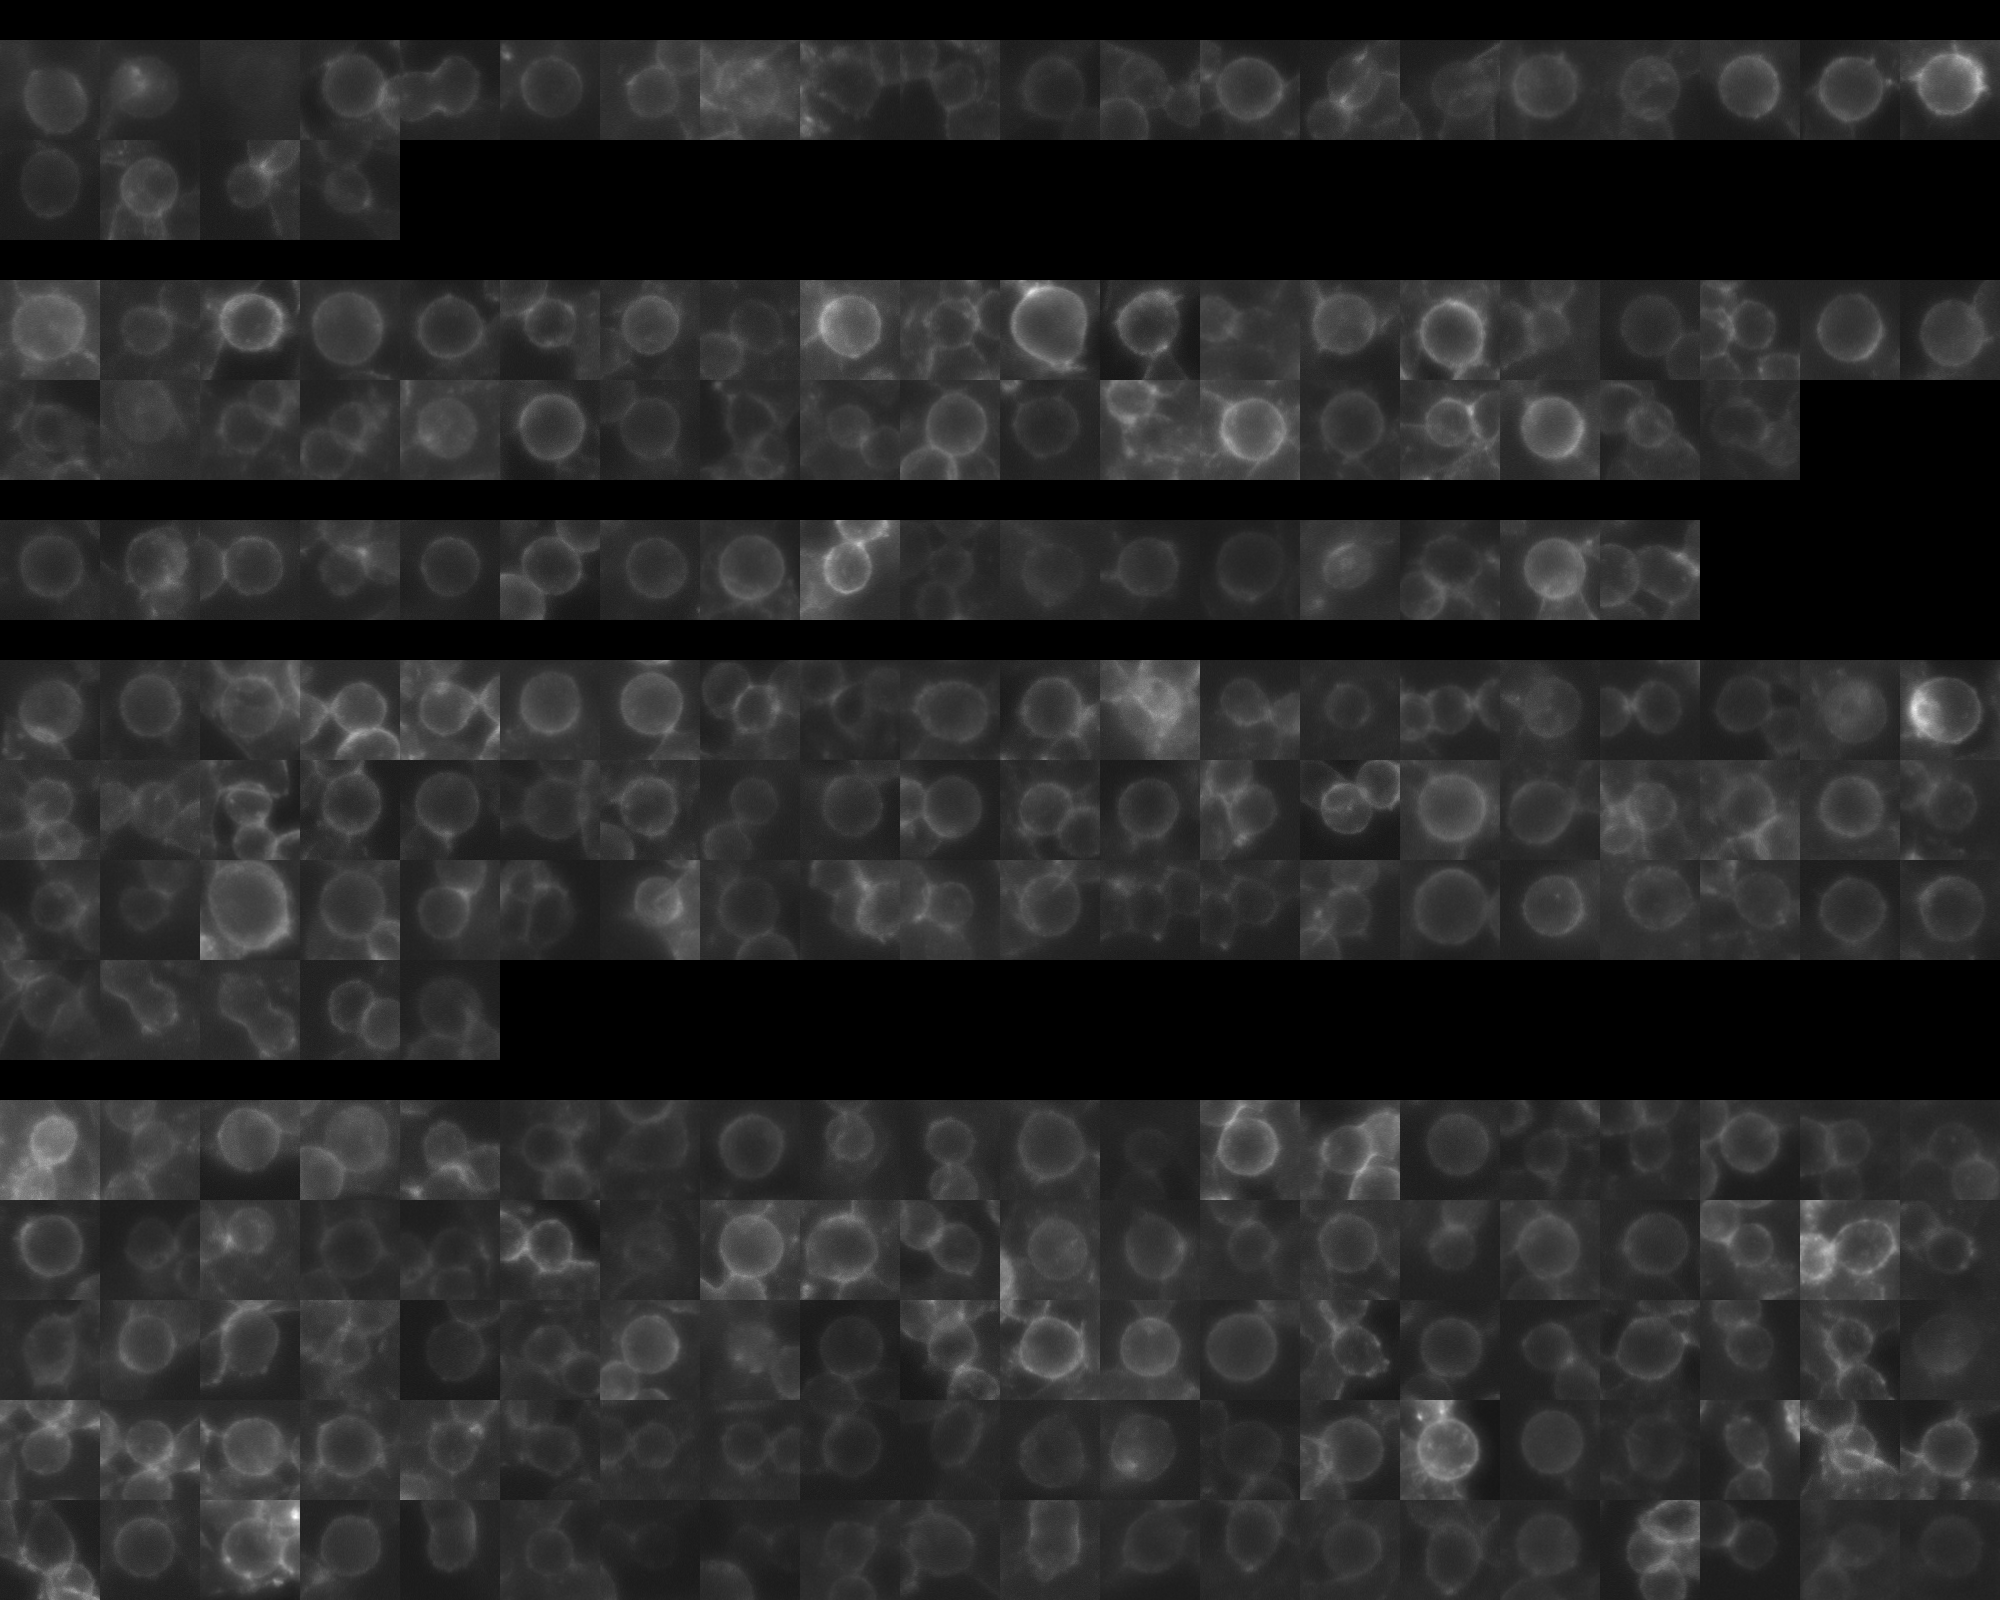
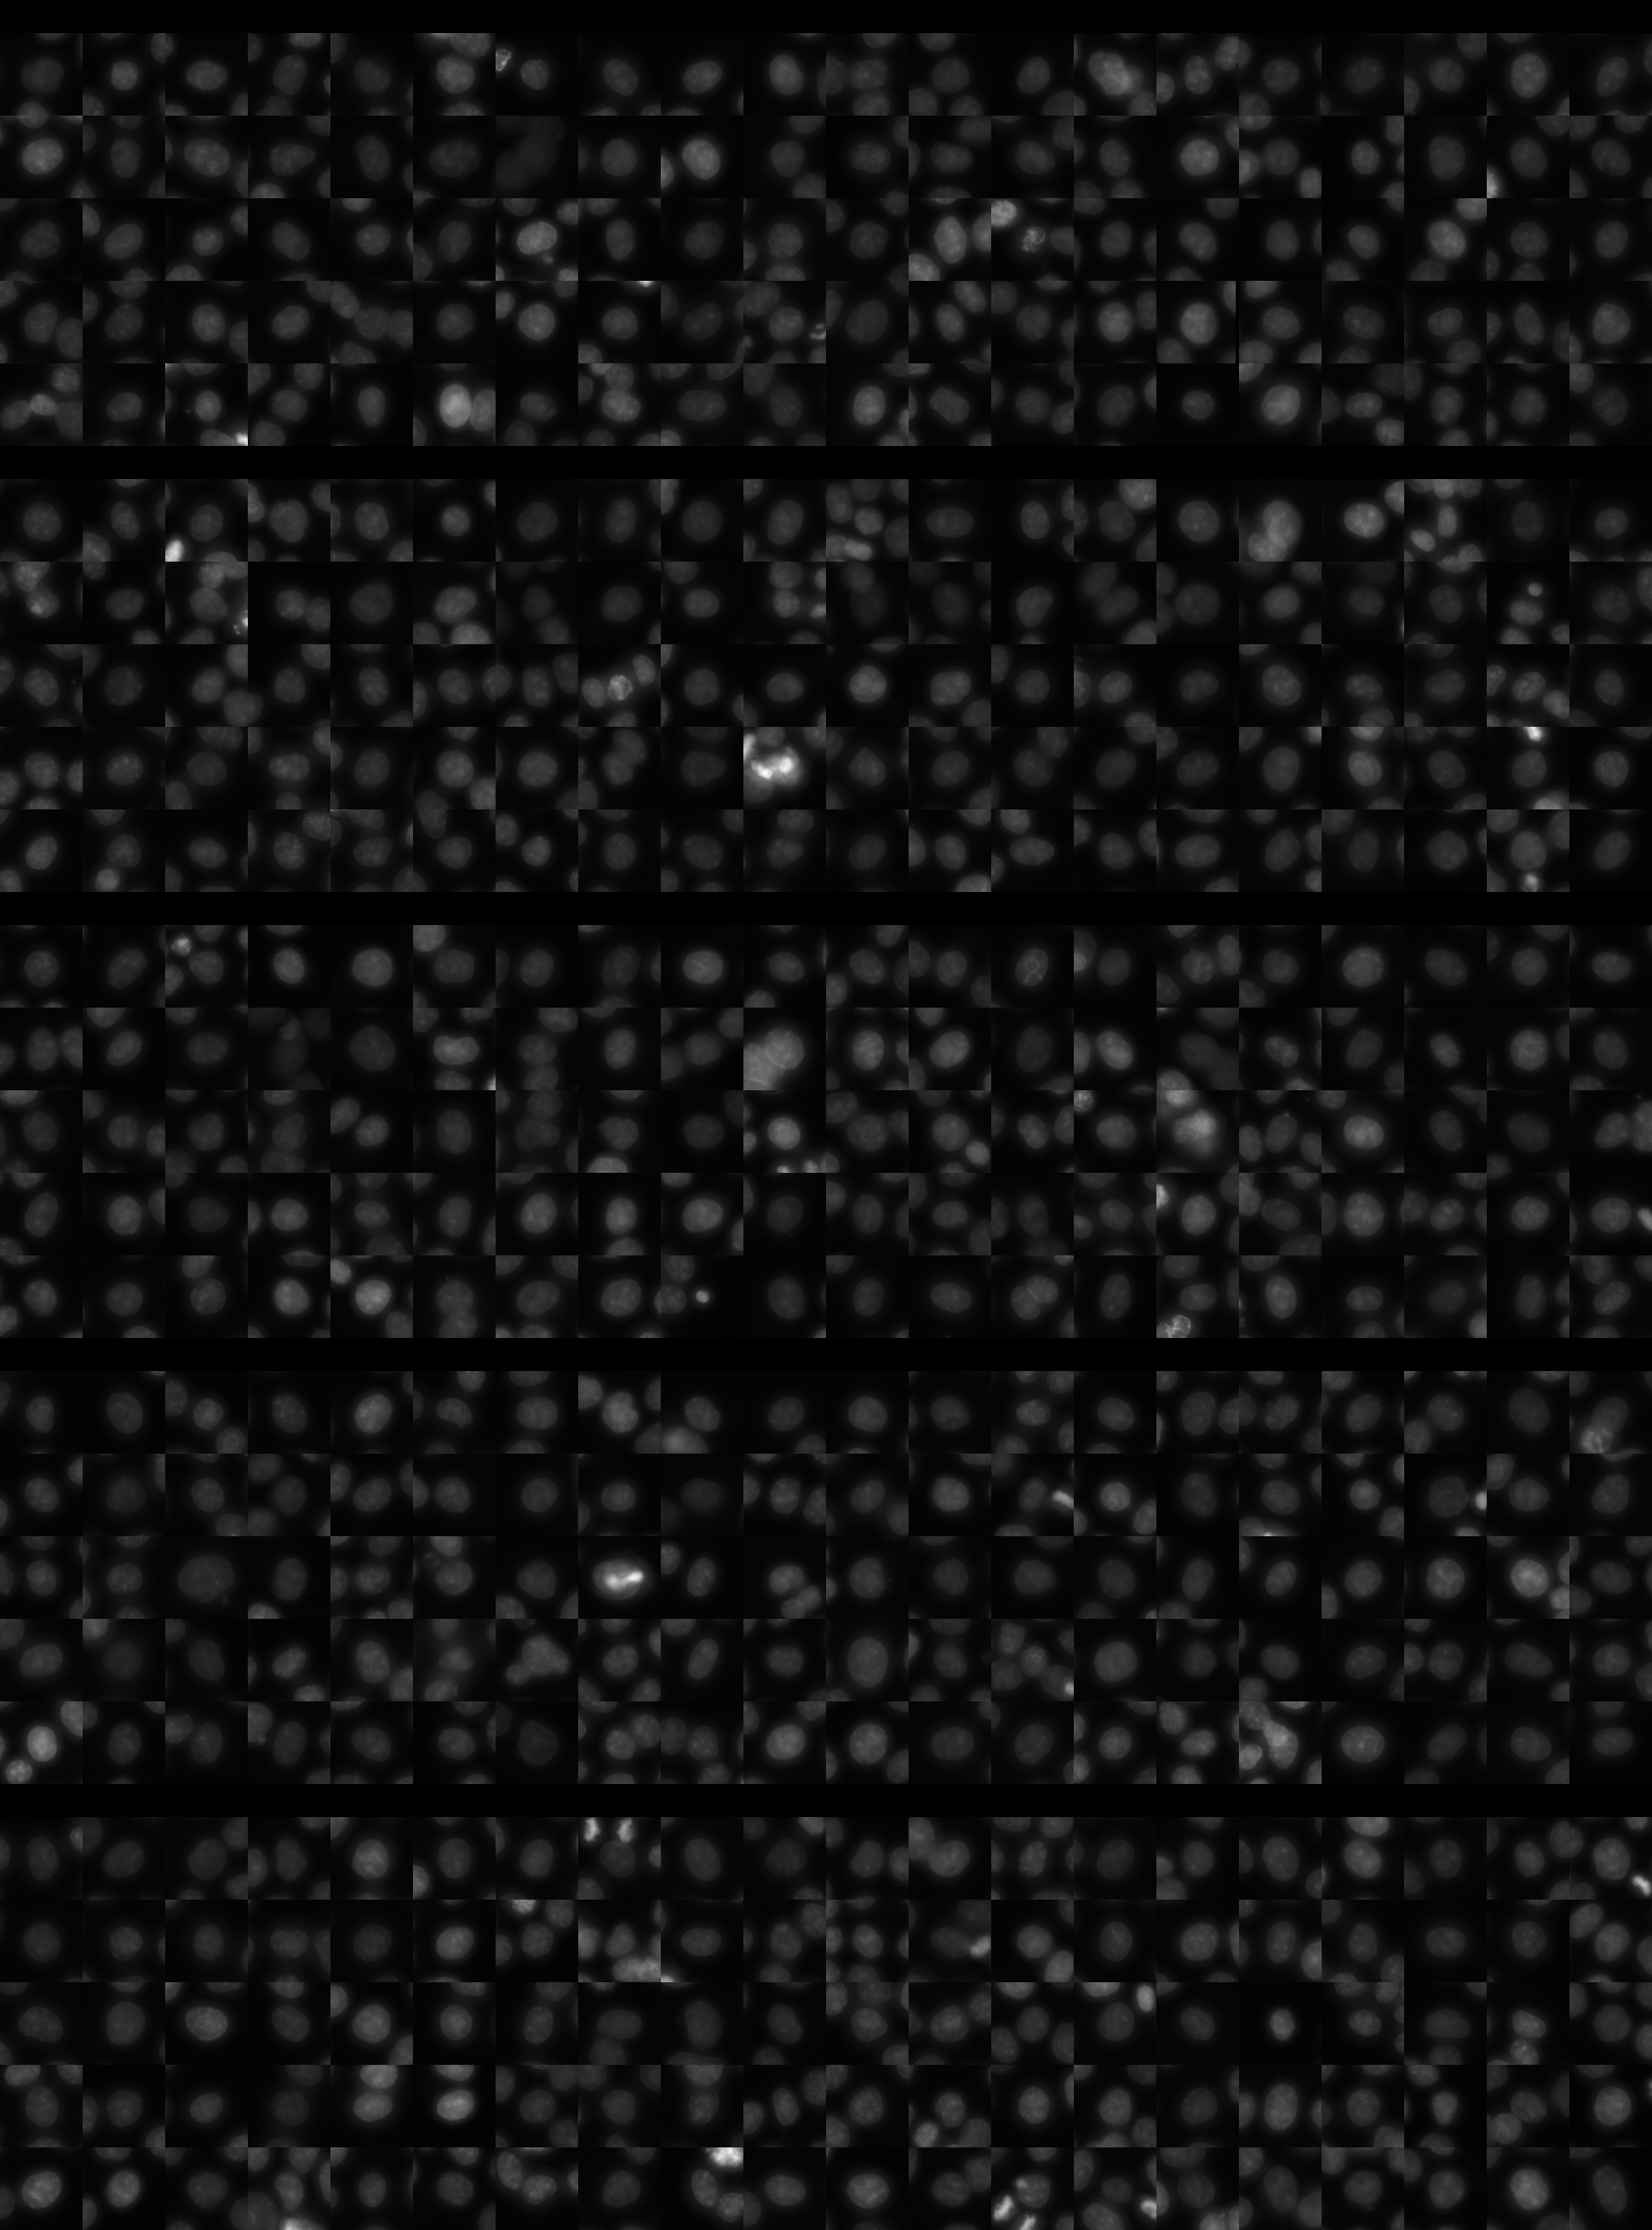
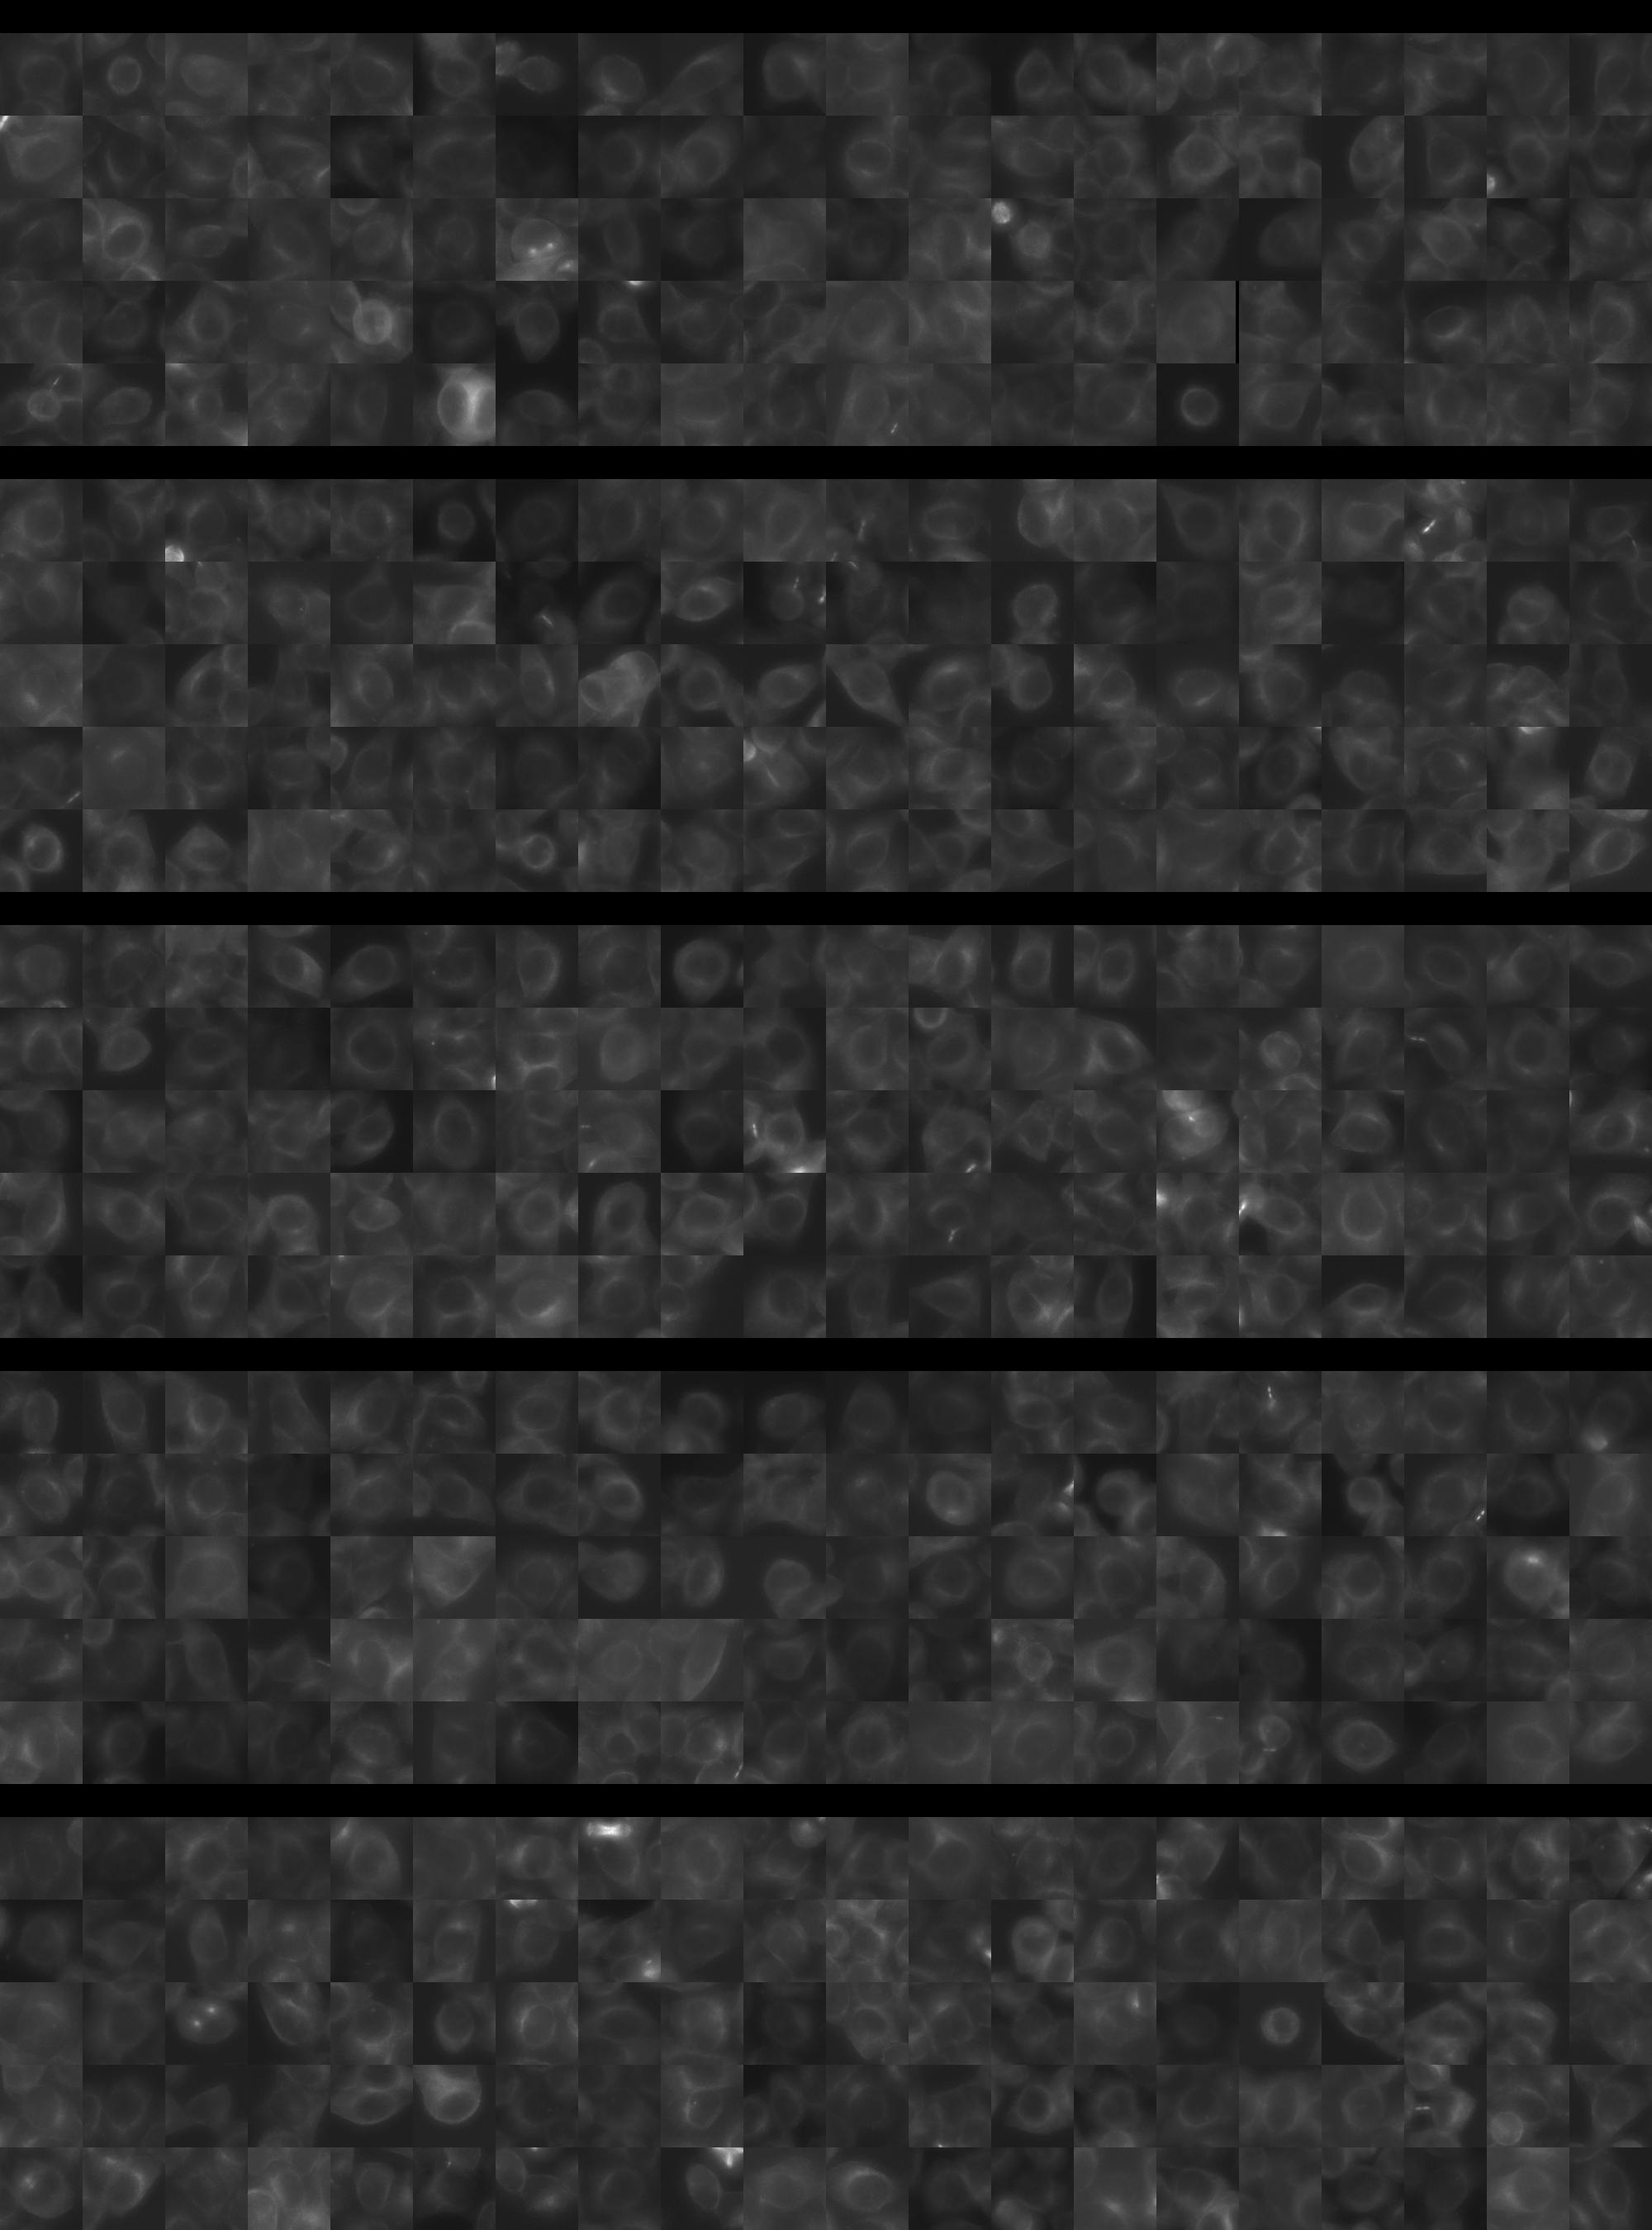
Each montage below shows randomly selected individual cell images for the same target gene separated by sgRNA, along with an example montage of cells expressing a non-targeting negative control sgRNA at the bottom. sgRNA labels in the montages correspond to the numbered sgRNA sequences in the gene info table above. The DNA (blue) and tubulin (green) channels are displayed by default, with gH2AX (grayscale) and actin (yellow) available using the check boxes. Channel brightness, contrast, and opacity are adjustable by clicking the arrow next to the channel name. When only one channel is selected, the display defaults to grayscale. Click the “Zoom” checkbox above the channel controls to enable image zooming (via scrolling) and panning (via click-and-drag).

The cell boxes displayed for this gene are square, 30.36 μm per side for the interphase montage and 30.36 μm per side for the mitotic montage.
Features

Interphase Score Rank FDR q-value
Nucleus DNA Integrated -3.231e-03 3274 of 5322 0.950
Nucleus DNA Mean -3.895e-02 3266 of 5322 0.412
Nucleus gH2AX Mean 0.029 4050 of 5322 0.455
Nucleus DNA - gH2AX Correlation -3.736e-02 1952 of 5322 0.198
Nucleus Shape Area 0.041 1934 of 5322 0.547
Nucleus Shape Eccentricity -1.598e-02 4076 of 5322 0.804
Nucleus Shape Form Factor -5.123e-02 2740 of 5322 0.197
Nucleus Shape Solidity -4.719e-02 2568 of 5322 0.173
Cell DNA Mass Displacement 0.009 3856 of 5322 0.933
Cell Tubulin Mean -4.140e-02 4112 of 5322 0.404
Cell Tubulin Mass Displacement 0.008 2553 of 5322 0.924
Cell Actin Mean -4.169e-02 4192 of 5322 0.453
Cell Tubulin - Actin Correlation 0.023 2535 of 5322 0.646
Cell DNA - Tubulin Correlation 0.009 3464 of 5322 0.871
Cell Shape Area 0.028 2215 of 5322 0.783
Cell Shape Eccentricity 0.029 1530 of 5322 0.696
Mitotic Score Rank FDR q-value
Nucleus DNA Integrated 0.098 2523 of 5322 0.965
Nucleus DNA Mean 0.148 961 of 5322 1.000
Nucleus DNA Mass Displacement 0.046 2776 of 5322 0.999
Nucleus DNA Mean Frac 3 -1.599e-01 4861 of 5322 1.000
Nucleus gH2AX Mean 0.014 2768 of 5322 1.000
Nucleus gH2AX Mean Frac 0 -8.300e-02 3561 of 5322 1.000
Nucleus Tubulin Mean Frac 0 0.098 2010 of 5322 0.999
Nucleus Tubulin Mean Edge -2.076e-02 3456 of 5322 0.999
Nucleus Tubulin Std Edge 0.197 477 of 5322 0.999
Nucleus Shape Area 0.236 1182 of 5322 0.852
Nucleus Shape Eccentricity 0.006 2002 of 5322 1.000
Nucleus Shape Form Factor -1.041e-01 2915 of 5322 0.998
Cell Tubulin Mean -9.422e-02 4518 of 5322 0.997
Cell Tubulin Mean Frac 3 -2.142e-01 4185 of 5322 0.999
Cell Actin Mean -6.026e-02 3987 of 5322 0.997
Cell Shape Area 0.108 2491 of 5322 0.998
( Reset Zoom )
Brightness
Contrast
Opacity
Brightness
Contrast
Opacity
Brightness
Contrast
Opacity
Brightness
Contrast
Opacity
Brightness
Contrast
Opacity

( Reset Zoom )
Brightness
Contrast
Opacity
Brightness
Contrast
Opacity
Brightness
Contrast
Opacity
Brightness
Contrast
Opacity
Brightness
Contrast
Opacity

MIT Central Accessability