ACBD3

Gene symbol: ACBD3
Gene: 64746
Uniprot Function: Involved in the maintenance of Golgi structure by interacting with giantin, affecting protein transport between the endoplasmic reticulum and Golgi (PubMed:11590181). Involved in hormone-induced steroid biosynthesis in testicular Leydig cells (By similarity). Recruits PI4KB to the Golgi apparatus membrane; enhances the enzyme activity of PI4KB activity via its membrane recruitment thereby increasing the local concentration of the substrate in the vicinity of the kinase (PubMed:27009356).
Mitotic Index 0.0248
Interphase Cluster: #36 (33 genes)
Mitotic Cluster: #79 (26 genes)
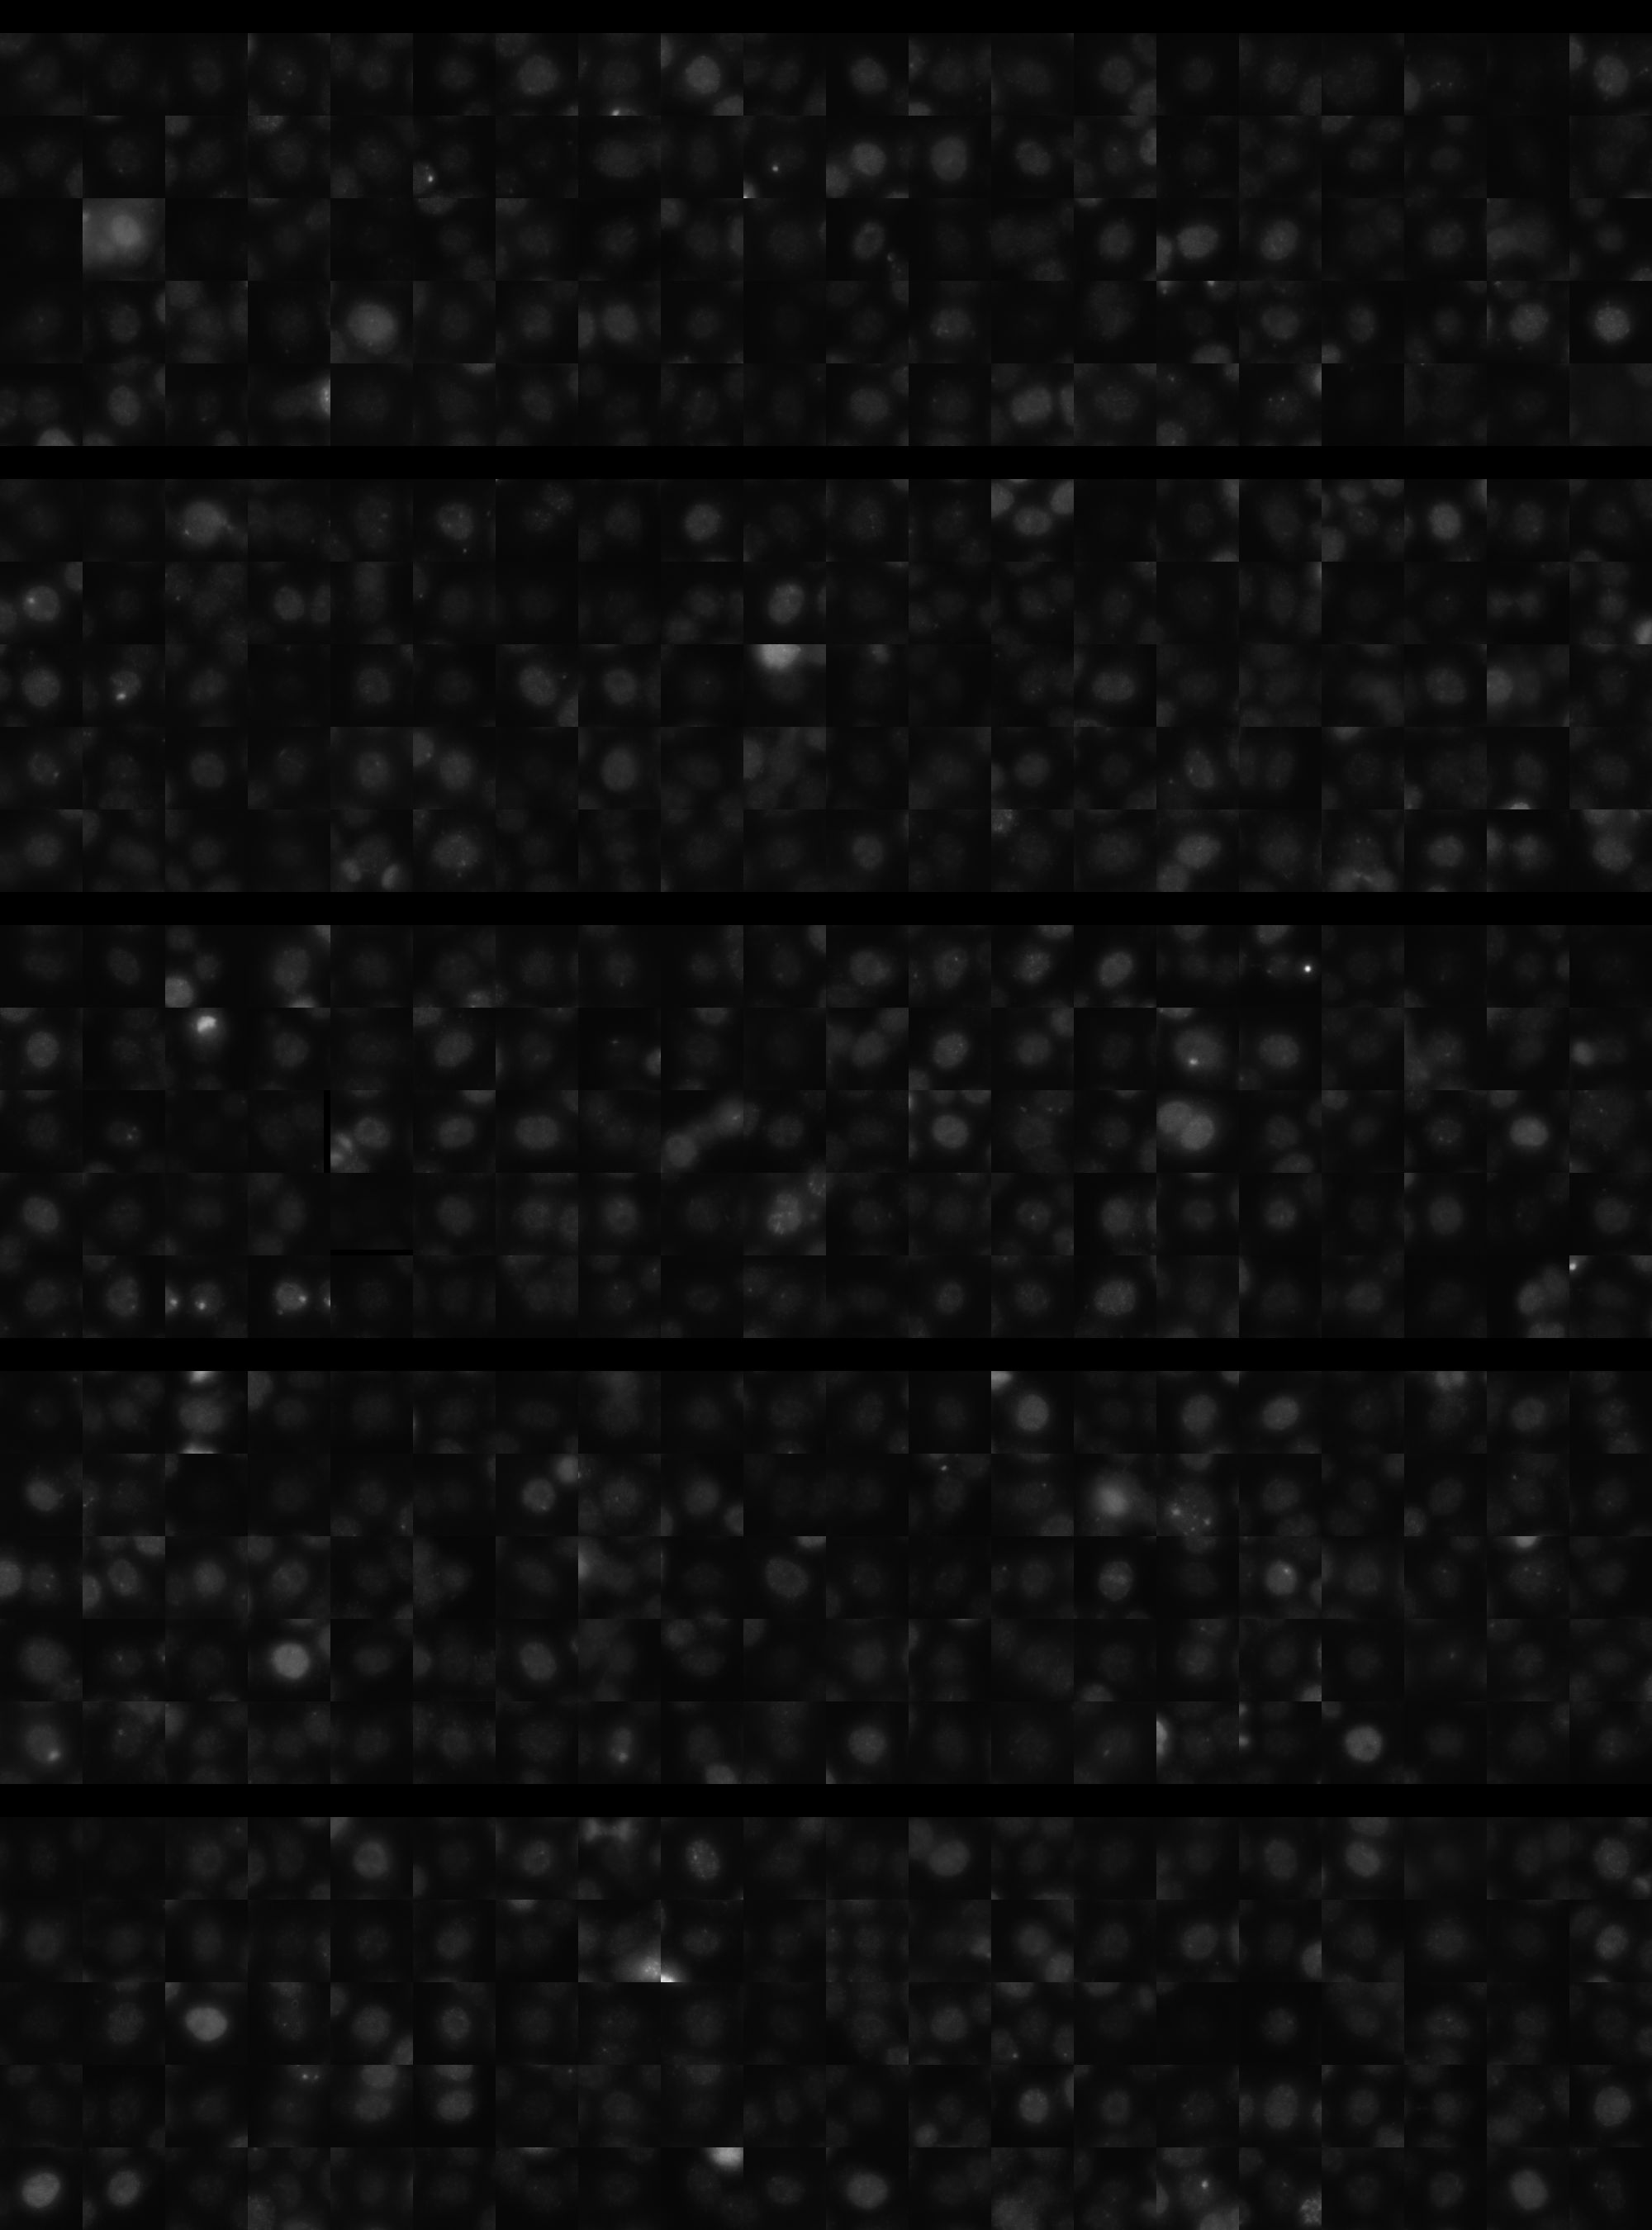
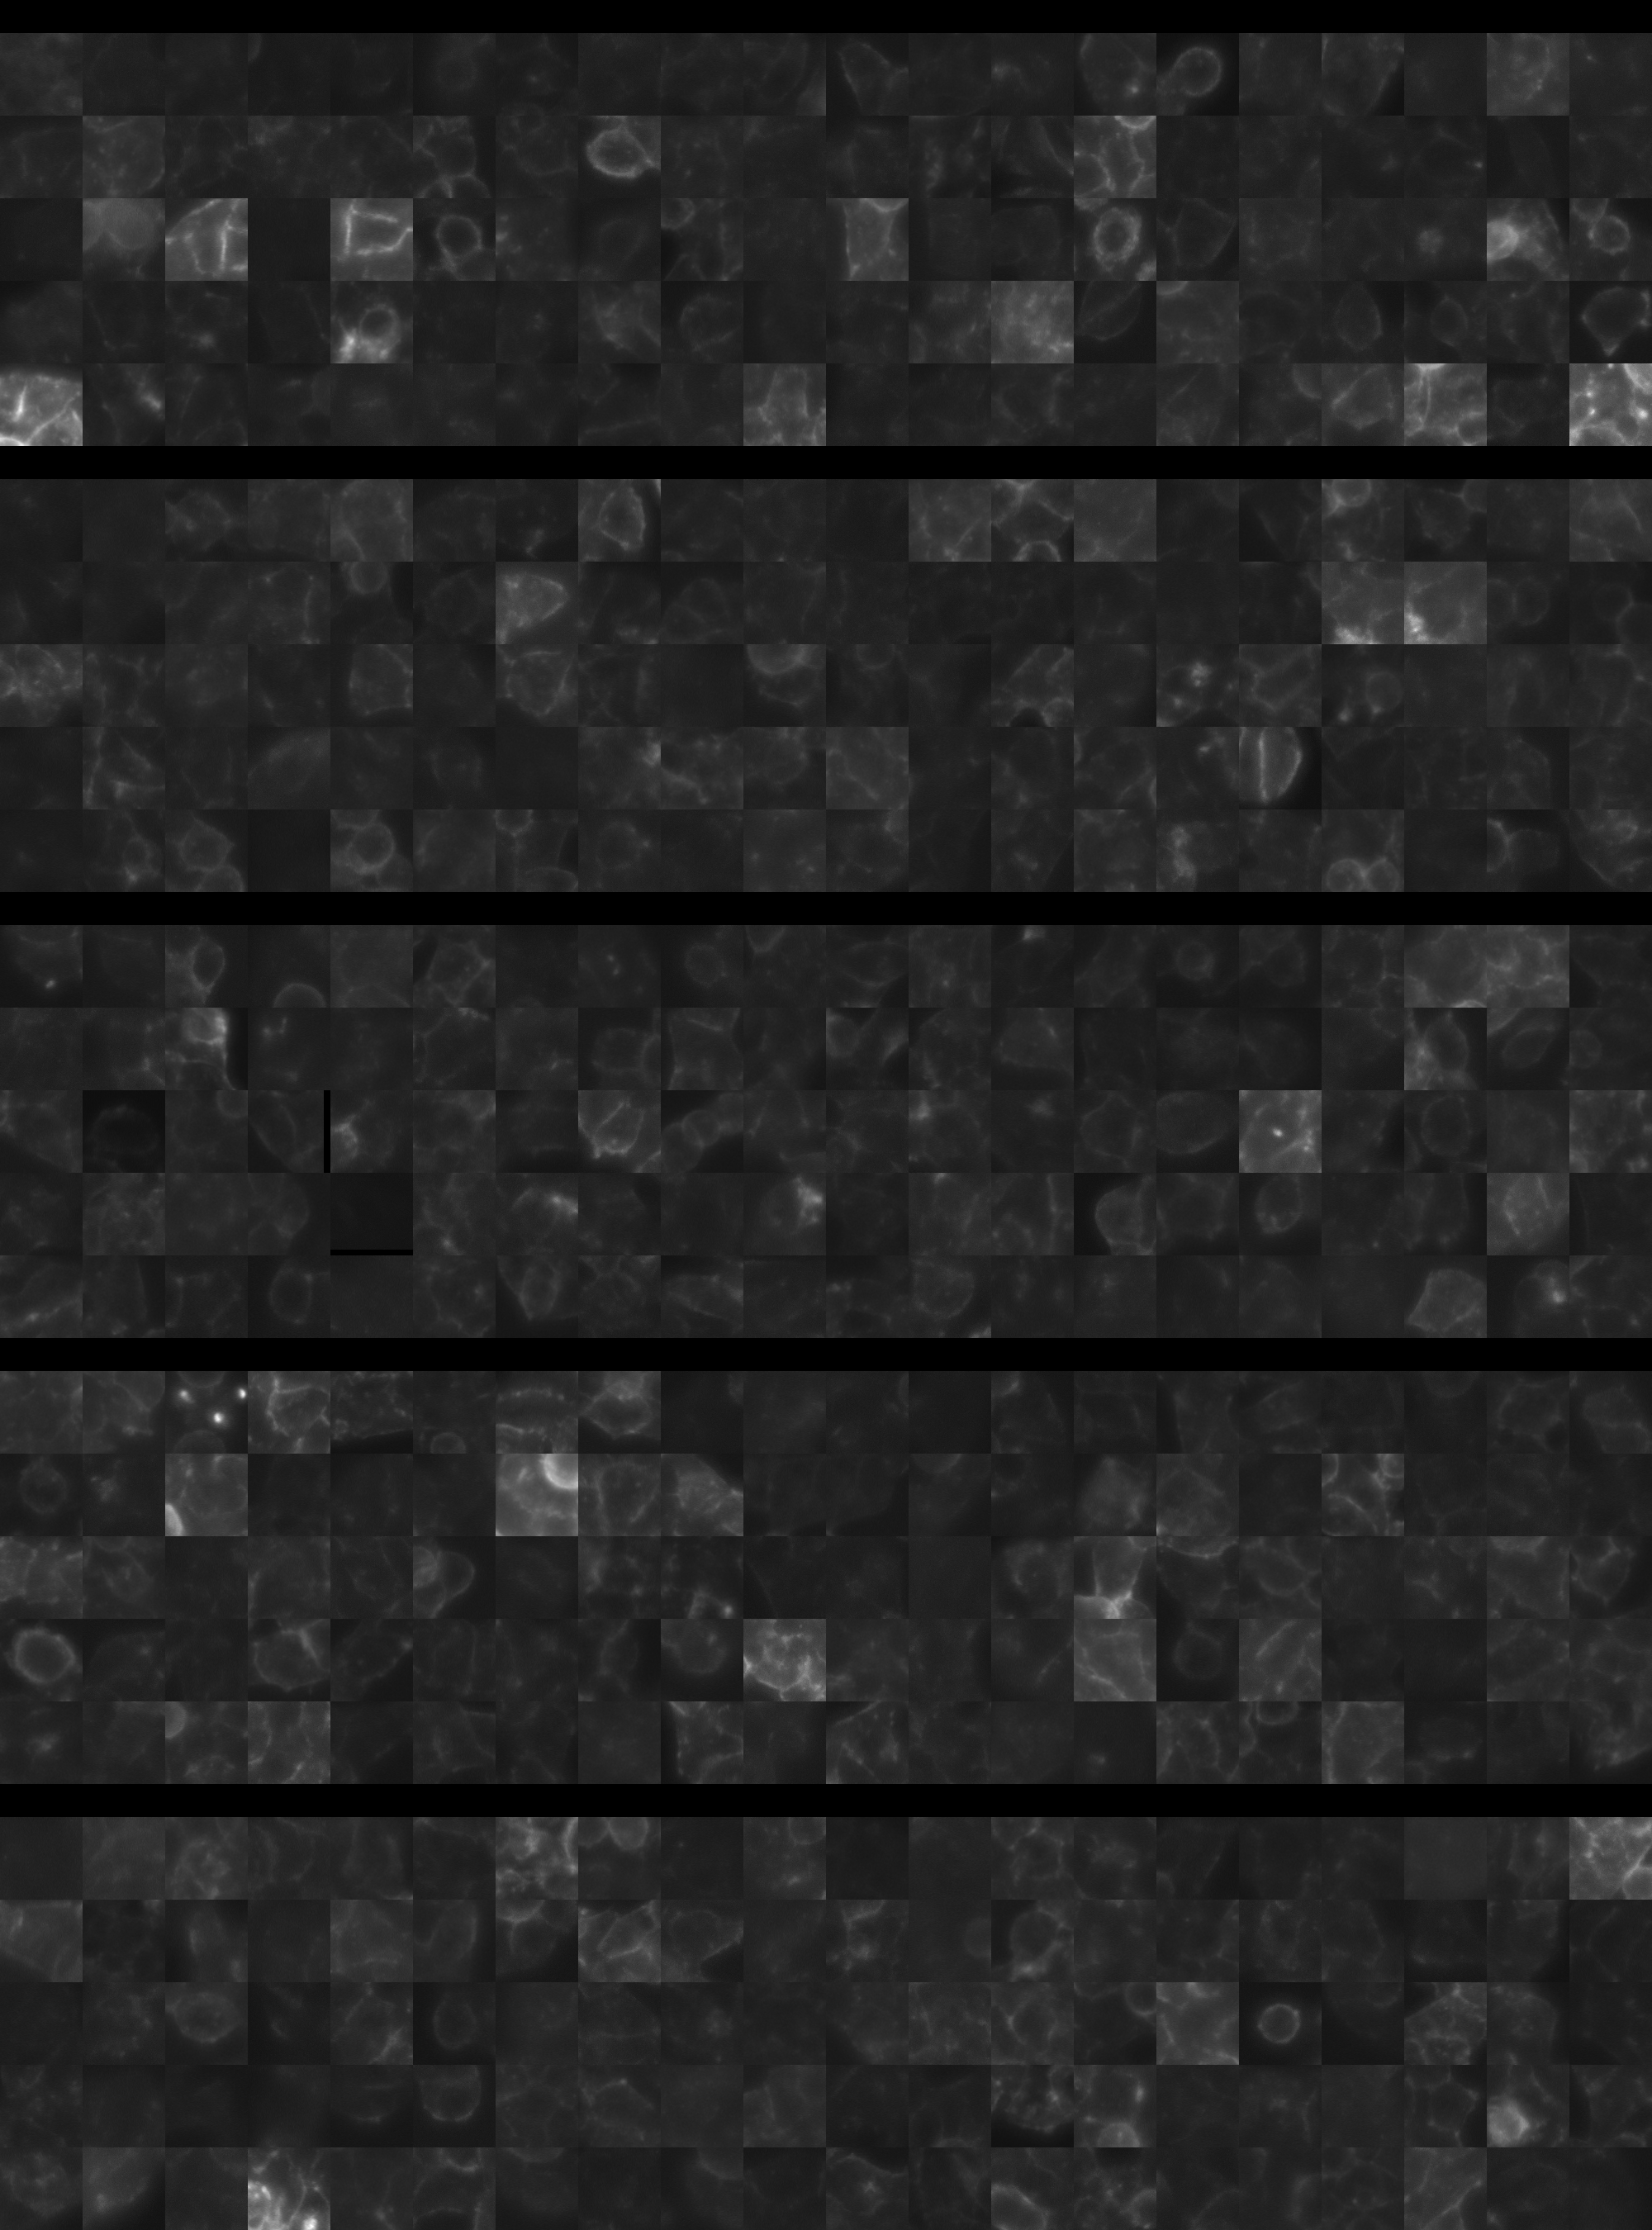
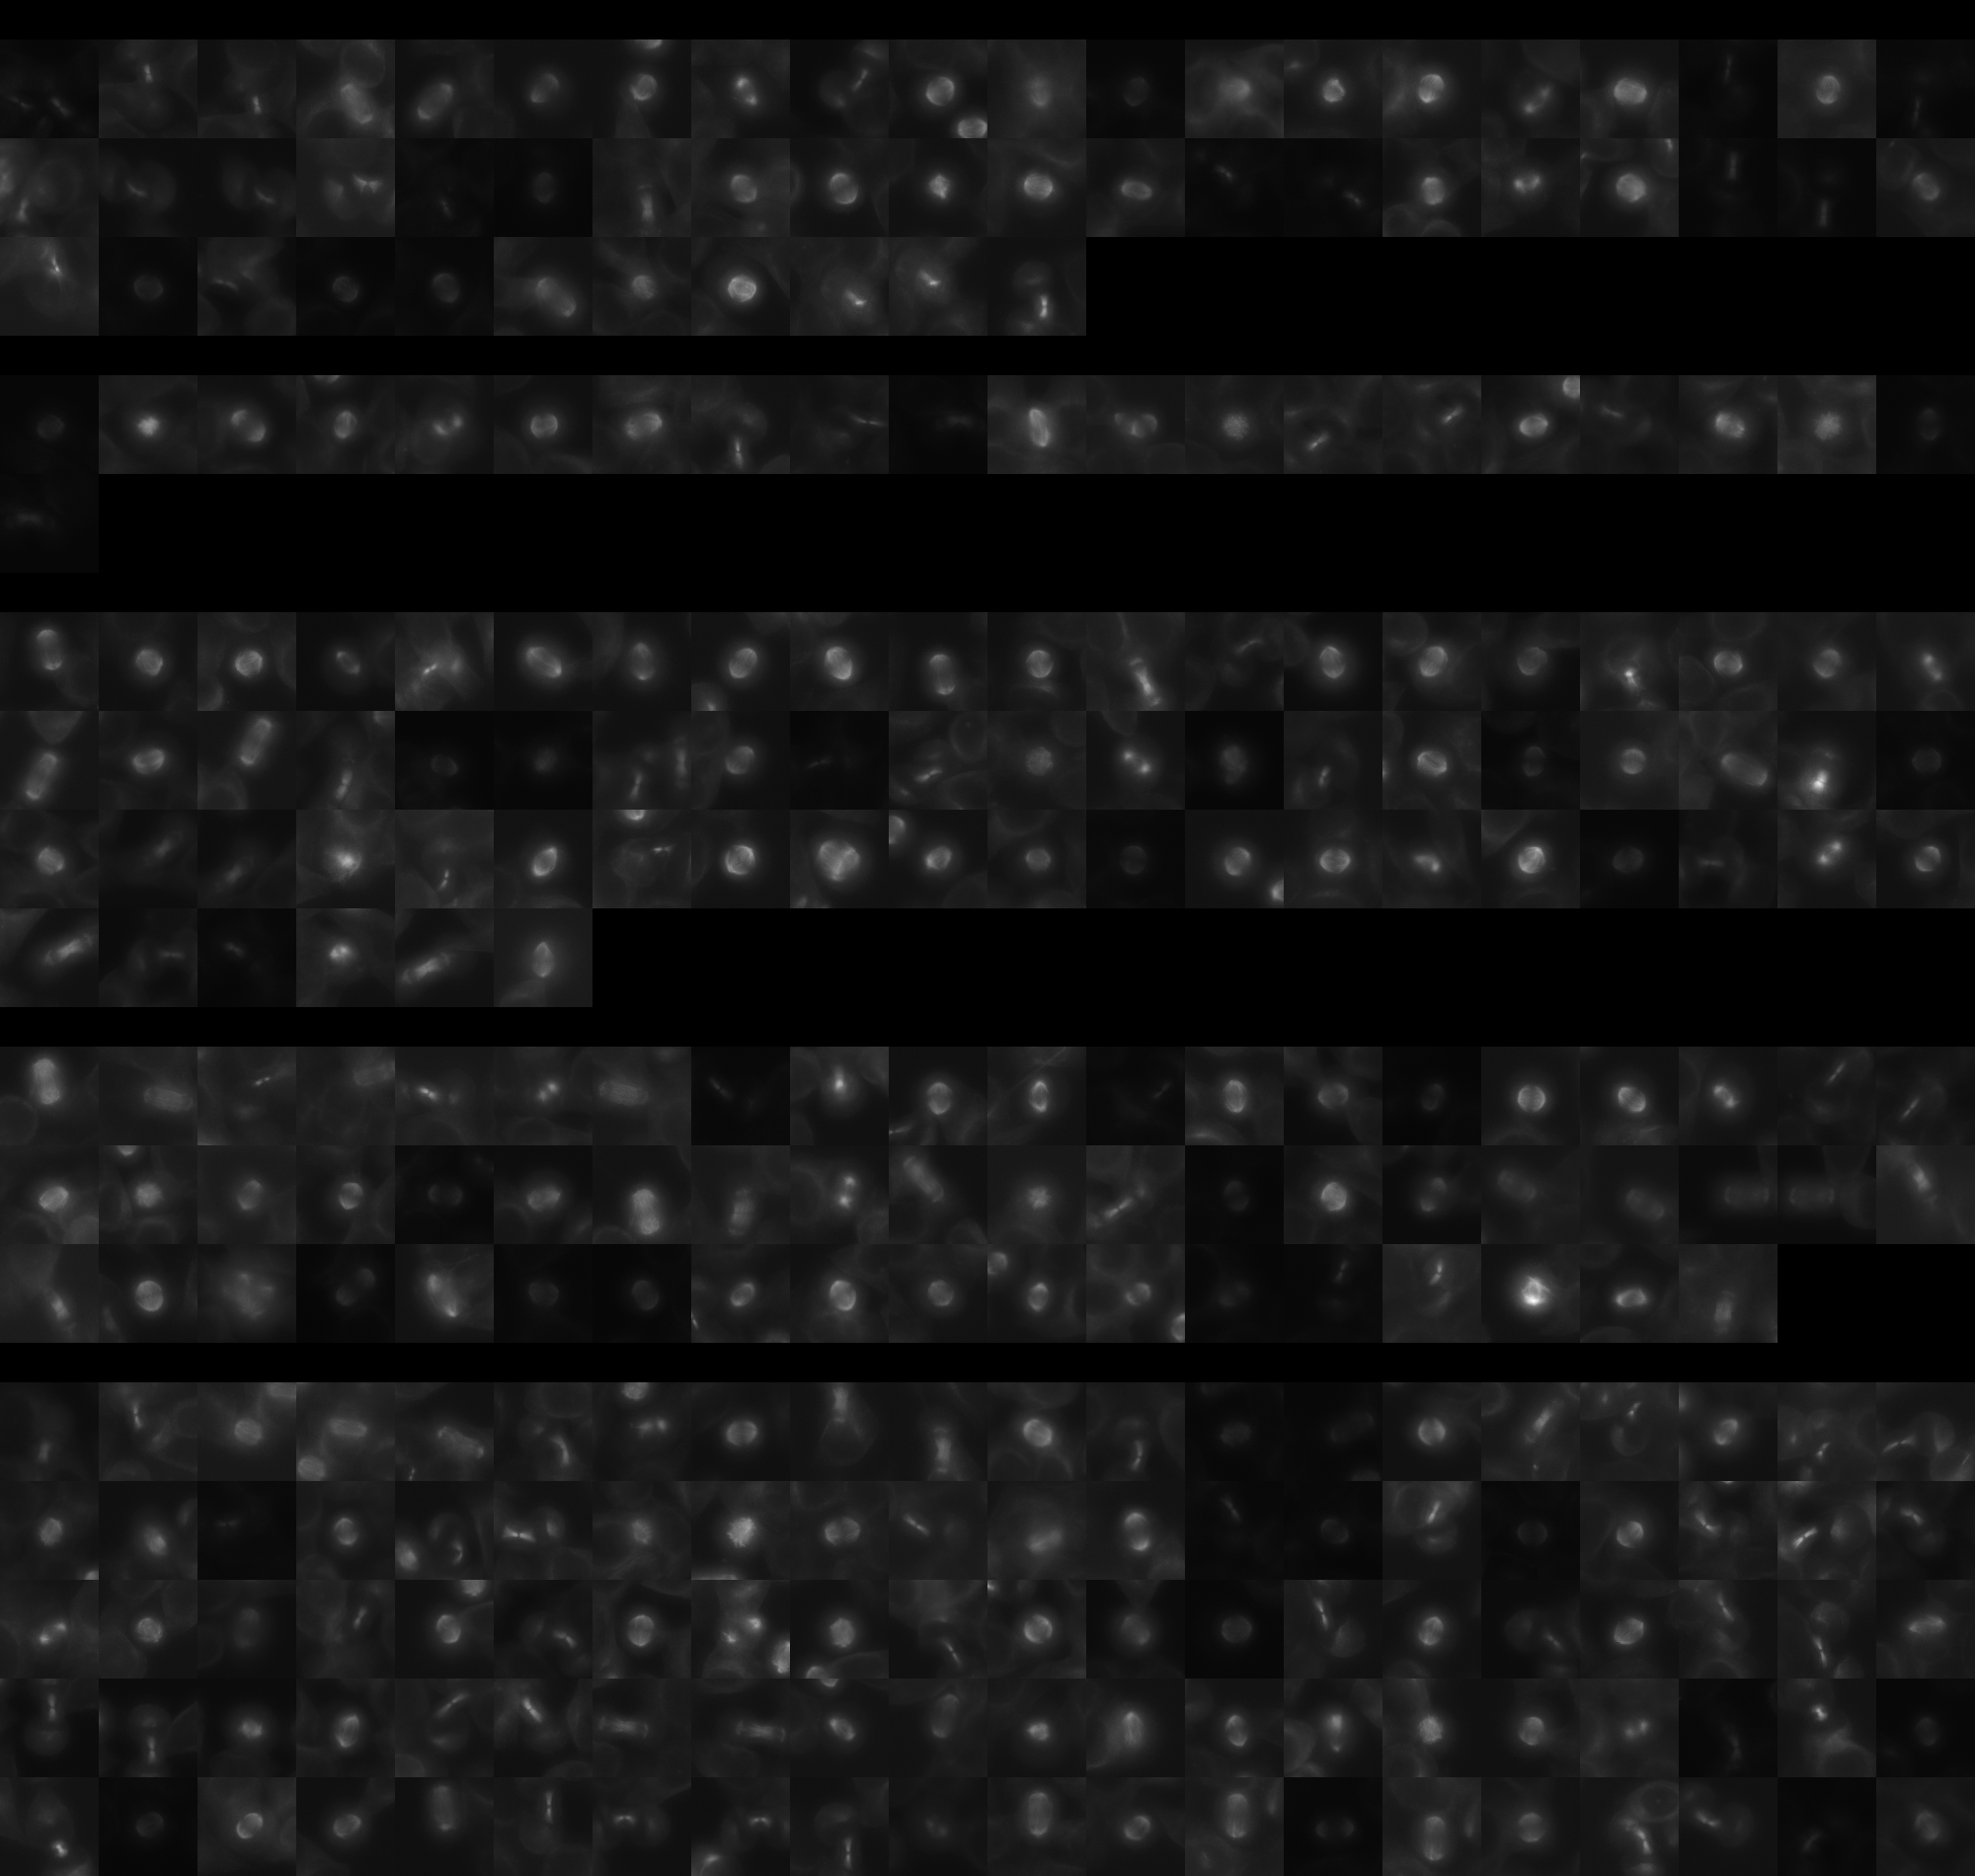
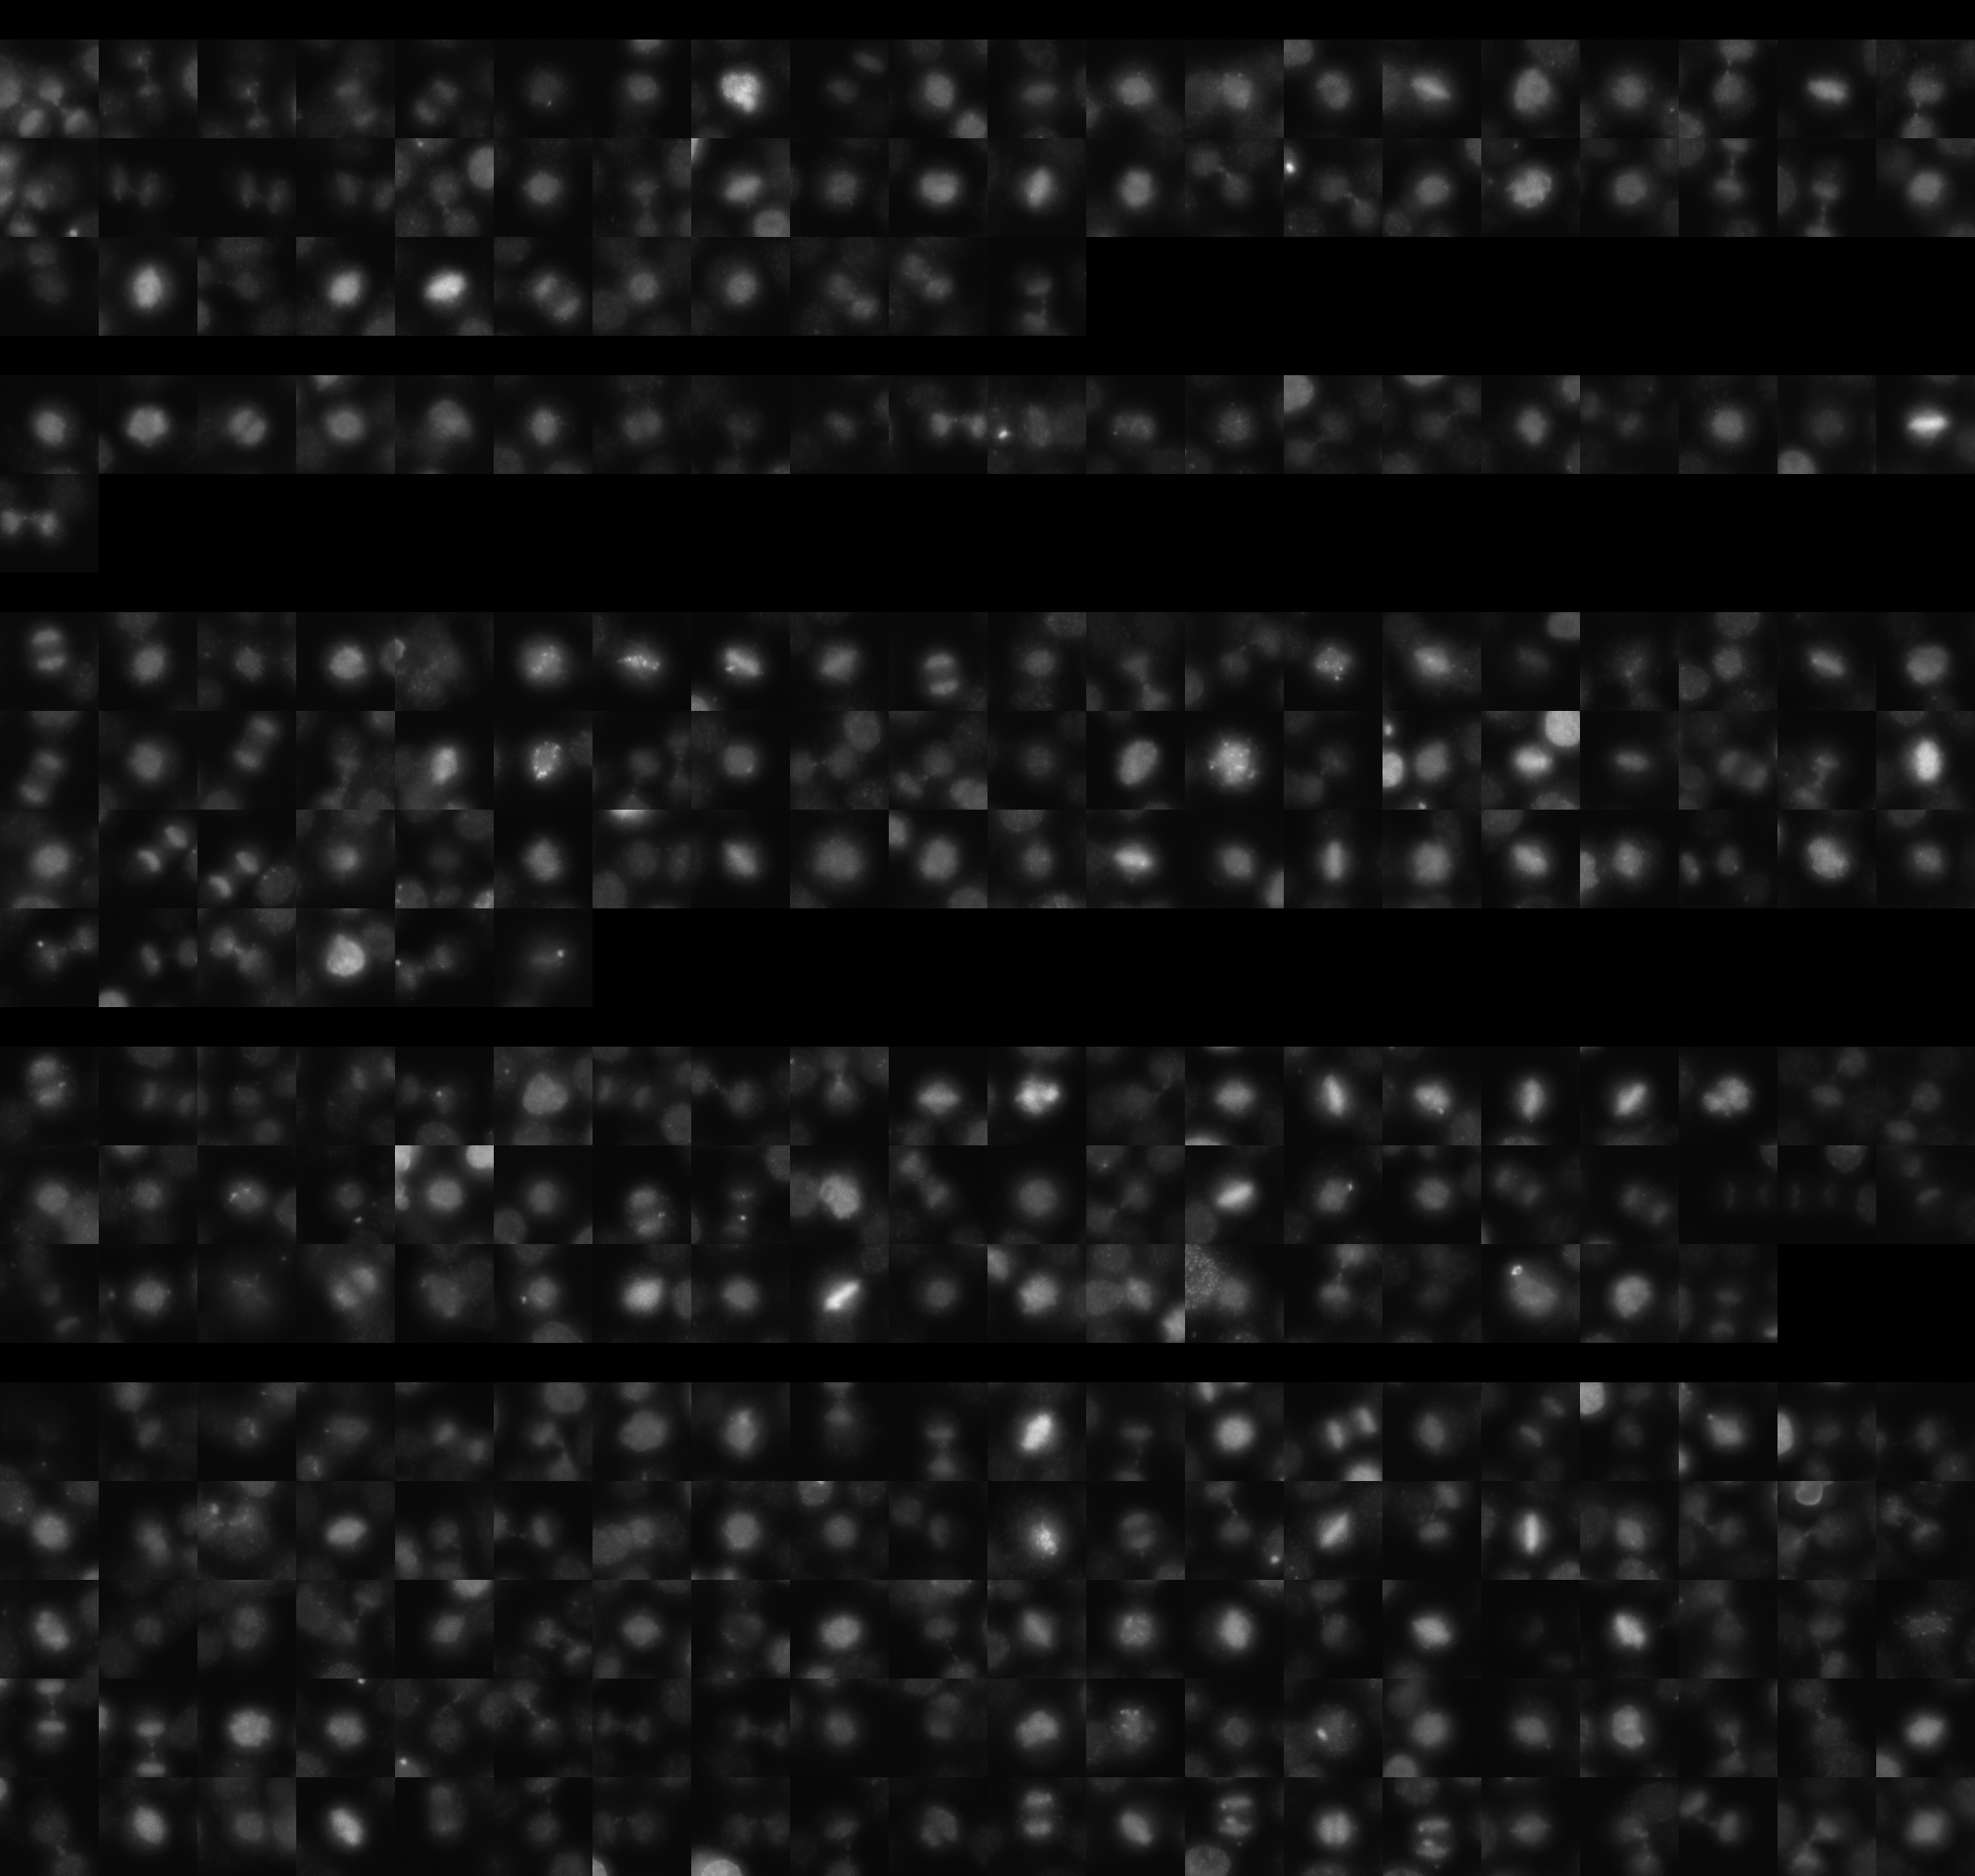
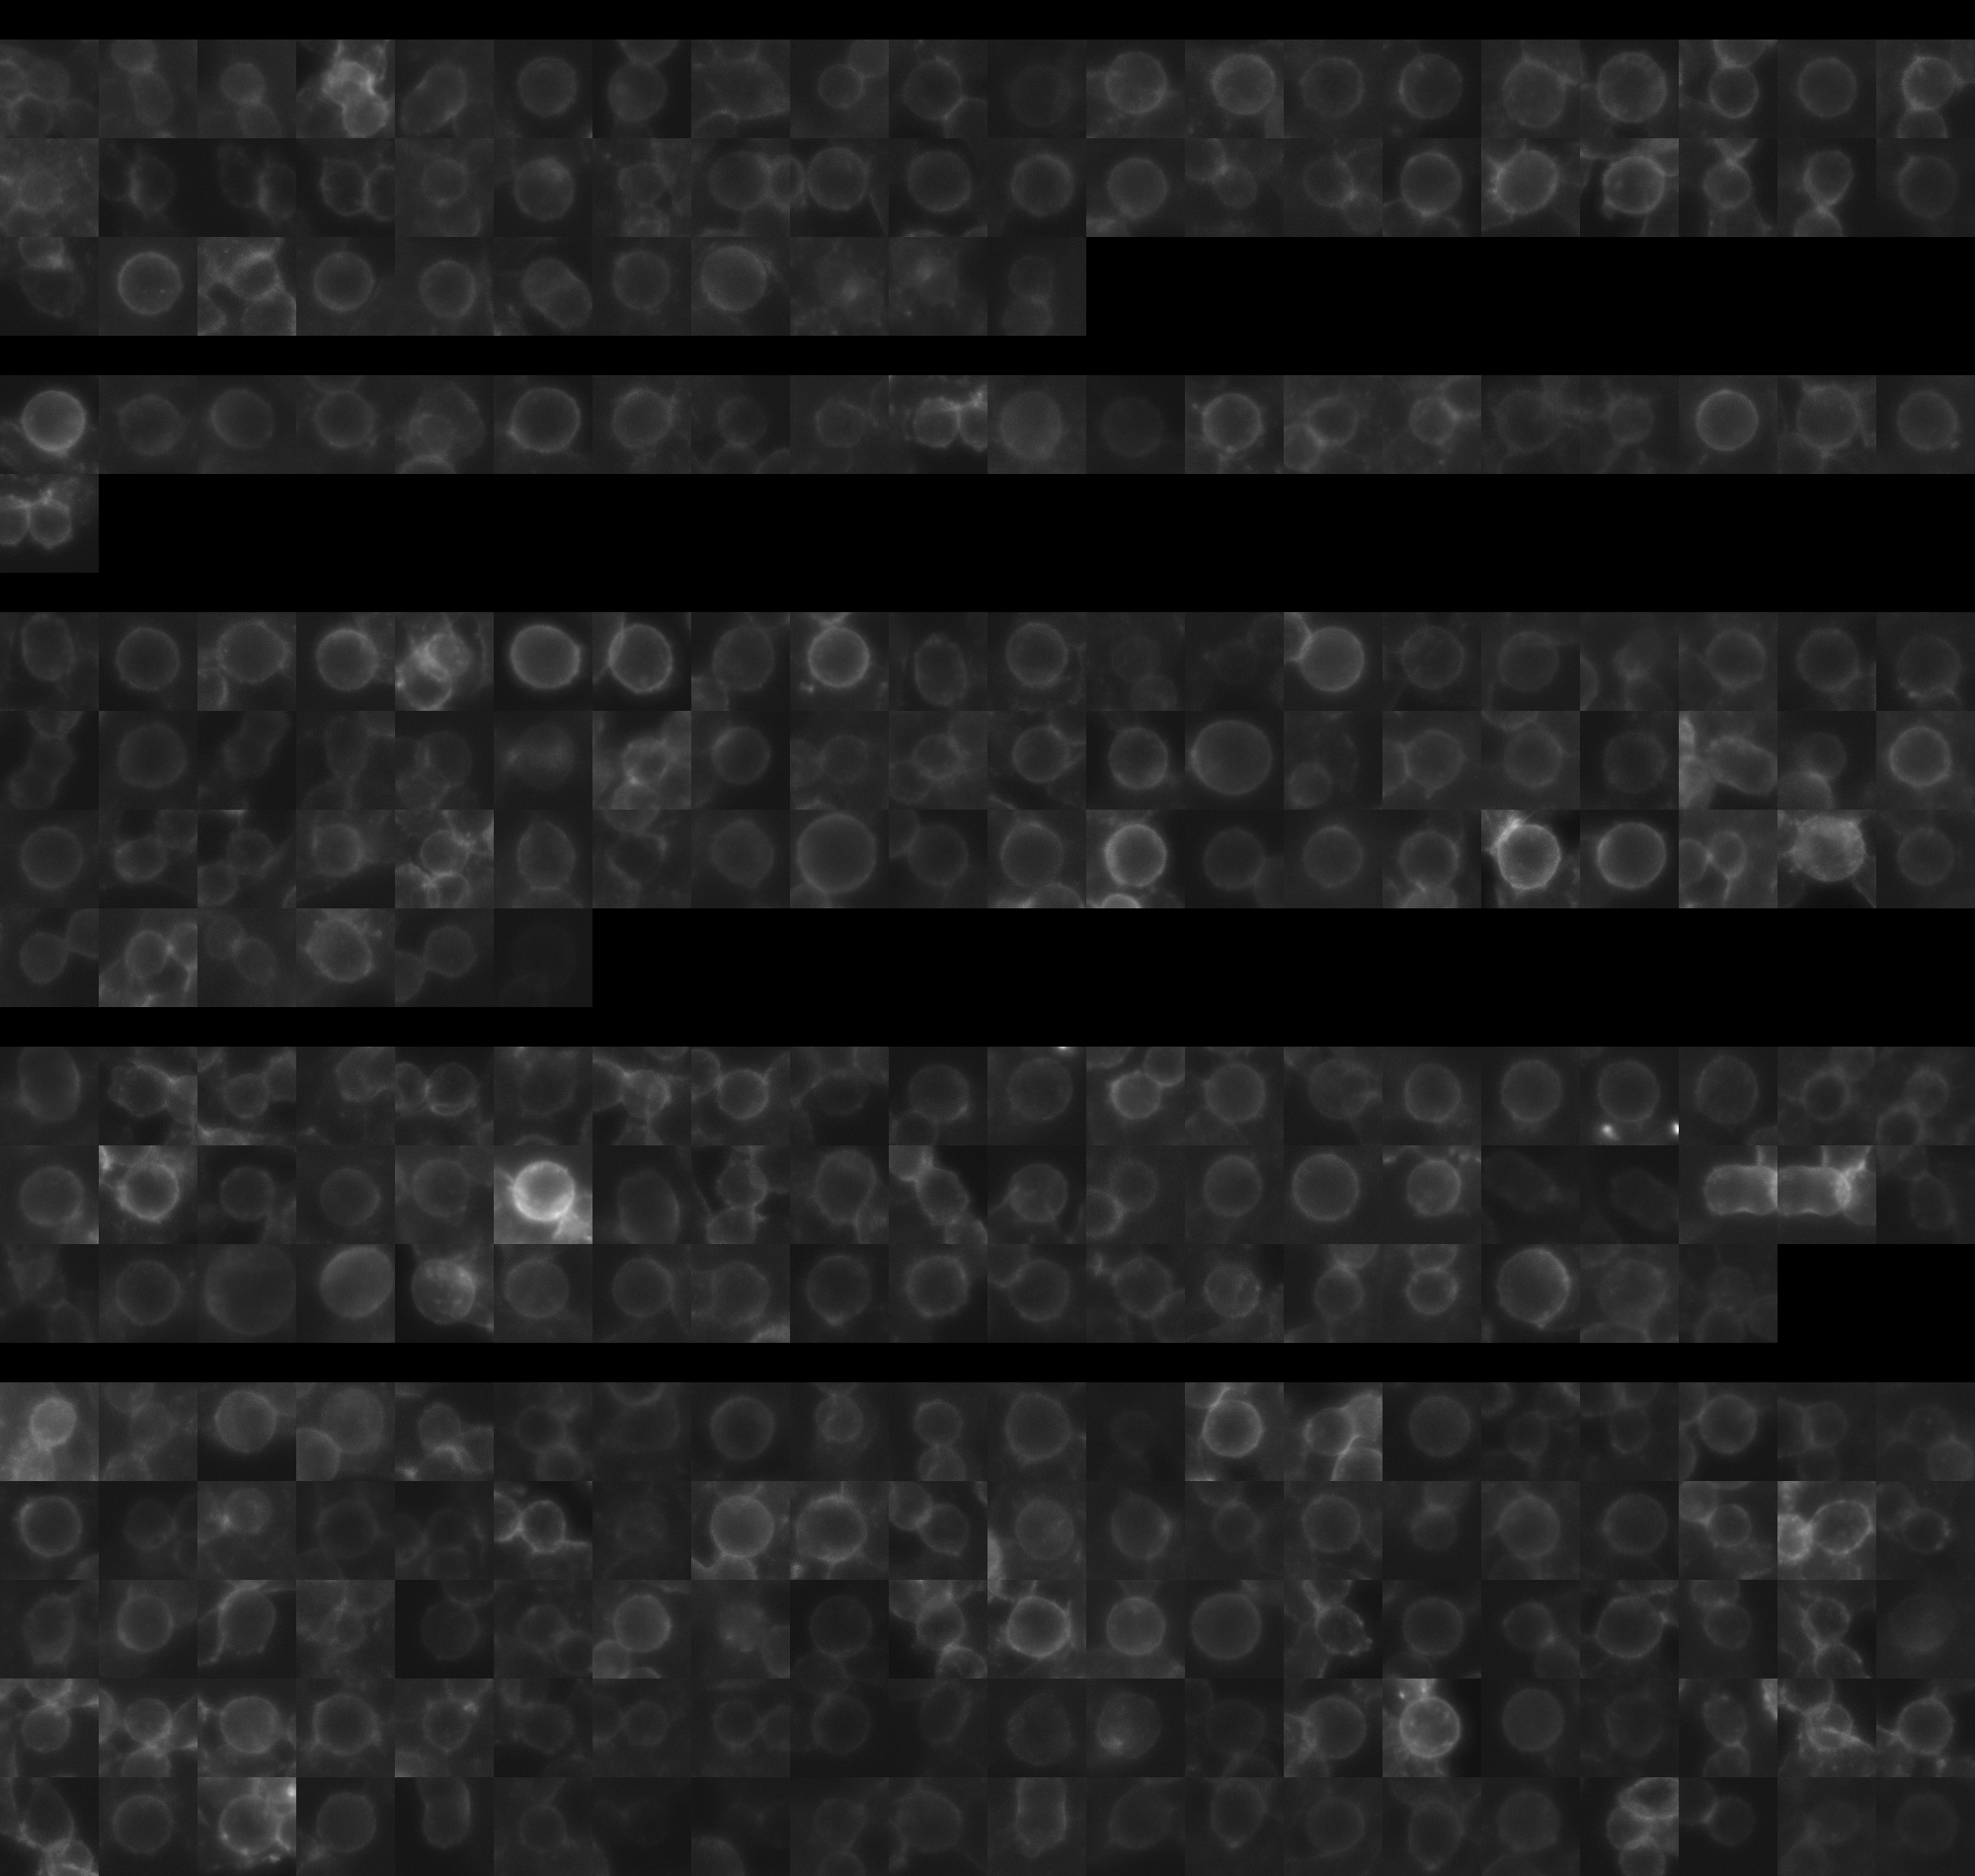
sgRNA 1: AAGAGAACGTCTGCAAAAGG (interphase cells: 2101, mitotic cells: 51)
sgRNA 2: GGGCCGCGACCGGATCCAGG (interphase cells: 775, mitotic cells: 21)
sgRNA 3: TCAGCCCGGACCCGGAGGAG (interphase cells: 2526, mitotic cells: 66)
sgRNA 4: TGCGTCCCACAAAATAGAGA (interphase cells: 2298, mitotic cells: 58)

Interphase Cluster

Mitotic Cluster

Overview

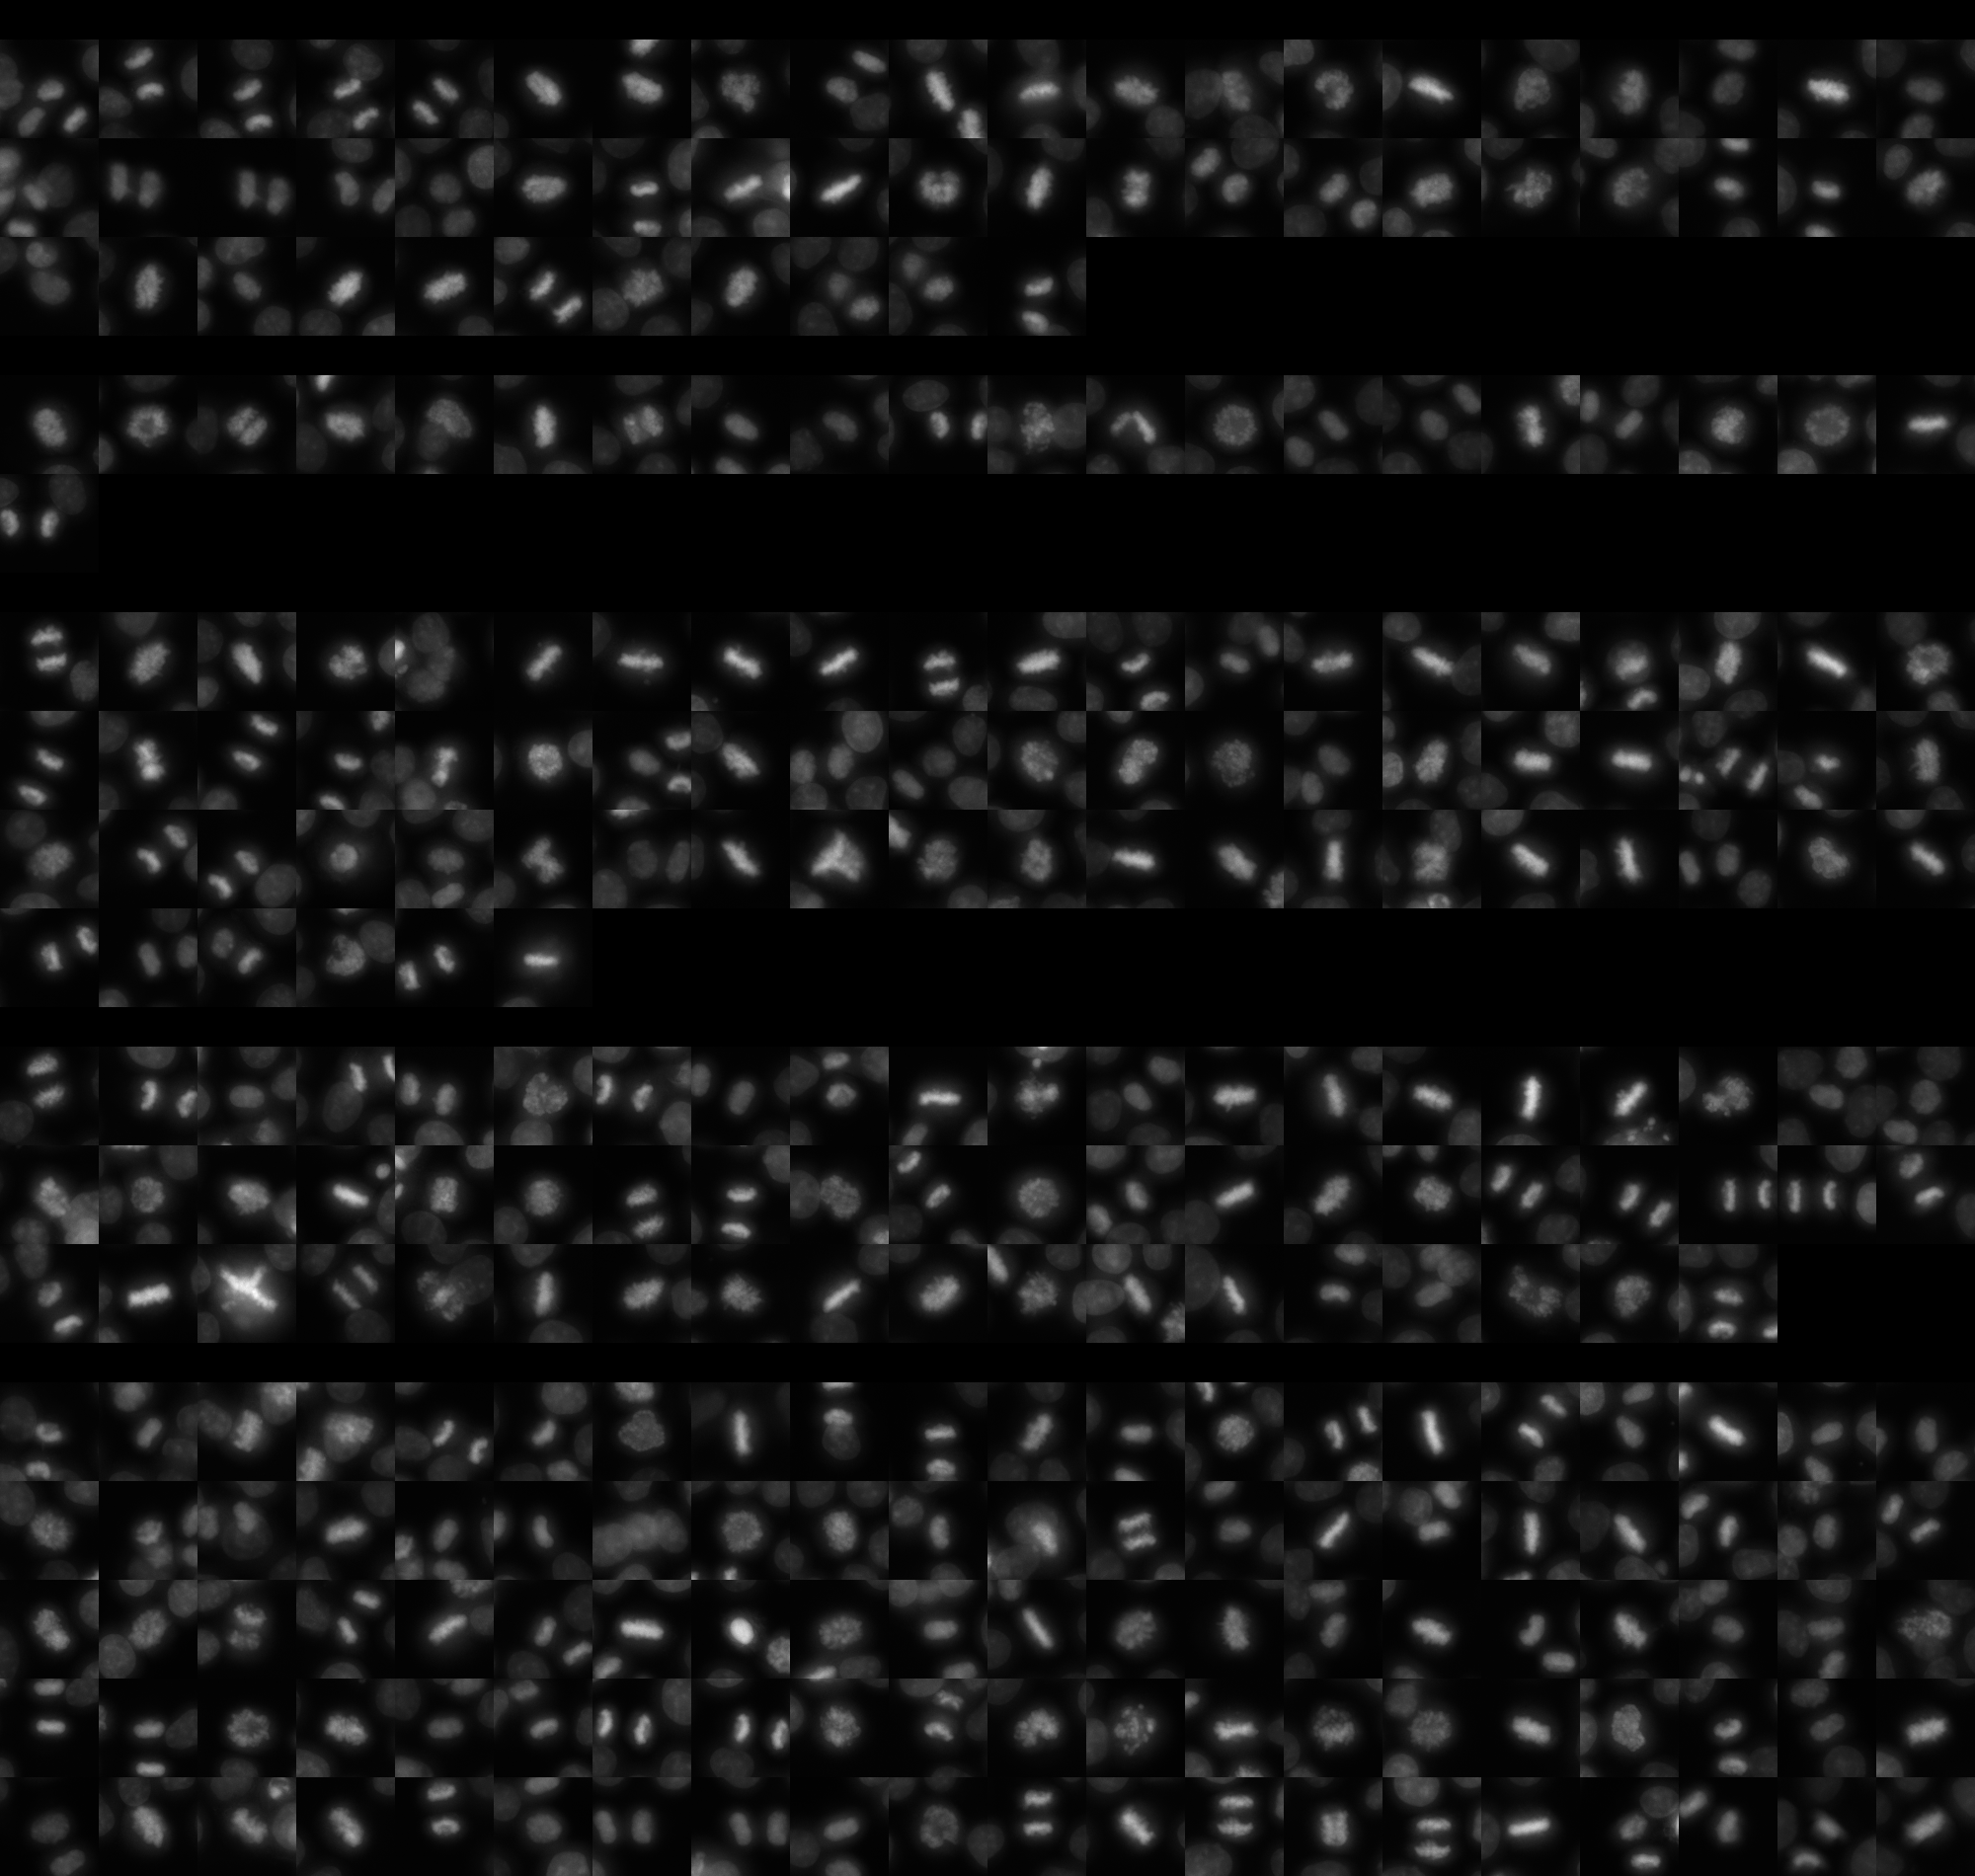
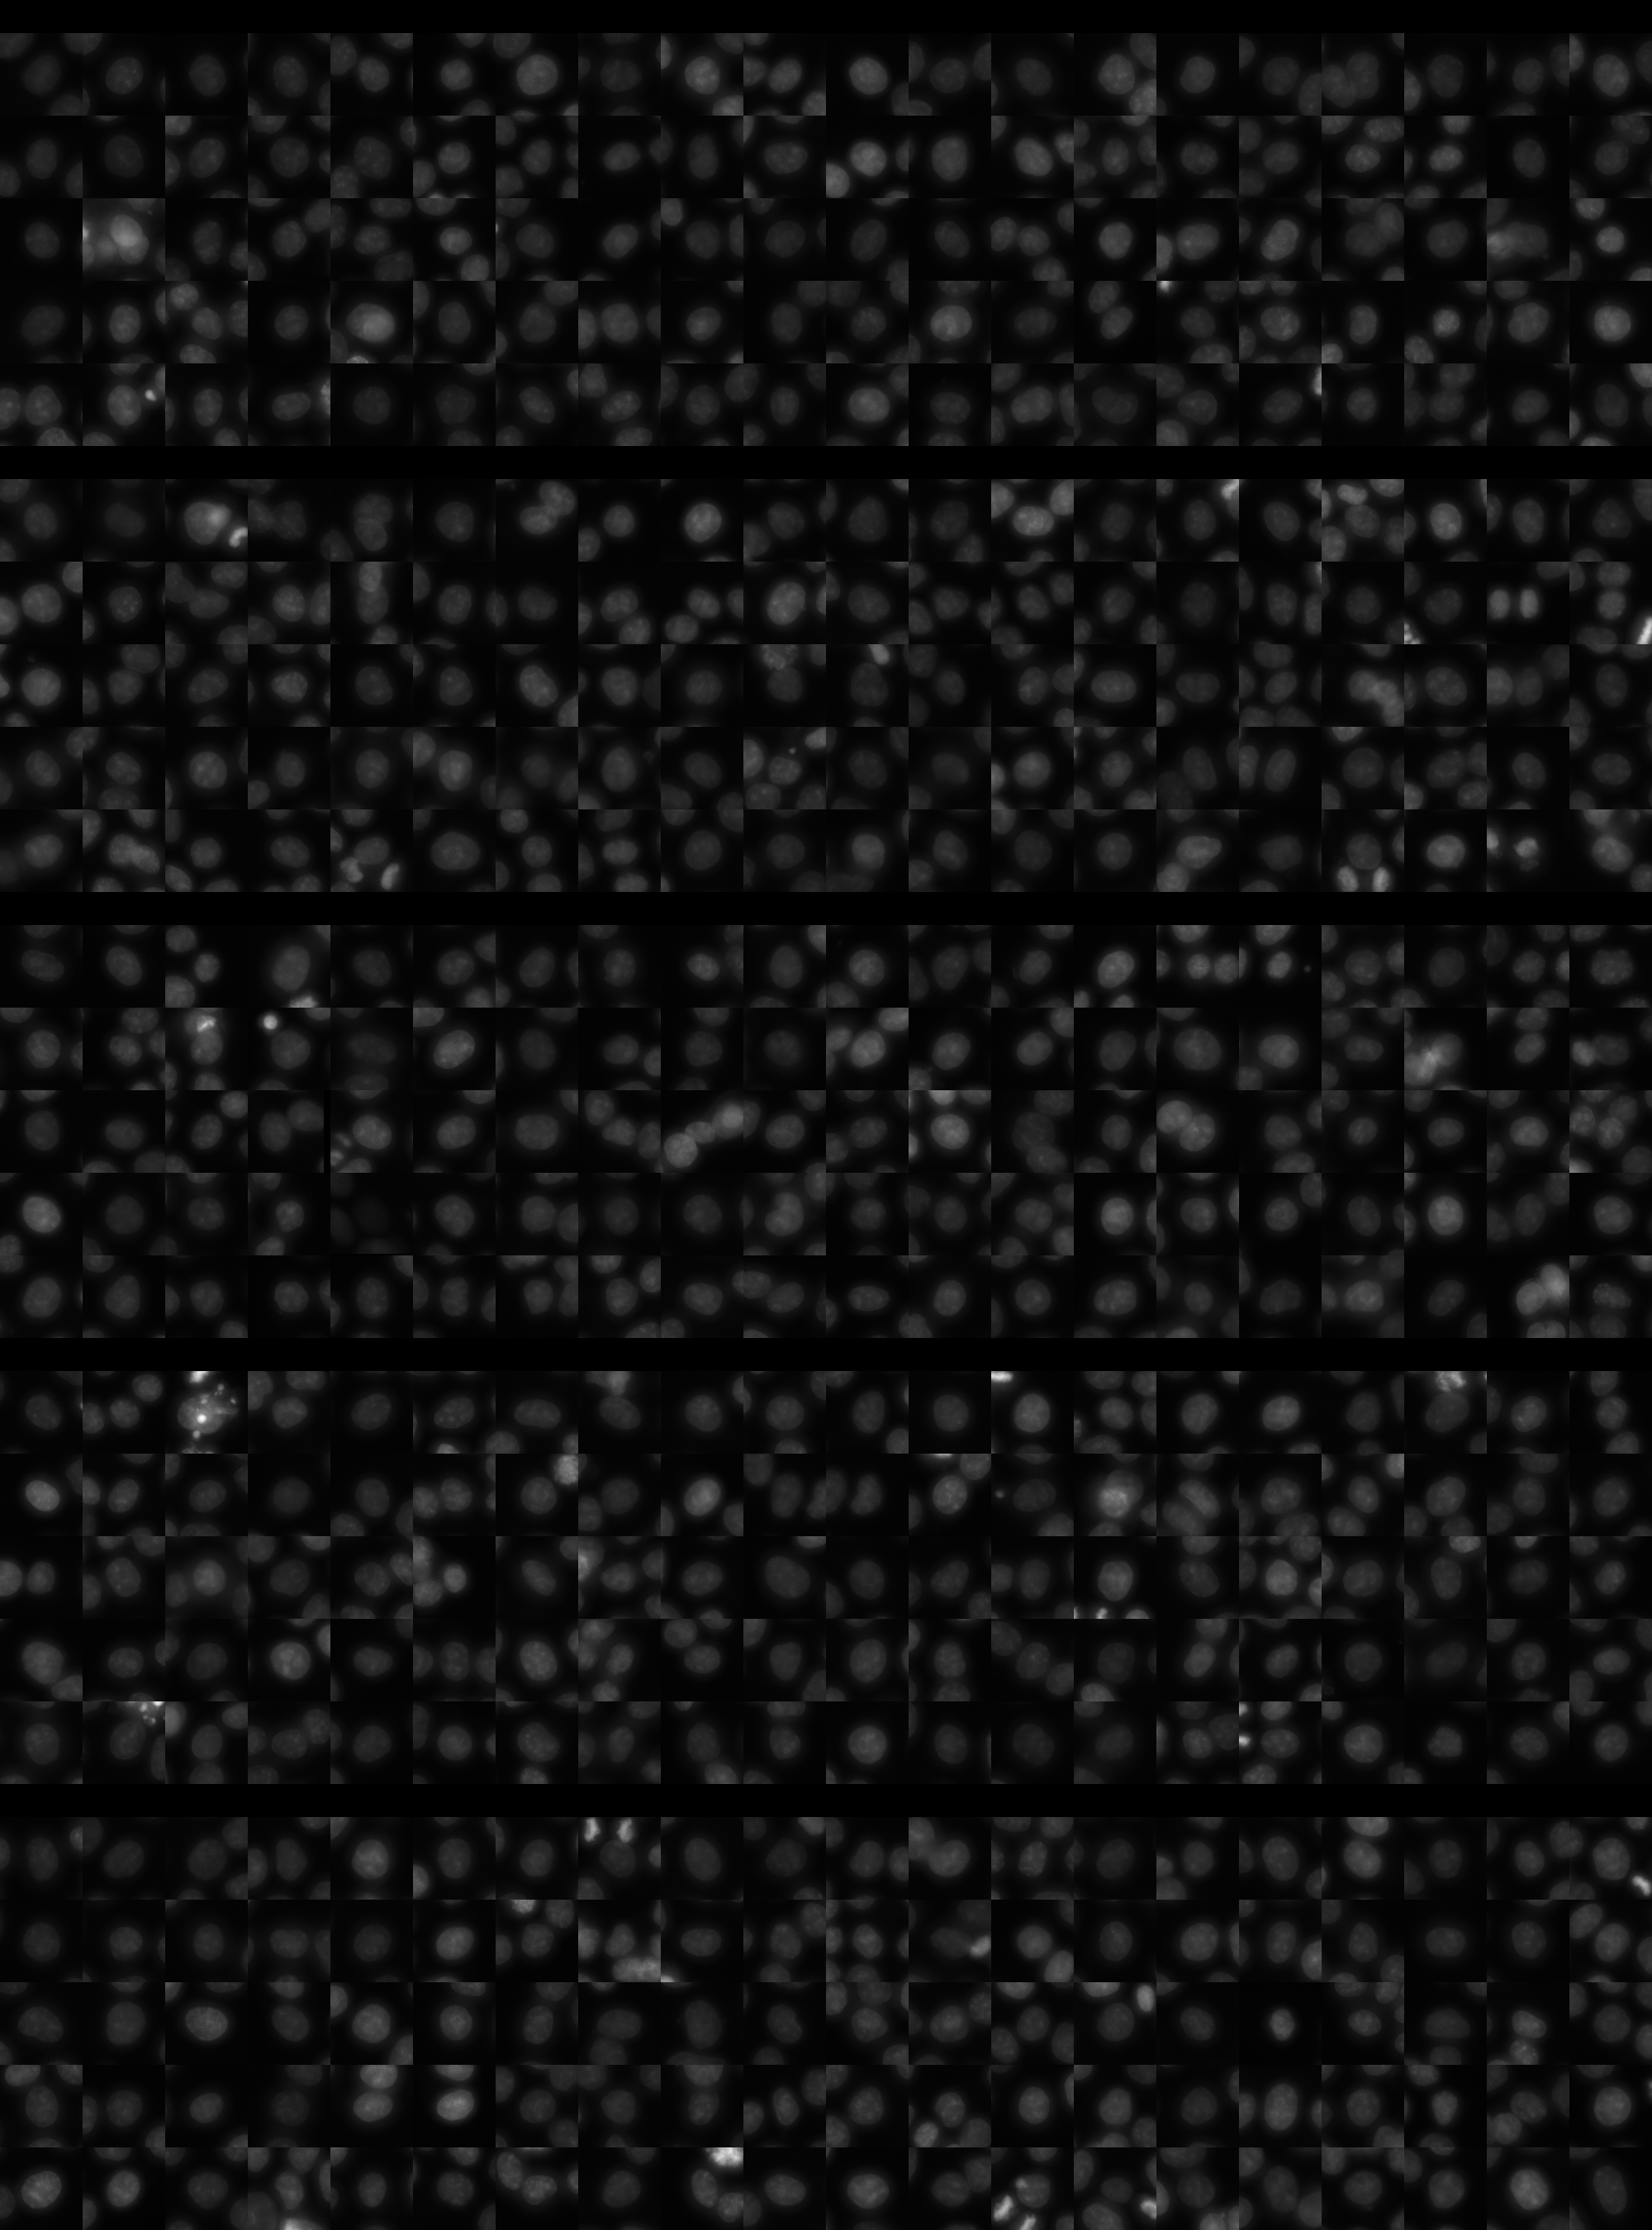
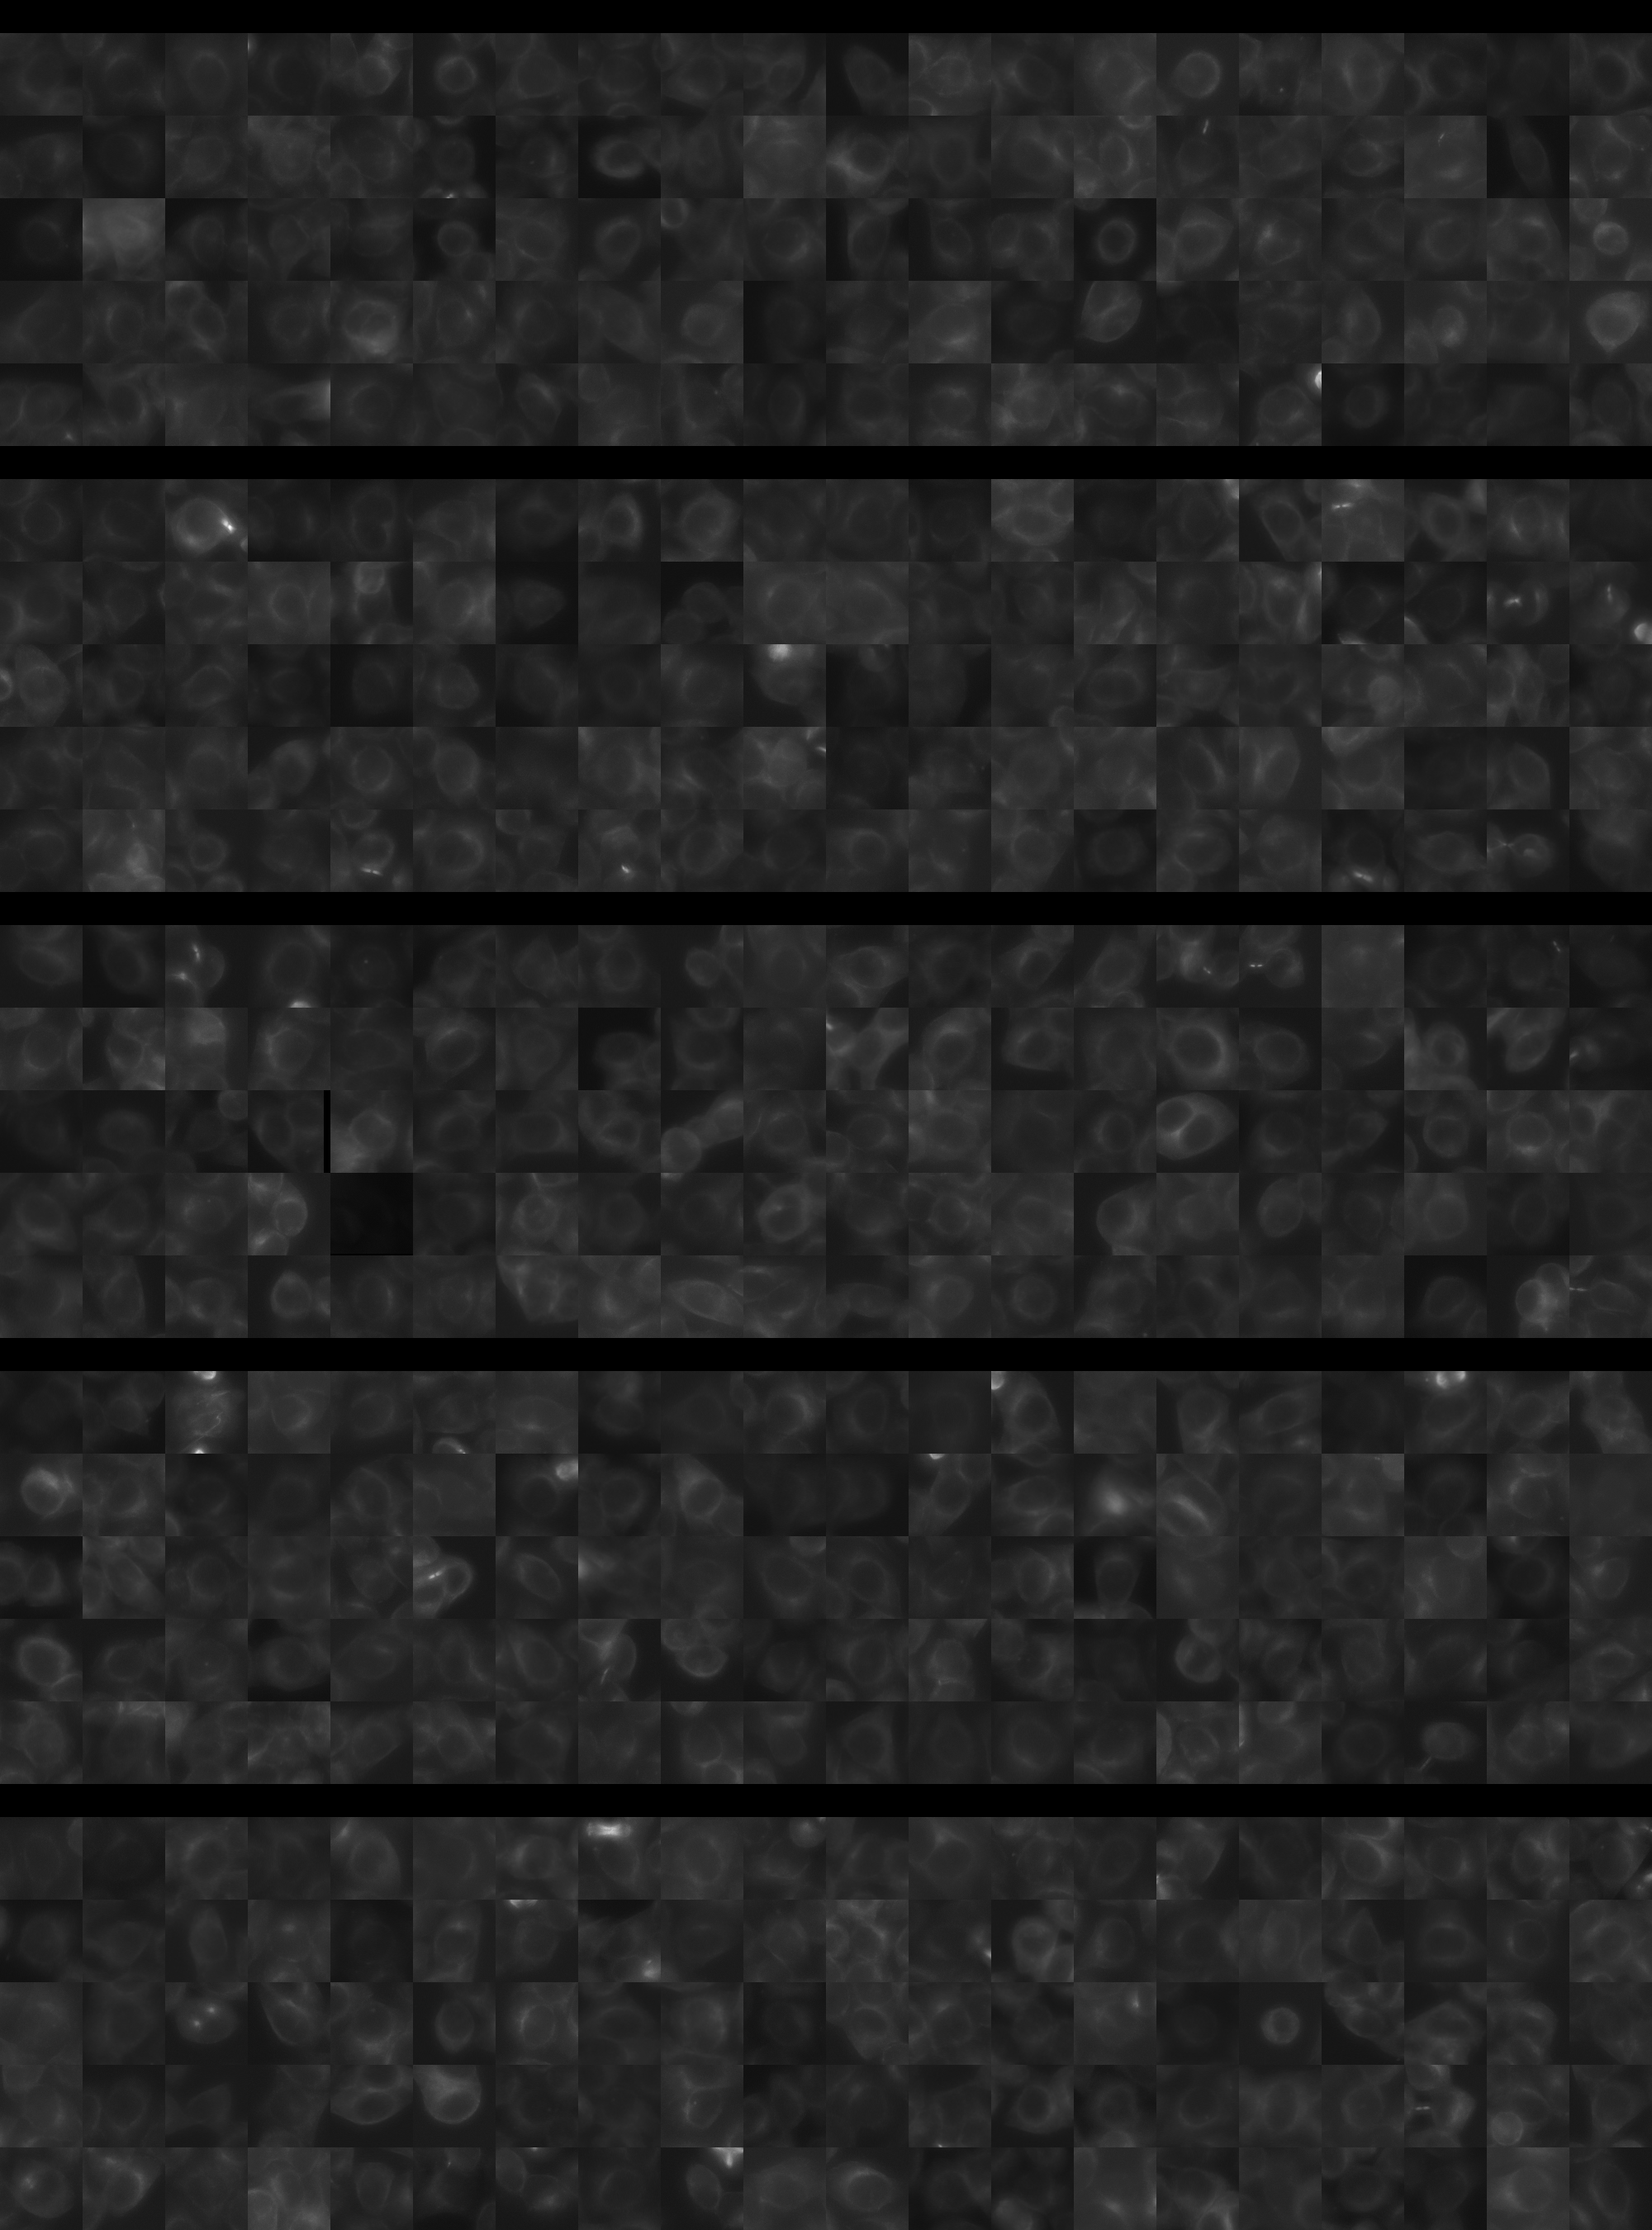
Each montage below shows randomly selected individual cell images for the same target gene separated by sgRNA, along with an example montage of cells expressing a non-targeting negative control sgRNA at the bottom. sgRNA labels in the montages correspond to the numbered sgRNA sequences in the gene info table above. The DNA (blue) and tubulin (green) channels are displayed by default, with gH2AX (grayscale) and actin (yellow) available using the check boxes. Channel brightness, contrast, and opacity are adjustable by clicking the arrow next to the channel name. When only one channel is selected, the display defaults to grayscale. Click the “Zoom” checkbox above the channel controls to enable image zooming (via scrolling) and panning (via click-and-drag).

The cell boxes displayed for this gene are square, 30.36 μm per side for the interphase montage and 30.36 μm per side for the mitotic montage.
Features

Interphase Score Rank FDR q-value
Nucleus DNA Integrated 0.027 1806 of 5322 0.737
Nucleus DNA Mean 0.033 1095 of 5322 0.409
Nucleus gH2AX Mean 0.100 1960 of 5322 0.011
Nucleus DNA - gH2AX Correlation -2.700e-02 1627 of 5322 0.333
Nucleus Shape Area -3.012e-02 4136 of 5322 0.469
Nucleus Shape Eccentricity -6.243e-02 4932 of 5322 0.074
Nucleus Shape Form Factor 0.014 381 of 5322 0.609
Nucleus Shape Solidity 0.008 451 of 5322 0.793
Cell DNA Mass Displacement 0.027 2509 of 5322 0.668
Cell Tubulin Mean 0.048 1169 of 5322 0.235
Cell Tubulin Mass Displacement -2.490e-02 4213 of 5322 0.671
Cell Actin Mean 0.033 1990 of 5322 0.524
Cell Tubulin - Actin Correlation 0.011 3200 of 5322 0.824
Cell DNA - Tubulin Correlation 0.036 2379 of 5322 0.349
Cell Shape Area -2.313e-02 3883 of 5322 0.581
Cell Shape Eccentricity 0.009 2999 of 5322 0.926
Mitotic Score Rank FDR q-value
Nucleus DNA Integrated 0.087 2674 of 5322 0.965
Nucleus DNA Mean -2.695e-02 3391 of 5322 1.000
Nucleus DNA Mass Displacement -1.549e-01 5060 of 5322 0.999
Nucleus DNA Mean Frac 3 -1.886e-02 3411 of 5322 1.000
Nucleus gH2AX Mean 0.163 1011 of 5322 1.000
Nucleus gH2AX Mean Frac 0 0.067 1316 of 5322 1.000
Nucleus Tubulin Mean Frac 0 0.067 2471 of 5322 0.999
Nucleus Tubulin Mean Edge 0.187 916 of 5322 0.996
Nucleus Tubulin Std Edge 0.223 362 of 5322 0.999
Nucleus Shape Area 0.129 2257 of 5322 0.989
Nucleus Shape Eccentricity -7.588e-02 3251 of 5322 1.000
Nucleus Shape Form Factor 0.024 1088 of 5322 0.998
Cell Tubulin Mean 0.110 1914 of 5322 0.997
Cell Tubulin Mean Frac 3 -4.762e-02 2275 of 5322 0.999
Cell Actin Mean 0.132 1474 of 5322 0.997
Cell Shape Area 0.094 2699 of 5322 0.998
( Reset Zoom )
Brightness
Contrast
Opacity
Brightness
Contrast
Opacity
Brightness
Contrast
Opacity
Brightness
Contrast
Opacity
Brightness
Contrast
Opacity

( Reset Zoom )
Brightness
Contrast
Opacity
Brightness
Contrast
Opacity
Brightness
Contrast
Opacity
Brightness
Contrast
Opacity
Brightness
Contrast
Opacity

MIT Central Accessability