ACAD8

Gene symbol: ACAD8
Gene: 27034
Uniprot Function: Isobutyryl-CoA dehydrogenase which catalyzes one of the steps of the valine catabolic pathway (PubMed:11013134, PubMed:12359132, PubMed:16857760). To a lesser extent, is also able to catalyze the oxidation of (2S)-2-methylbutanoyl-CoA (PubMed:11013134, PubMed:12359132).
Mitotic Index 0.0229
Interphase Cluster: #152 (19 genes)
Mitotic Cluster: #169 (16 genes)
sgRNA 1: GAGCTGCGGCGGCTATGCTG (interphase cells: 179, mitotic cells: 4)
sgRNA 2: TATGGCAGAGTGGGACCAGA (interphase cells: 1402, mitotic cells: 31)
sgRNA 3: TCAGTCCTCTCACGGCAATG (interphase cells: 4709, mitotic cells: 115)
sgRNA 4: TCGAAGATCACAGCTCGTGT (interphase cells: 788, mitotic cells: 16)

Interphase Cluster

Mitotic Cluster

Overview

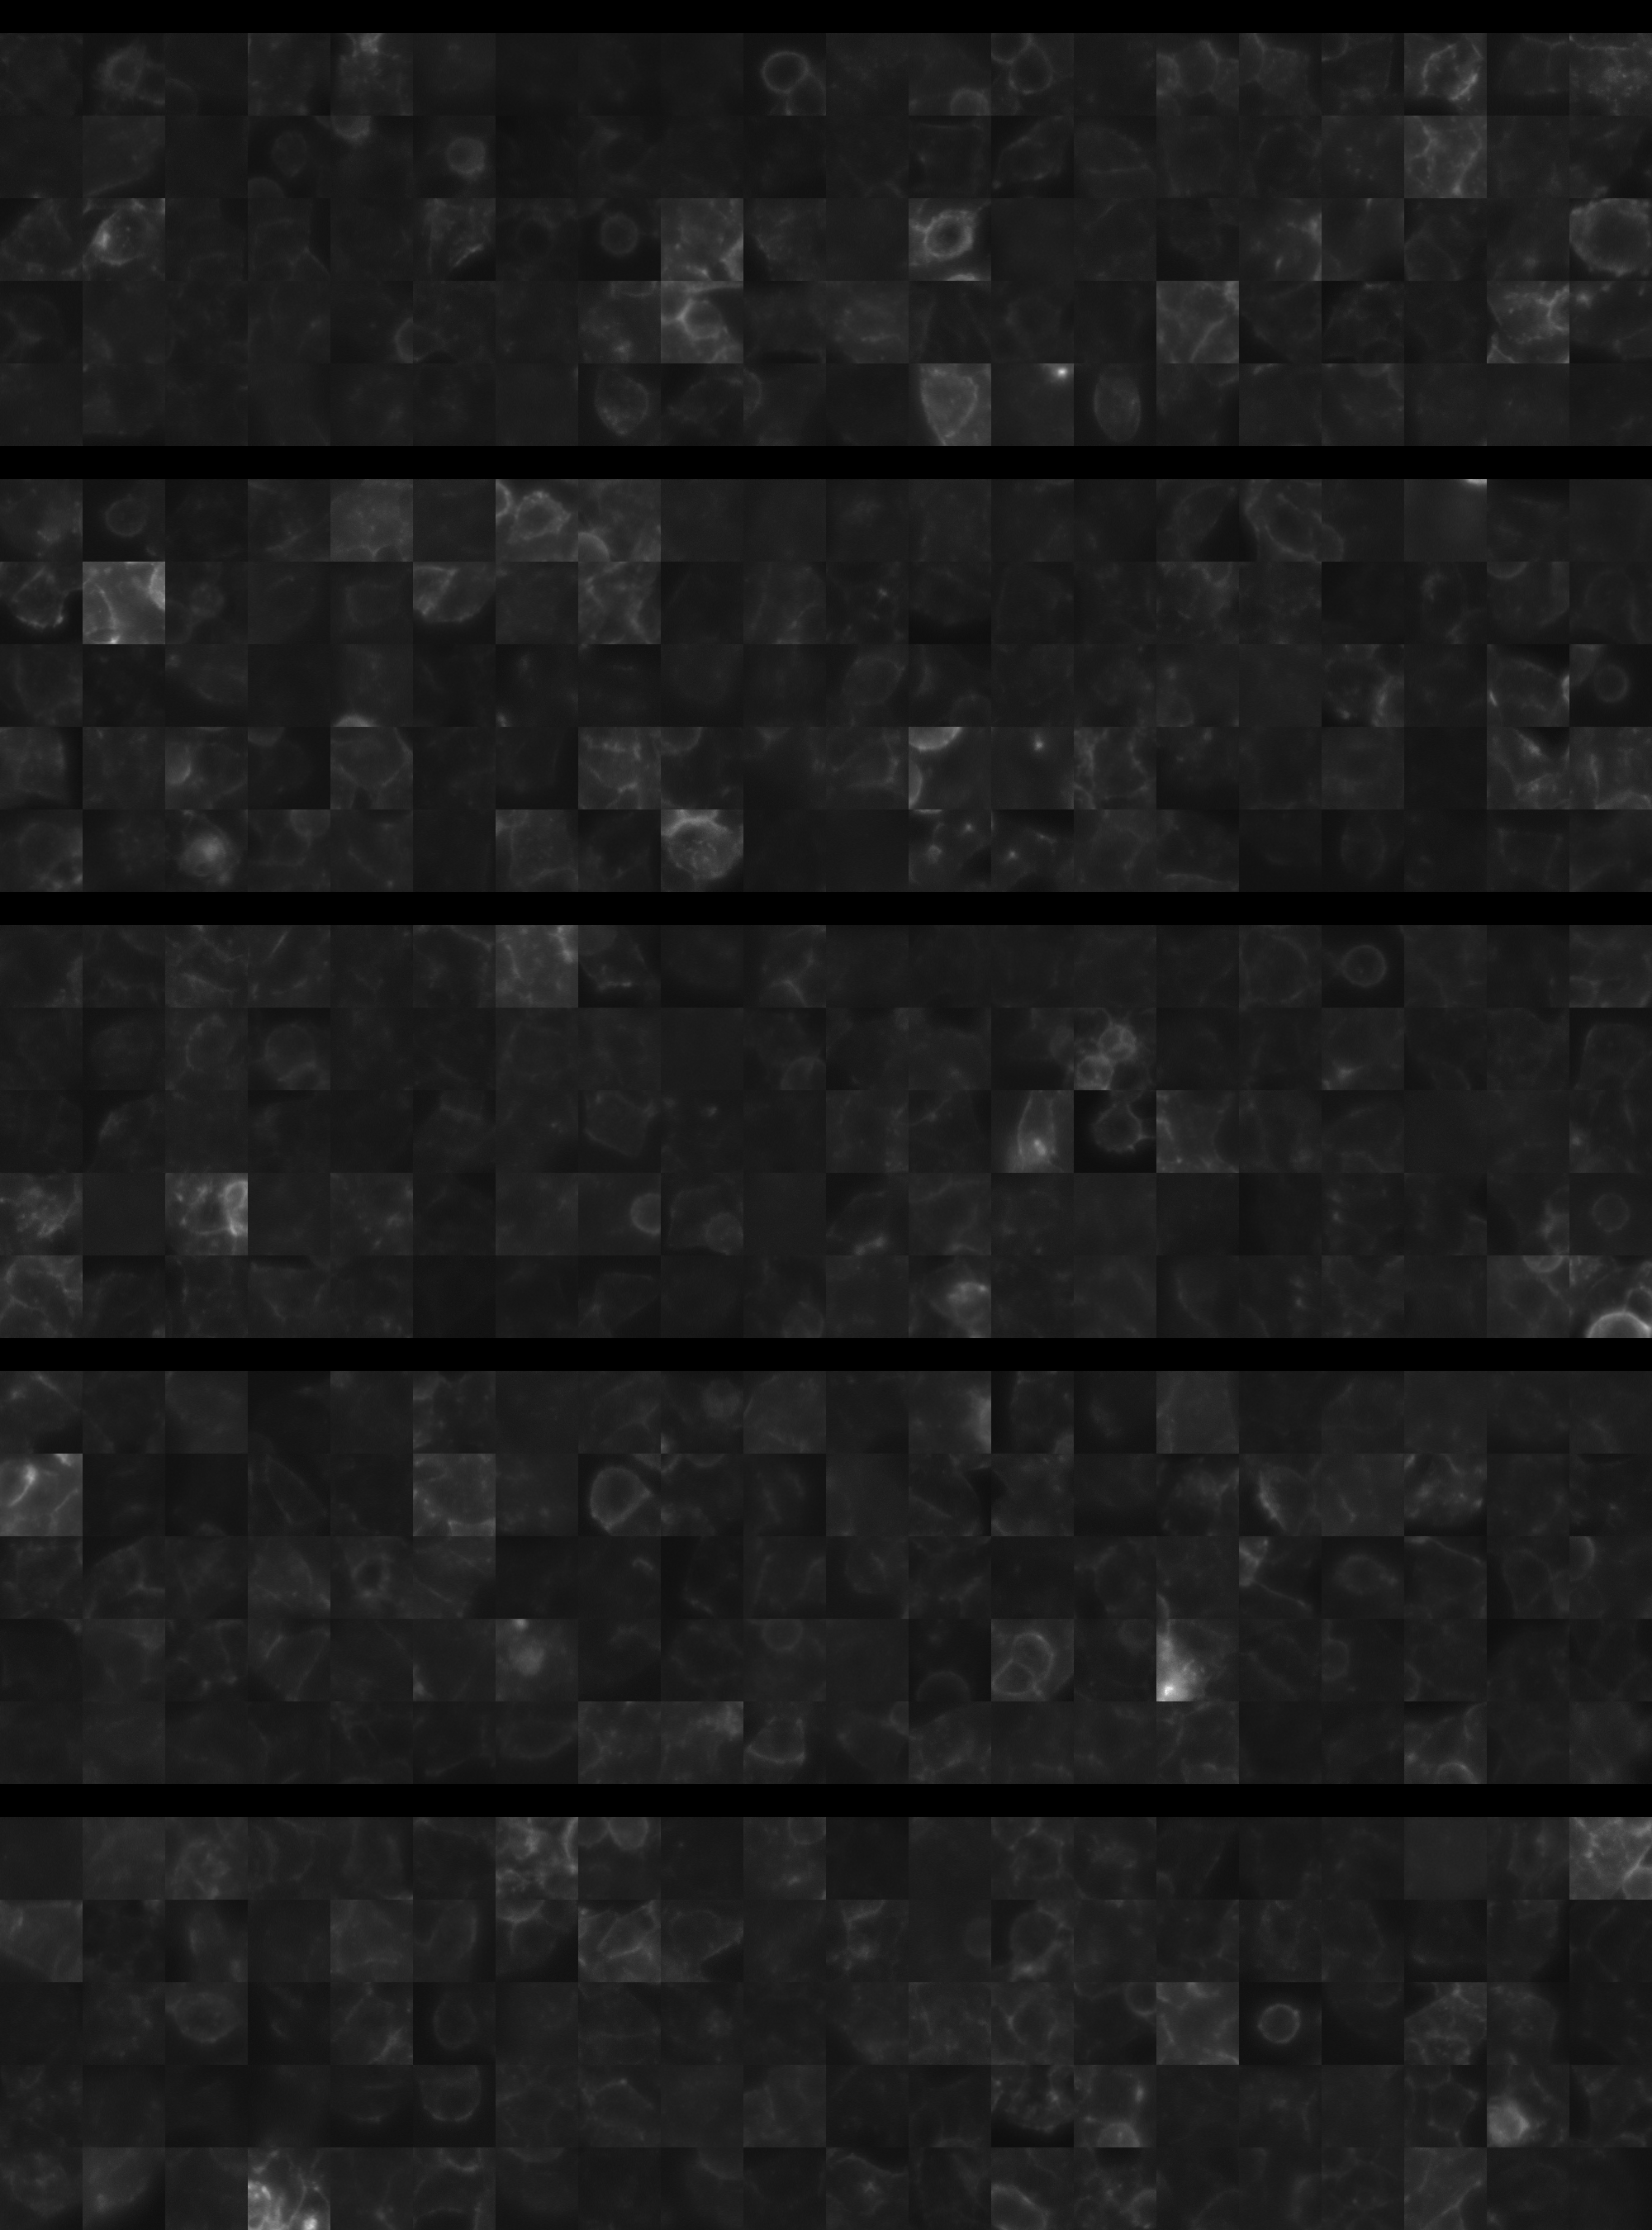
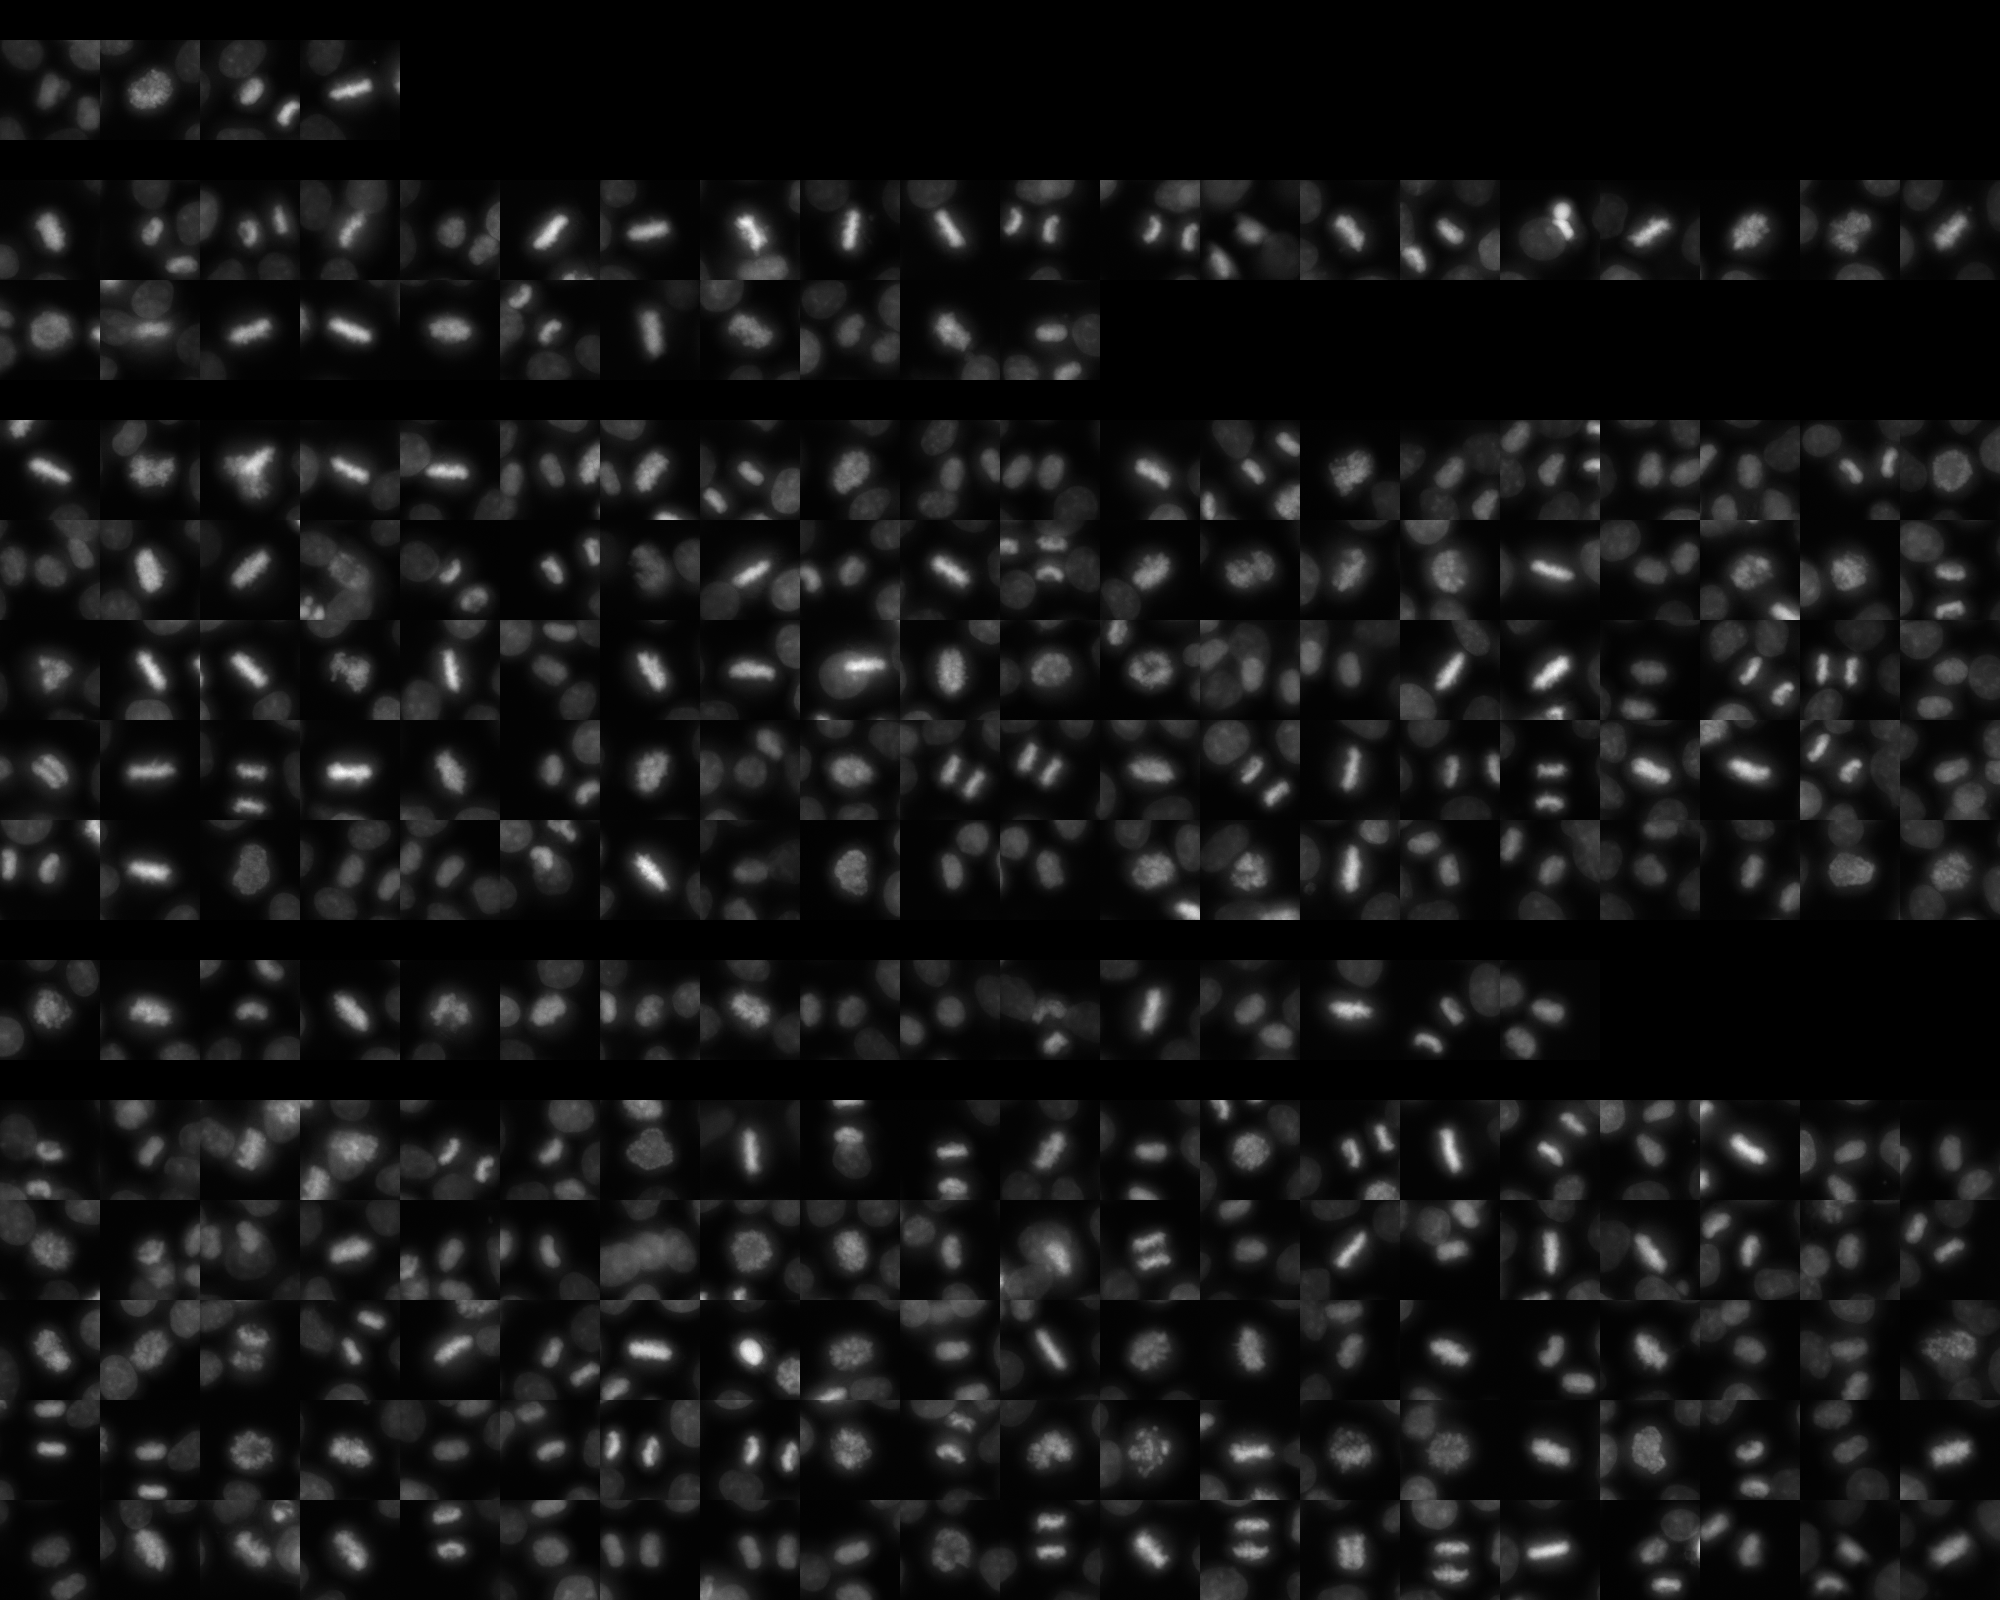
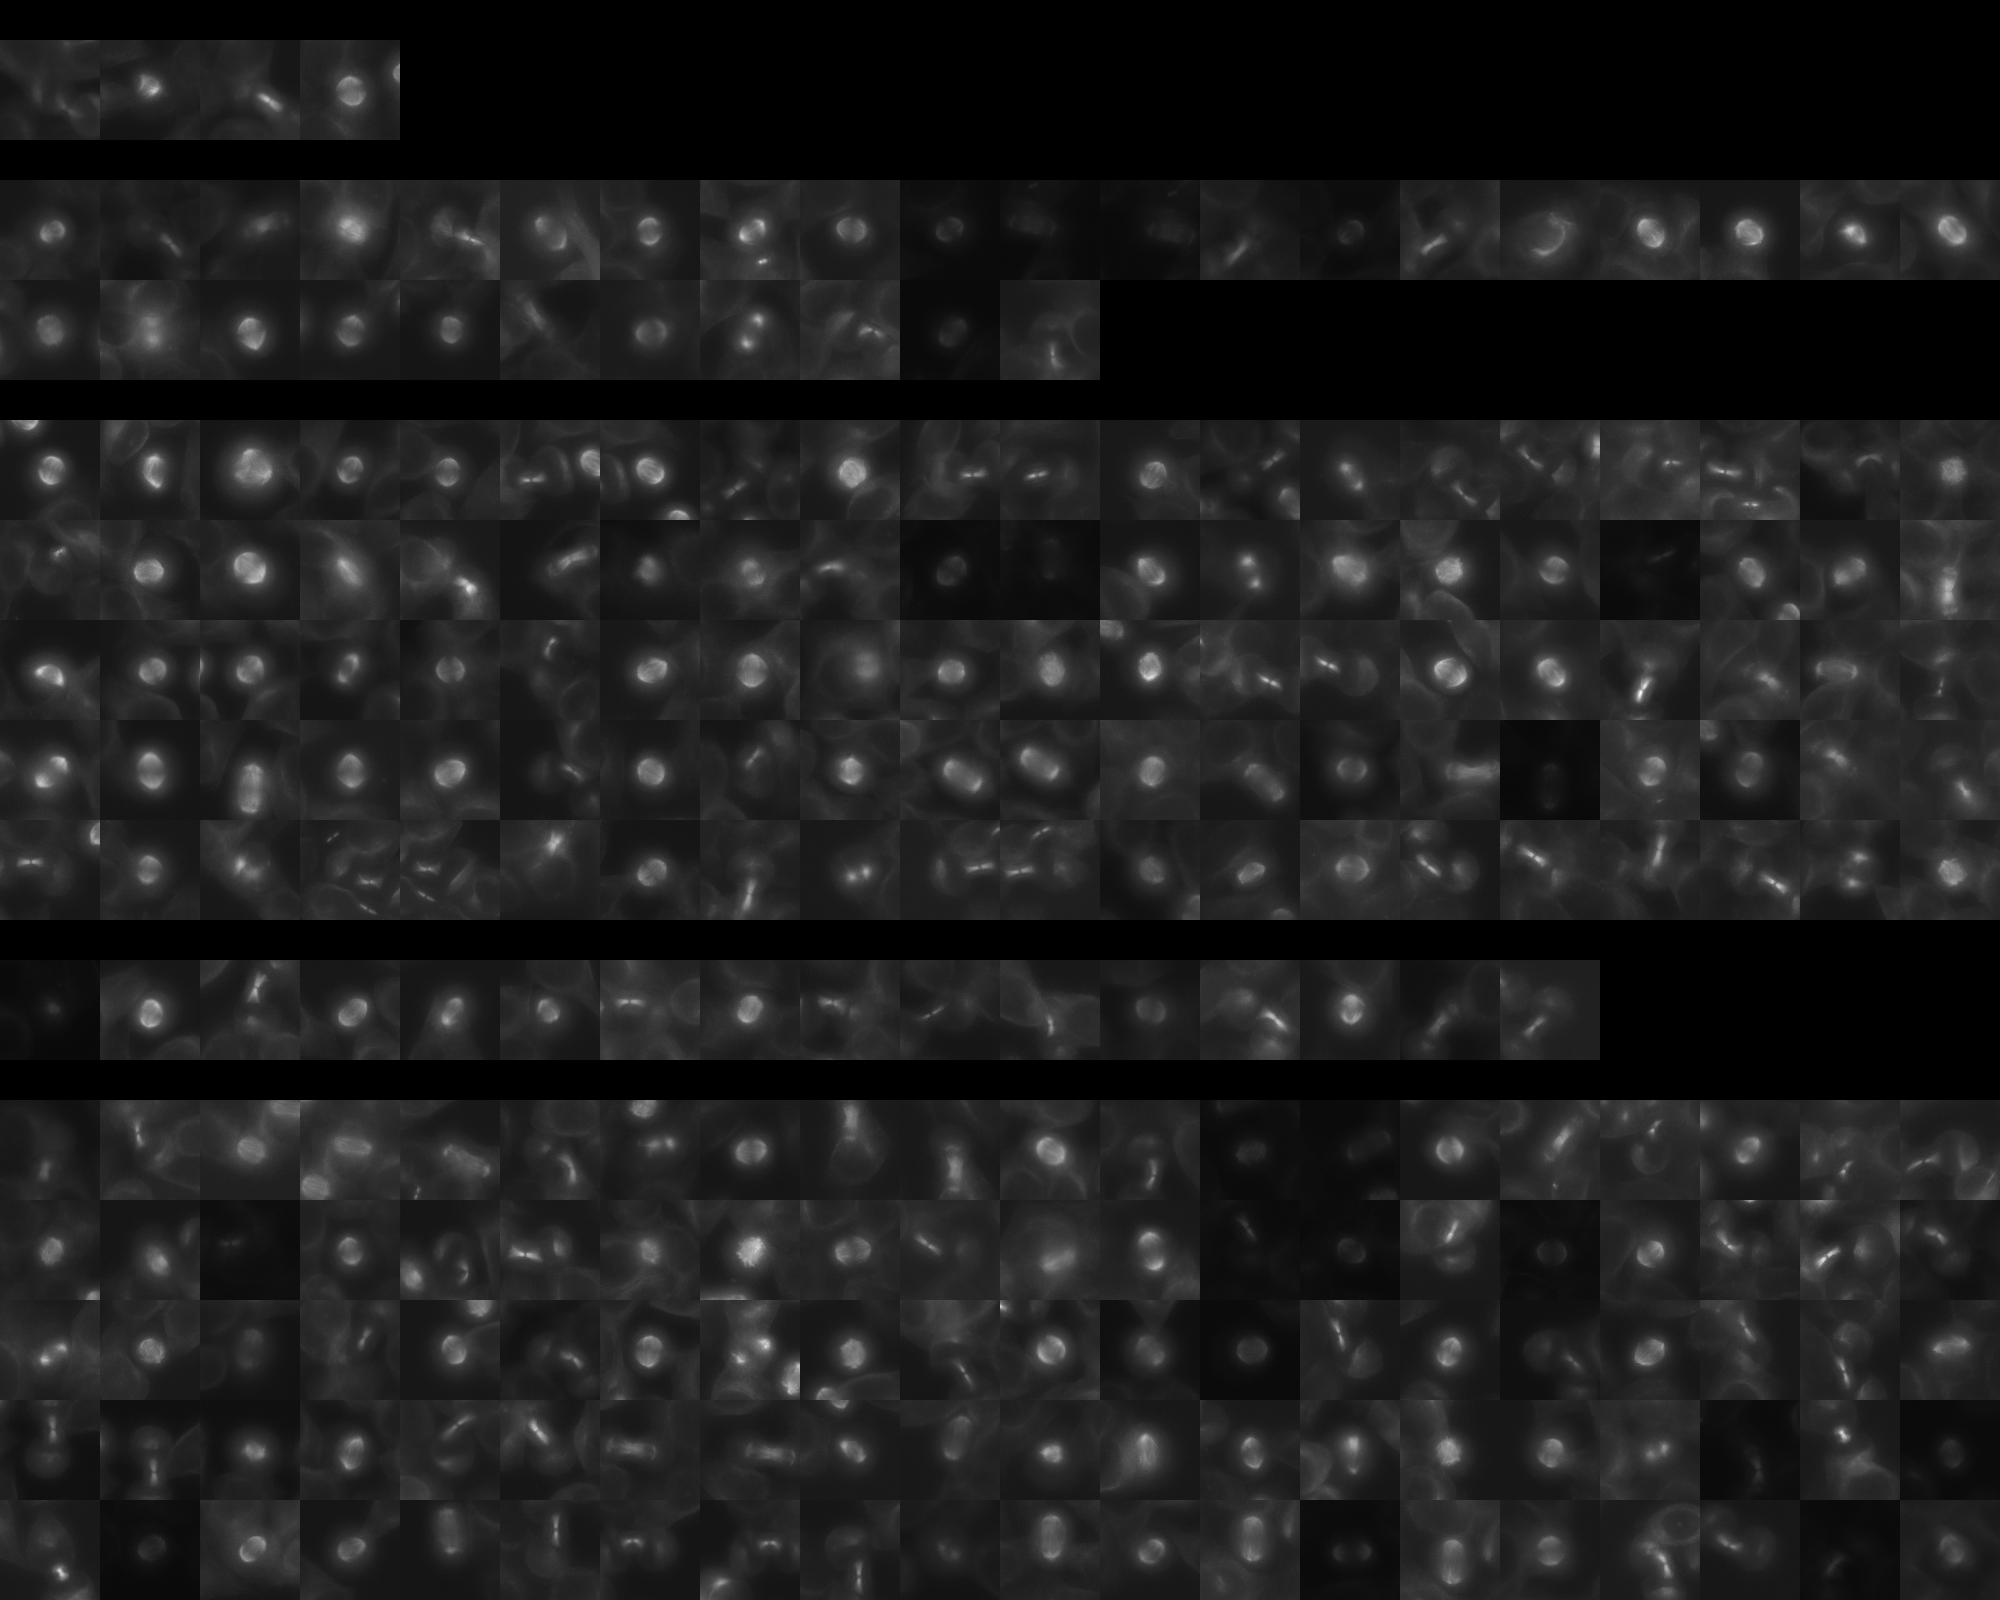
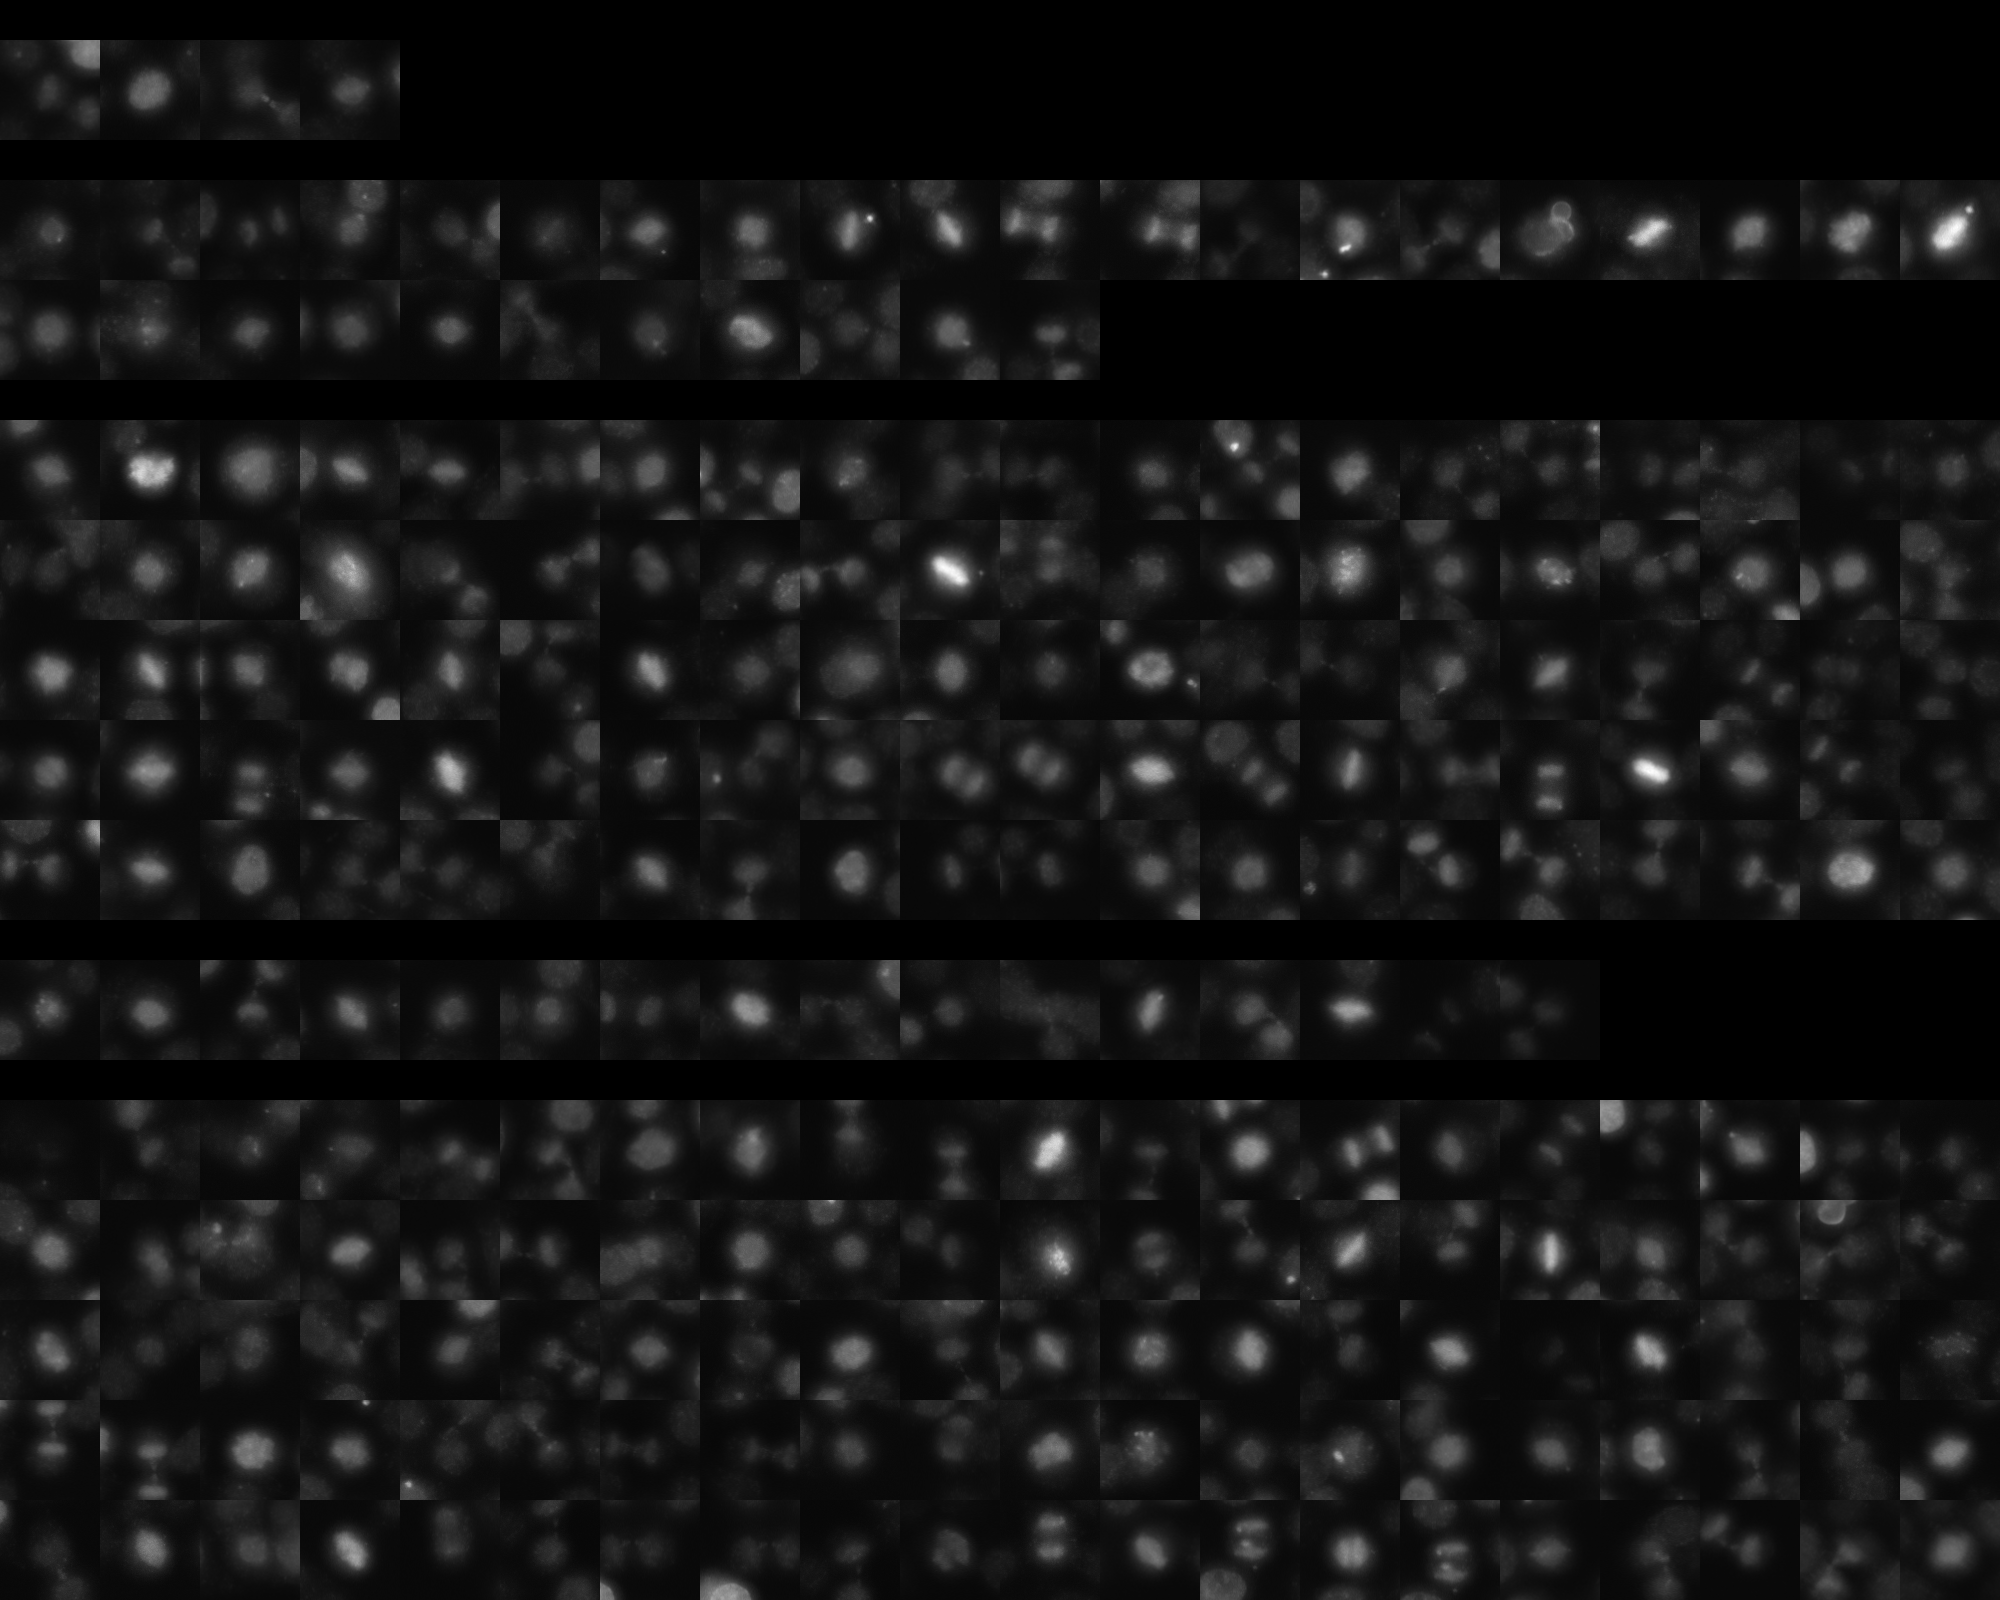
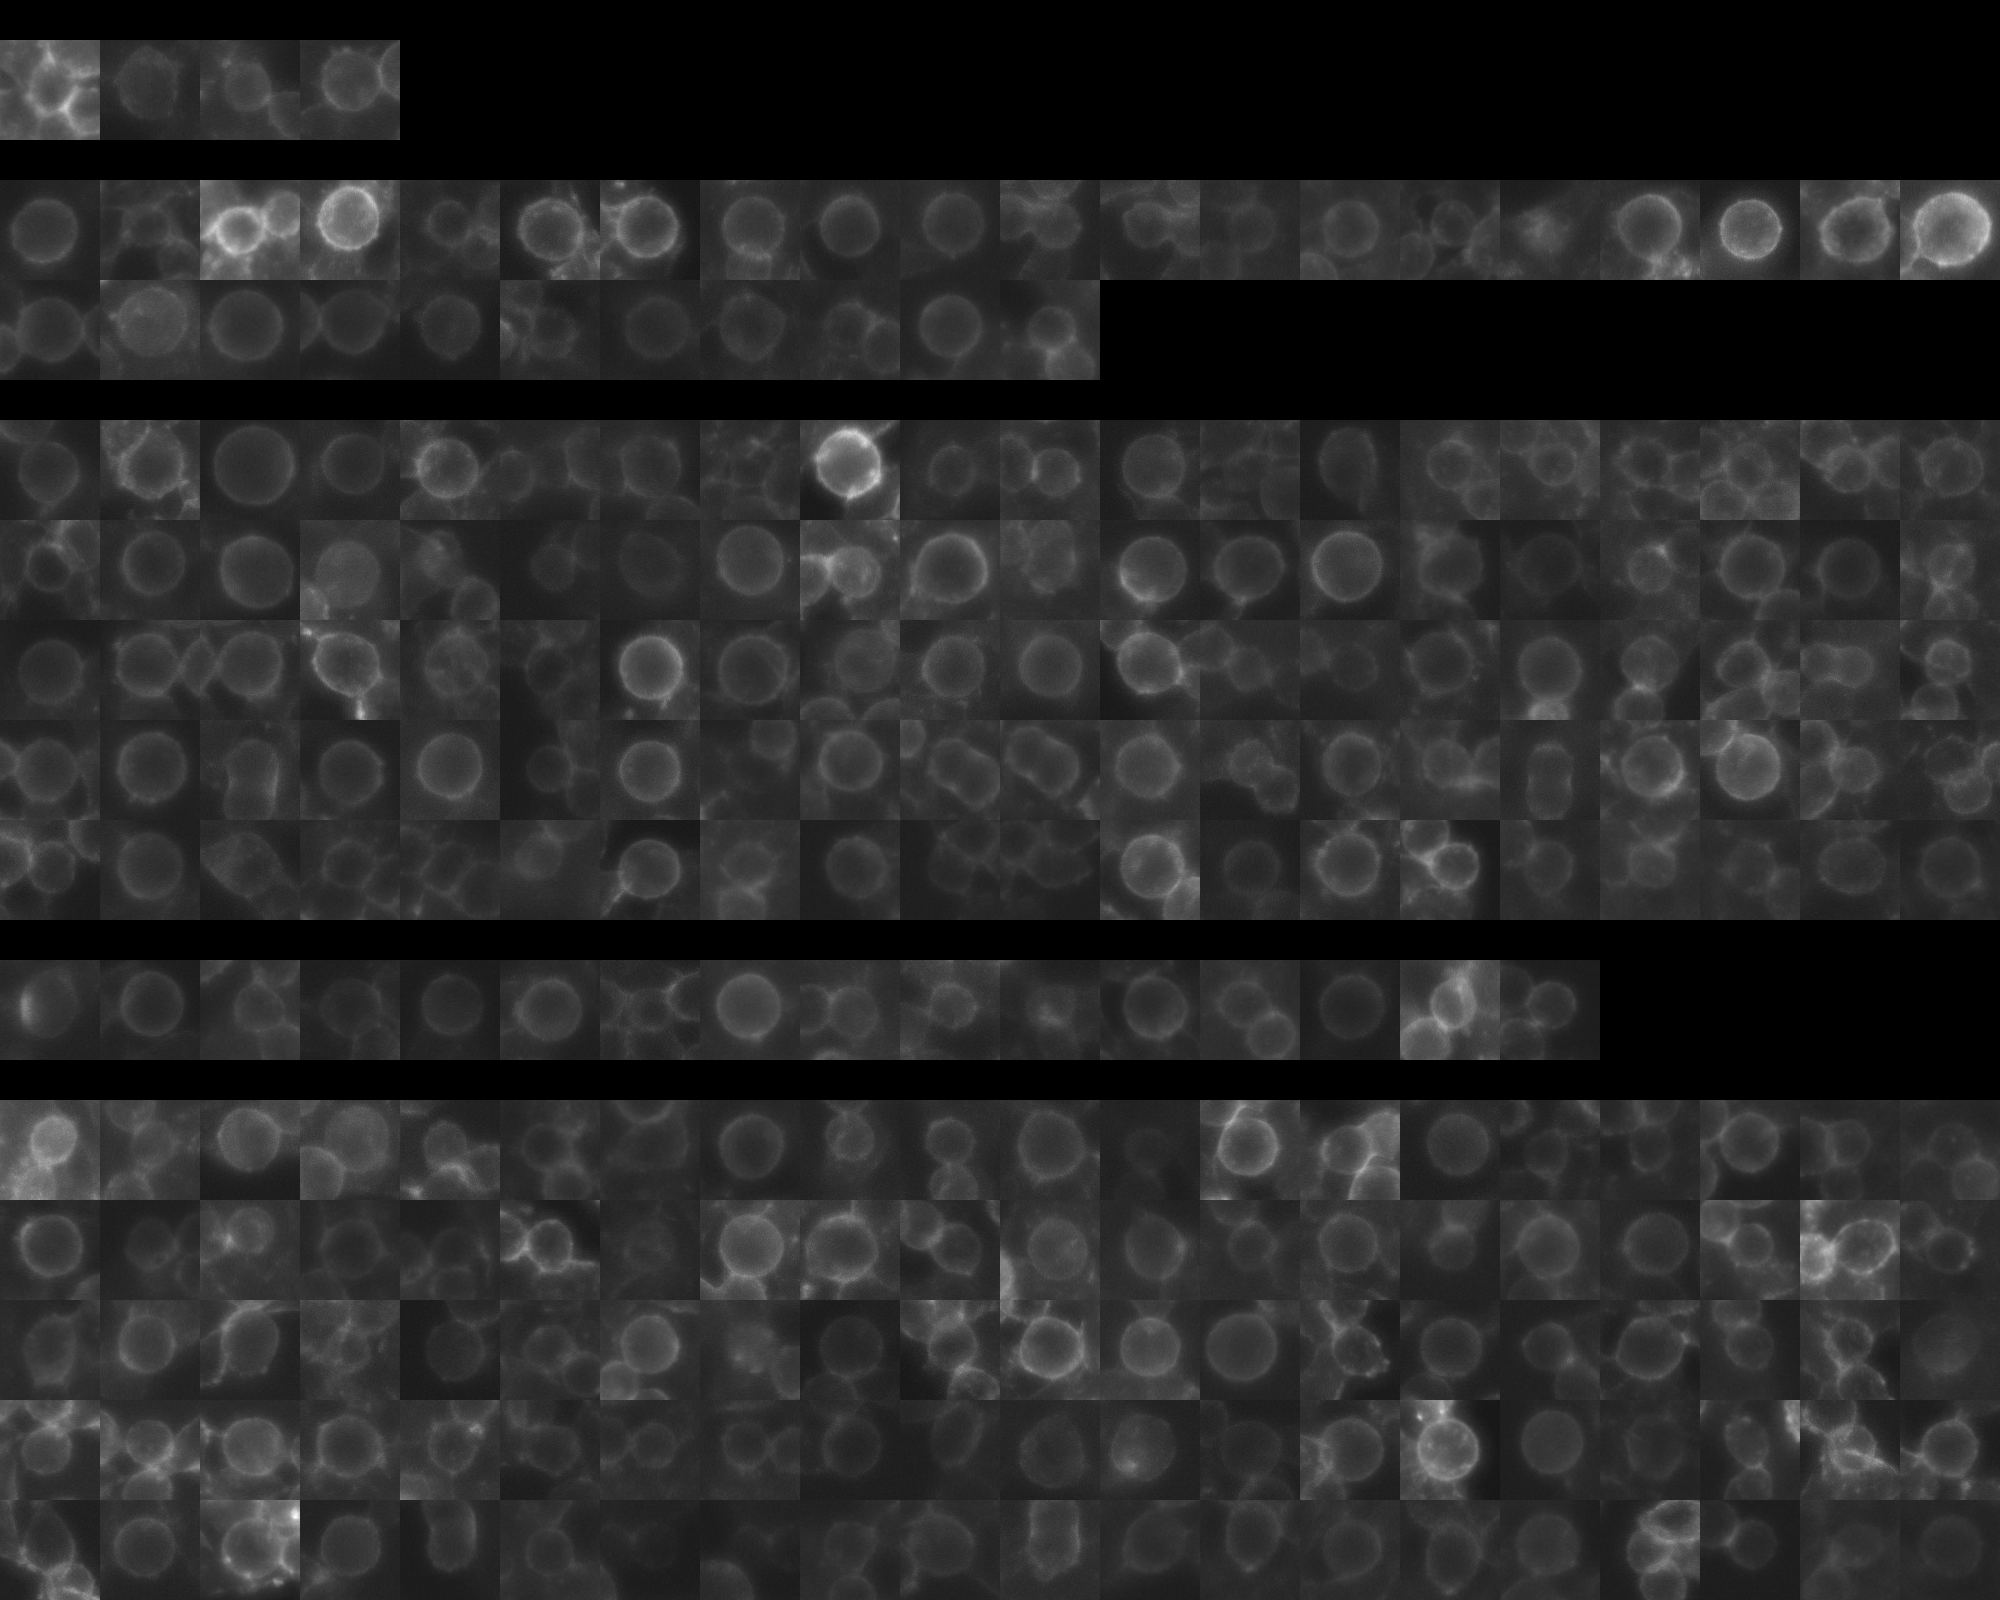
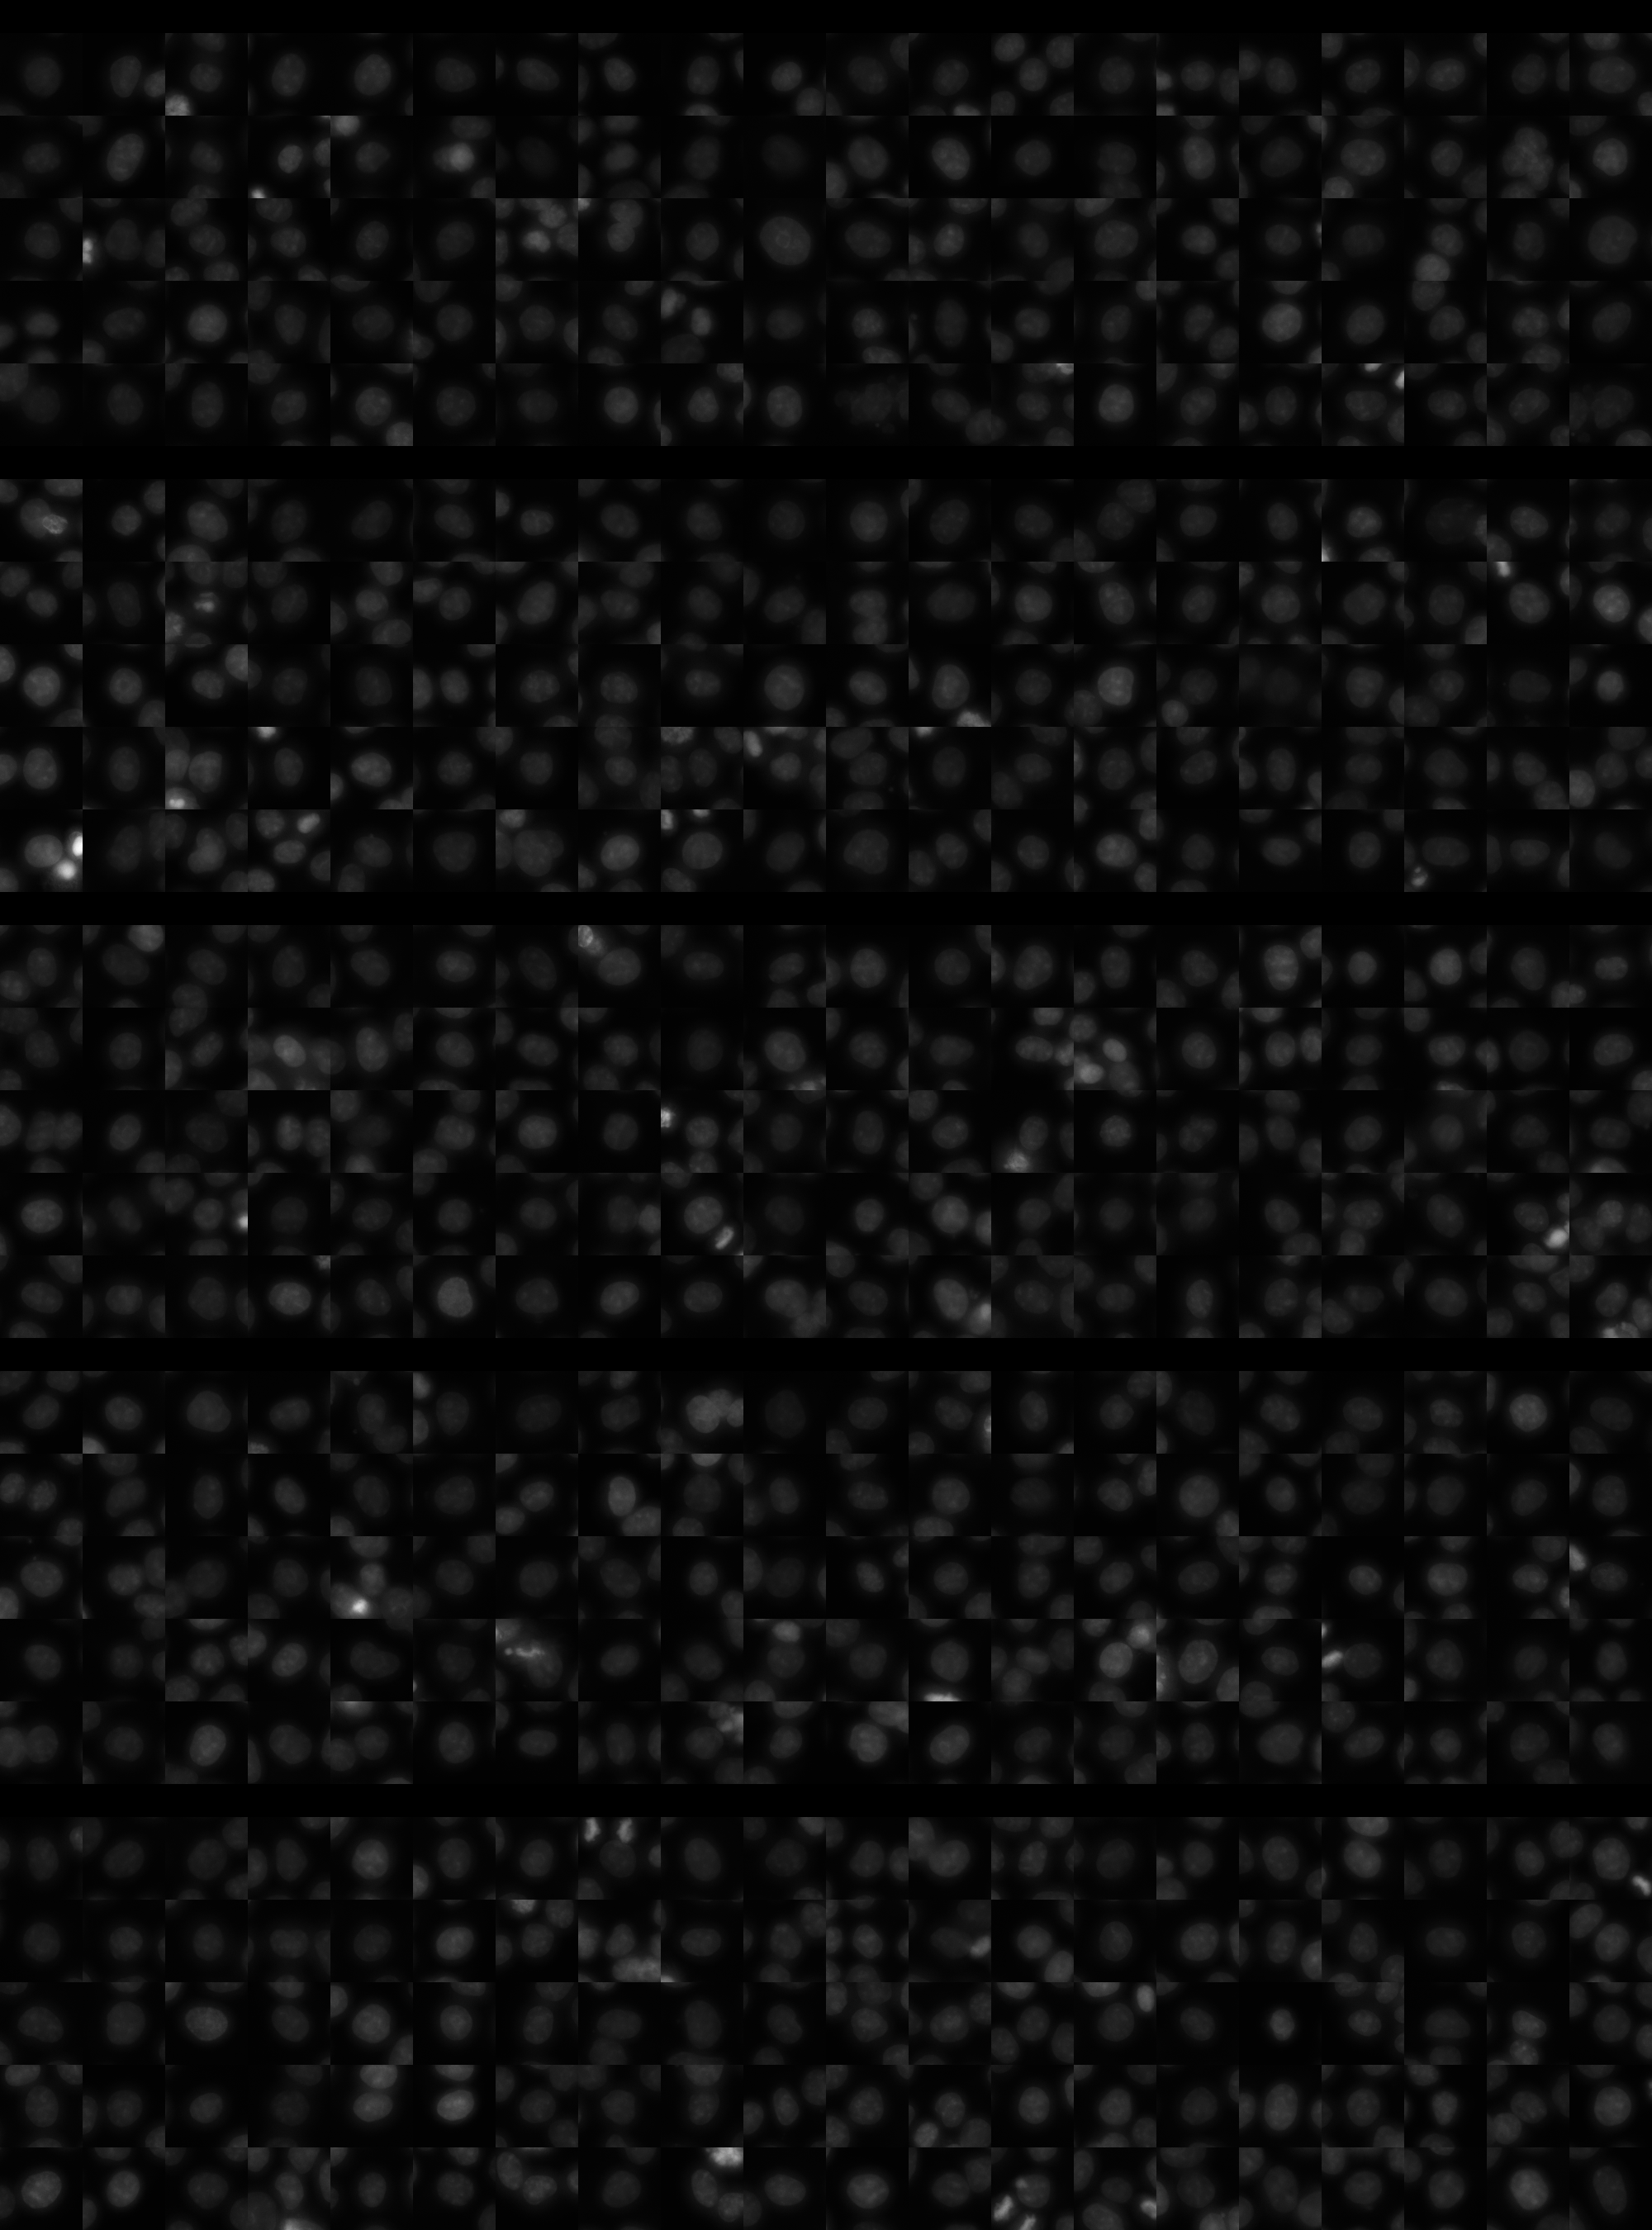
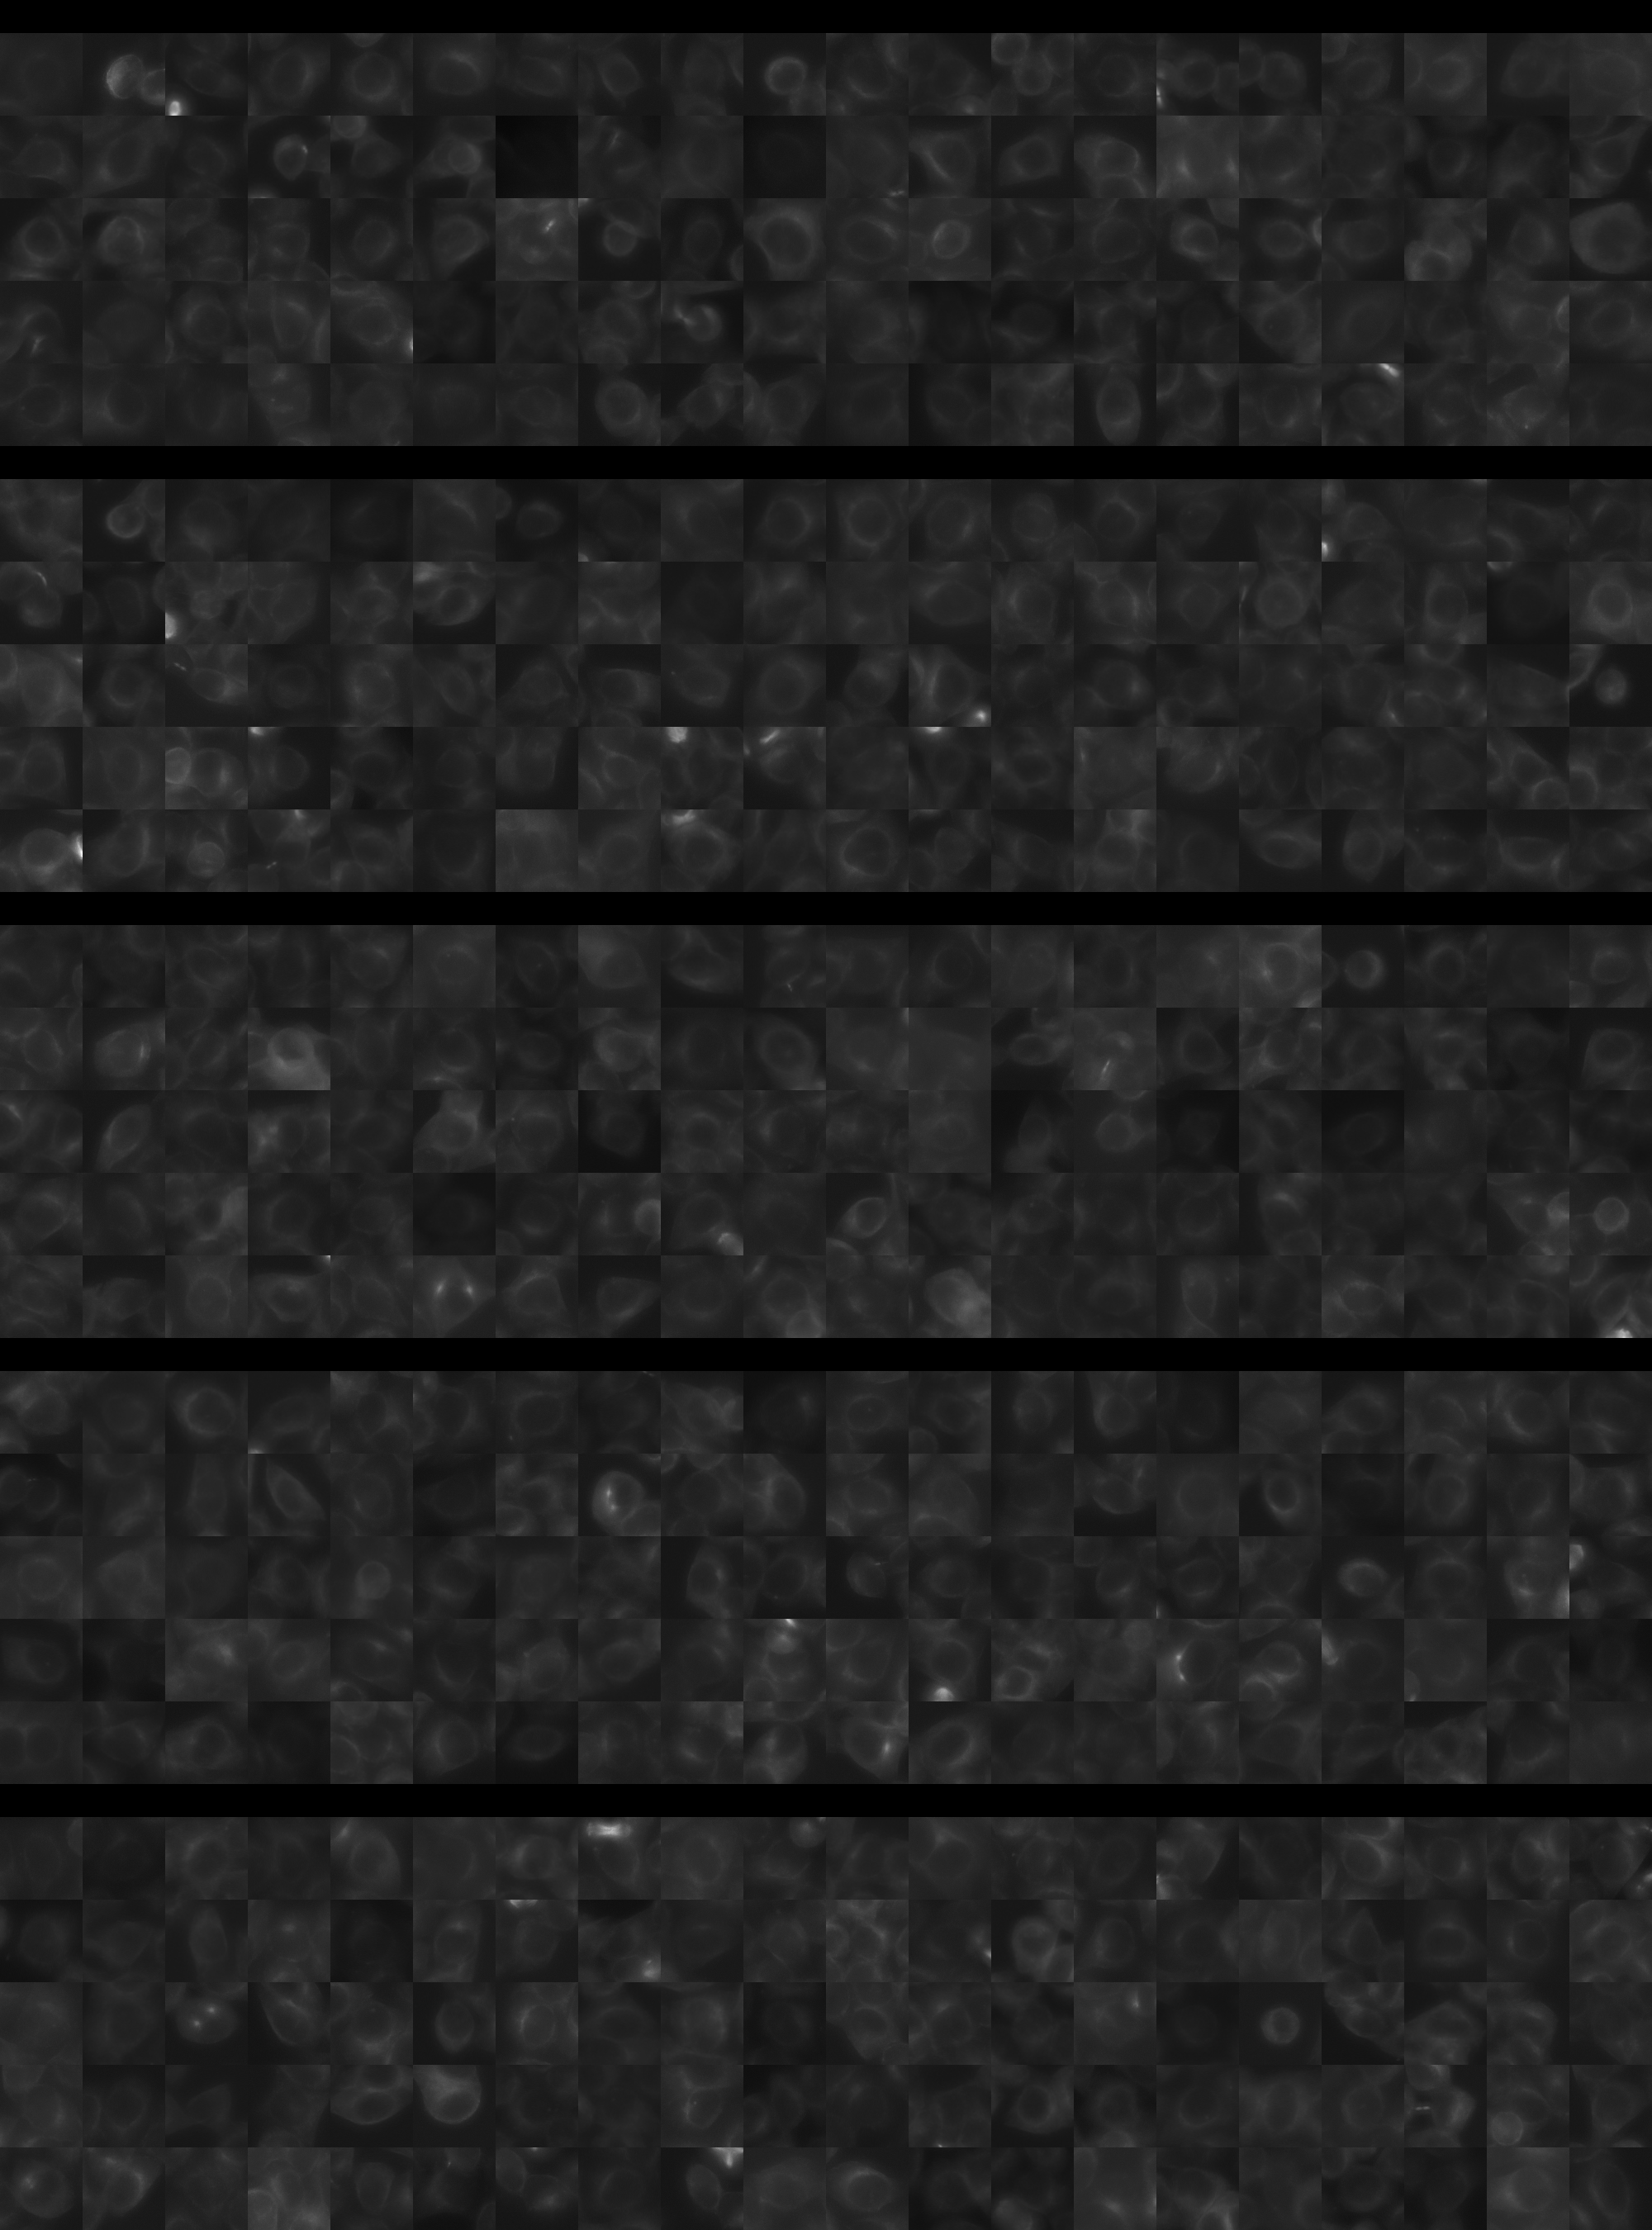
Each montage below shows randomly selected individual cell images for the same target gene separated by sgRNA, along with an example montage of cells expressing a non-targeting negative control sgRNA at the bottom. sgRNA labels in the montages correspond to the numbered sgRNA sequences in the gene info table above. The DNA (blue) and tubulin (green) channels are displayed by default, with gH2AX (grayscale) and actin (yellow) available using the check boxes. Channel brightness, contrast, and opacity are adjustable by clicking the arrow next to the channel name. When only one channel is selected, the display defaults to grayscale. Click the “Zoom” checkbox above the channel controls to enable image zooming (via scrolling) and panning (via click-and-drag).

The cell boxes displayed for this gene are square, 30.36 μm per side for the interphase montage and 30.36 μm per side for the mitotic montage.
Features

Interphase Score Rank FDR q-value
Nucleus DNA Integrated -2.906e-02 4374 of 5322 0.674
Nucleus DNA Mean -5.047e-02 3603 of 5322 0.322
Nucleus gH2AX Mean 0.022 4214 of 5322 0.643
Nucleus DNA - gH2AX Correlation -4.375e-02 2188 of 5322 0.192
Nucleus Shape Area -1.186e-03 3328 of 5322 0.918
Nucleus Shape Eccentricity -1.372e-02 3965 of 5322 0.858
Nucleus Shape Form Factor -4.836e-02 2600 of 5322 0.298
Nucleus Shape Solidity 0.029 177 of 5322 0.432
Cell DNA Mass Displacement 0.004 4135 of 5322 0.991
Cell Tubulin Mean 0.026 1778 of 5322 0.618
Cell Tubulin Mass Displacement 0.016 1987 of 5322 0.846
Cell Actin Mean 0.021 2311 of 5322 0.750
Cell Tubulin - Actin Correlation 0.026 2357 of 5322 0.638
Cell DNA - Tubulin Correlation 0.047 1991 of 5322 0.302
Cell Shape Area 0.046 1657 of 5322 0.591
Cell Shape Eccentricity -6.016e-03 4115 of 5322 0.979
Mitotic Score Rank FDR q-value
Nucleus DNA Integrated -1.603e-01 5071 of 5322 0.930
Nucleus DNA Mean 0.075 1794 of 5322 1.000
Nucleus DNA Mass Displacement -2.487e-01 5254 of 5322 0.999
Nucleus DNA Mean Frac 3 0.036 2556 of 5322 1.000
Nucleus gH2AX Mean 0.162 1019 of 5322 1.000
Nucleus gH2AX Mean Frac 0 -1.232e-01 4095 of 5322 1.000
Nucleus Tubulin Mean Frac 0 -1.697e-02 3755 of 5322 0.999
Nucleus Tubulin Mean Edge 0.297 313 of 5322 0.963
Nucleus Tubulin Std Edge 0.152 767 of 5322 0.999
Nucleus Shape Area -8.784e-02 4726 of 5322 0.989
Nucleus Shape Eccentricity -1.202e-01 3828 of 5322 1.000
Nucleus Shape Form Factor 0.123 318 of 5322 0.998
Cell Tubulin Mean 0.138 1580 of 5322 0.997
Cell Tubulin Mean Frac 3 0.113 630 of 5322 0.999
Cell Actin Mean 0.205 862 of 5322 0.997
Cell Shape Area 0.024 3599 of 5322 1.000
( Reset Zoom )
Brightness
Contrast
Opacity
Brightness
Contrast
Opacity
Brightness
Contrast
Opacity
Brightness
Contrast
Opacity
Brightness
Contrast
Opacity

( Reset Zoom )
Brightness
Contrast
Opacity
Brightness
Contrast
Opacity
Brightness
Contrast
Opacity
Brightness
Contrast
Opacity
Brightness
Contrast
Opacity

MIT Central Accessability