ACACA

Gene symbol: ACACA
Gene: 31
Uniprot Function: Cytosolic enzyme that catalyzes the carboxylation of acetyl-CoA to malonyl-CoA, the first and rate-limiting step of de novo fatty acid biosynthesis (PubMed:20952656, PubMed:20457939, PubMed:29899443). This is a 2 steps reaction starting with the ATP-dependent carboxylation of the biotin carried by the biotin carboxyl carrier (BCC) domain followed by the transfer of the carboxyl group from carboxylated biotin to acetyl-CoA (PubMed:20952656, PubMed:20457939, PubMed:29899443).
Mitotic Index 0.0255
Interphase Cluster: #103 (23 genes)
Mitotic Cluster: #20 (39 genes)
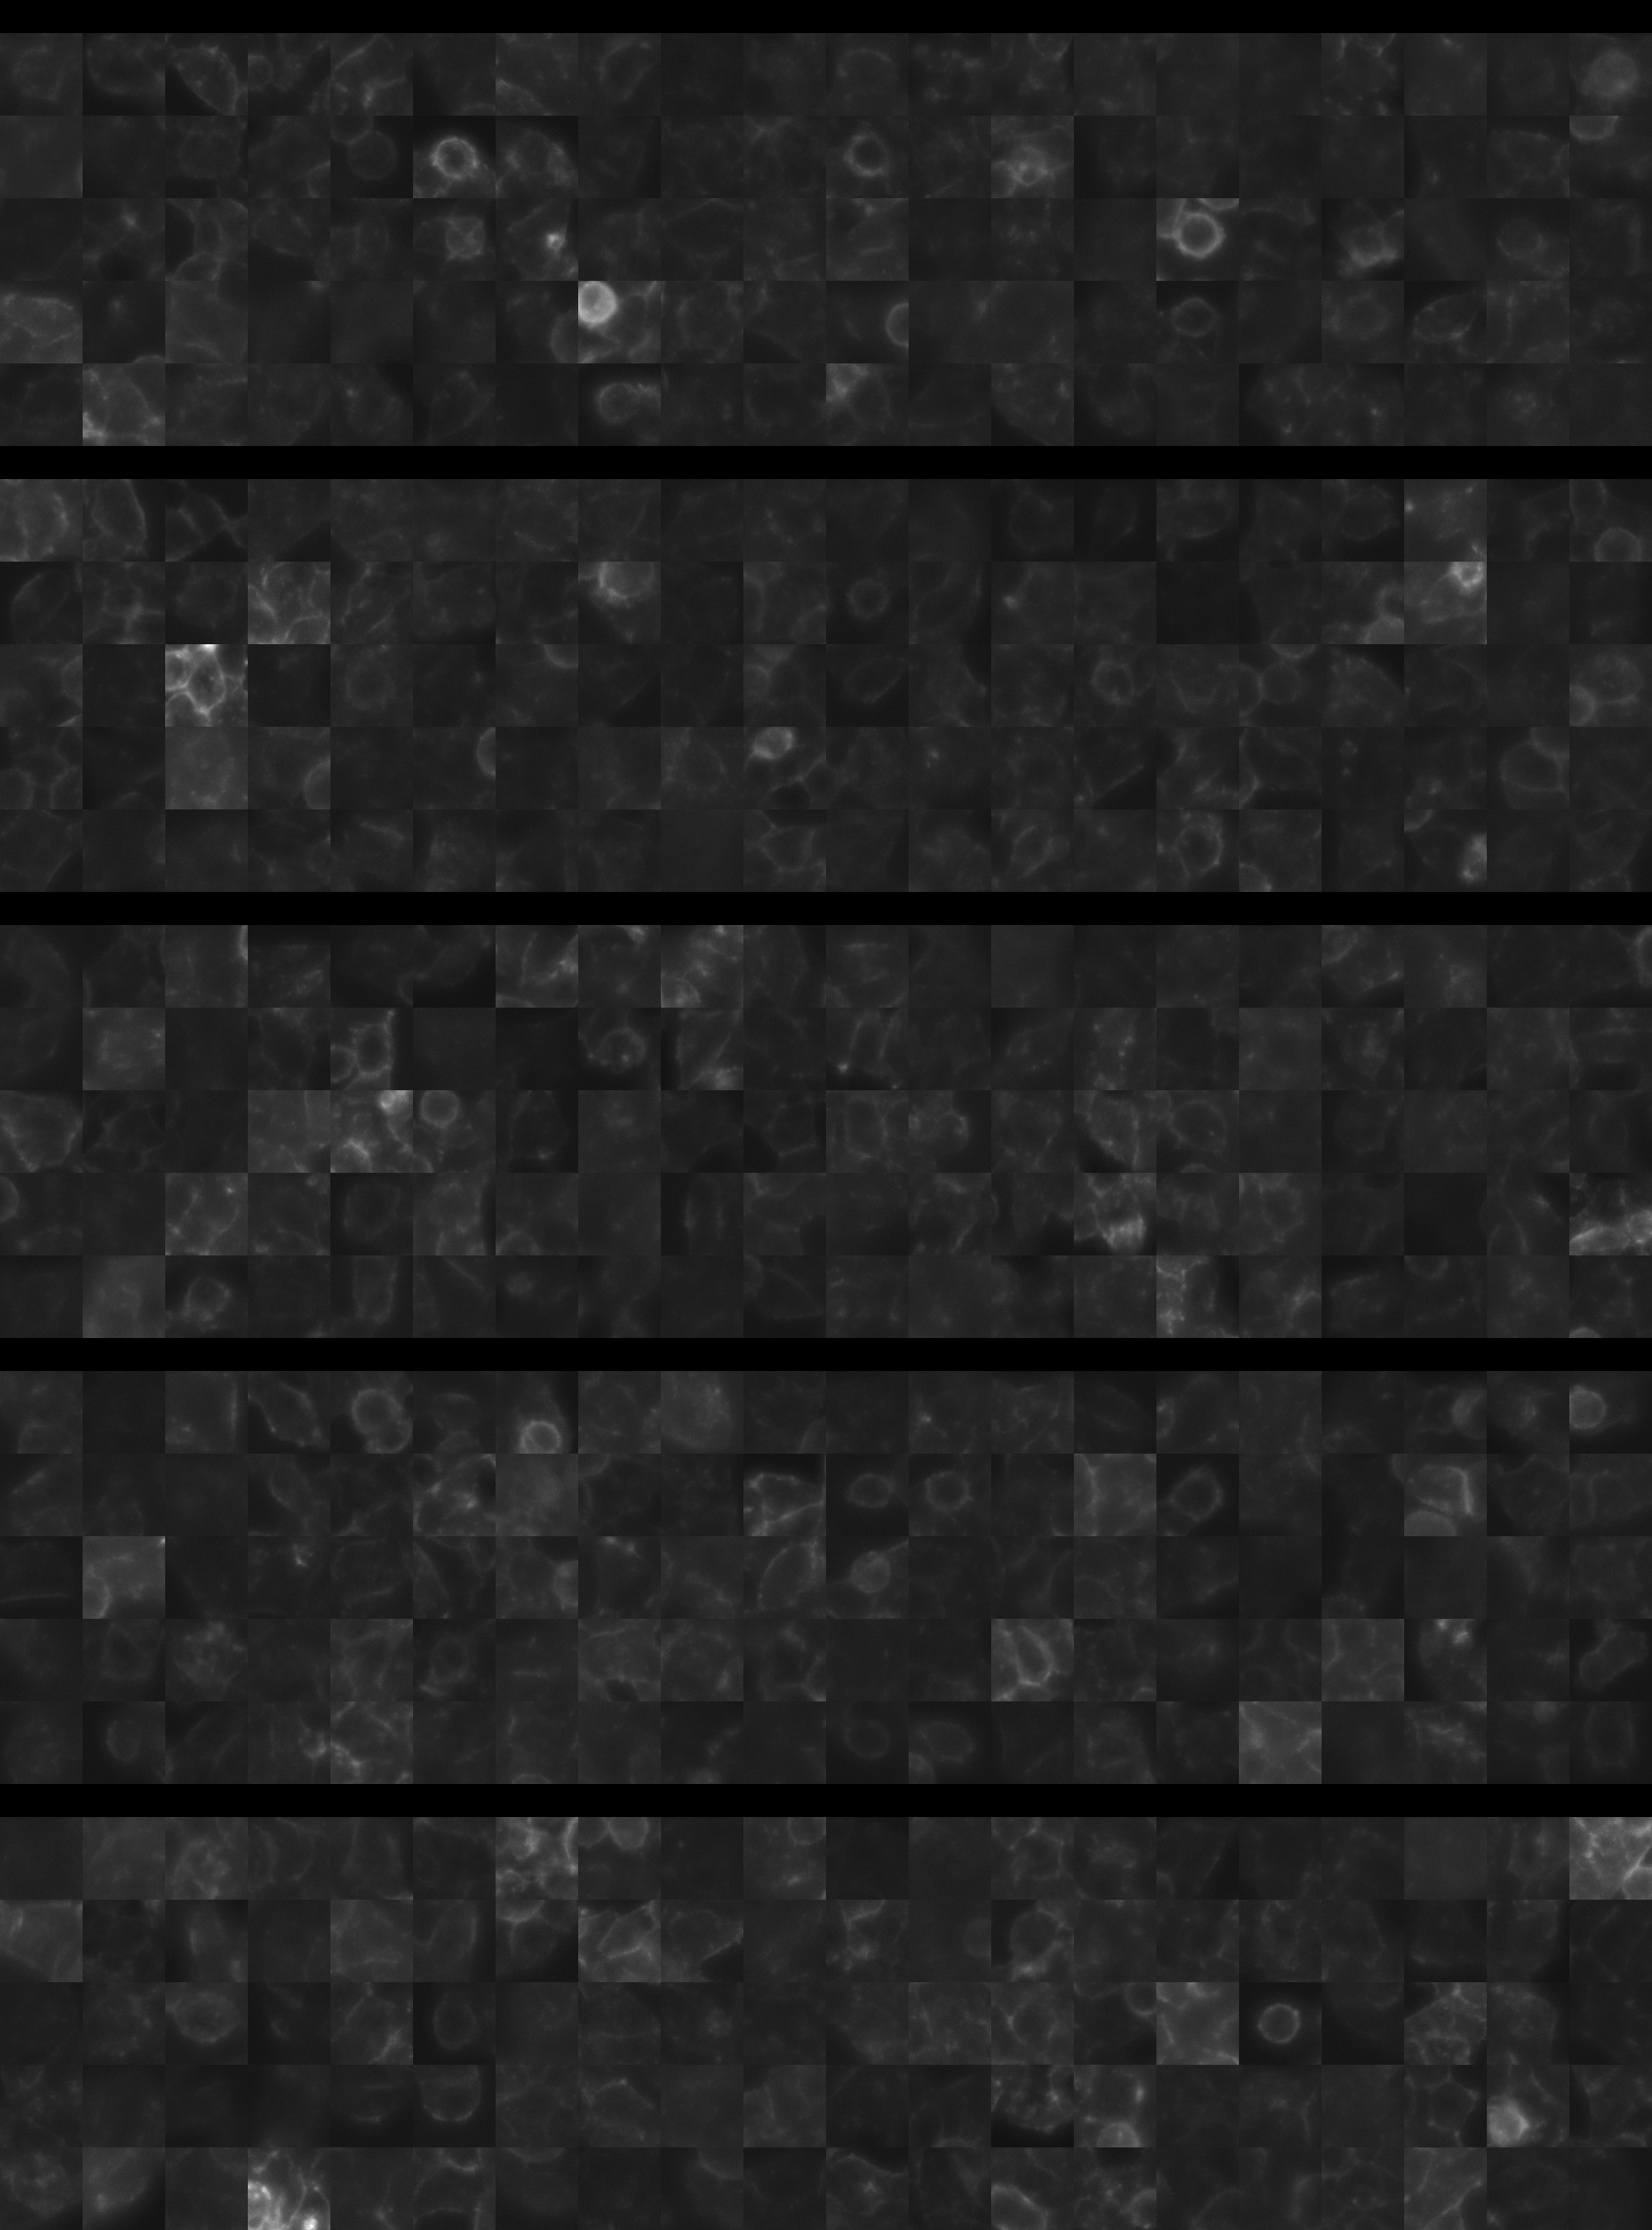
sgRNA 1: AATGCATGCGGTCTATCCGT (interphase cells: 1125, mitotic cells: 26)
sgRNA 2: CCAGAGTCCCACATTCCCTG (interphase cells: 2888, mitotic cells: 79)
sgRNA 3: TGATGGGTCCATGATAACCG (interphase cells: 1297, mitotic cells: 47)
sgRNA 4: TTCTCAACGAGATTTCACTG (interphase cells: 1484, mitotic cells: 26)

Interphase Cluster

Mitotic Cluster

Overview

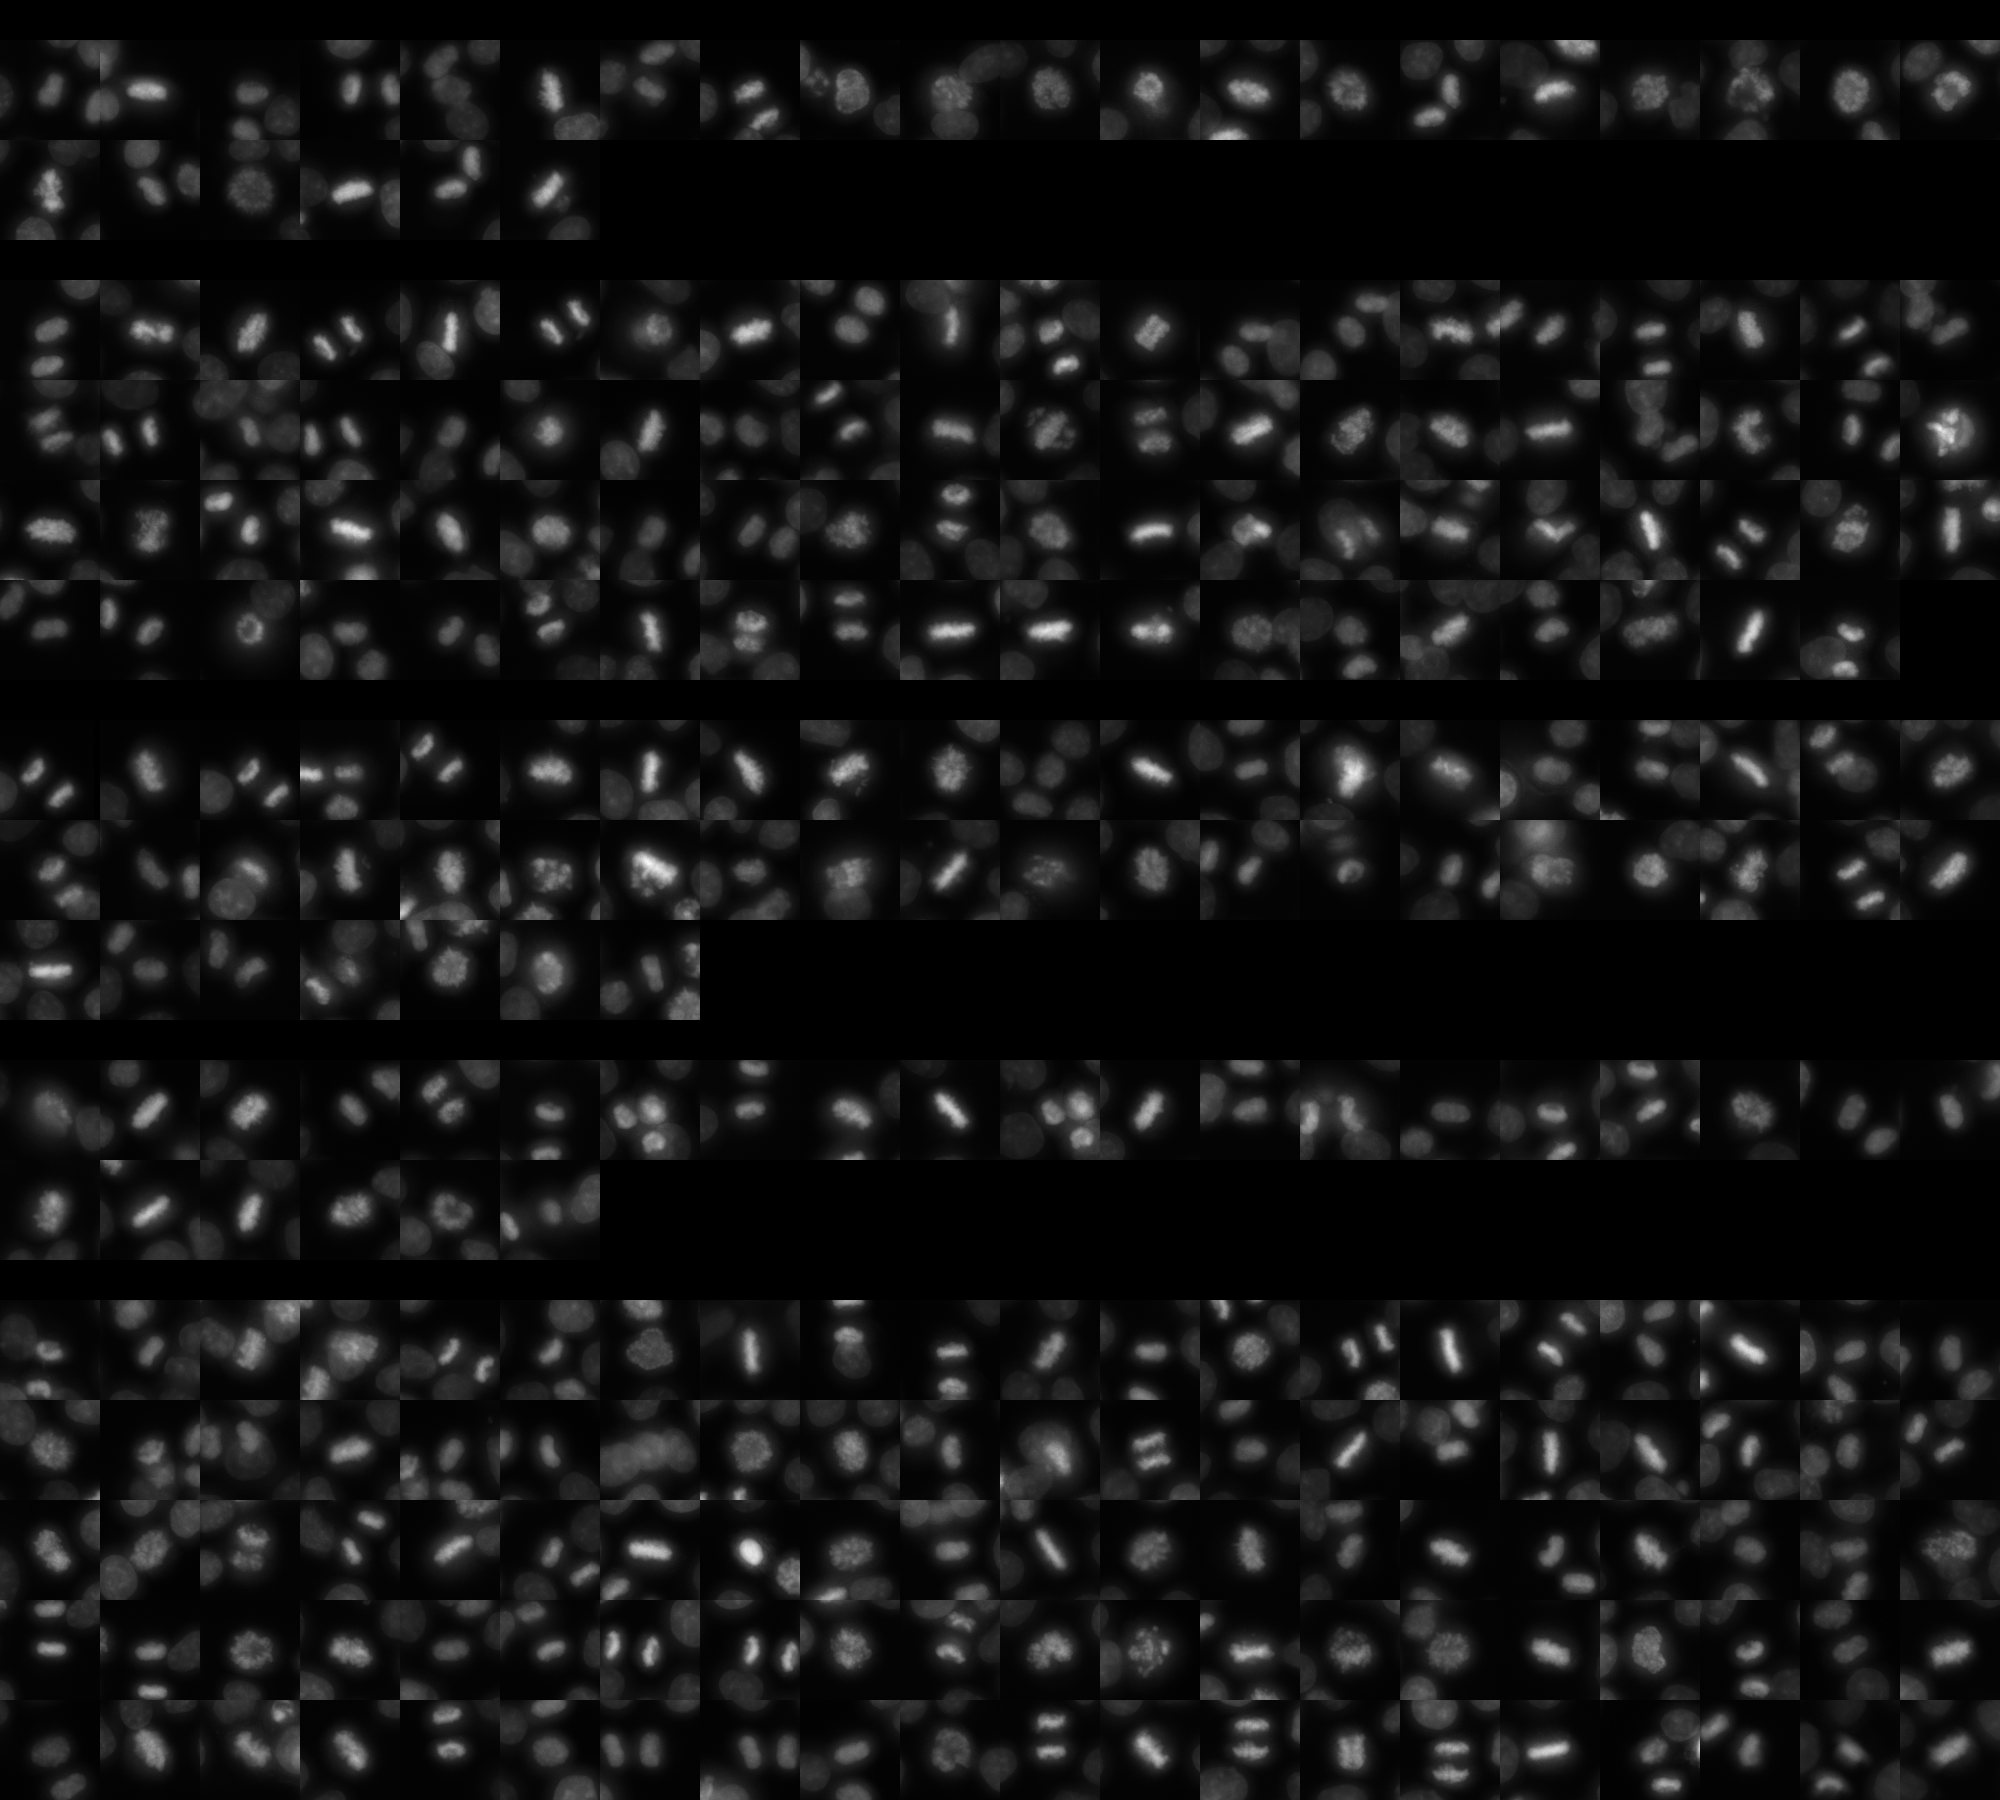
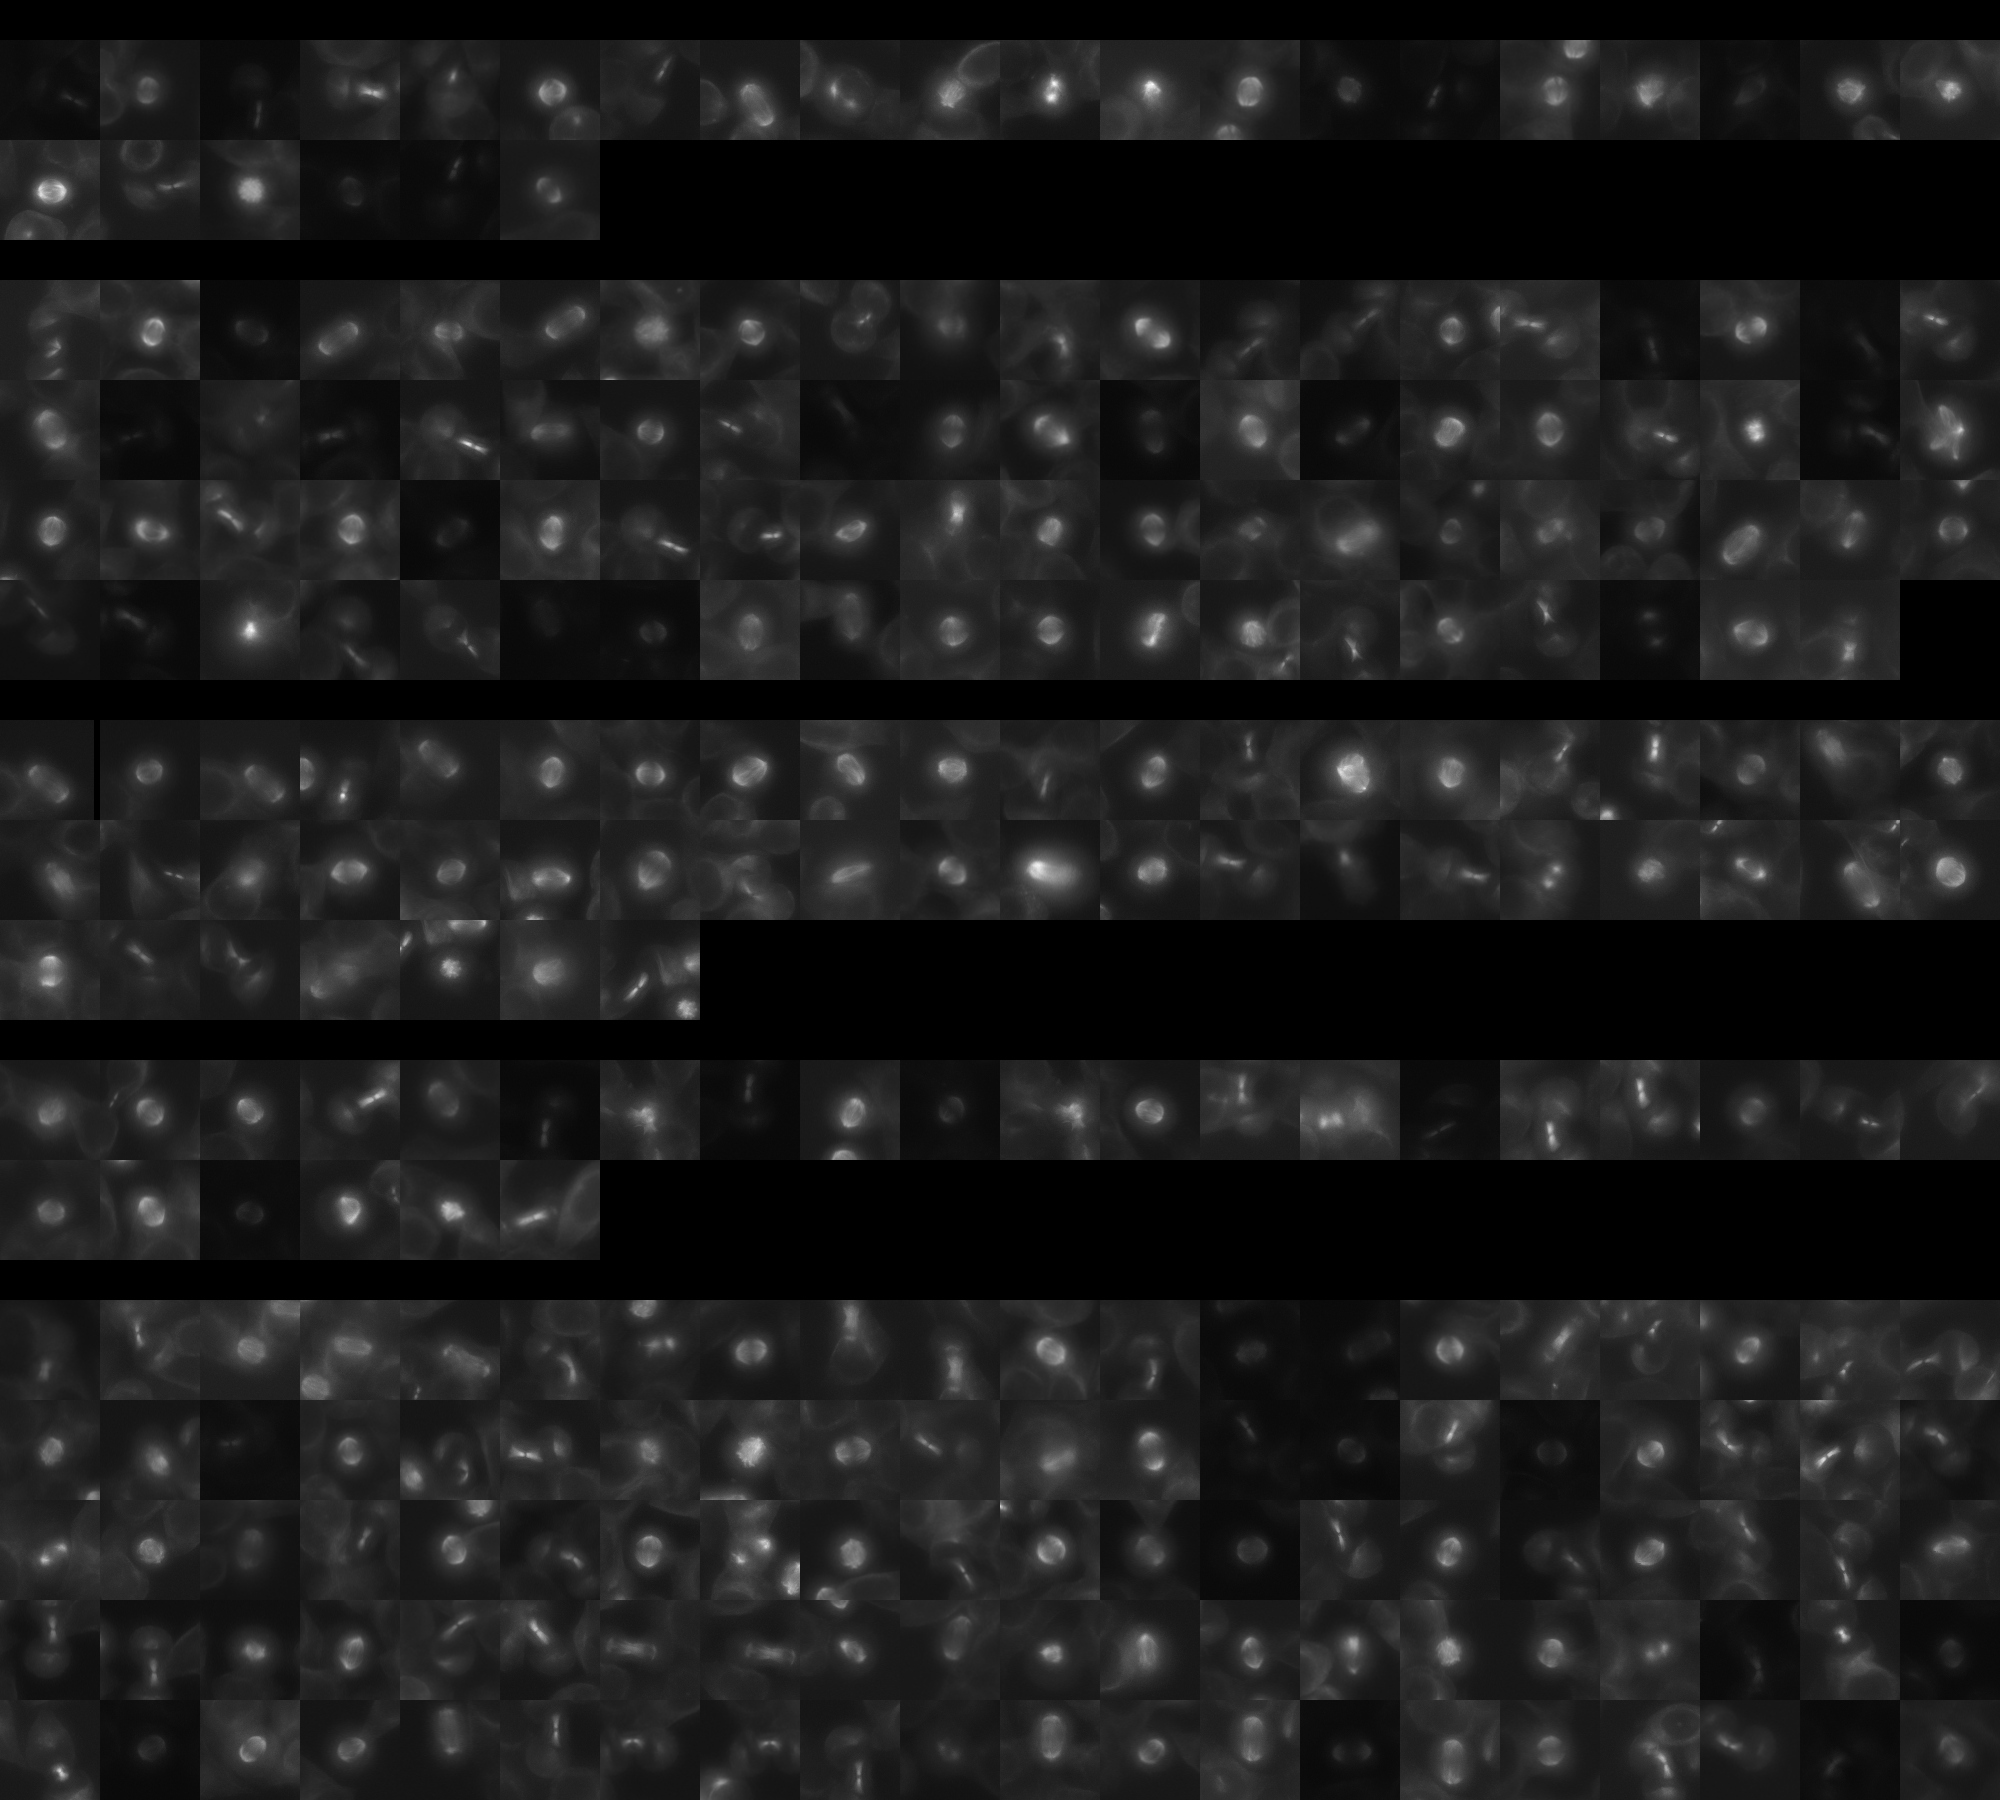
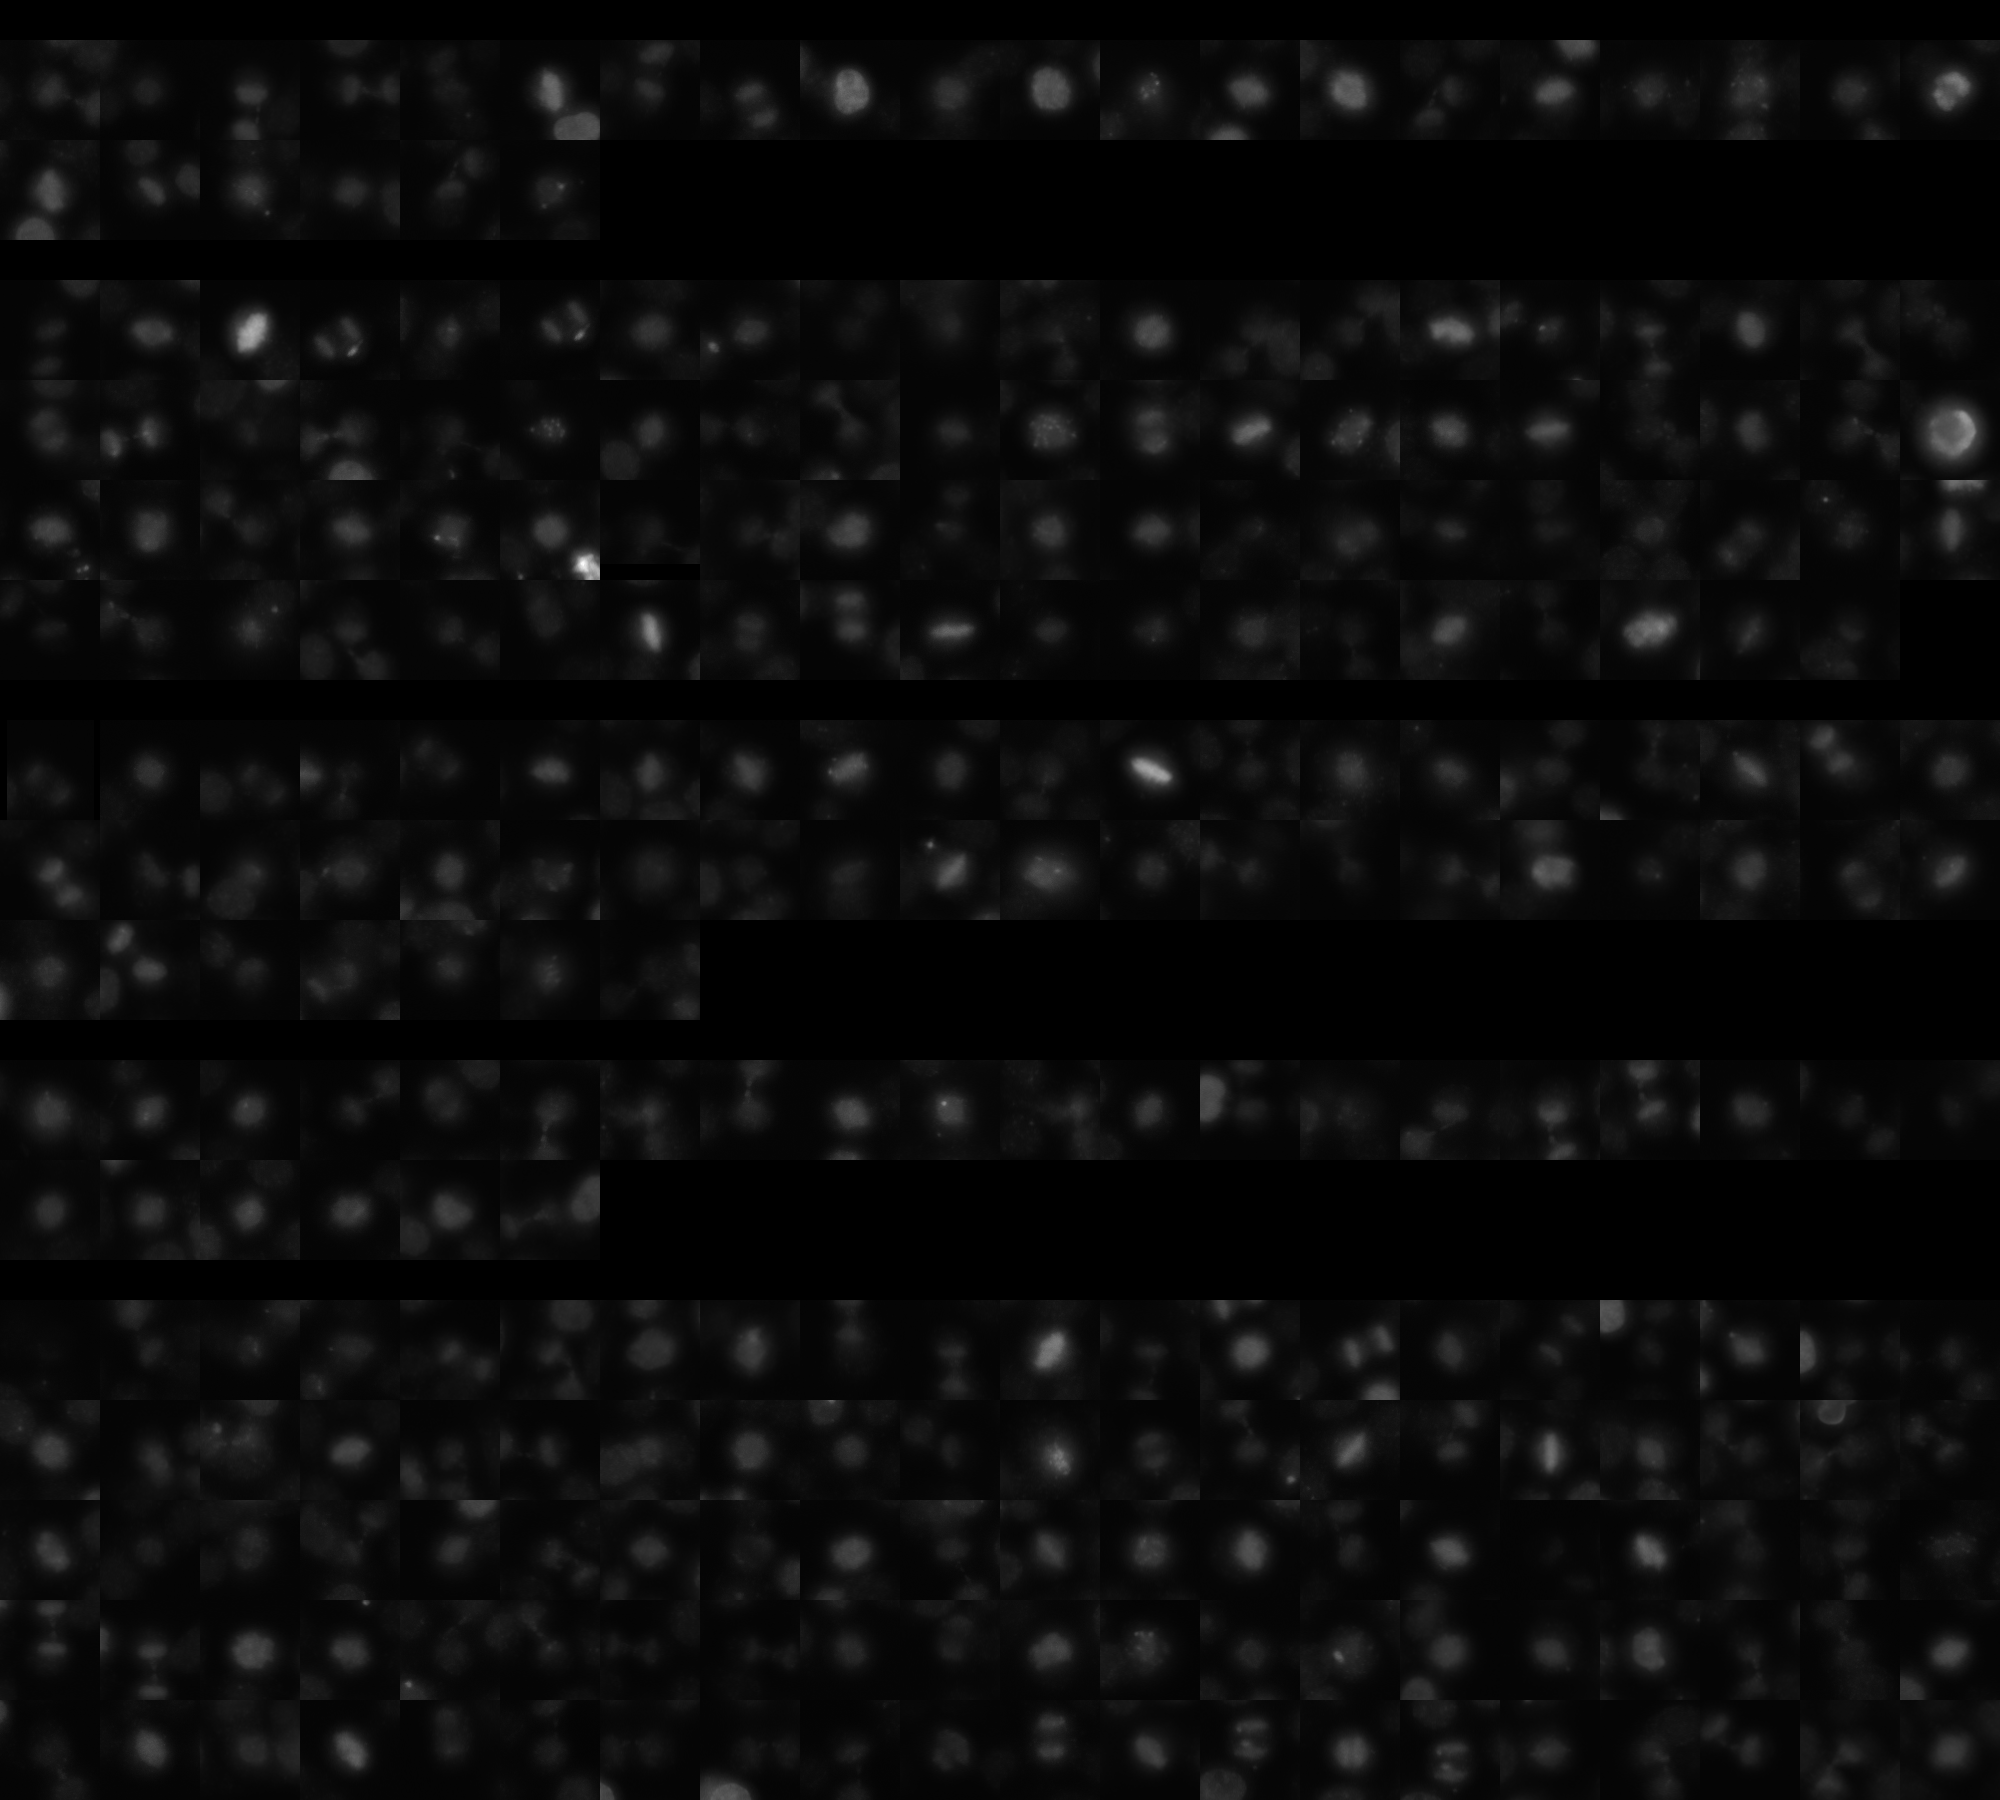
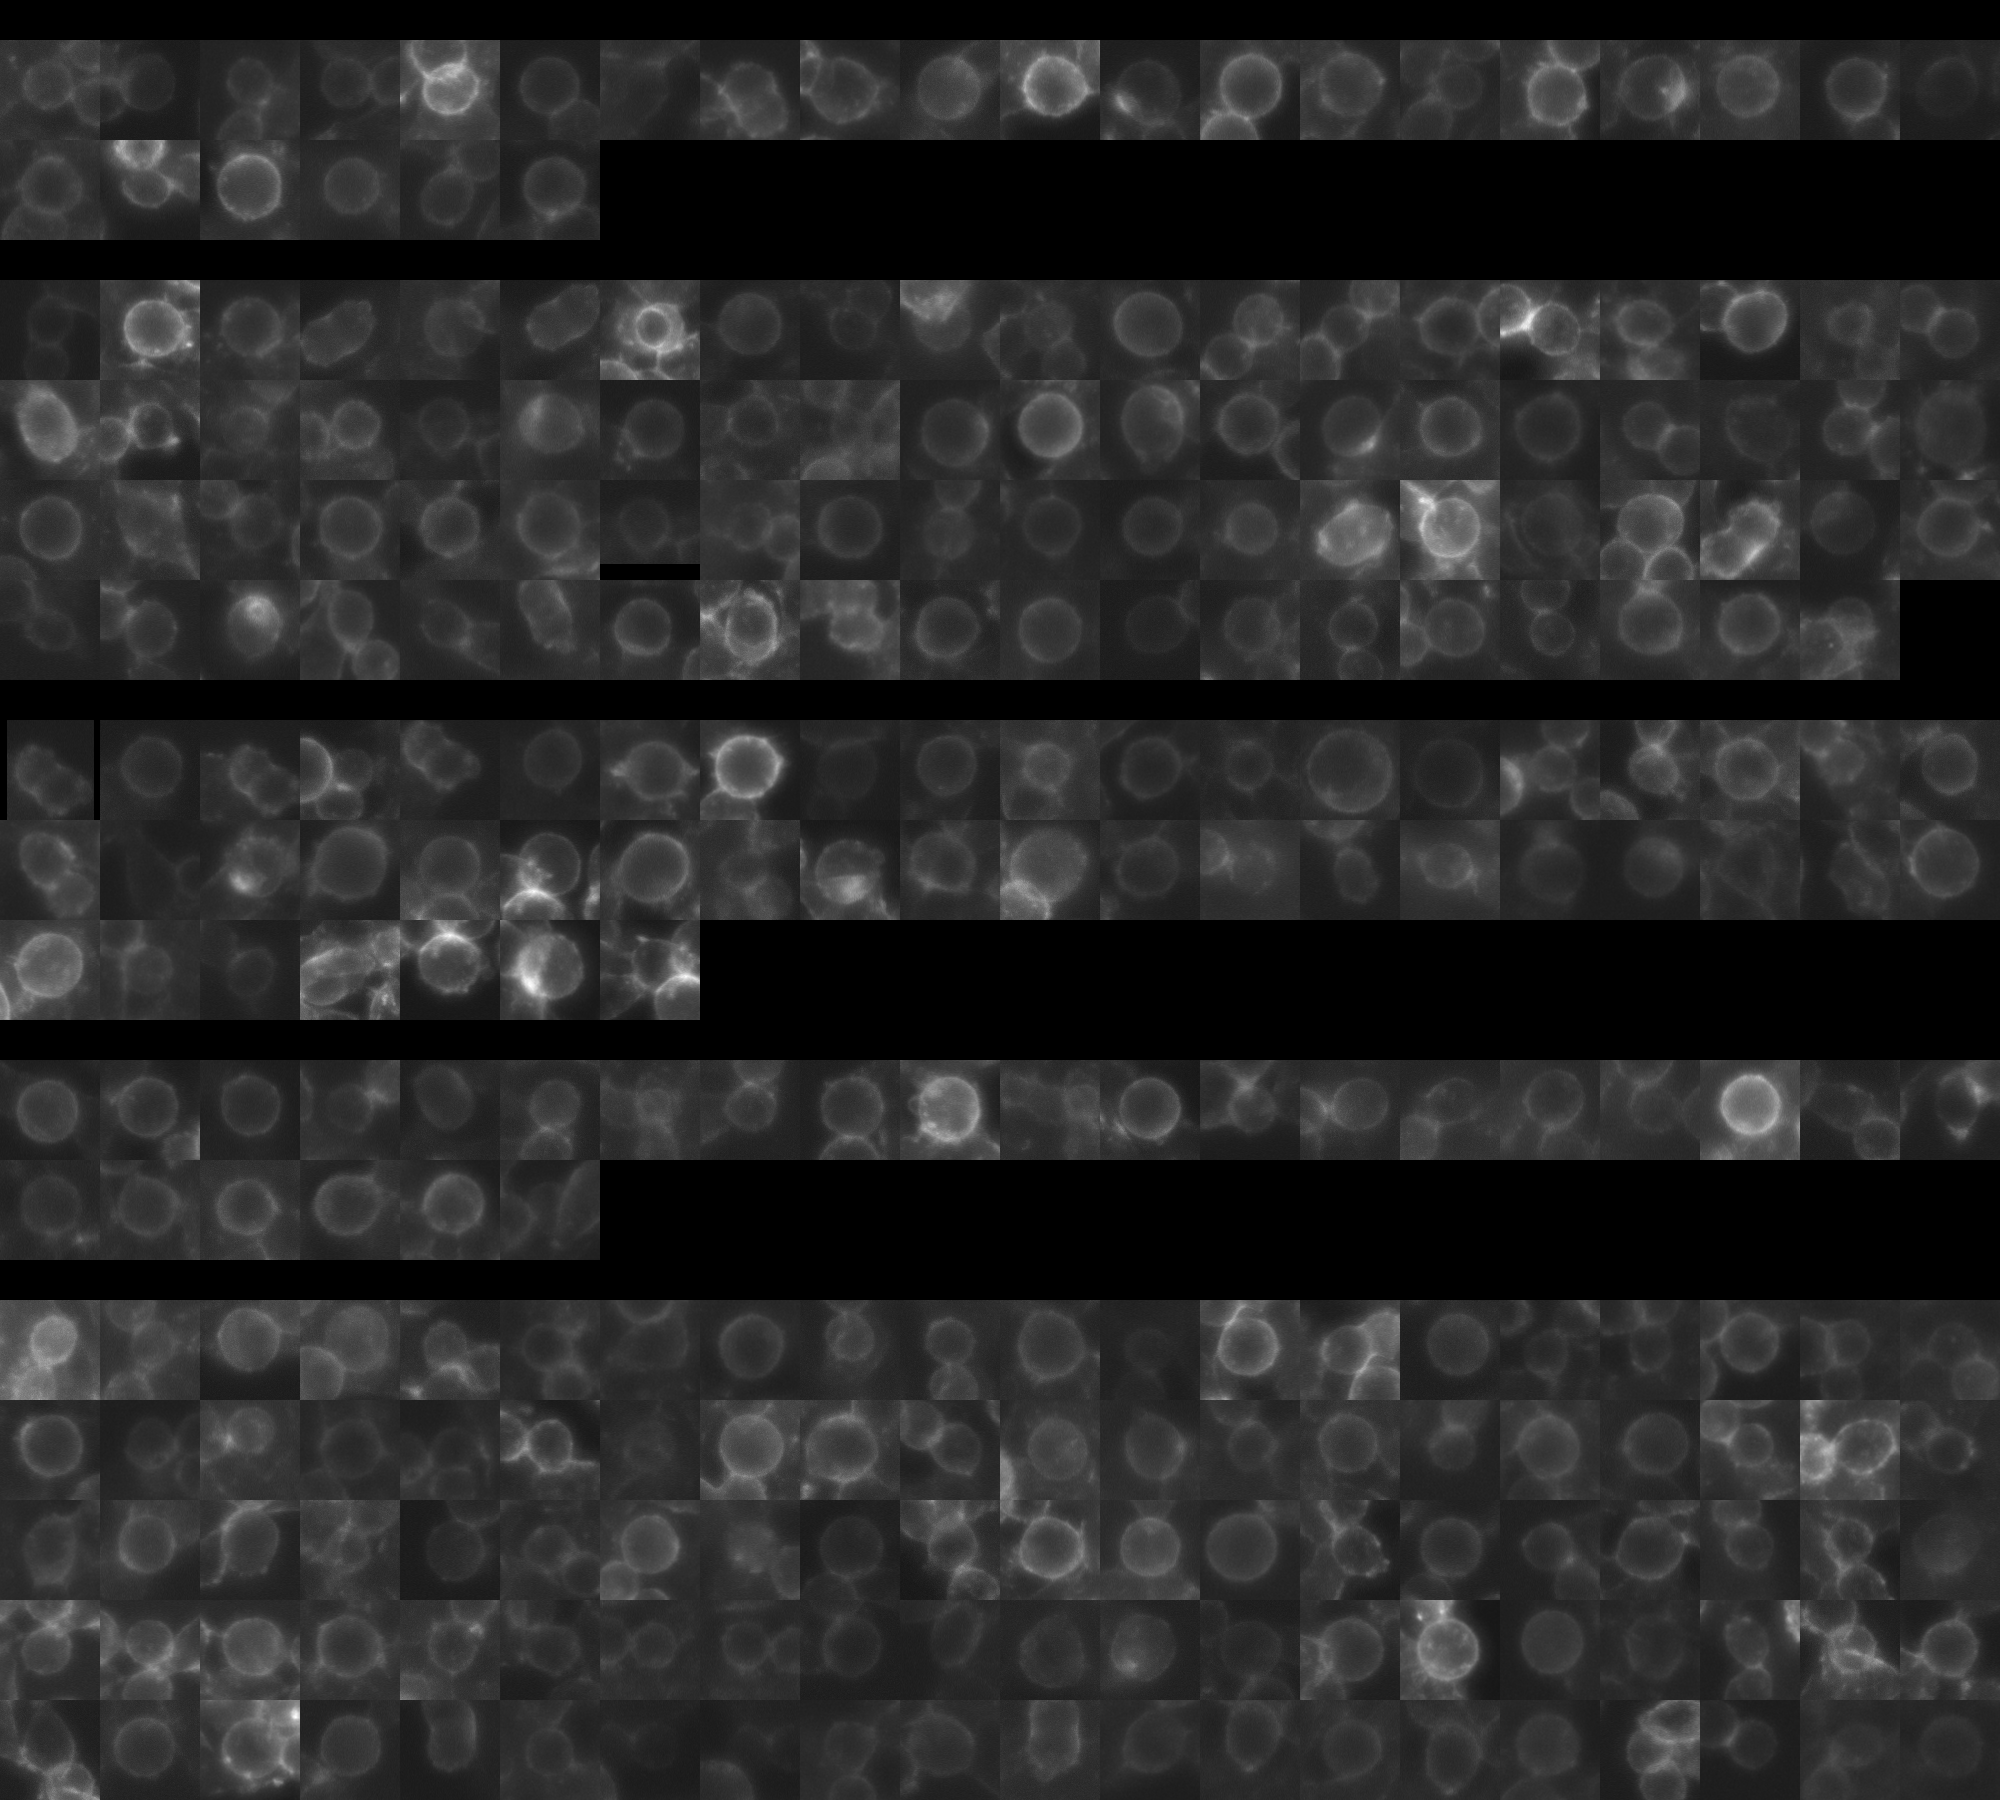
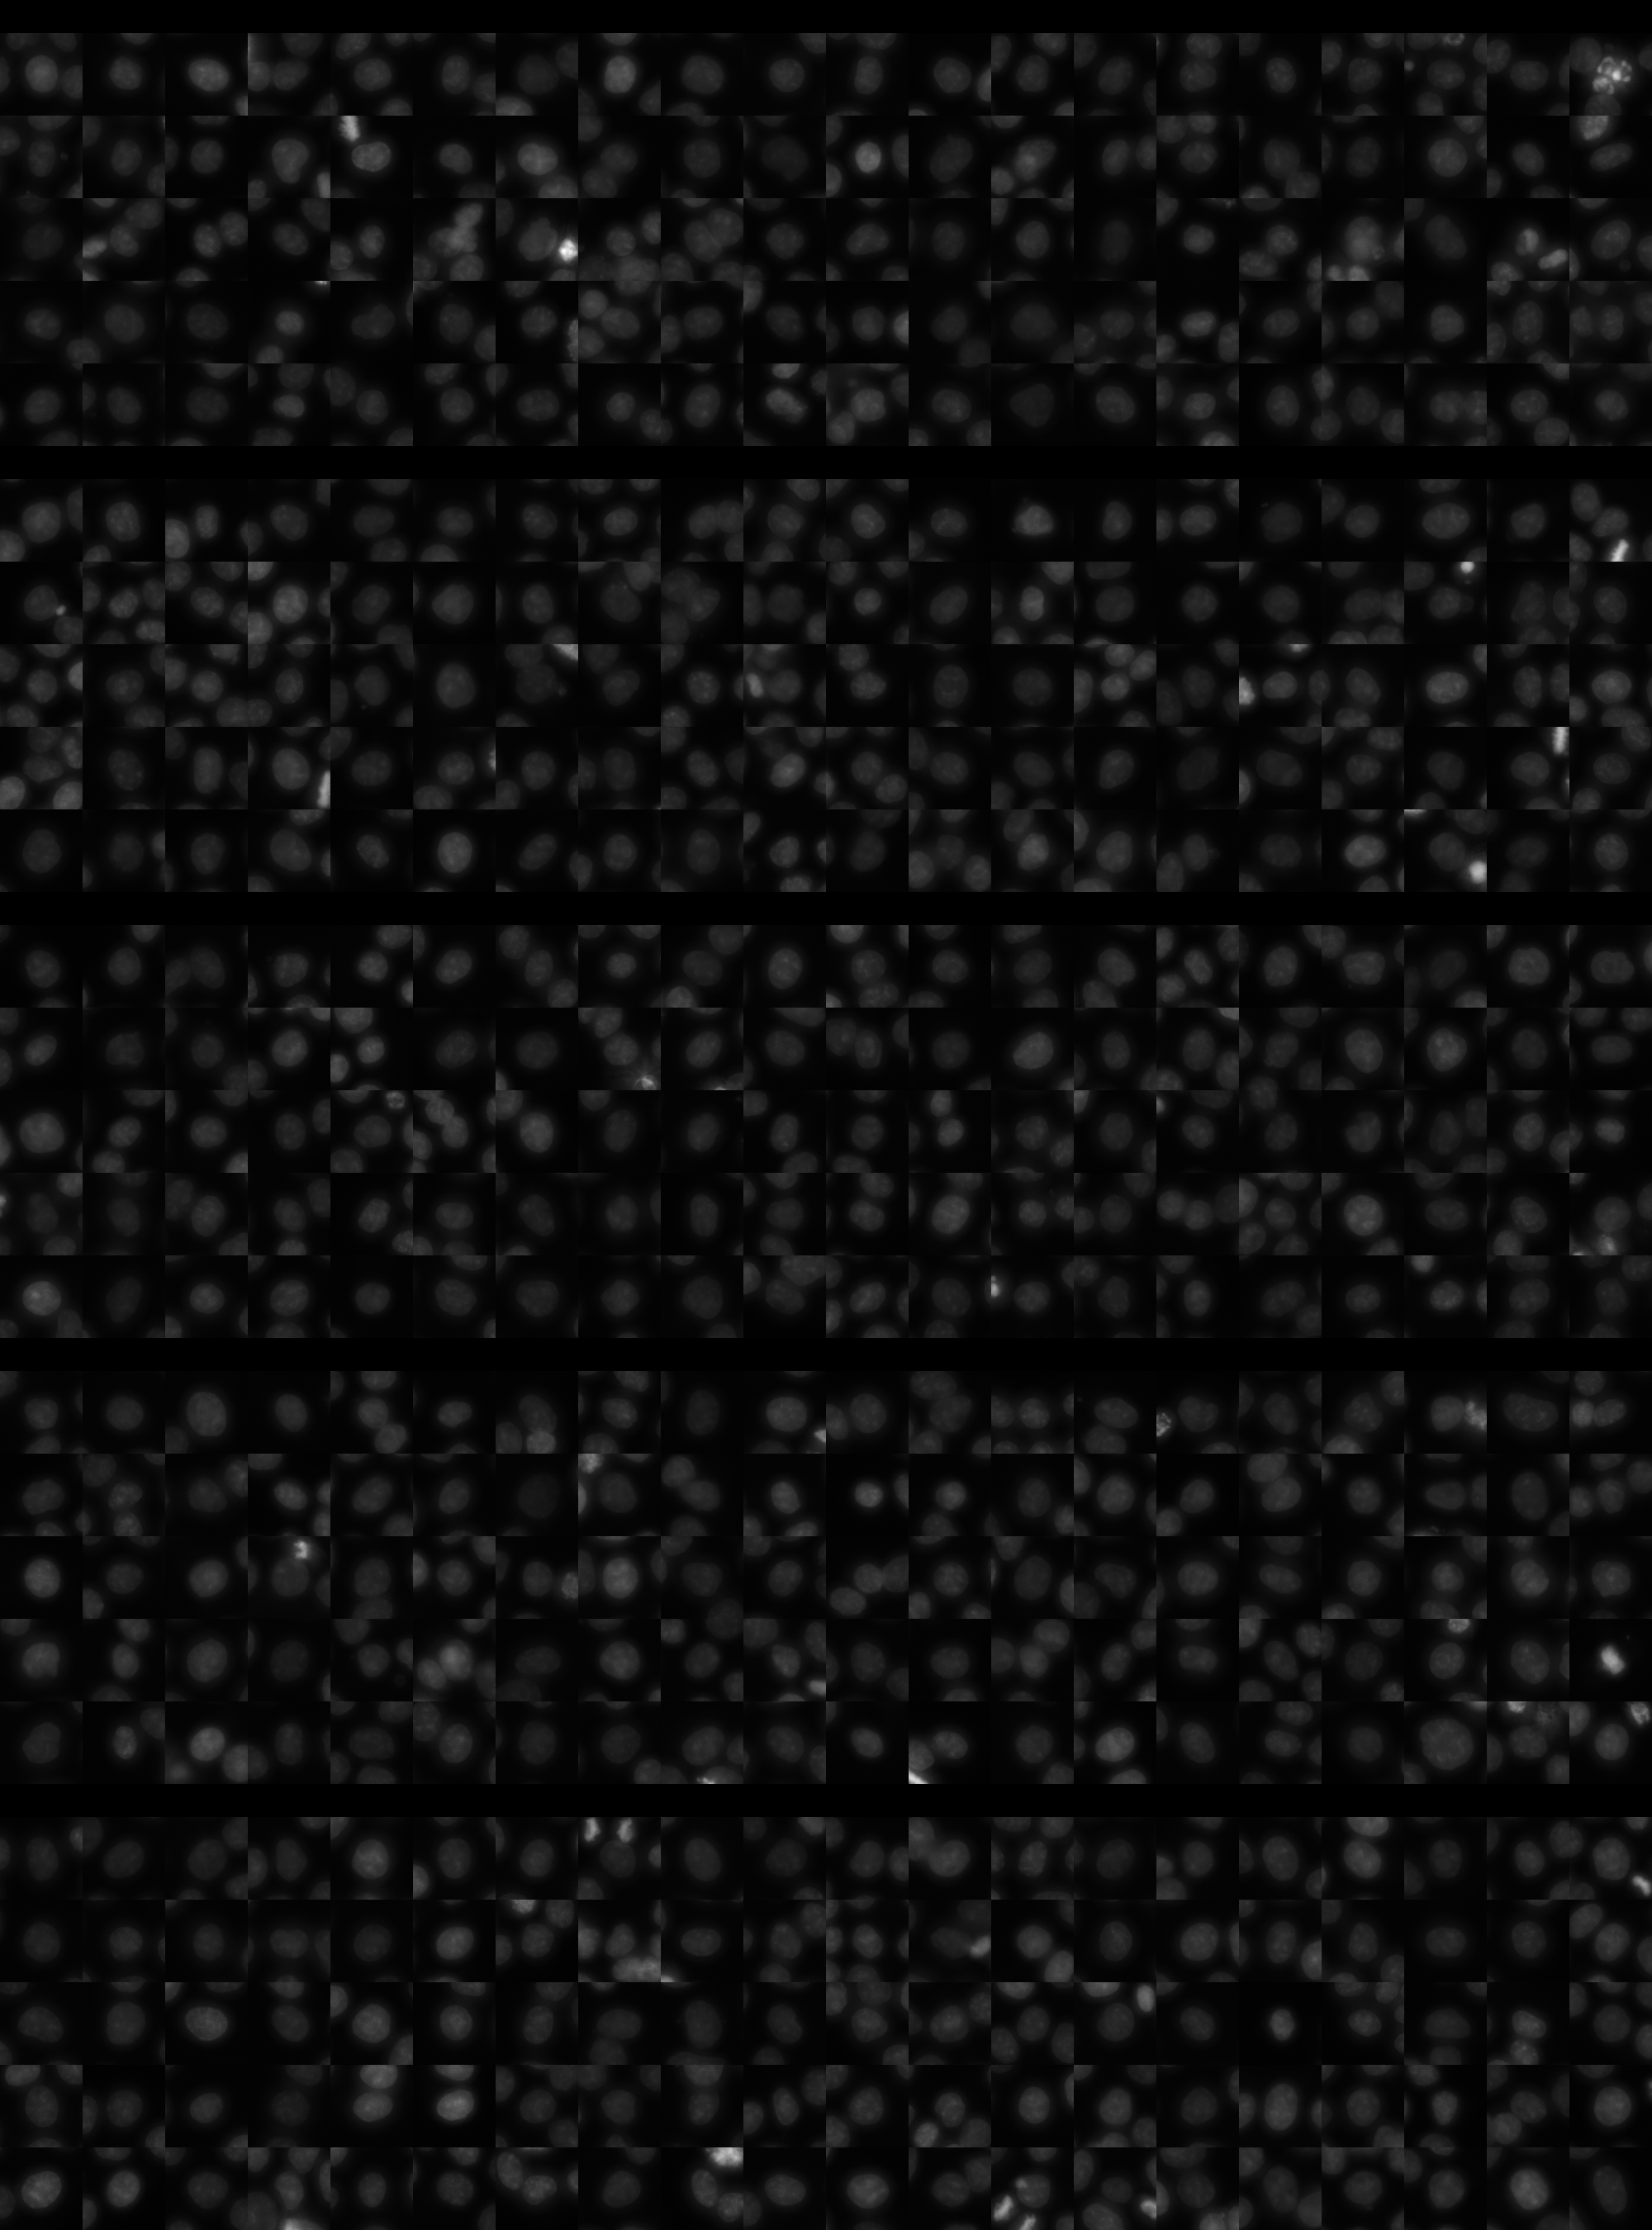
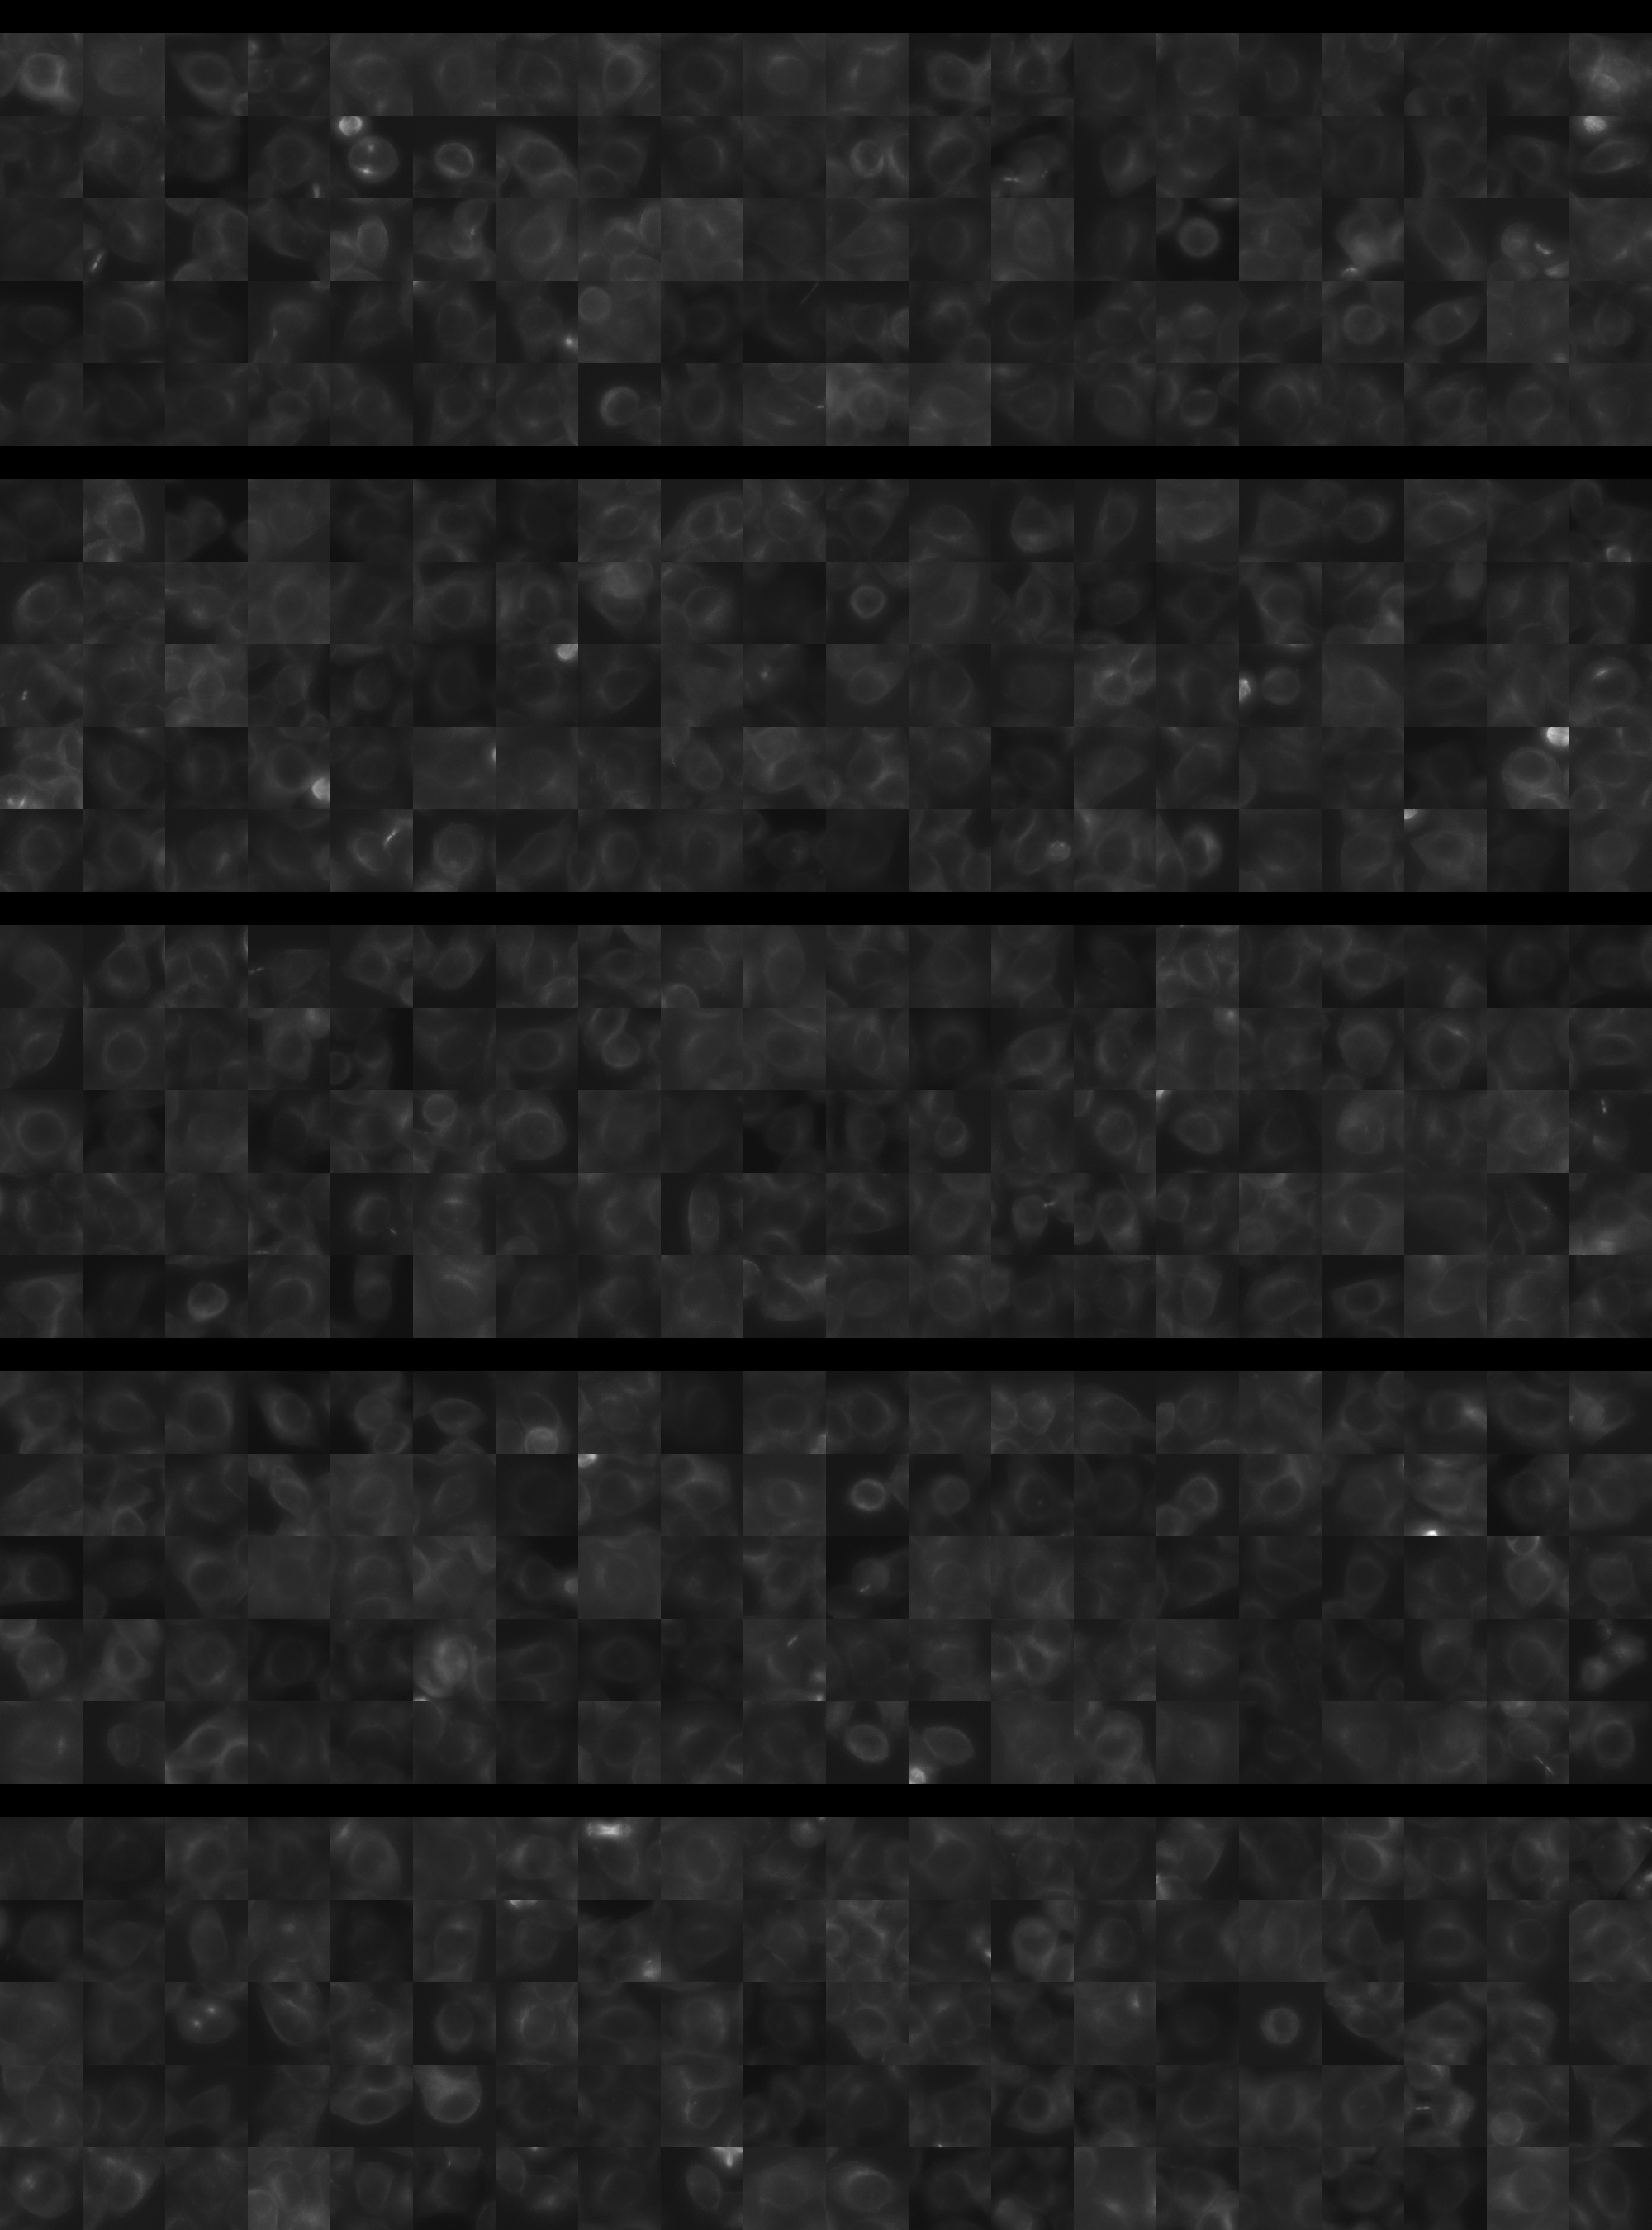
Each montage below shows randomly selected individual cell images for the same target gene separated by sgRNA, along with an example montage of cells expressing a non-targeting negative control sgRNA at the bottom. sgRNA labels in the montages correspond to the numbered sgRNA sequences in the gene info table above. The DNA (blue) and tubulin (green) channels are displayed by default, with gH2AX (grayscale) and actin (yellow) available using the check boxes. Channel brightness, contrast, and opacity are adjustable by clicking the arrow next to the channel name. When only one channel is selected, the display defaults to grayscale. Click the “Zoom” checkbox above the channel controls to enable image zooming (via scrolling) and panning (via click-and-drag).

The cell boxes displayed for this gene are square, 30.36 μm per side for the interphase montage and 30.36 μm per side for the mitotic montage.
Features

Interphase Score Rank FDR q-value
Nucleus DNA Integrated 0.021 2084 of 5322 0.810
Nucleus DNA Mean -7.633e-02 4215 of 5322 0.065
Nucleus gH2AX Mean 0.073 2763 of 5322 0.060
Nucleus DNA - gH2AX Correlation -2.556e-02 1578 of 5322 0.367
Nucleus Shape Area 0.047 1747 of 5322 0.447
Nucleus Shape Eccentricity -5.157e-02 4840 of 5322 0.178
Nucleus Shape Form Factor -1.239e-01 4748 of 5322 0.002
Nucleus Shape Solidity -1.307e-01 4718 of 5322 1.903e-04
Cell DNA Mass Displacement 0.088 306 of 5322 0.038
Cell Tubulin Mean -7.712e-02 4731 of 5322 0.073
Cell Tubulin Mass Displacement -6.128e-02 4926 of 5322 0.110
Cell Actin Mean -1.028e-01 4938 of 5322 0.013
Cell Tubulin - Actin Correlation 0.026 2359 of 5322 0.570
Cell DNA - Tubulin Correlation 0.146 519 of 5322 6.750e-04
Cell Shape Area 0.074 947 of 5322 0.182
Cell Shape Eccentricity 0.021 2071 of 5322 0.794
Mitotic Score Rank FDR q-value
Nucleus DNA Integrated 0.032 3507 of 5322 0.996
Nucleus DNA Mean -2.128e-01 5030 of 5322 1.000
Nucleus DNA Mass Displacement 0.178 948 of 5322 0.999
Nucleus DNA Mean Frac 3 -7.382e-02 4150 of 5322 1.000
Nucleus gH2AX Mean -2.055e-02 3224 of 5322 1.000
Nucleus gH2AX Mean Frac 0 0.111 864 of 5322 1.000
Nucleus Tubulin Mean Frac 0 0.097 2015 of 5322 0.999
Nucleus Tubulin Mean Edge -5.697e-02 3893 of 5322 0.999
Nucleus Tubulin Std Edge 0.067 1657 of 5322 0.999
Nucleus Shape Area 0.059 3210 of 5322 0.990
Nucleus Shape Eccentricity -6.898e-02 3154 of 5322 1.000
Nucleus Shape Form Factor -2.924e-01 4762 of 5322 0.998
Cell Tubulin Mean 0.069 2512 of 5322 0.997
Cell Tubulin Mean Frac 3 0.034 1305 of 5322 0.999
Cell Actin Mean 0.021 2921 of 5322 1.000
Cell Shape Area 0.045 3353 of 5322 0.999
( Reset Zoom )
Brightness
Contrast
Opacity
Brightness
Contrast
Opacity
Brightness
Contrast
Opacity
Brightness
Contrast
Opacity
Brightness
Contrast
Opacity

( Reset Zoom )
Brightness
Contrast
Opacity
Brightness
Contrast
Opacity
Brightness
Contrast
Opacity
Brightness
Contrast
Opacity
Brightness
Contrast
Opacity

MIT Central Accessability