ABI3

Gene symbol: ABI3
Gene: 51225
Uniprot Function: May inhibit tumor metastasis (By similarity). In vitro, reduces cell motility.
Mitotic Index 0.0327
Interphase Cluster: #53 (30 genes)
Mitotic Cluster: #97 (24 genes)
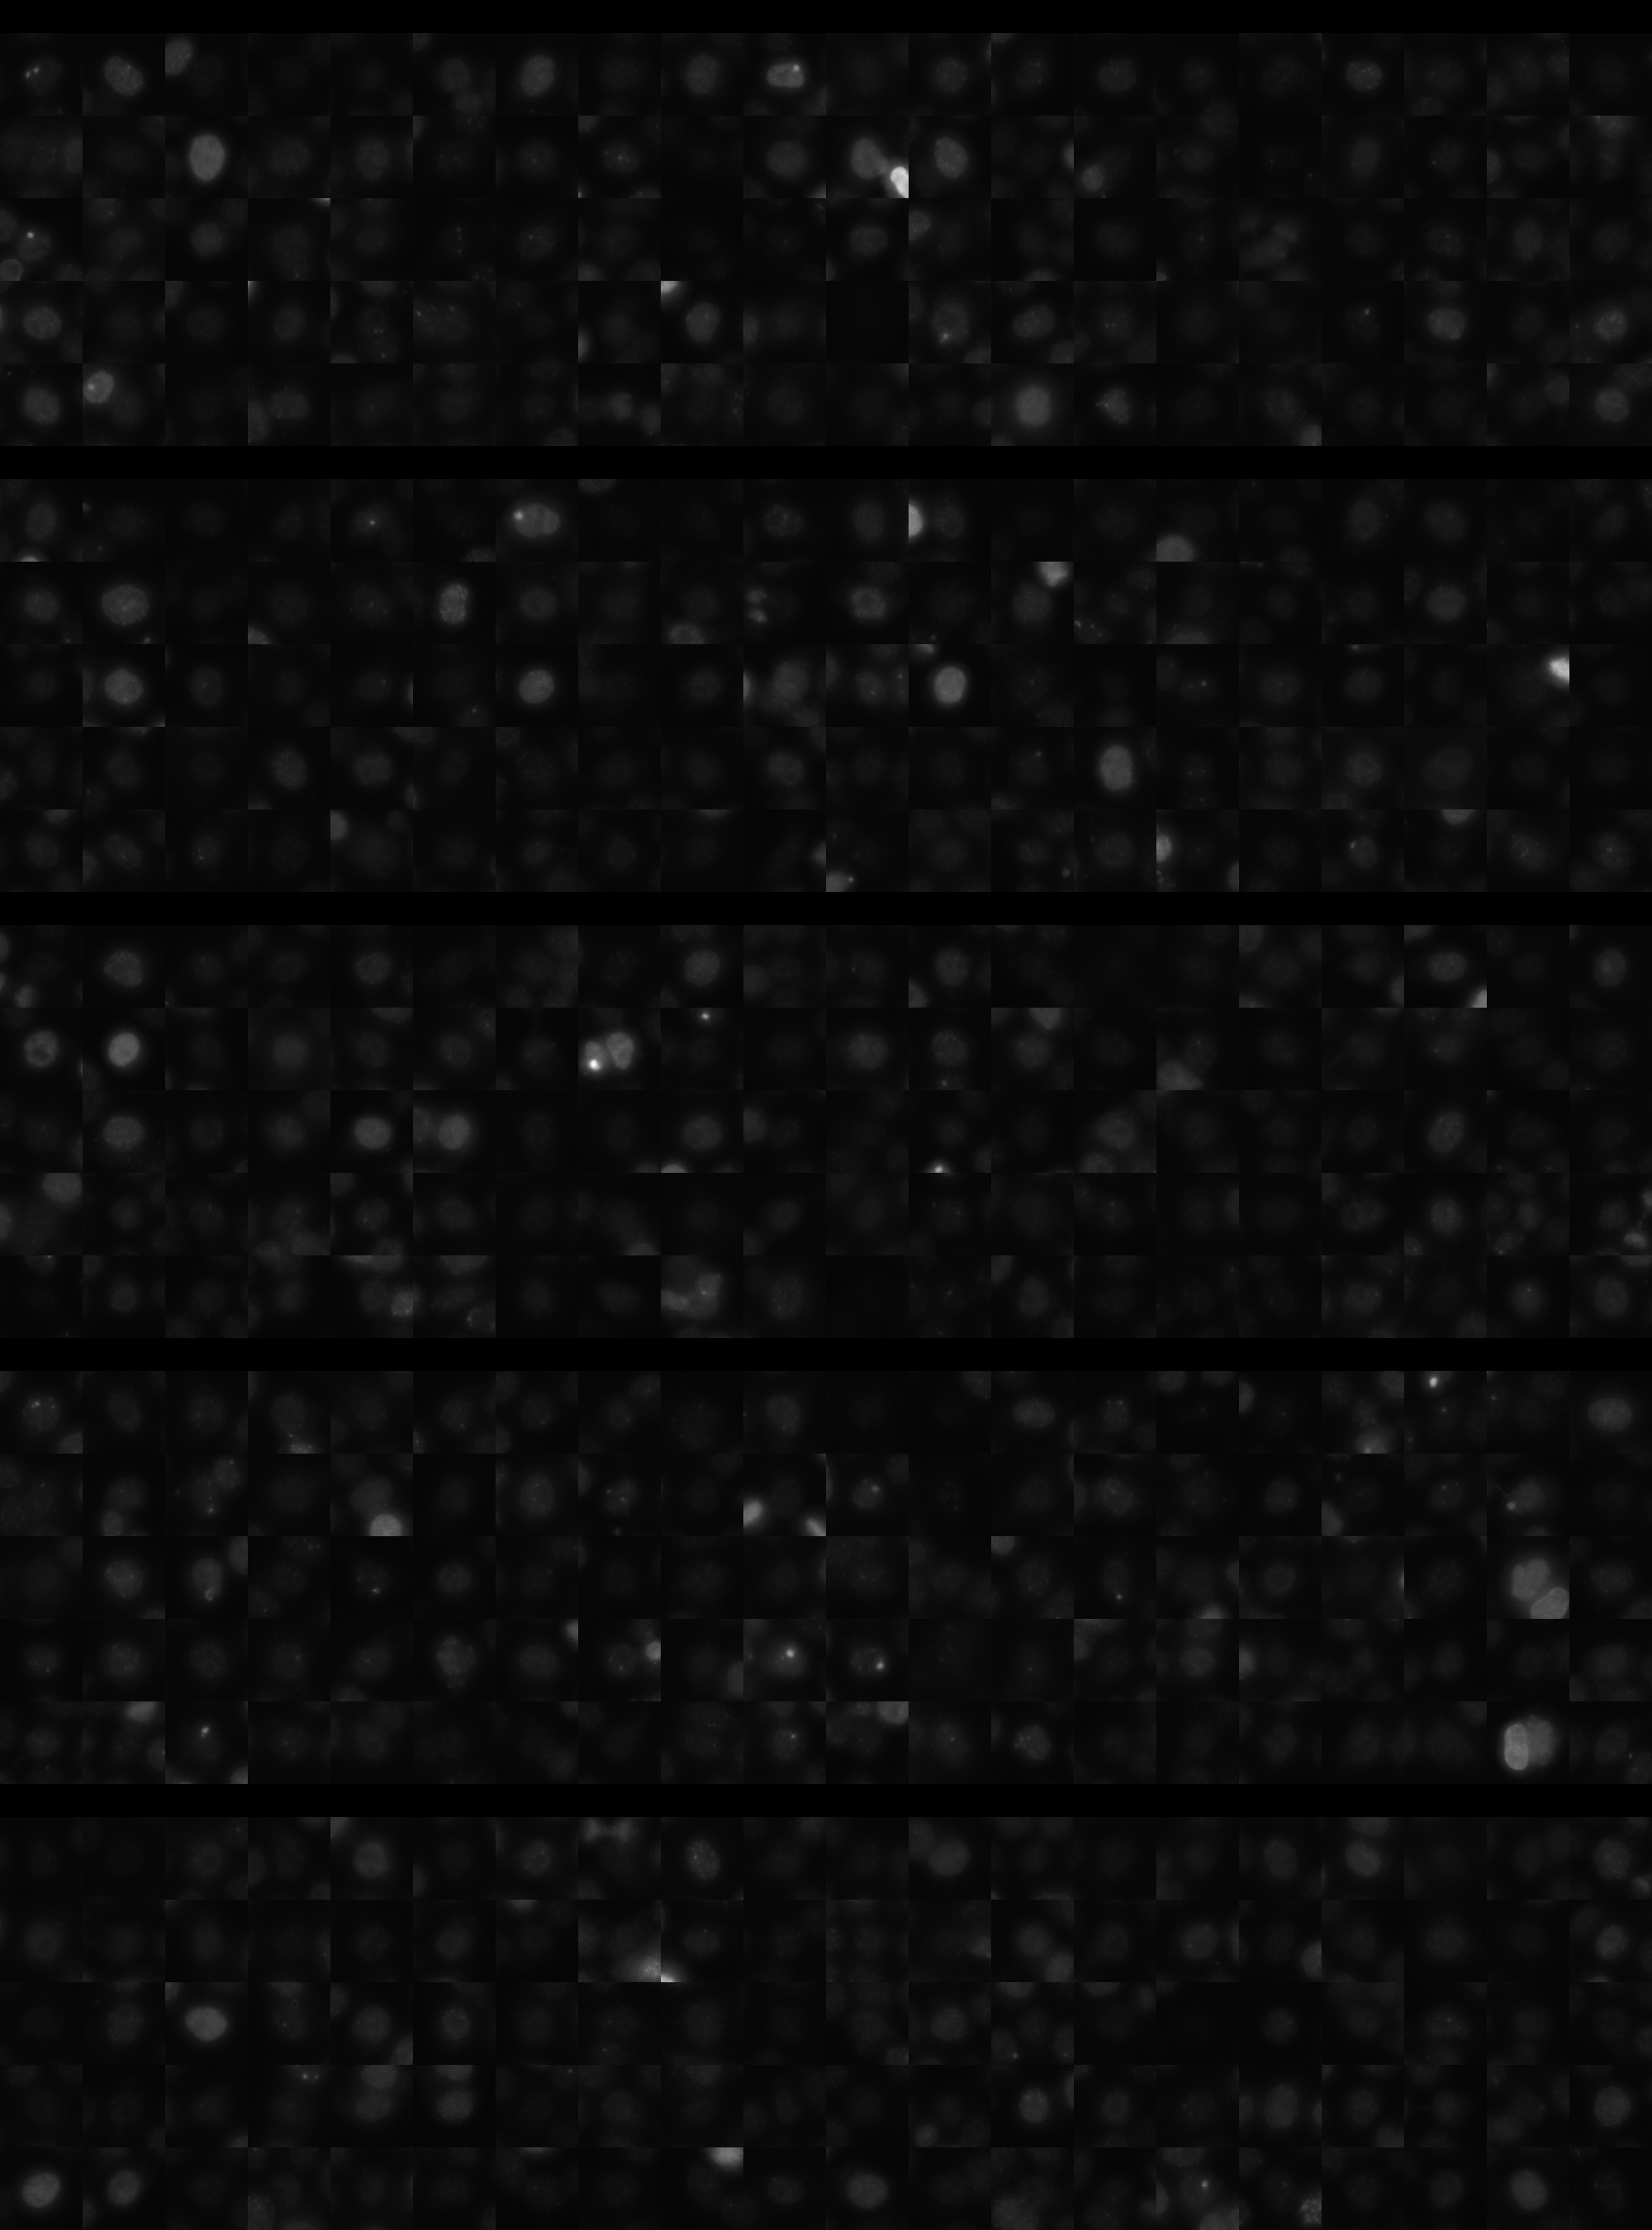
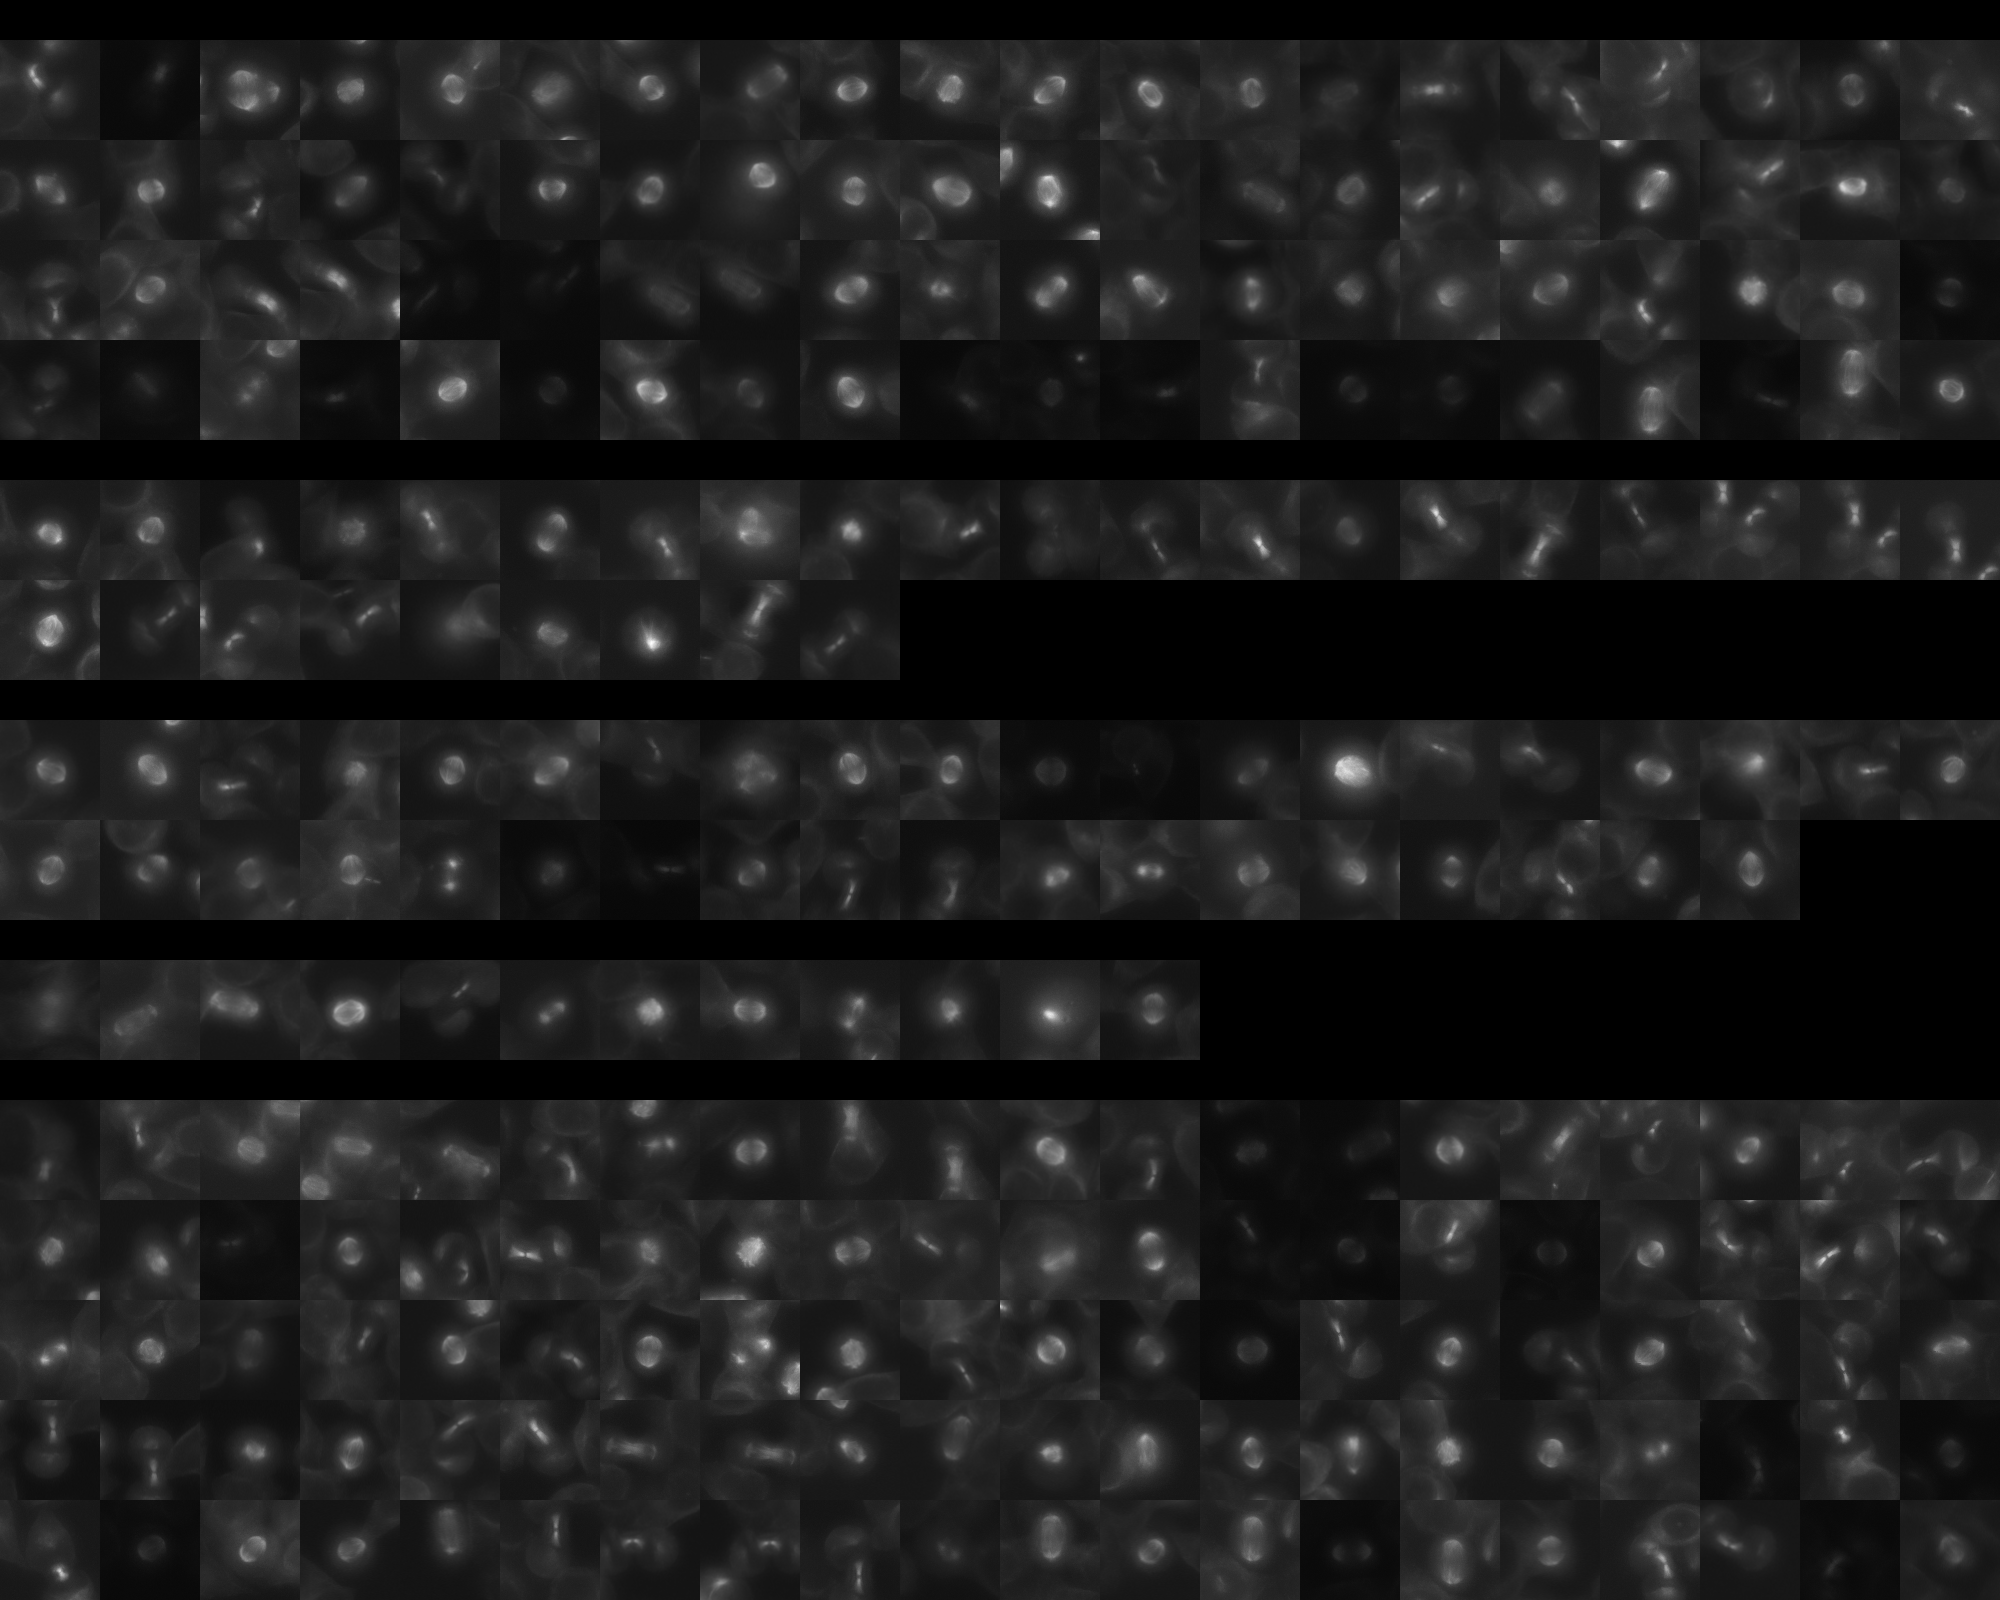
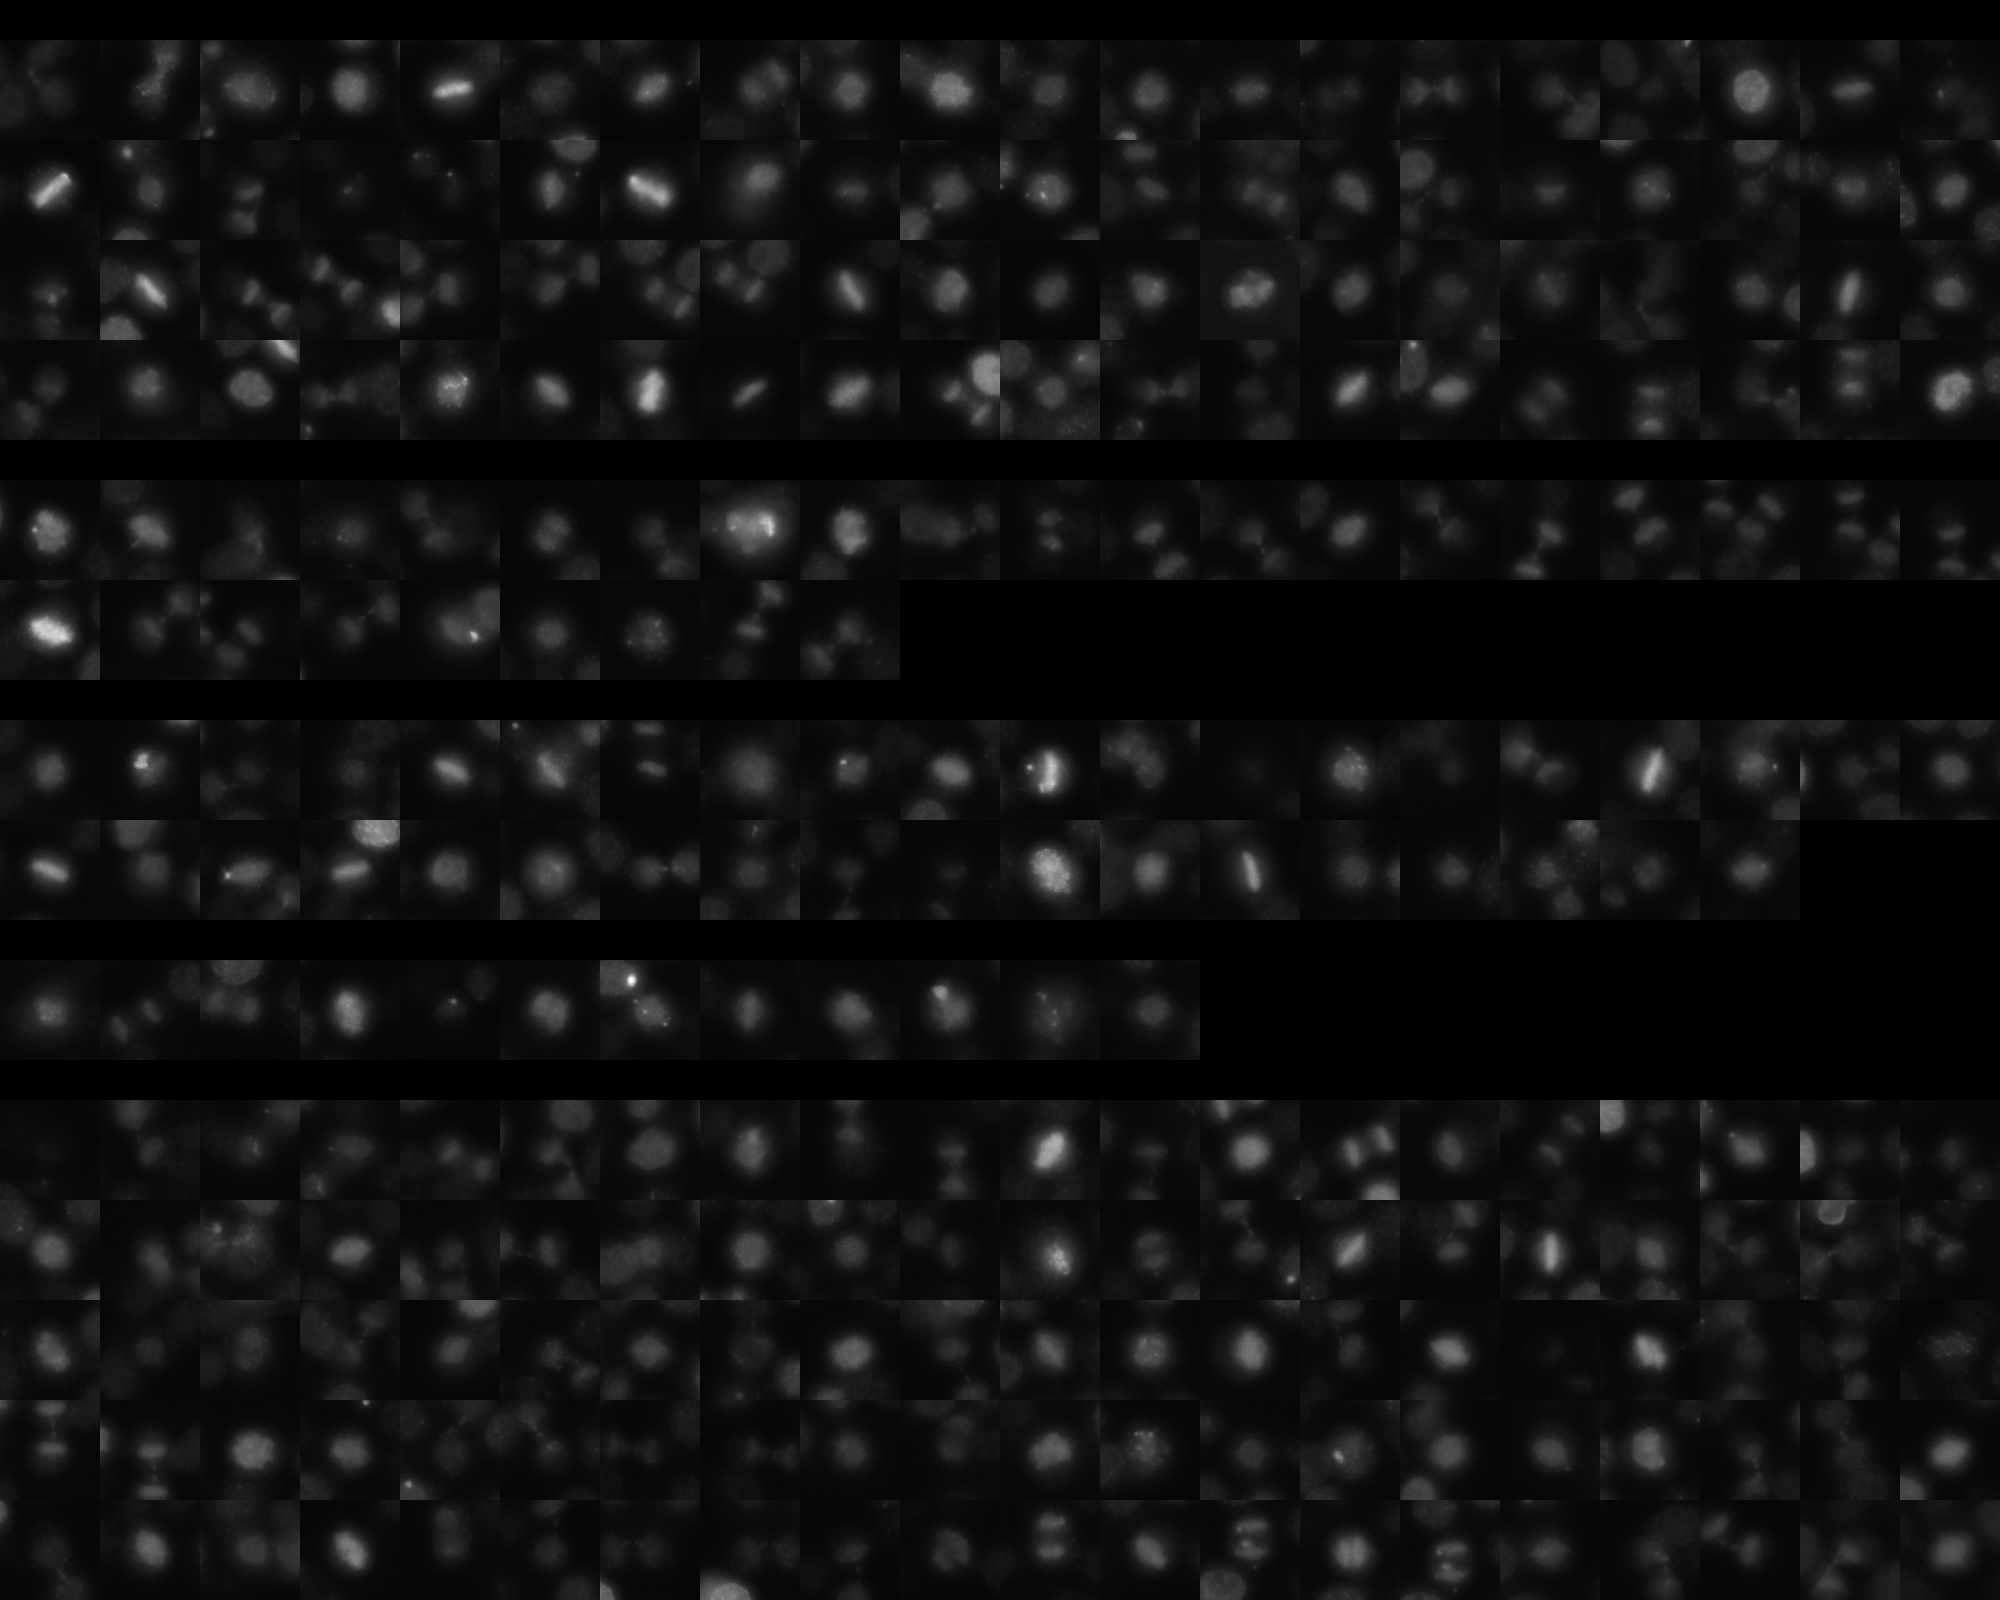
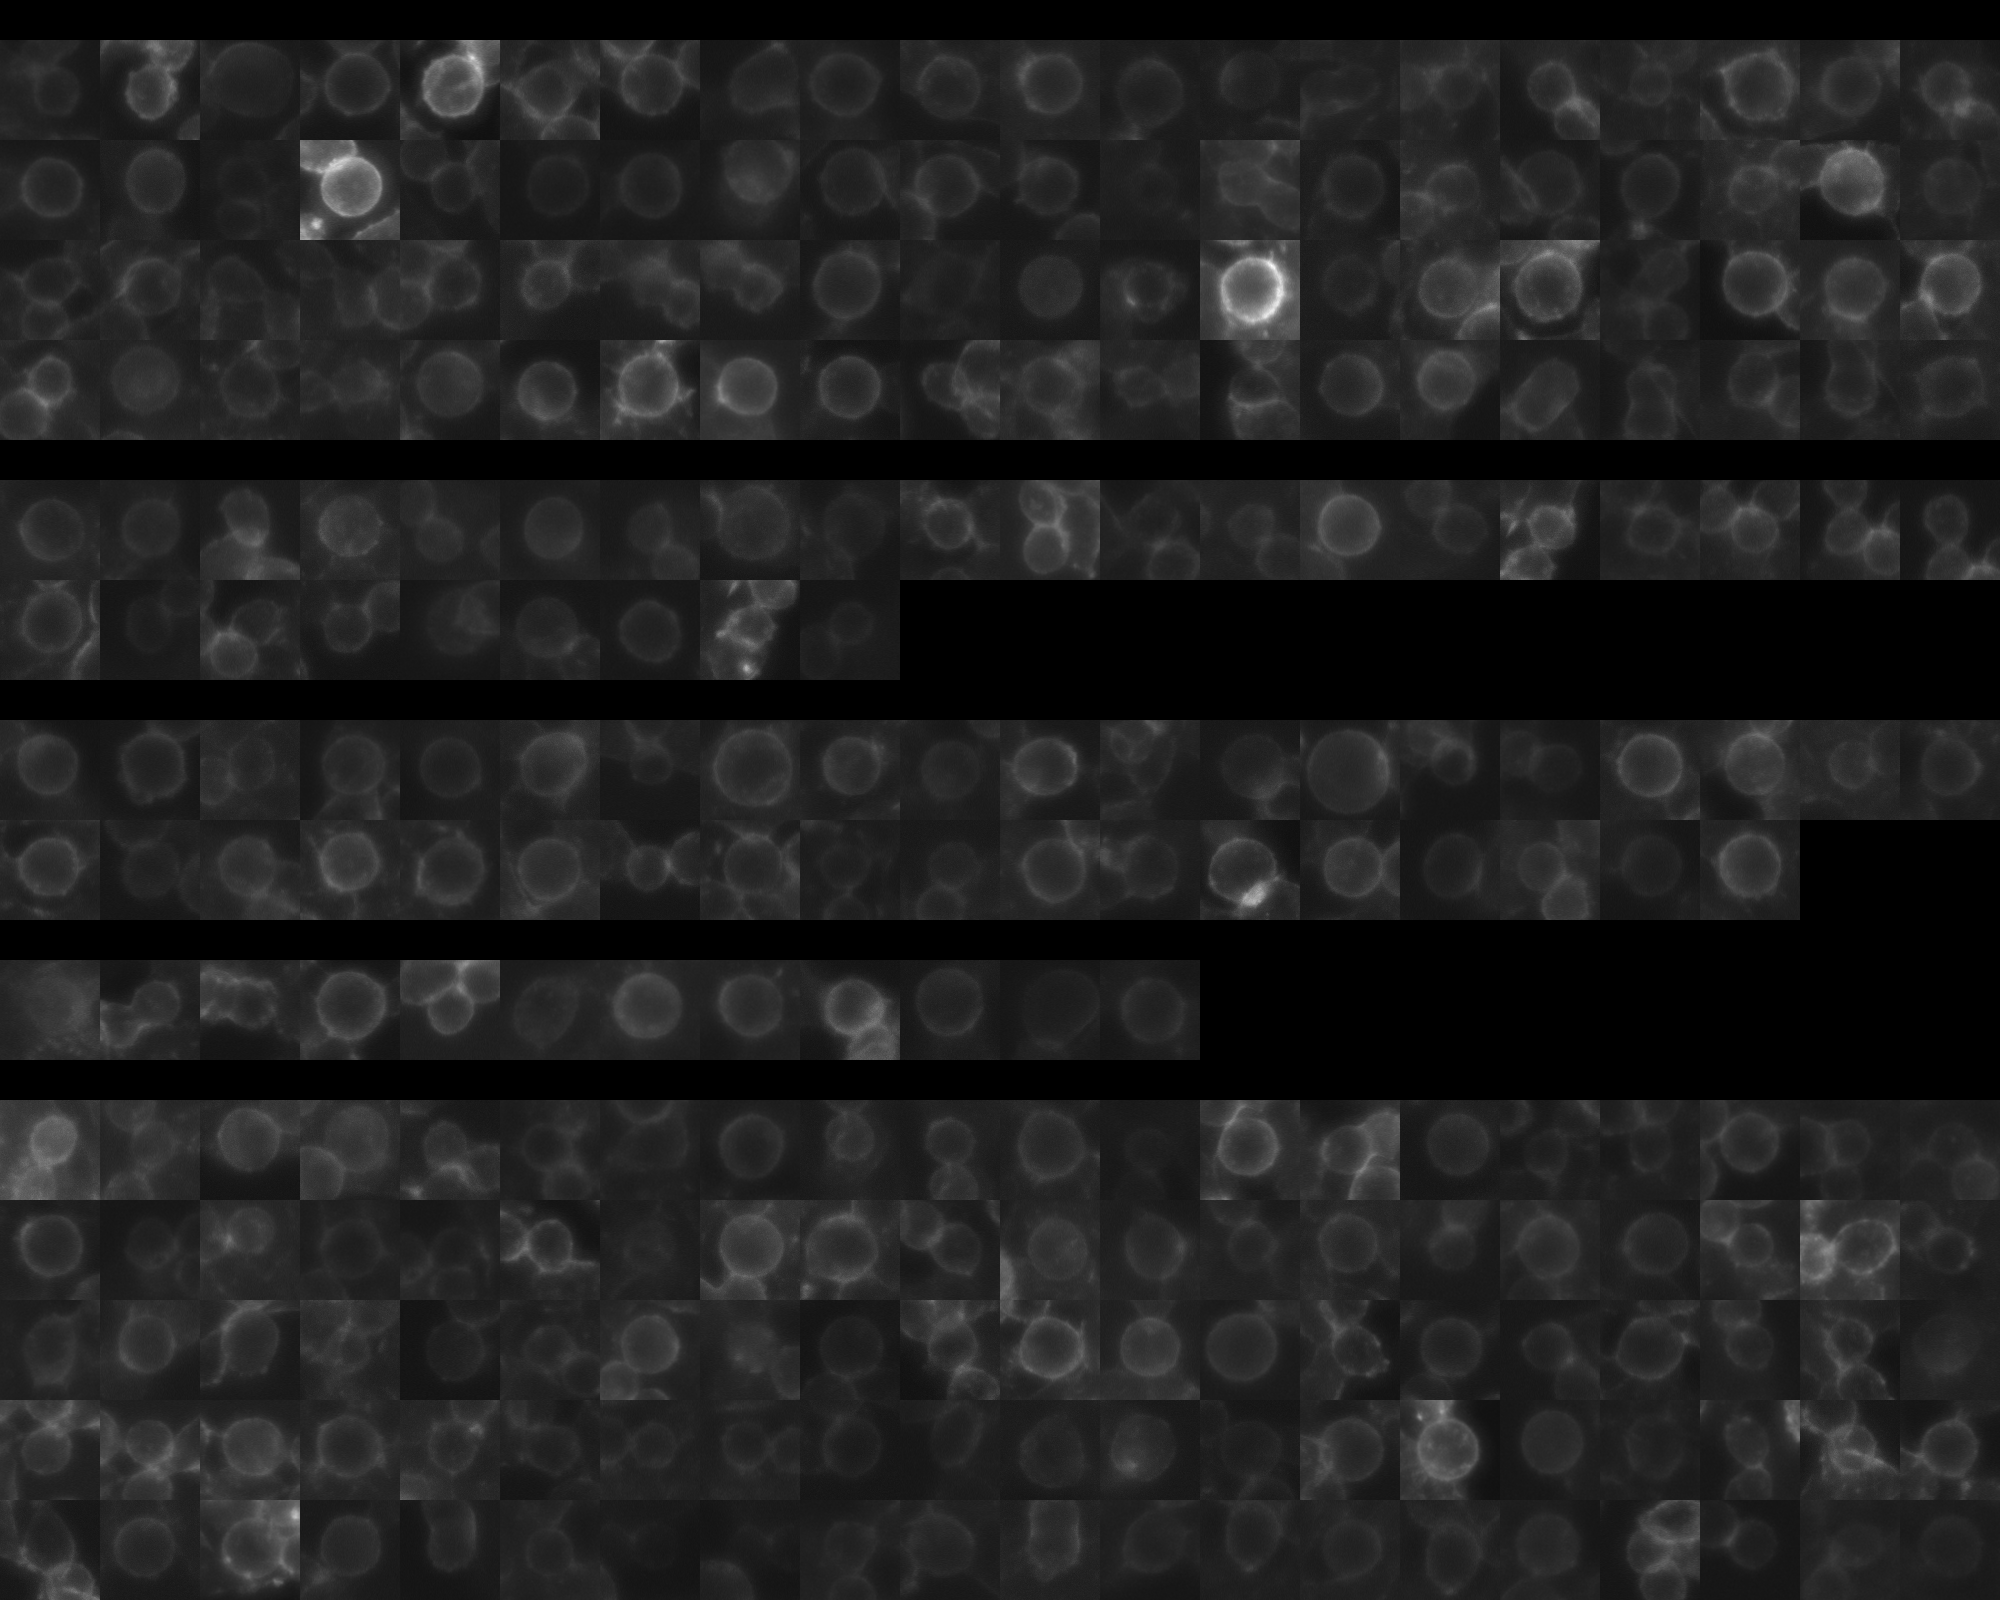
sgRNA 1: GCAACCACAGTGCCCTGCTG (interphase cells: 2405, mitotic cells: 80)
sgRNA 2: GCGATGACCTTCTGGCCGGG (interphase cells: 522, mitotic cells: 29)
sgRNA 3: TCAGGCCACAGACAAGCGGA (interphase cells: 1402, mitotic cells: 38)
sgRNA 4: TGCCTGGGTAGTGAAGGCCA (interphase cells: 370, mitotic cells: 12)

Interphase Cluster

Mitotic Cluster

Overview

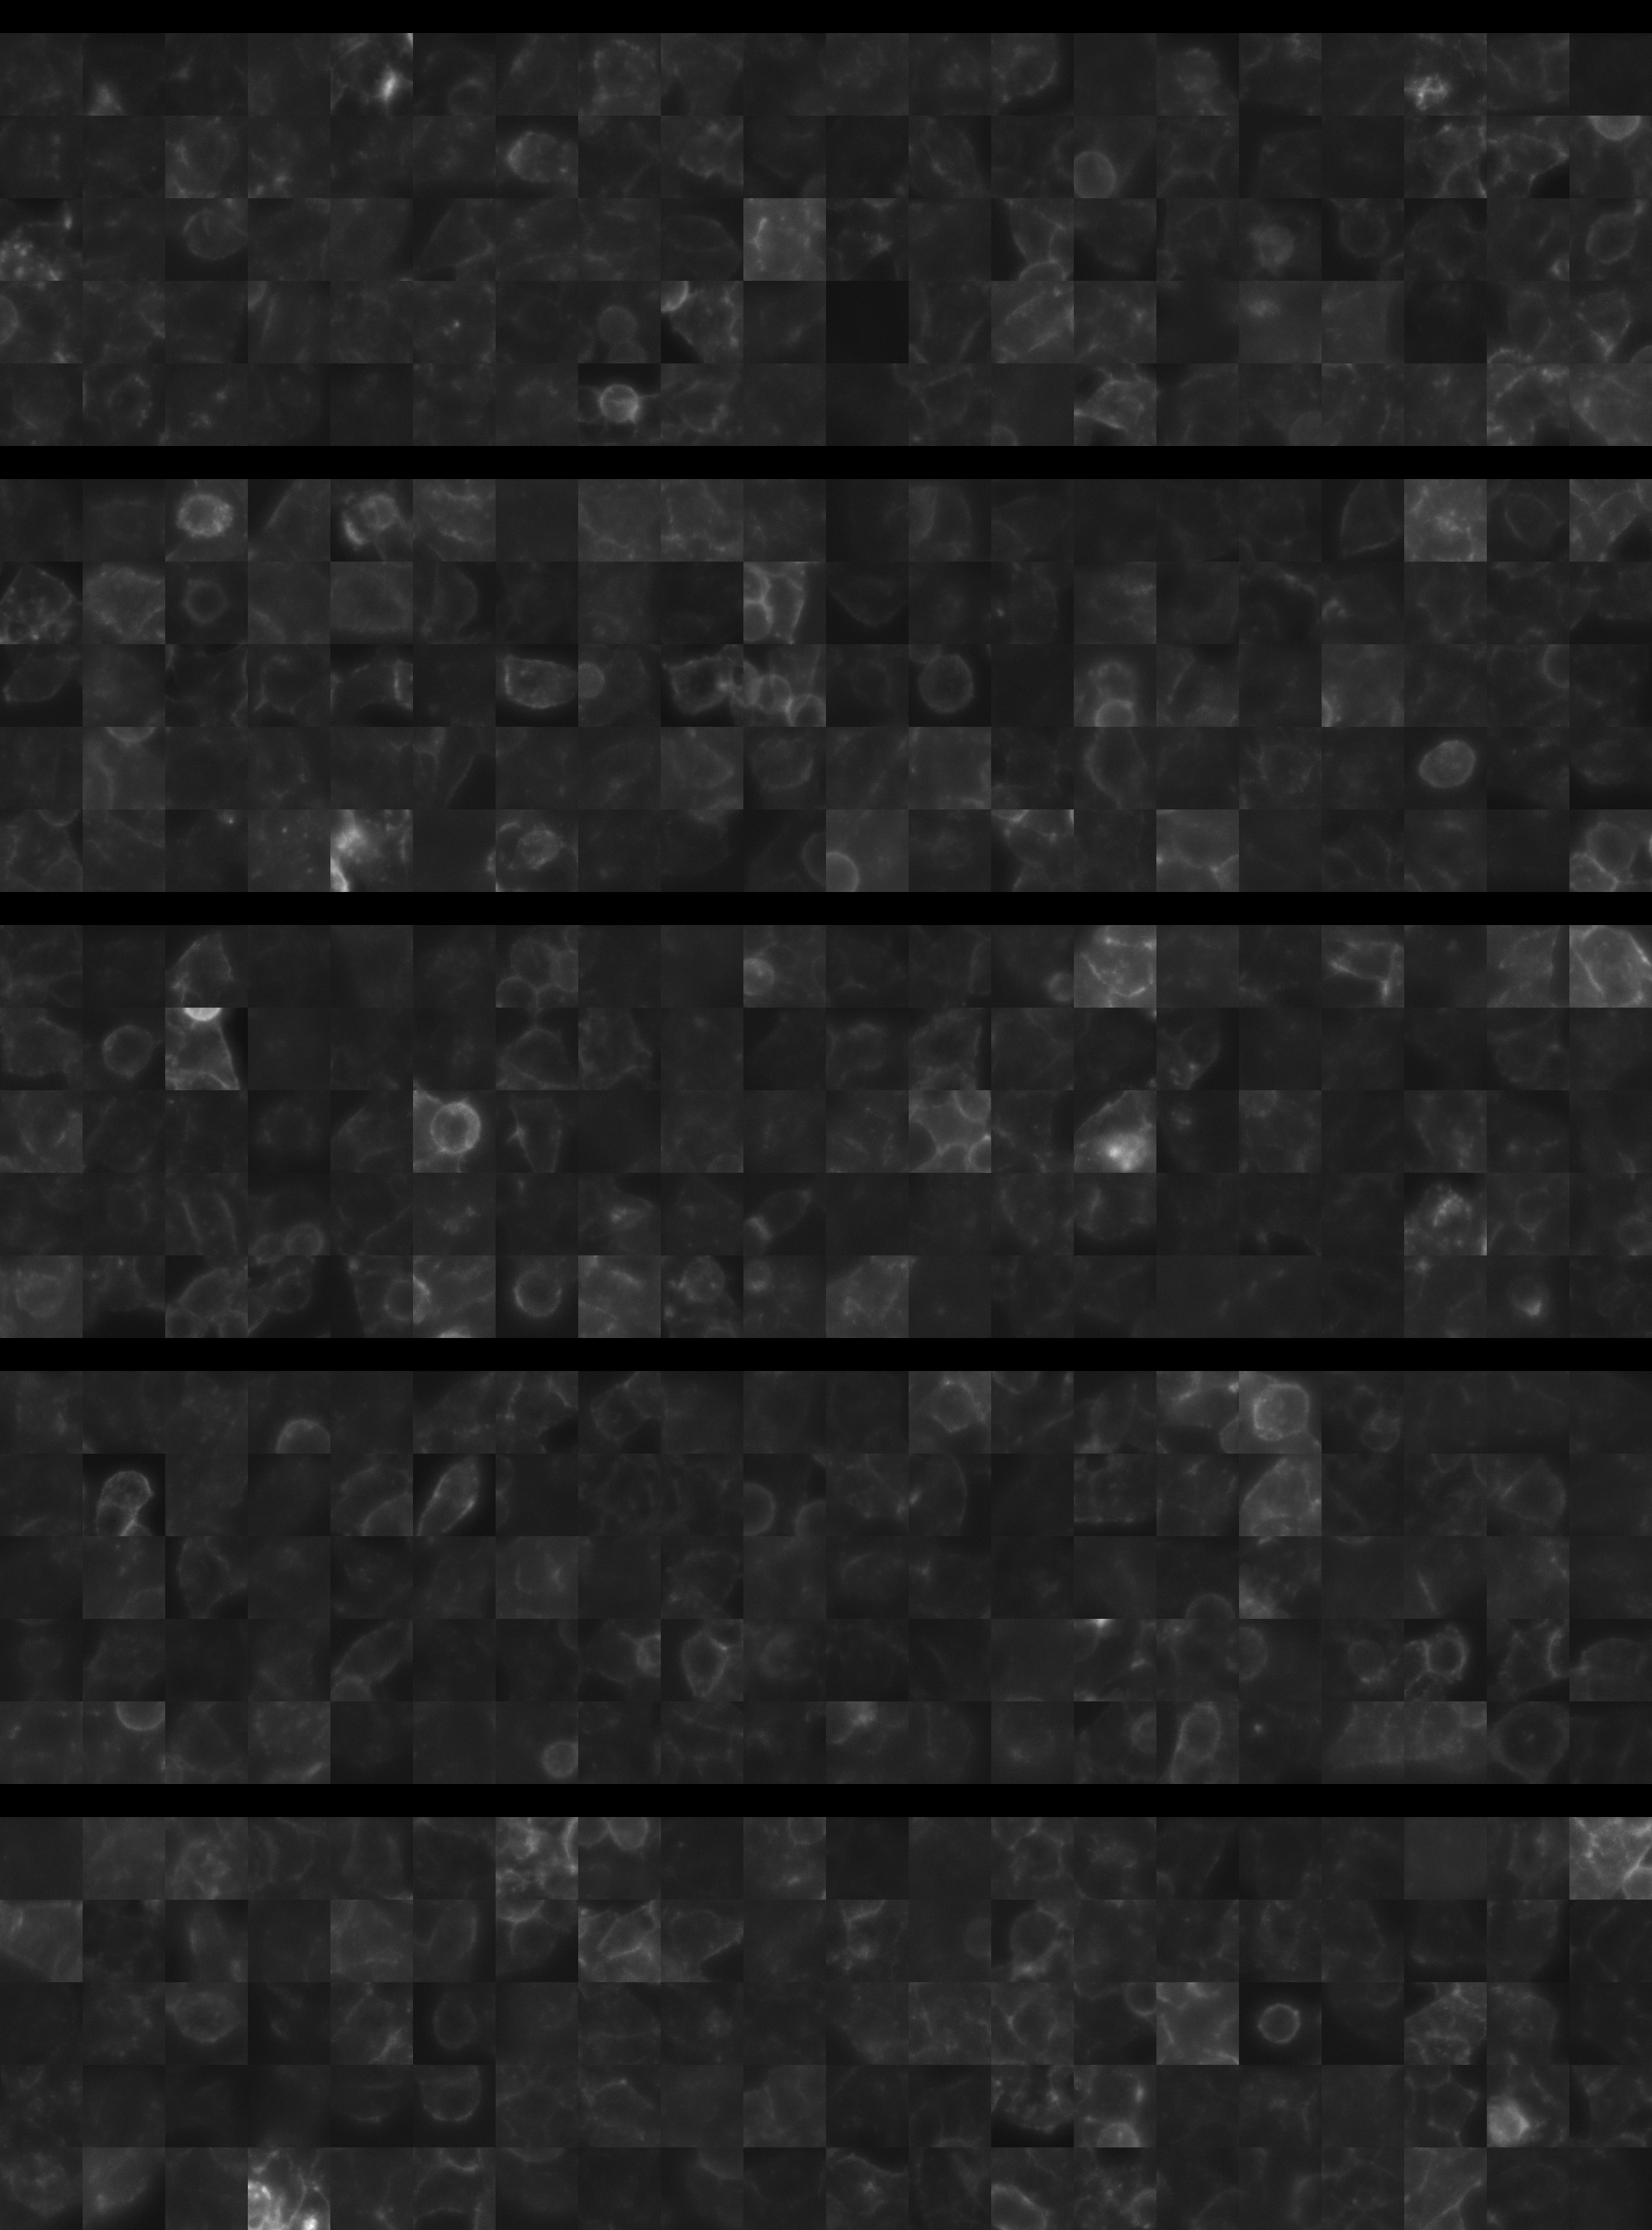
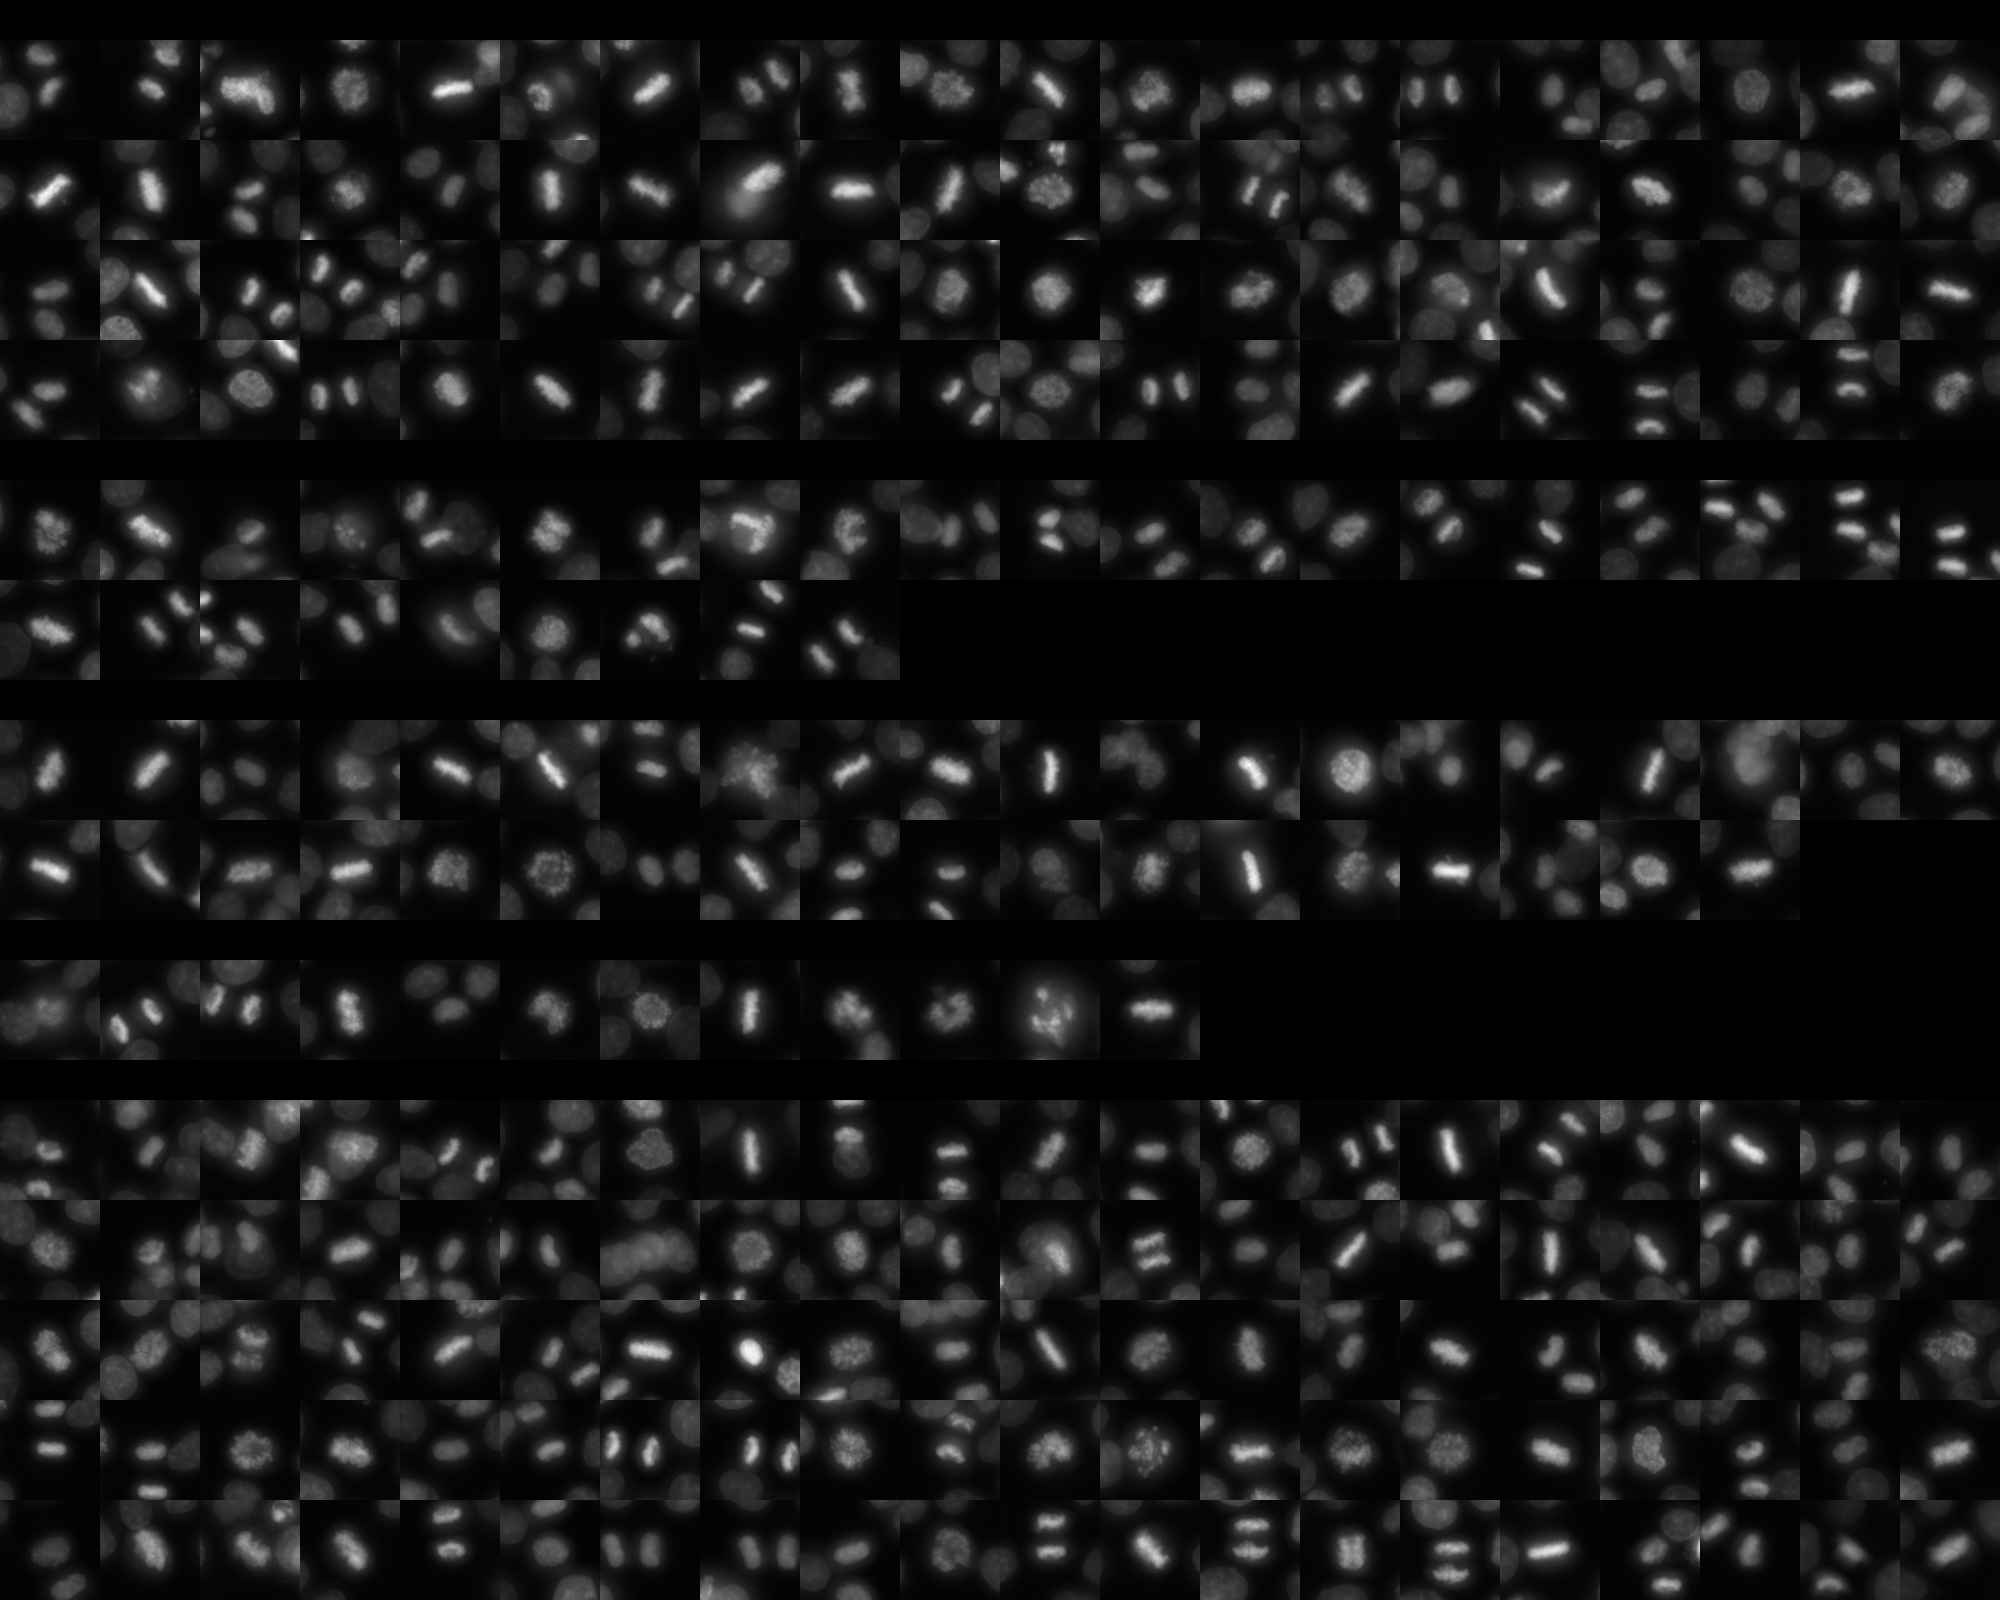
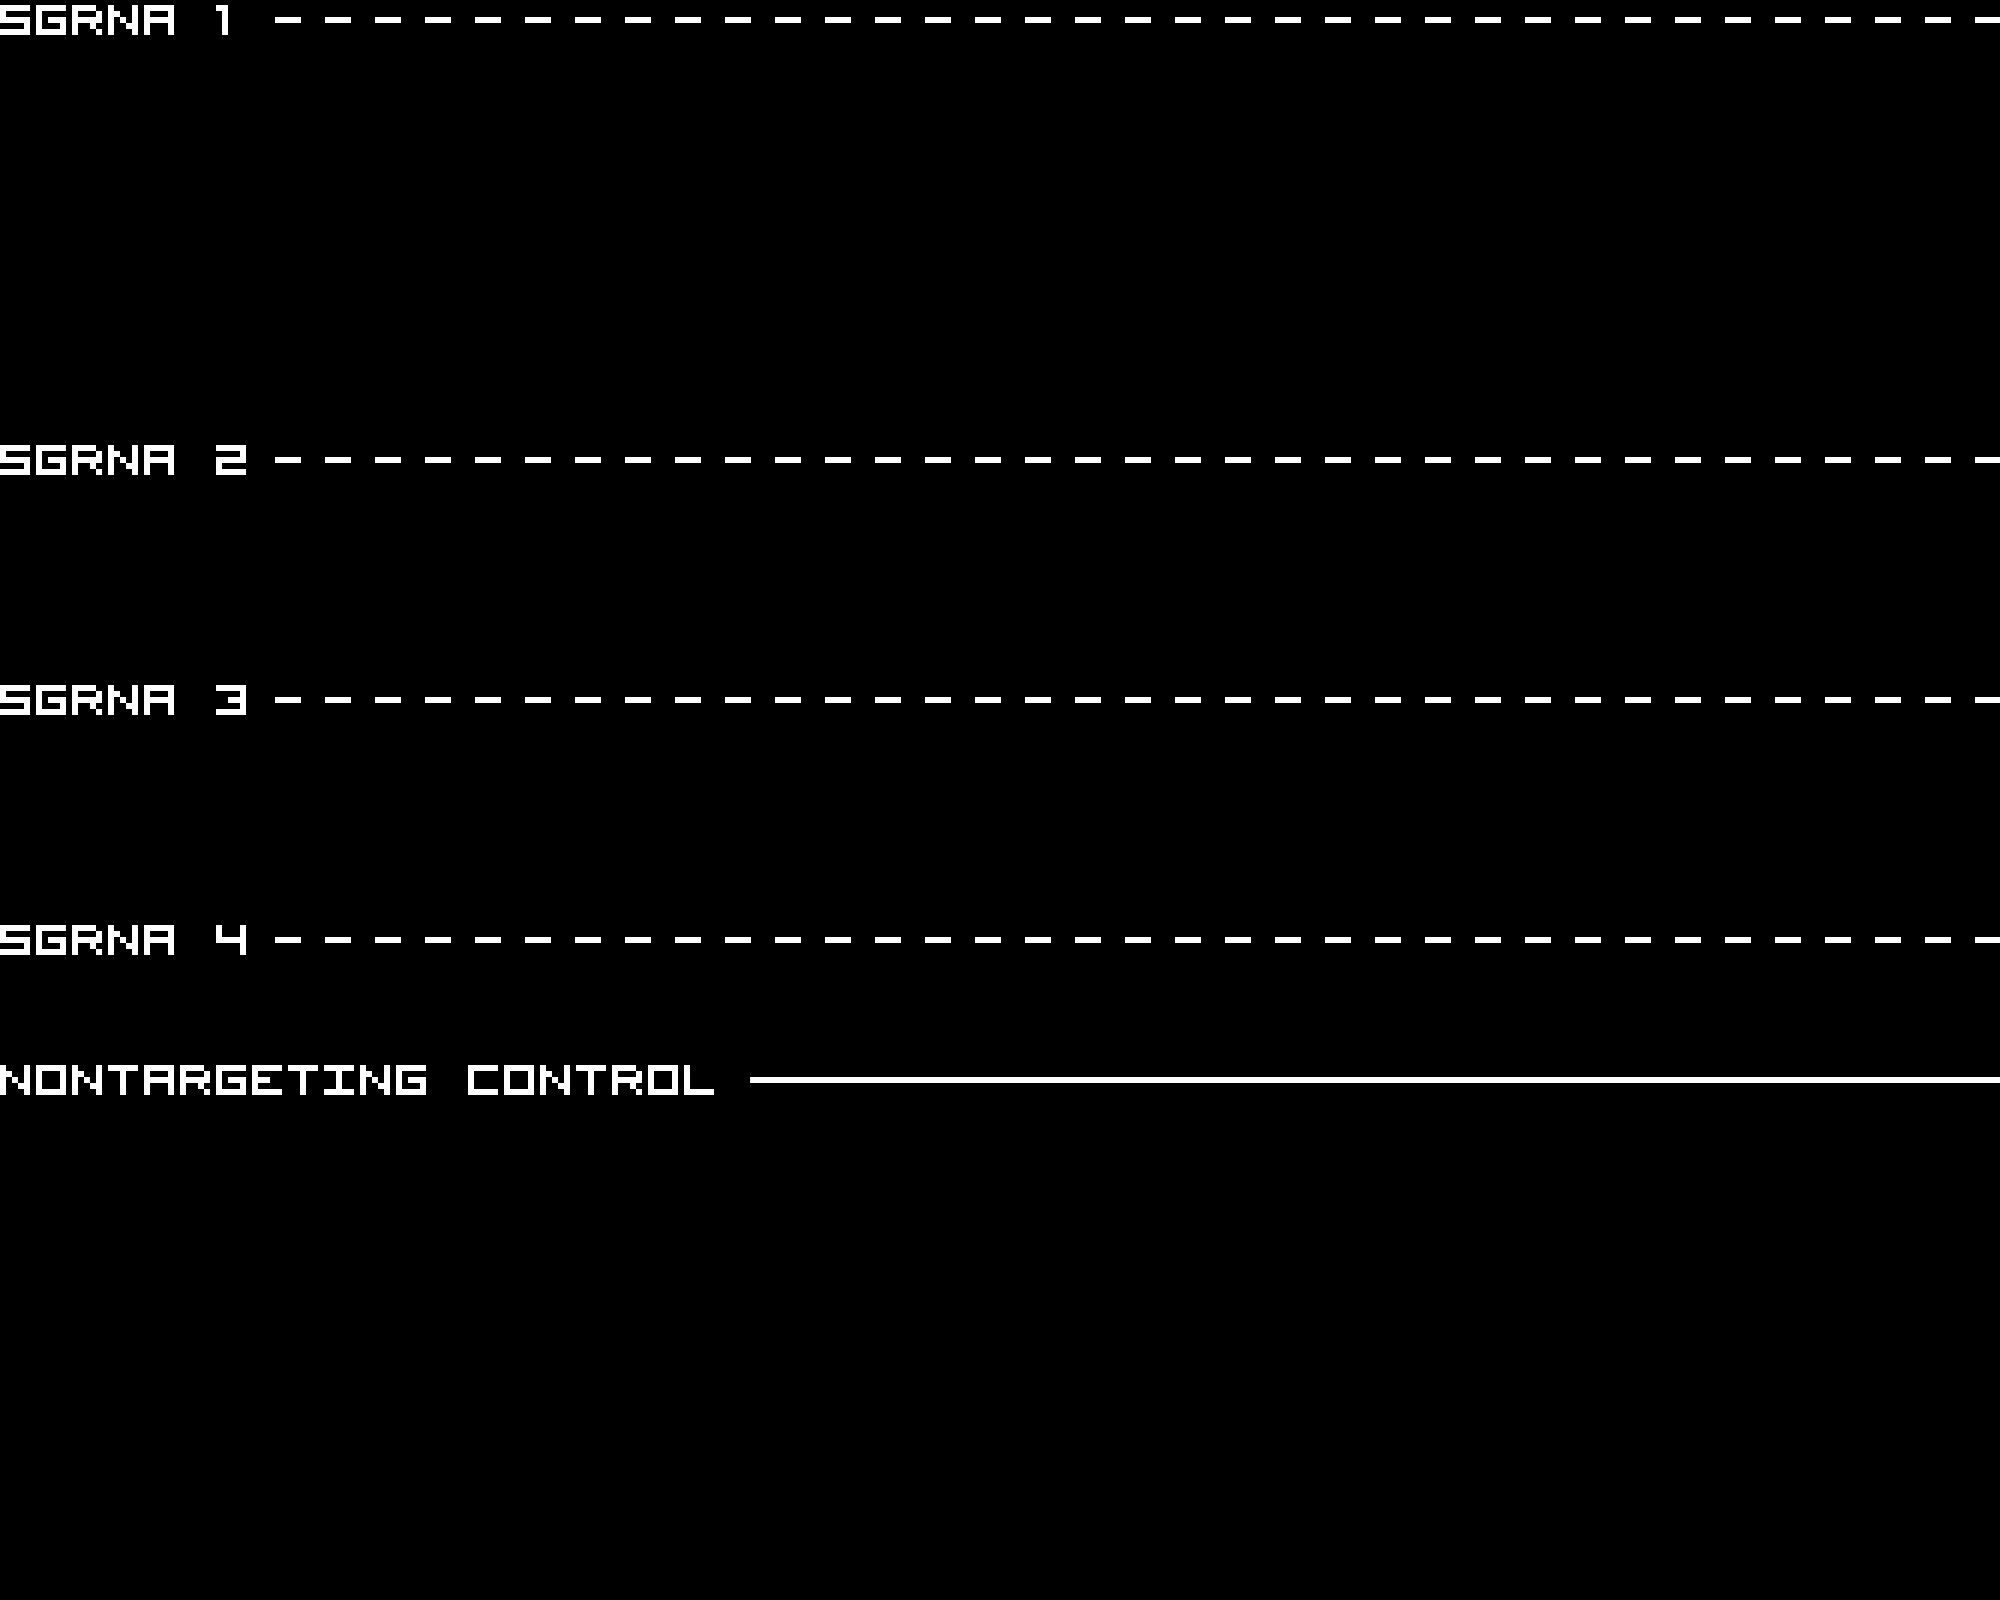
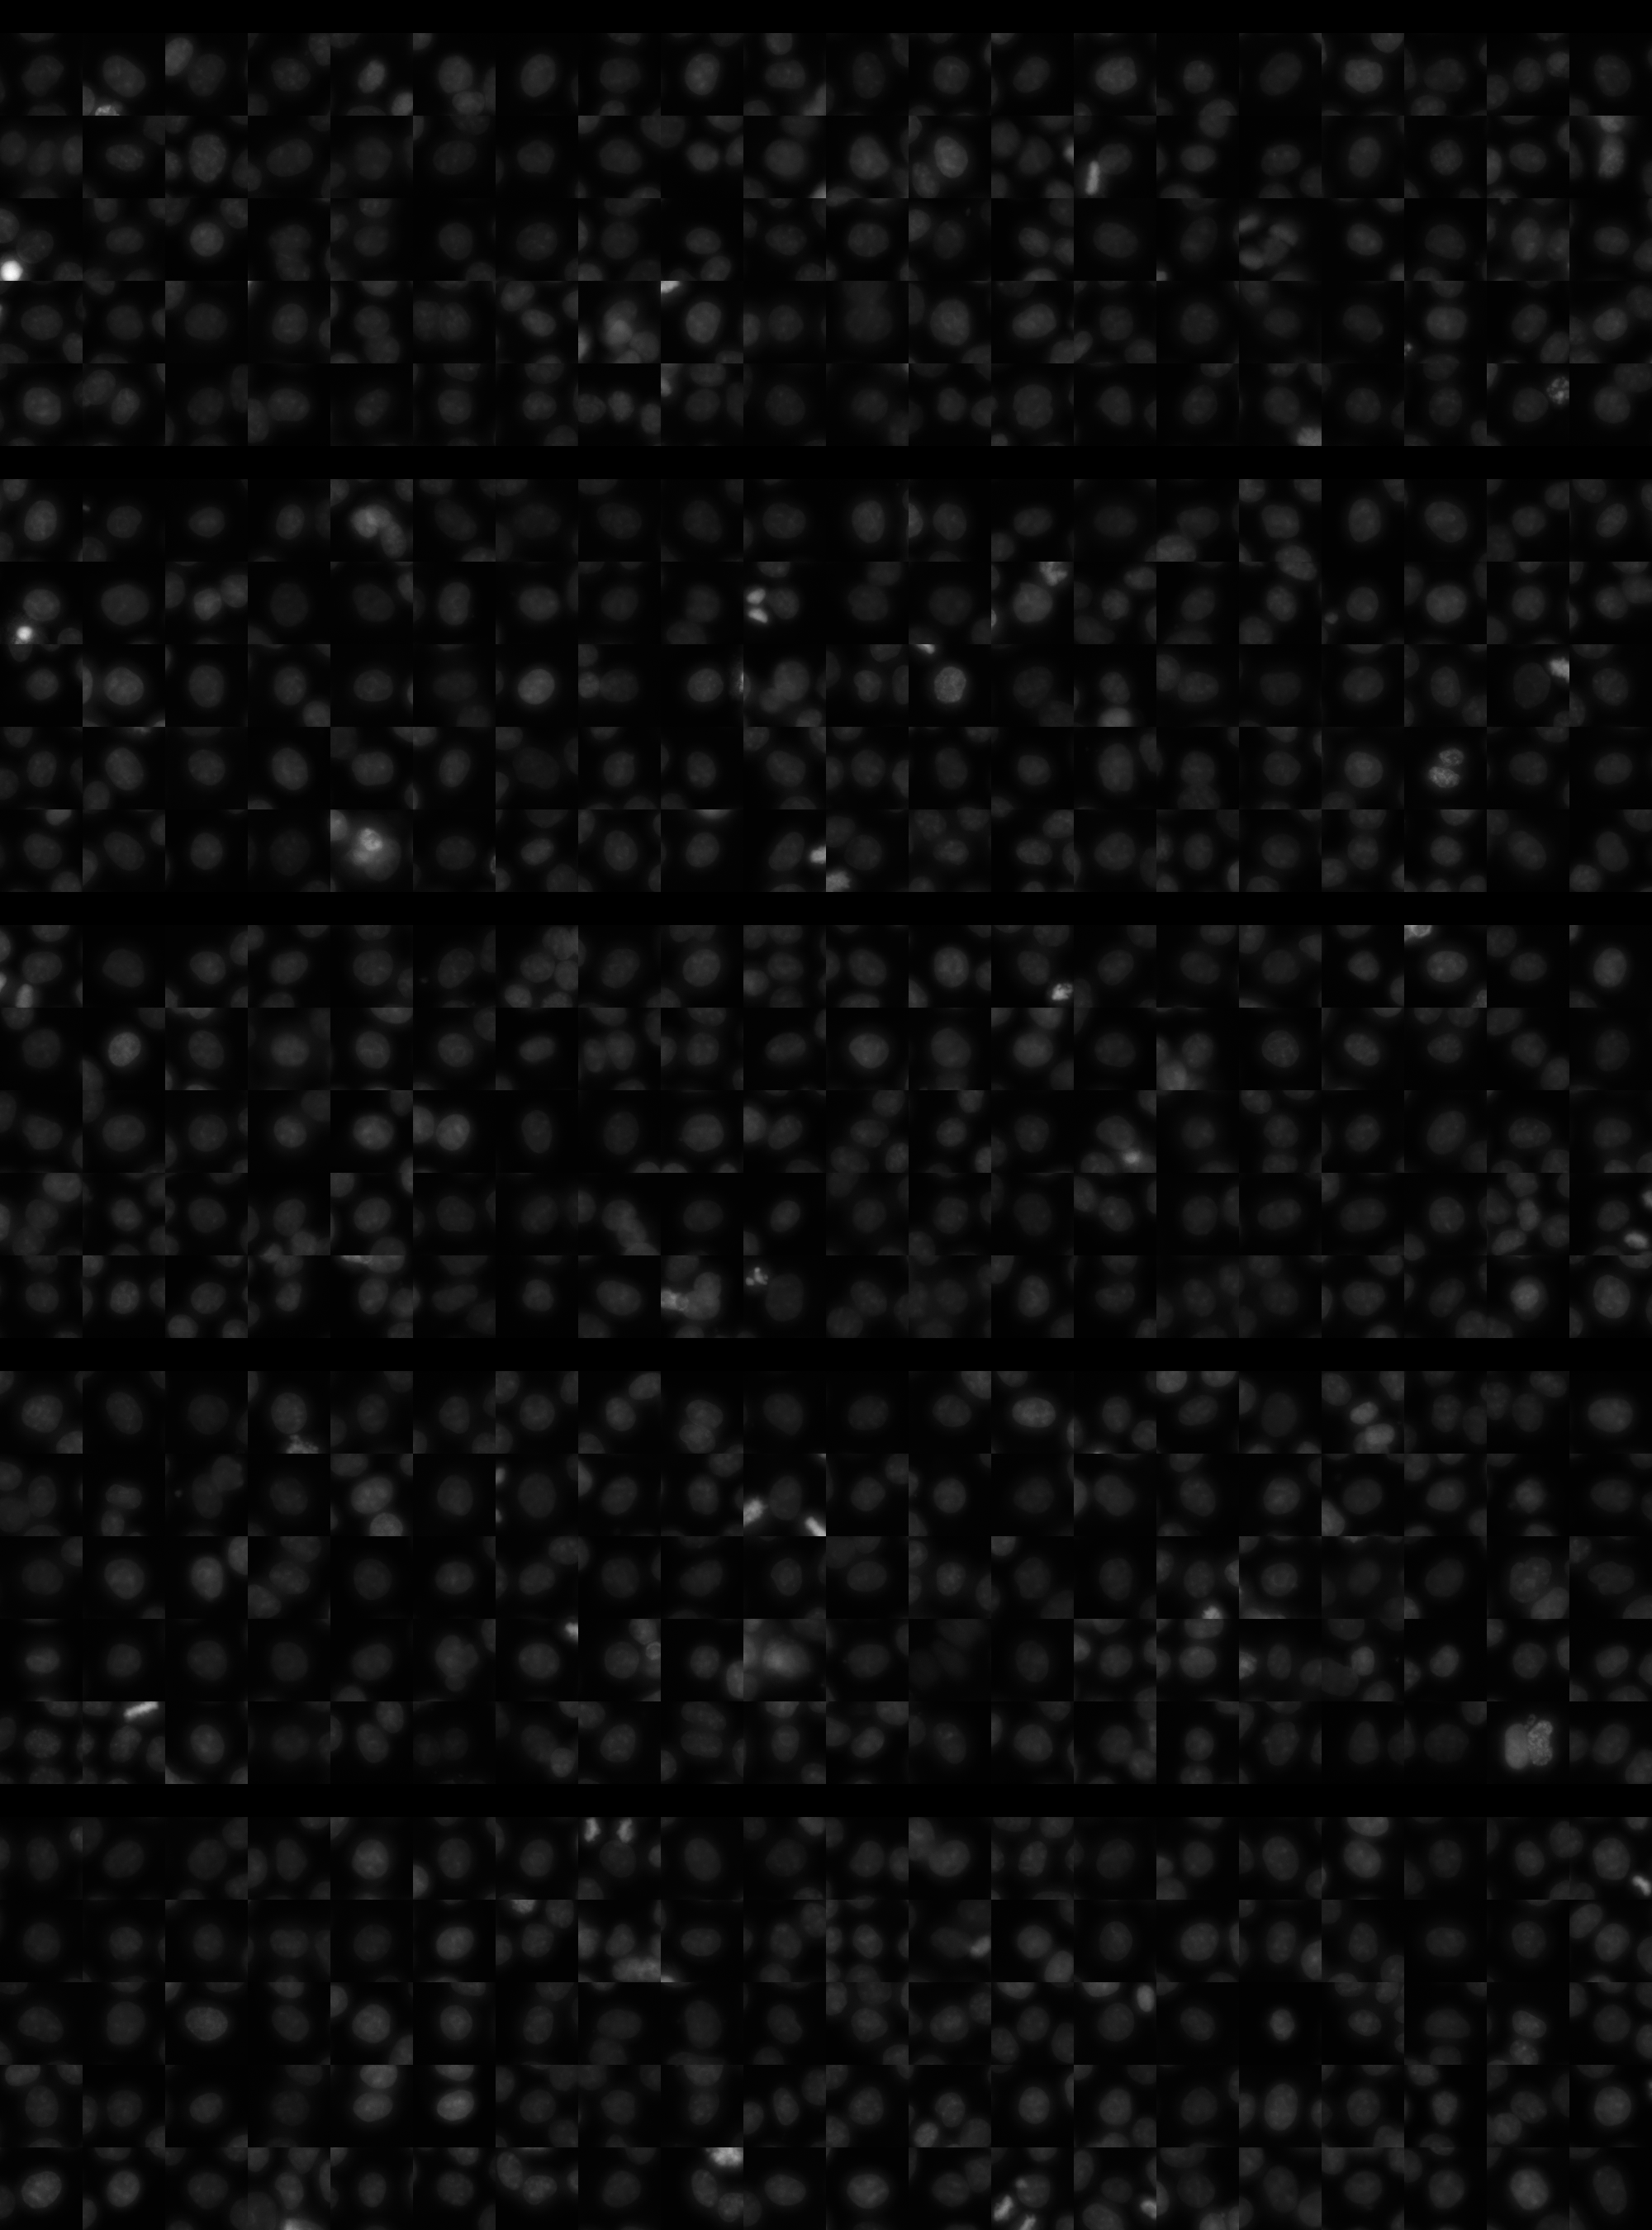
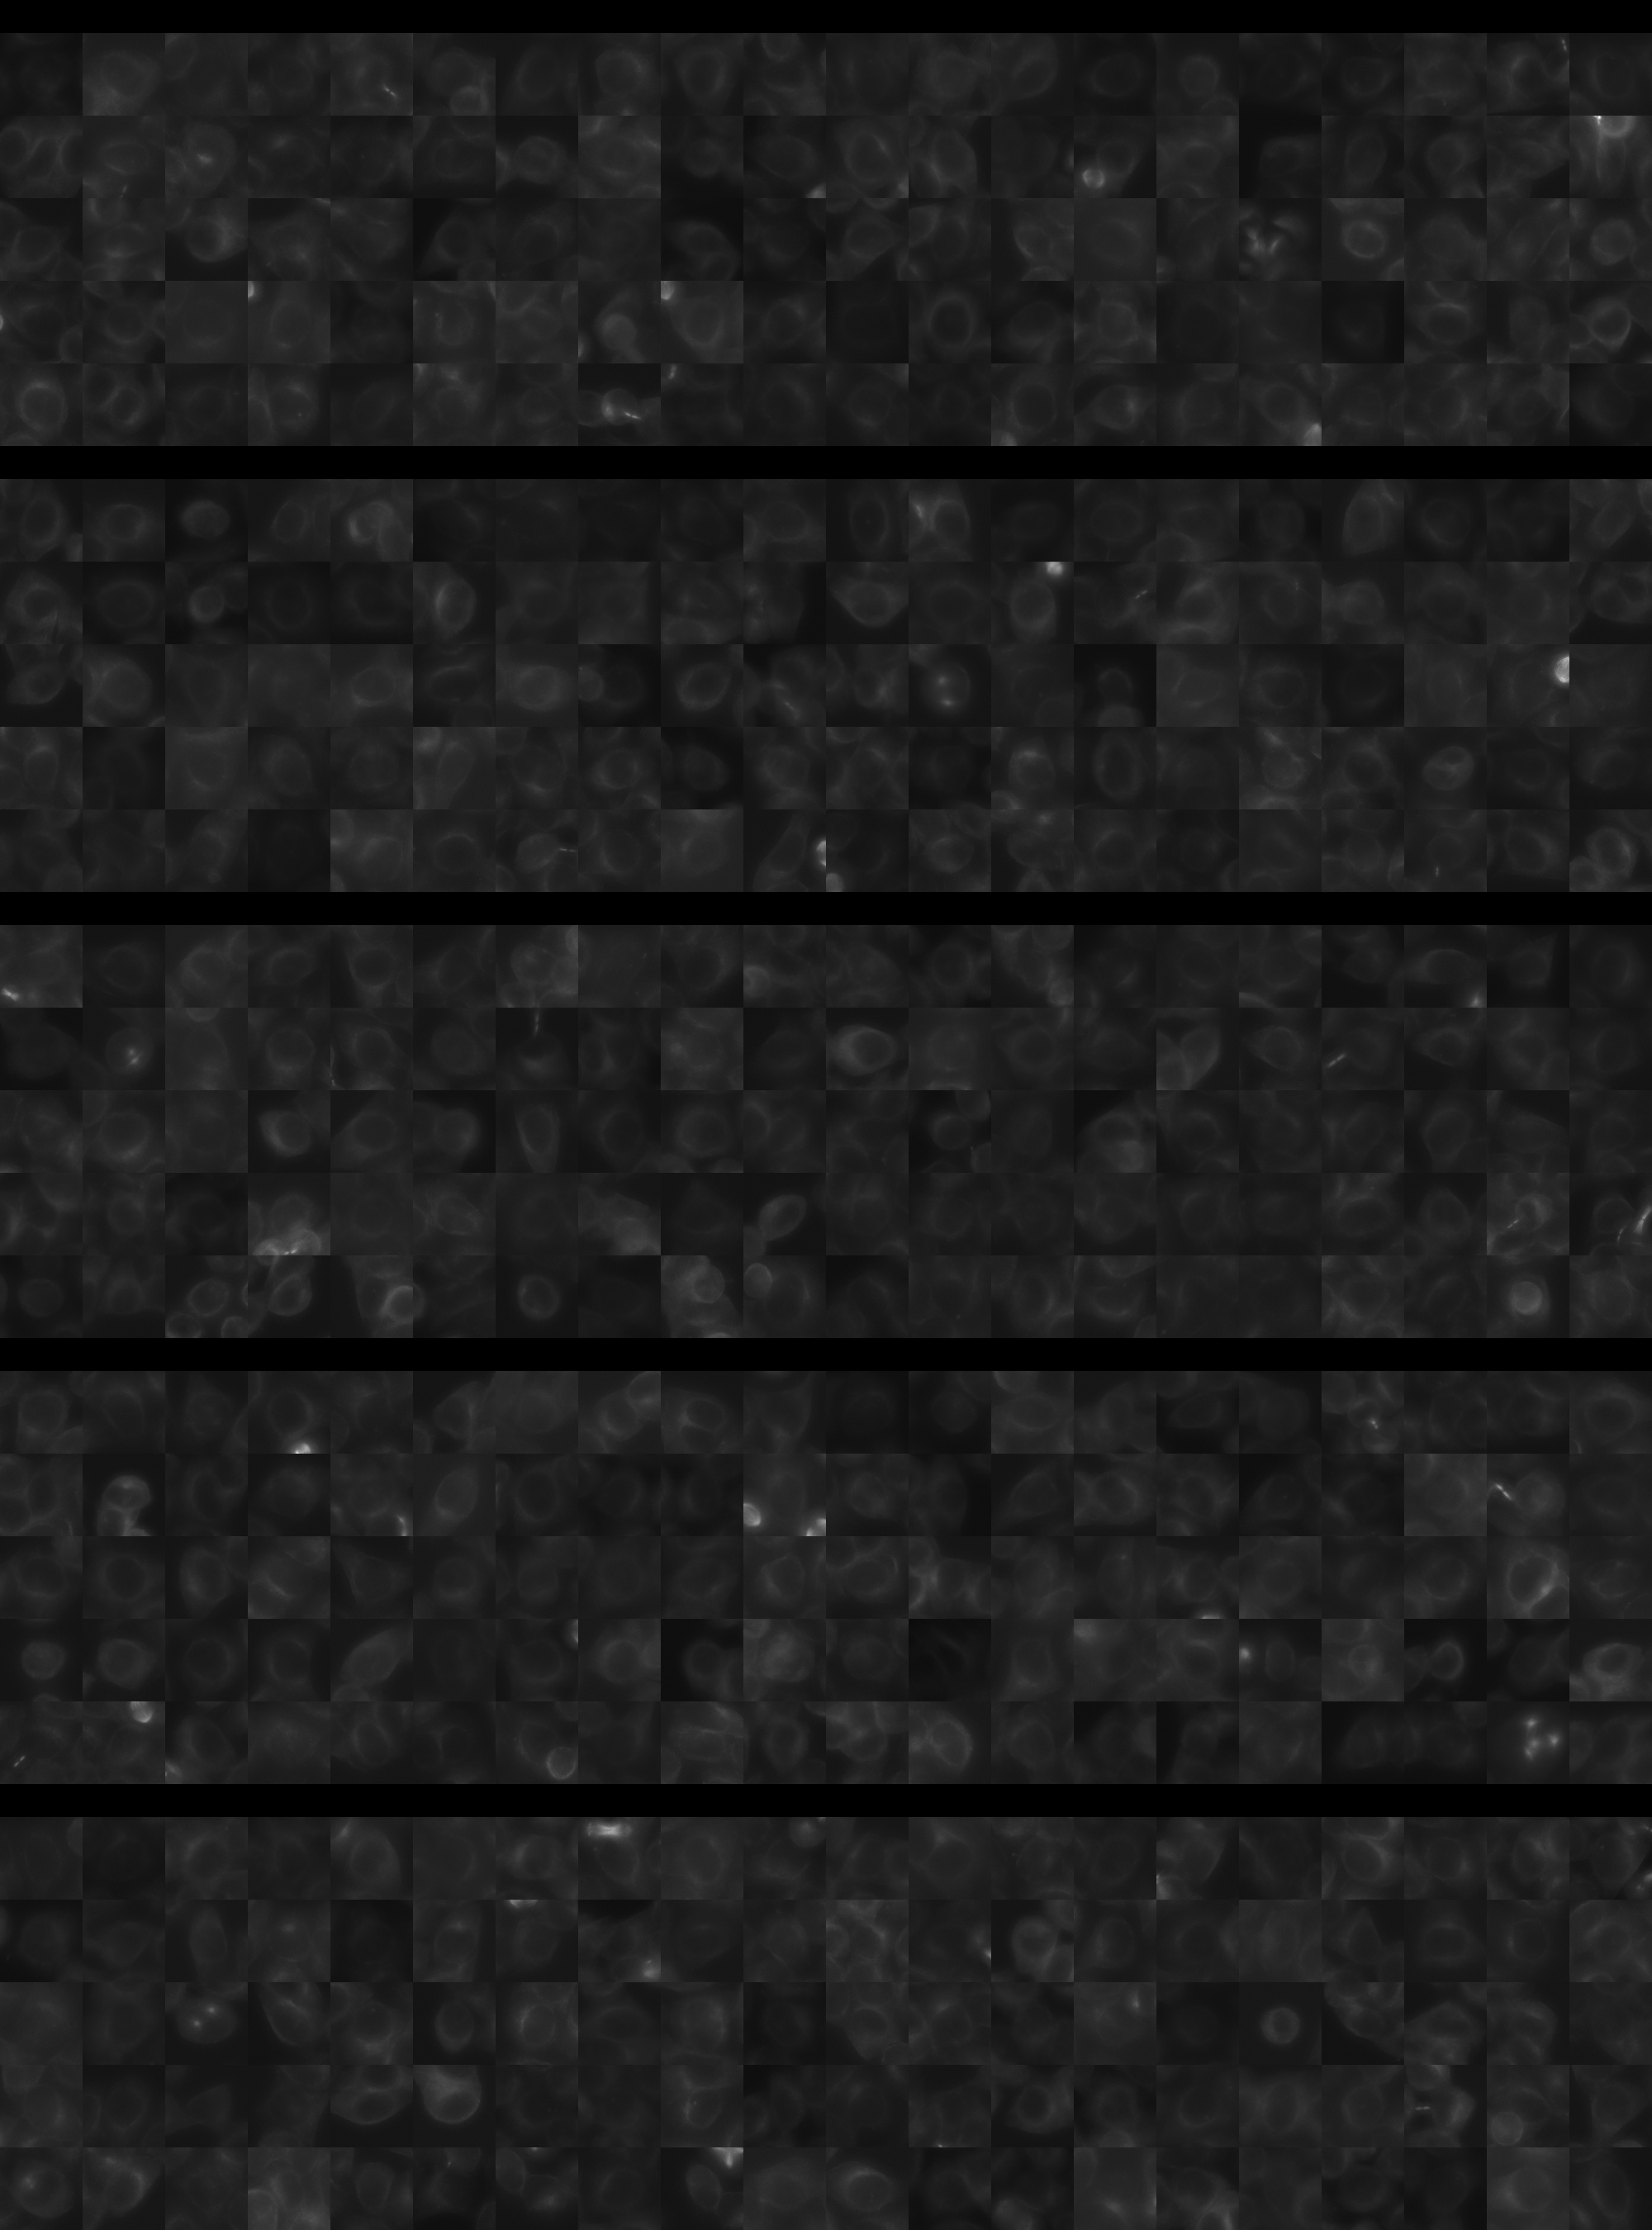
Each montage below shows randomly selected individual cell images for the same target gene separated by sgRNA, along with an example montage of cells expressing a non-targeting negative control sgRNA at the bottom. sgRNA labels in the montages correspond to the numbered sgRNA sequences in the gene info table above. The DNA (blue) and tubulin (green) channels are displayed by default, with gH2AX (grayscale) and actin (yellow) available using the check boxes. Channel brightness, contrast, and opacity are adjustable by clicking the arrow next to the channel name. When only one channel is selected, the display defaults to grayscale. Click the “Zoom” checkbox above the channel controls to enable image zooming (via scrolling) and panning (via click-and-drag).

The cell boxes displayed for this gene are square, 30.36 μm per side for the interphase montage and 30.36 μm per side for the mitotic montage.
Features

Interphase Score Rank FDR q-value
Nucleus DNA Integrated 0.089 450 of 5322 0.152
Nucleus DNA Mean -3.955e-02 3282 of 5322 0.467
Nucleus gH2AX Mean 0.094 2088 of 5322 0.039
Nucleus DNA - gH2AX Correlation -3.377e-03 1017 of 5322 0.879
Nucleus Shape Area 0.082 943 of 5322 0.161
Nucleus Shape Eccentricity 0.026 1936 of 5322 0.616
Nucleus Shape Form Factor -9.430e-02 4264 of 5322 0.034
Nucleus Shape Solidity -8.171e-02 3880 of 5322 0.034
Cell DNA Mass Displacement 0.029 2346 of 5322 0.711
Cell Tubulin Mean -4.749e-02 4260 of 5322 0.400
Cell Tubulin Mass Displacement -1.015e-02 3580 of 5322 0.918
Cell Actin Mean -2.243e-02 3704 of 5322 0.762
Cell Tubulin - Actin Correlation 0.048 1505 of 5322 0.337
Cell DNA - Tubulin Correlation 0.098 986 of 5322 0.019
Cell Shape Area 0.086 780 of 5322 0.162
Cell Shape Eccentricity -1.336e-02 4513 of 5322 0.931
Mitotic Score Rank FDR q-value
Nucleus DNA Integrated 0.181 1465 of 5322 0.896
Nucleus DNA Mean 0.104 1425 of 5322 1.000
Nucleus DNA Mass Displacement 0.108 1792 of 5322 0.999
Nucleus DNA Mean Frac 3 -1.506e-01 4813 of 5322 1.000
Nucleus gH2AX Mean 0.284 386 of 5322 1.000
Nucleus gH2AX Mean Frac 0 0.200 329 of 5322 1.000
Nucleus Tubulin Mean Frac 0 0.068 2434 of 5322 0.999
Nucleus Tubulin Mean Edge -1.866e-02 3430 of 5322 0.999
Nucleus Tubulin Std Edge 0.002 2535 of 5322 0.999
Nucleus Shape Area 0.183 1640 of 5322 0.934
Nucleus Shape Eccentricity -8.396e-02 3363 of 5322 1.000
Nucleus Shape Form Factor -3.439e-01 4962 of 5322 0.830
Cell Tubulin Mean -6.581e-02 4256 of 5322 0.997
Cell Tubulin Mean Frac 3 -1.328e-01 3333 of 5322 0.999
Cell Actin Mean -1.344e-01 4688 of 5322 0.997
Cell Shape Area 0.116 2368 of 5322 0.998
( Reset Zoom )
Brightness
Contrast
Opacity
Brightness
Contrast
Opacity
Brightness
Contrast
Opacity
Brightness
Contrast
Opacity
Brightness
Contrast
Opacity

( Reset Zoom )
Brightness
Contrast
Opacity
Brightness
Contrast
Opacity
Brightness
Contrast
Opacity
Brightness
Contrast
Opacity
Brightness
Contrast
Opacity

MIT Central Accessability