ABHD11

Gene symbol: ABHD11
Gene: 83451
Uniprot Function:
Mitotic Index 0.0196
Interphase Cluster: #6 (46 genes)
Mitotic Cluster: #59 (28 genes)
sgRNA 1: ACGGTGGATGCTCGTAACCA (interphase cells: 1165, mitotic cells: 32)
sgRNA 2: CCACGGCCCTAGCTTCGCGA (interphase cells: 752, mitotic cells: 14)
sgRNA 3: CTGCCACATAGGTTGCAAAG (interphase cells: 1022, mitotic cells: 16)
sgRNA 4: GCTGTGGCCAACGACGACGC (interphase cells: 714, mitotic cells: 11)

Interphase Cluster

Mitotic Cluster

Overview

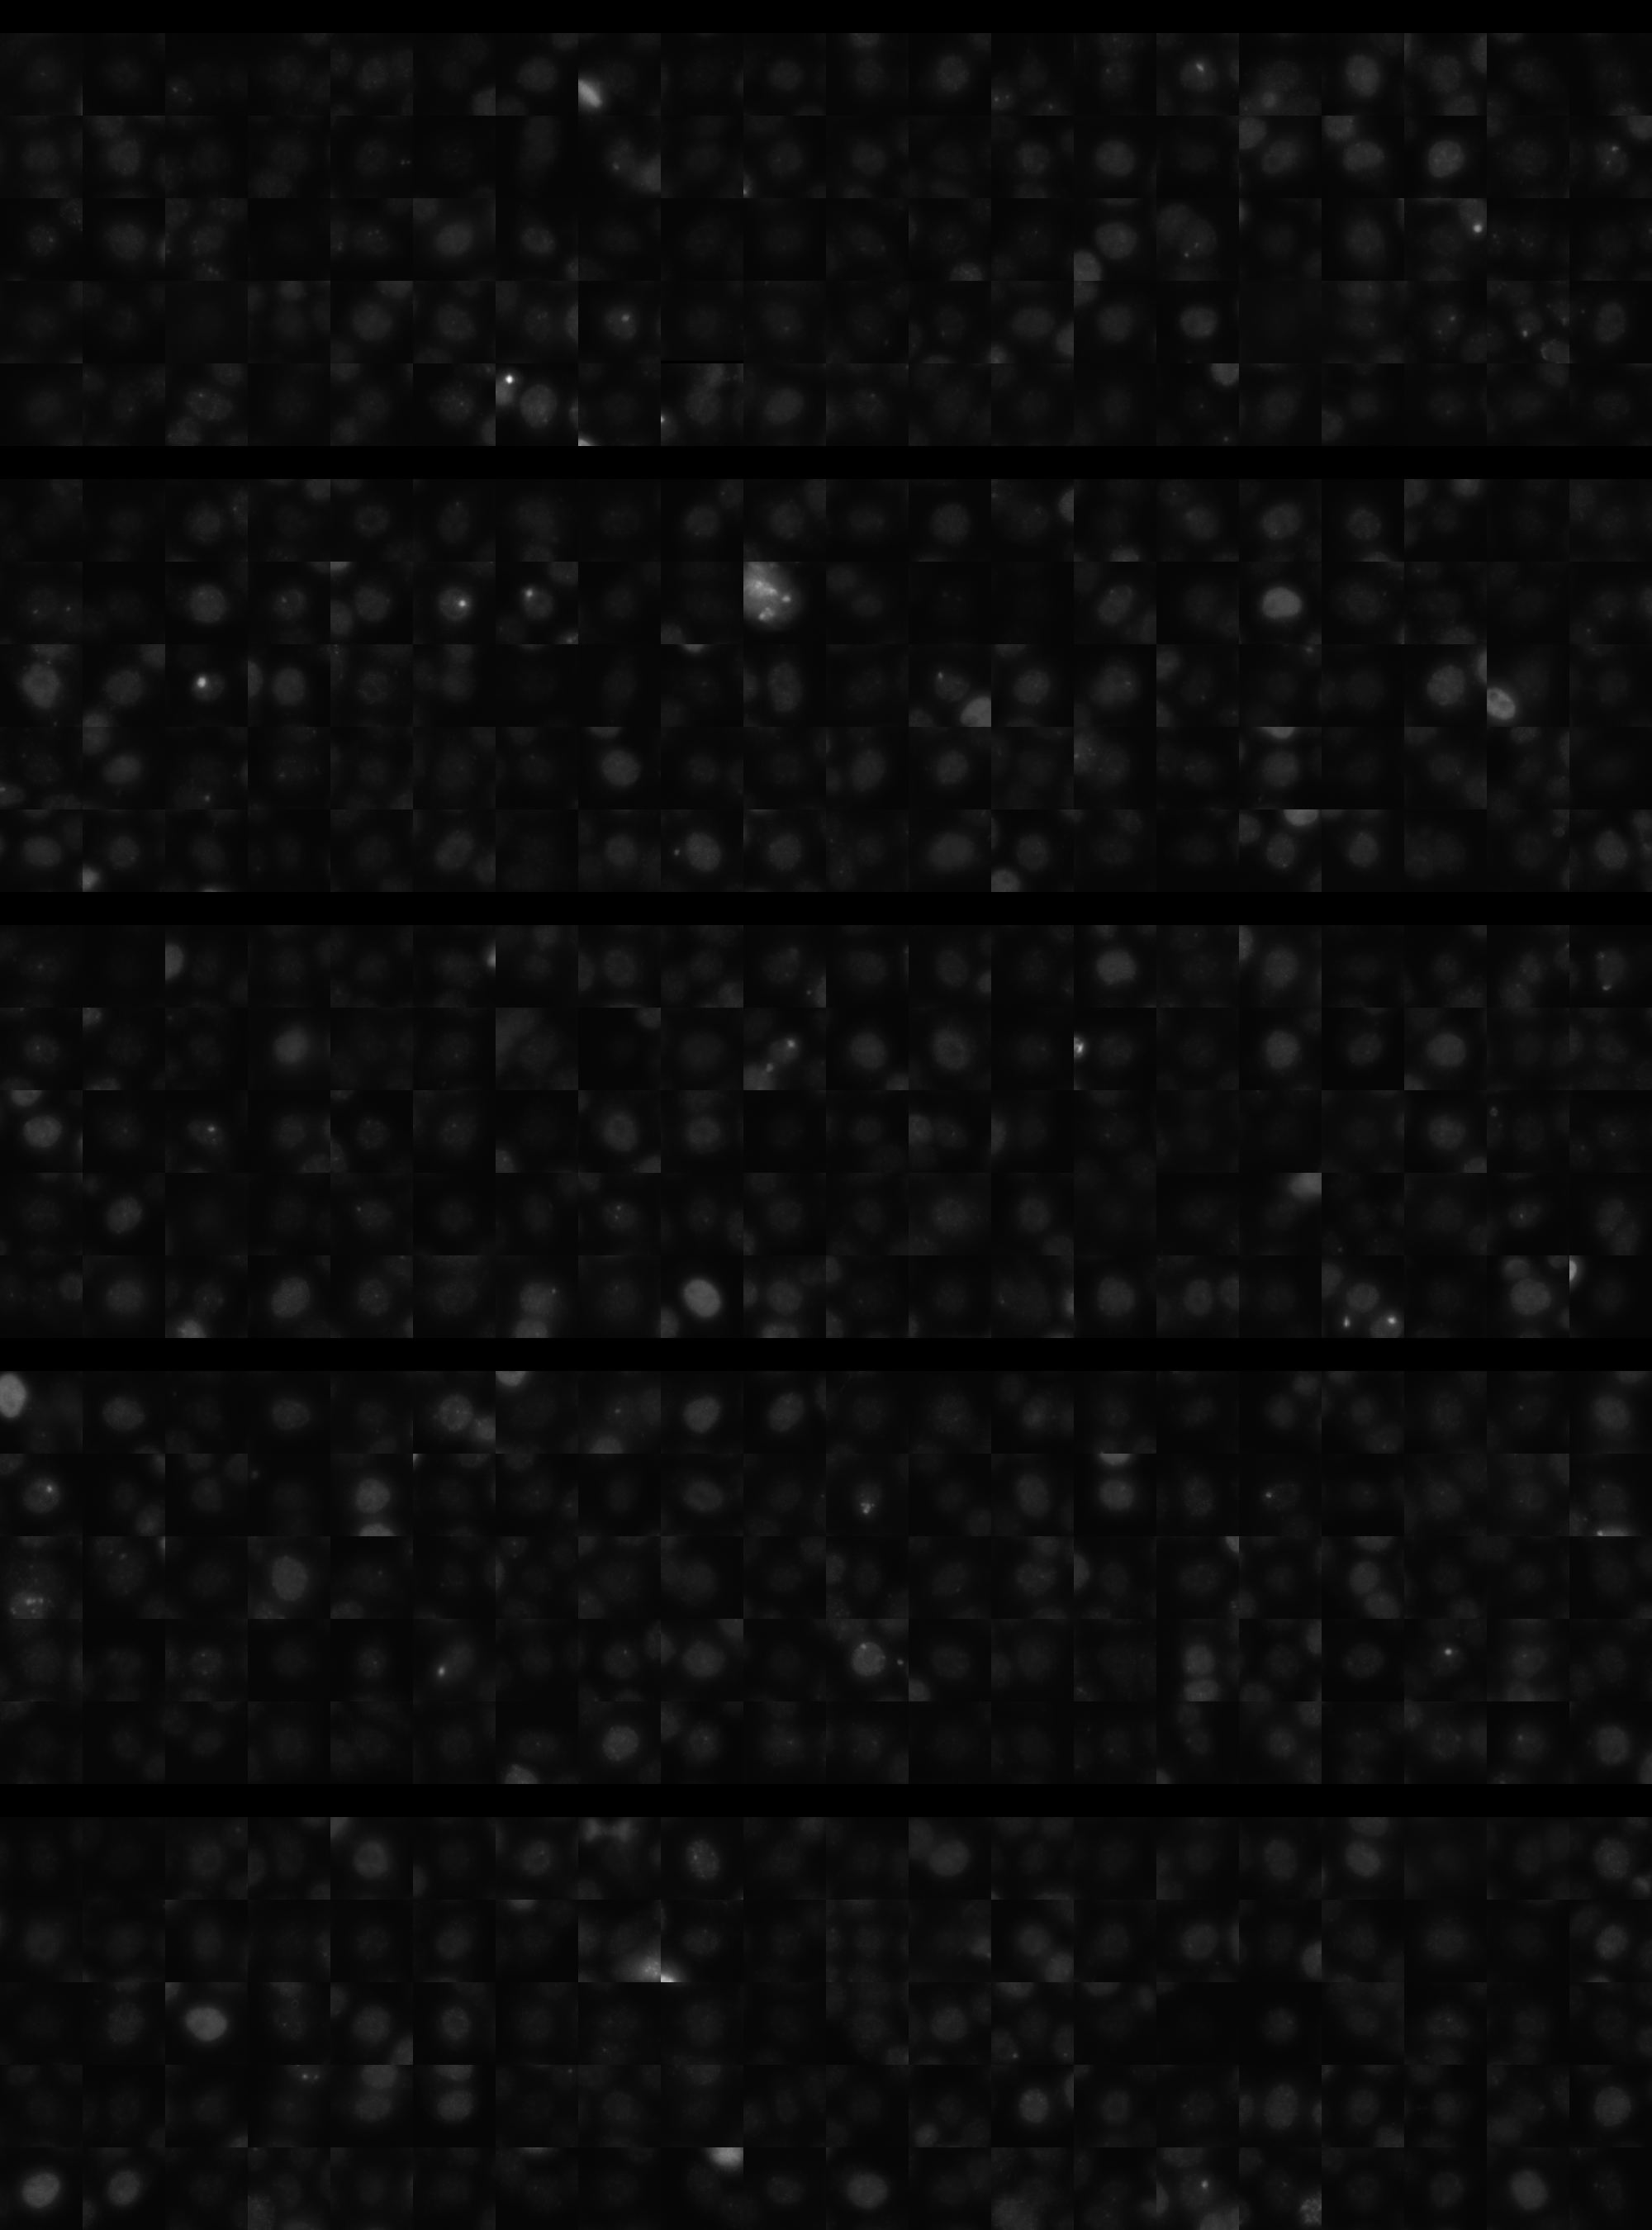
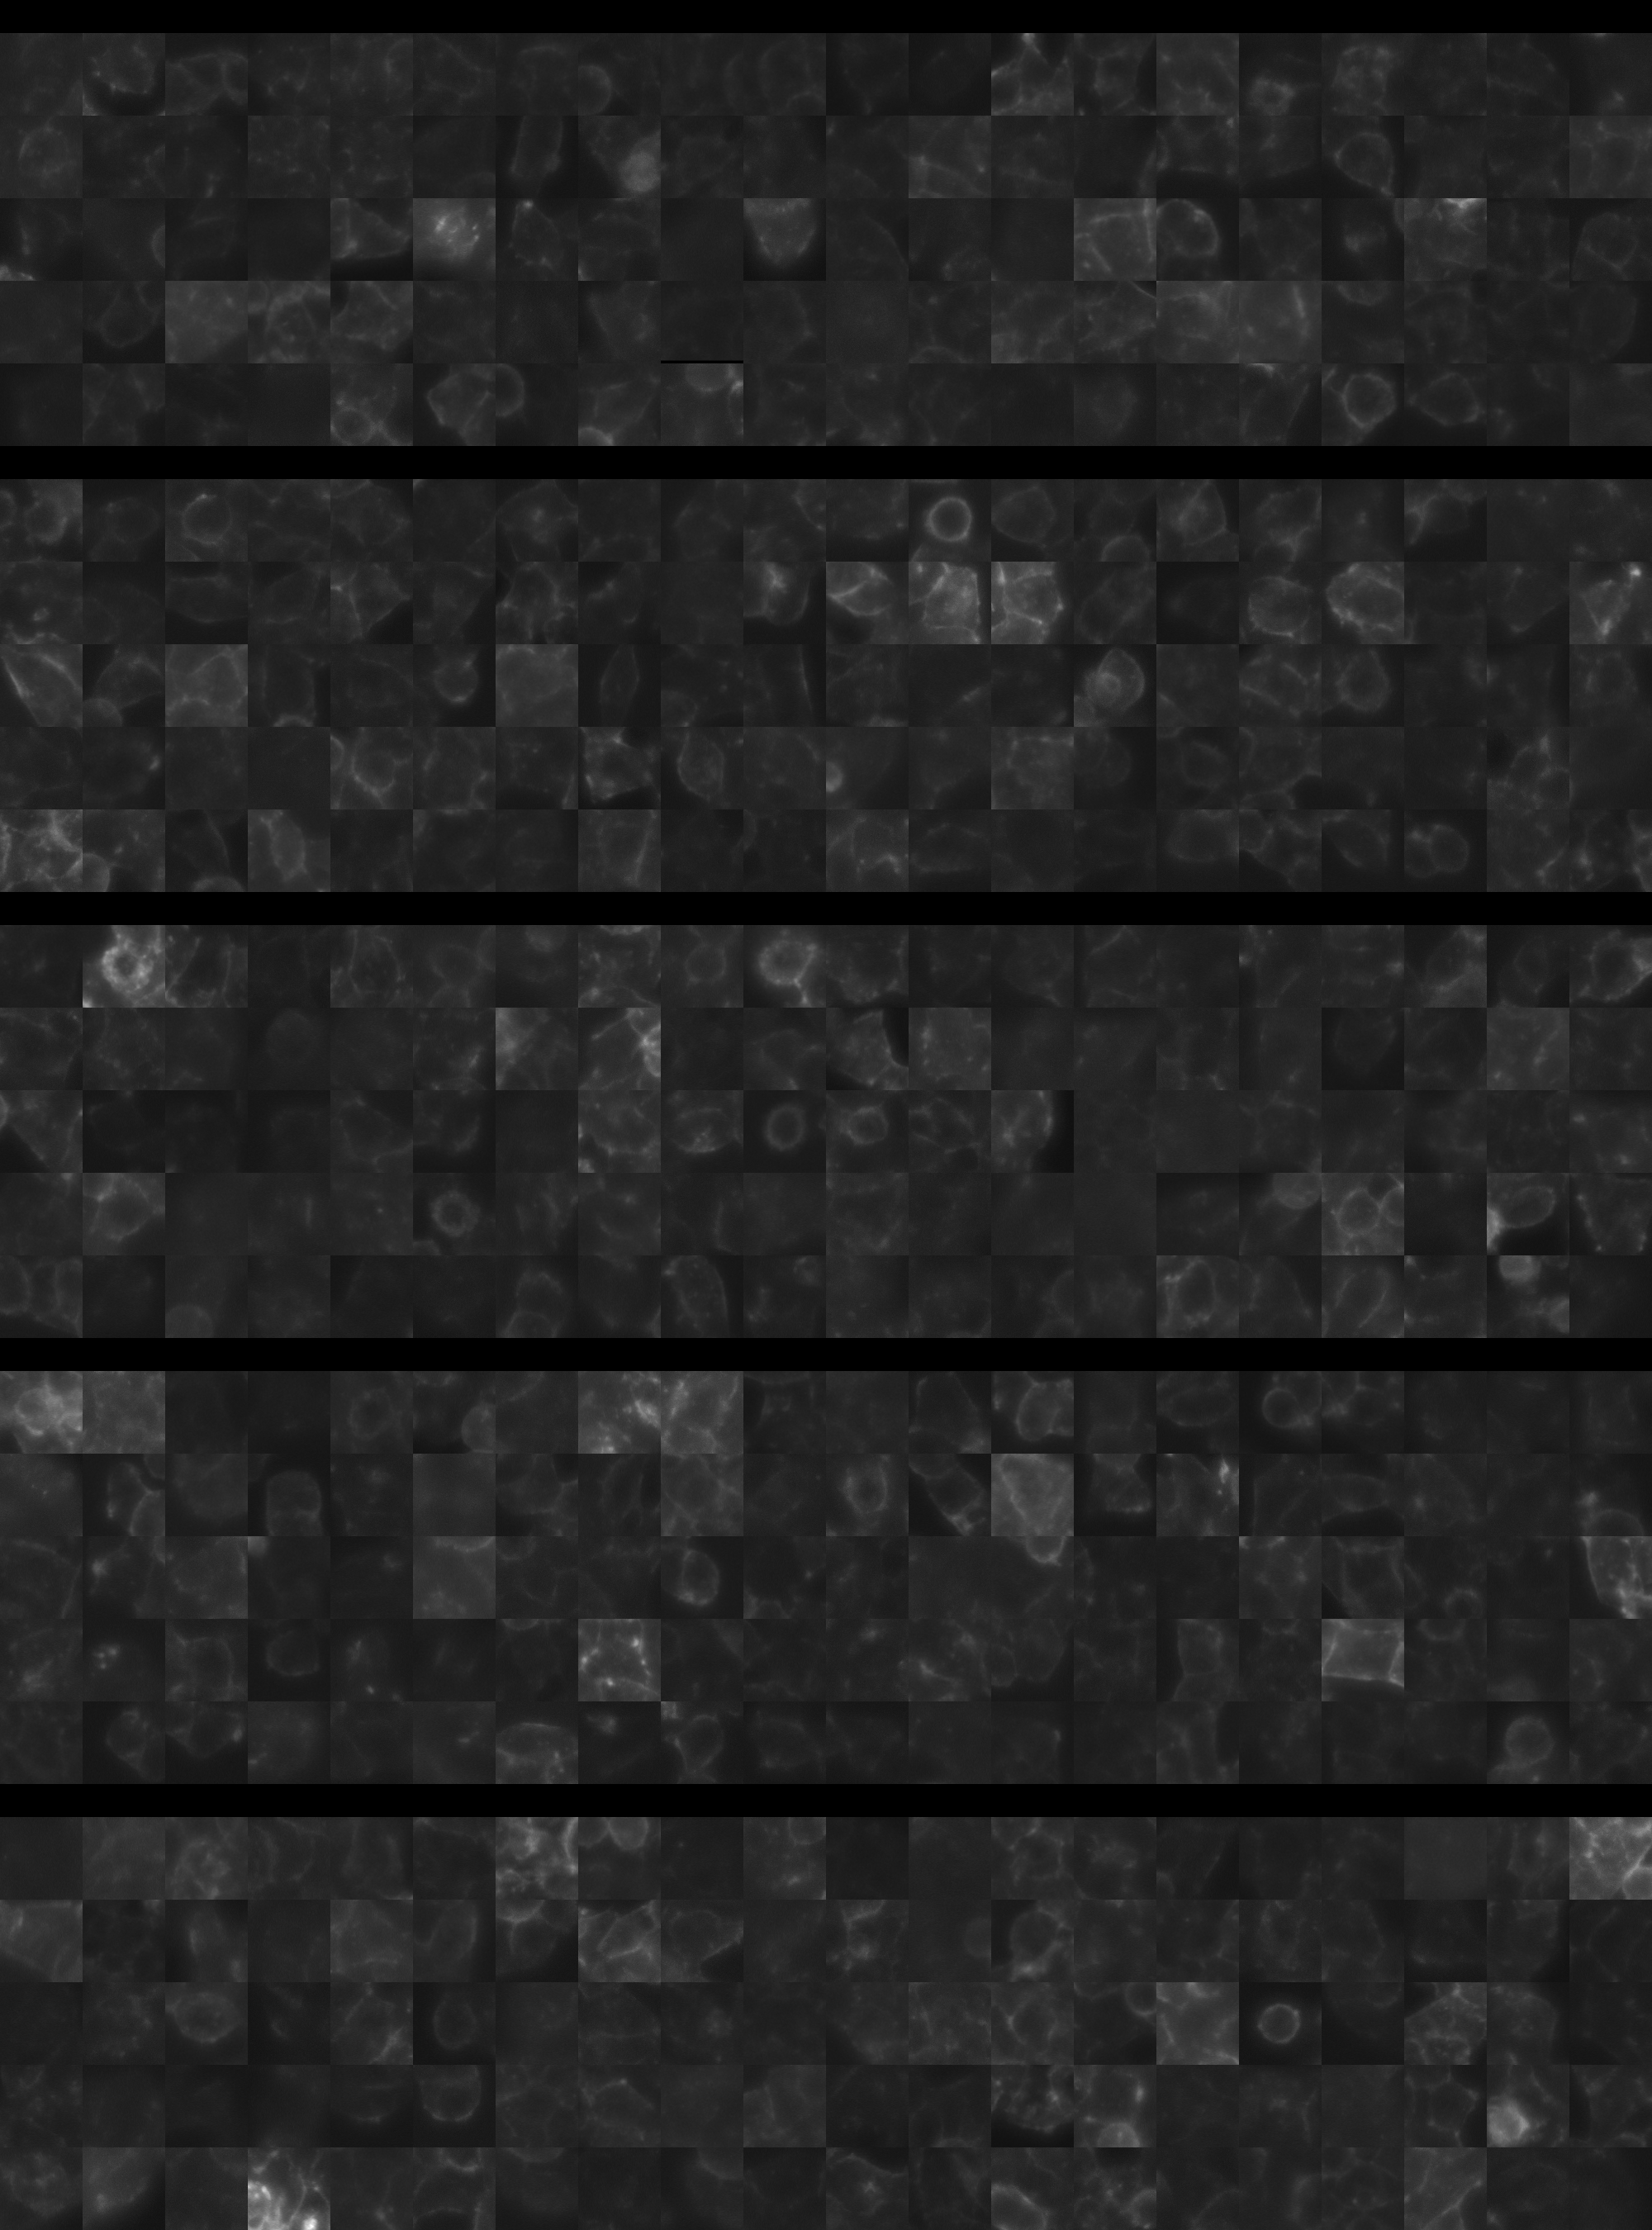
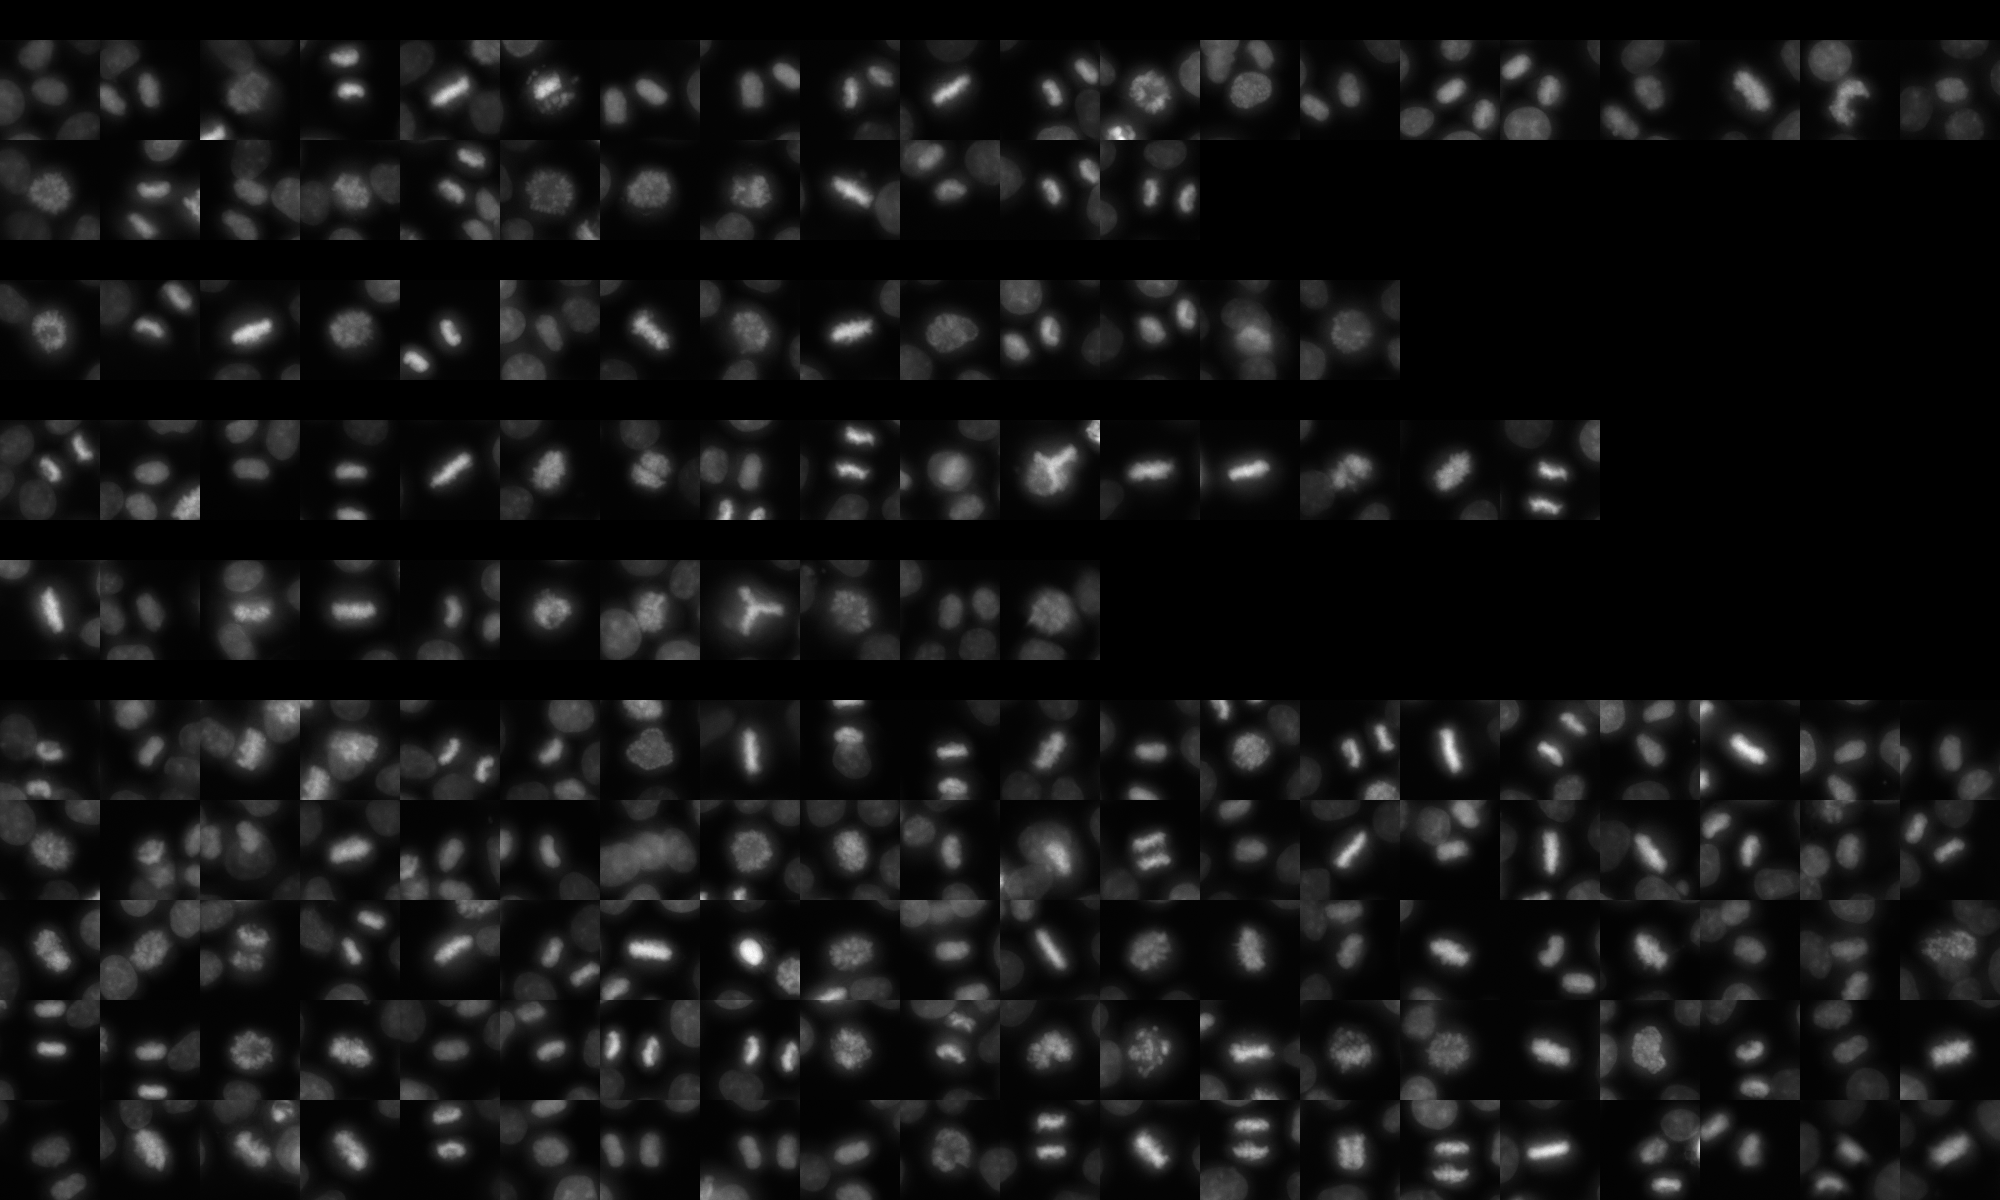
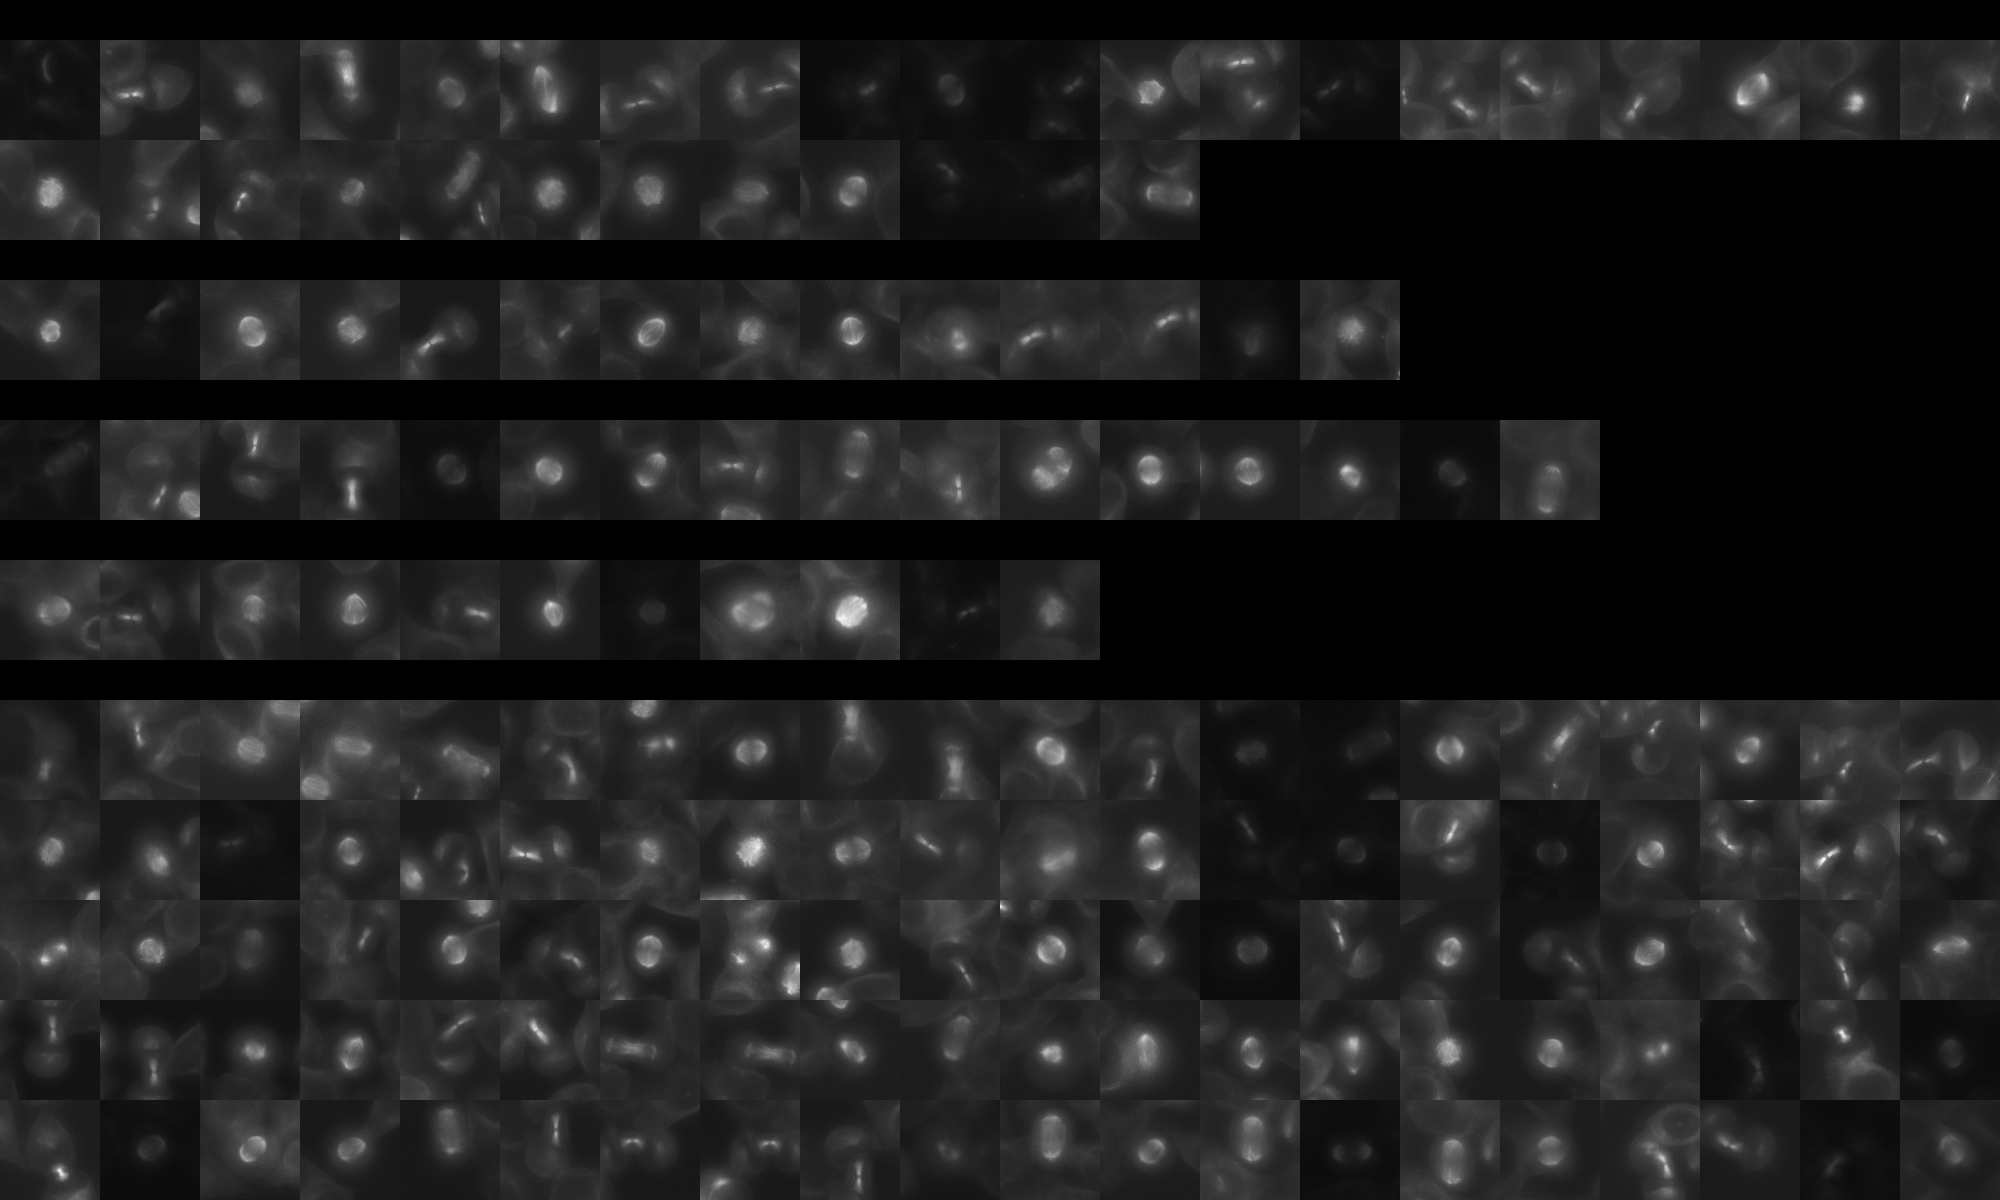
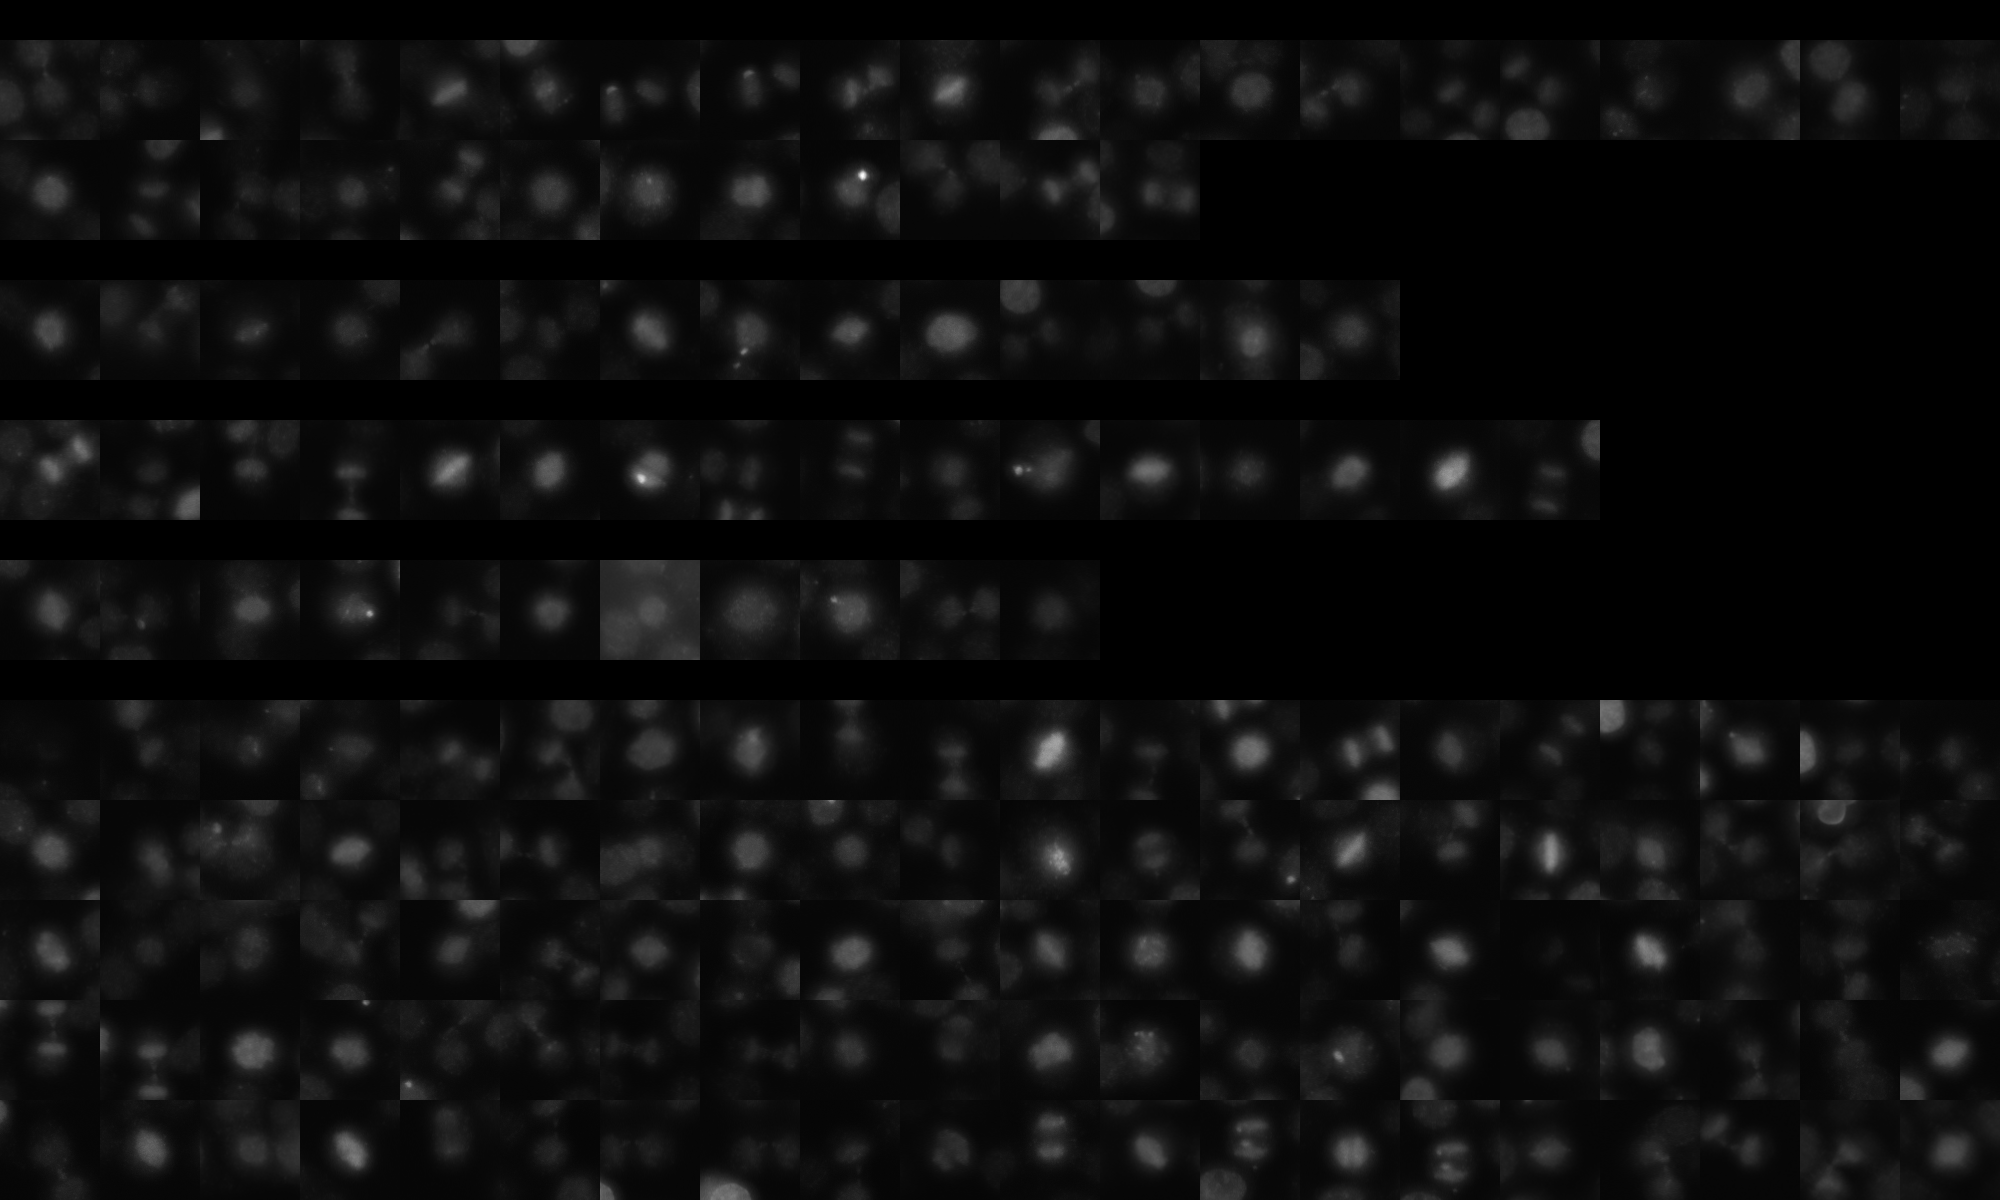
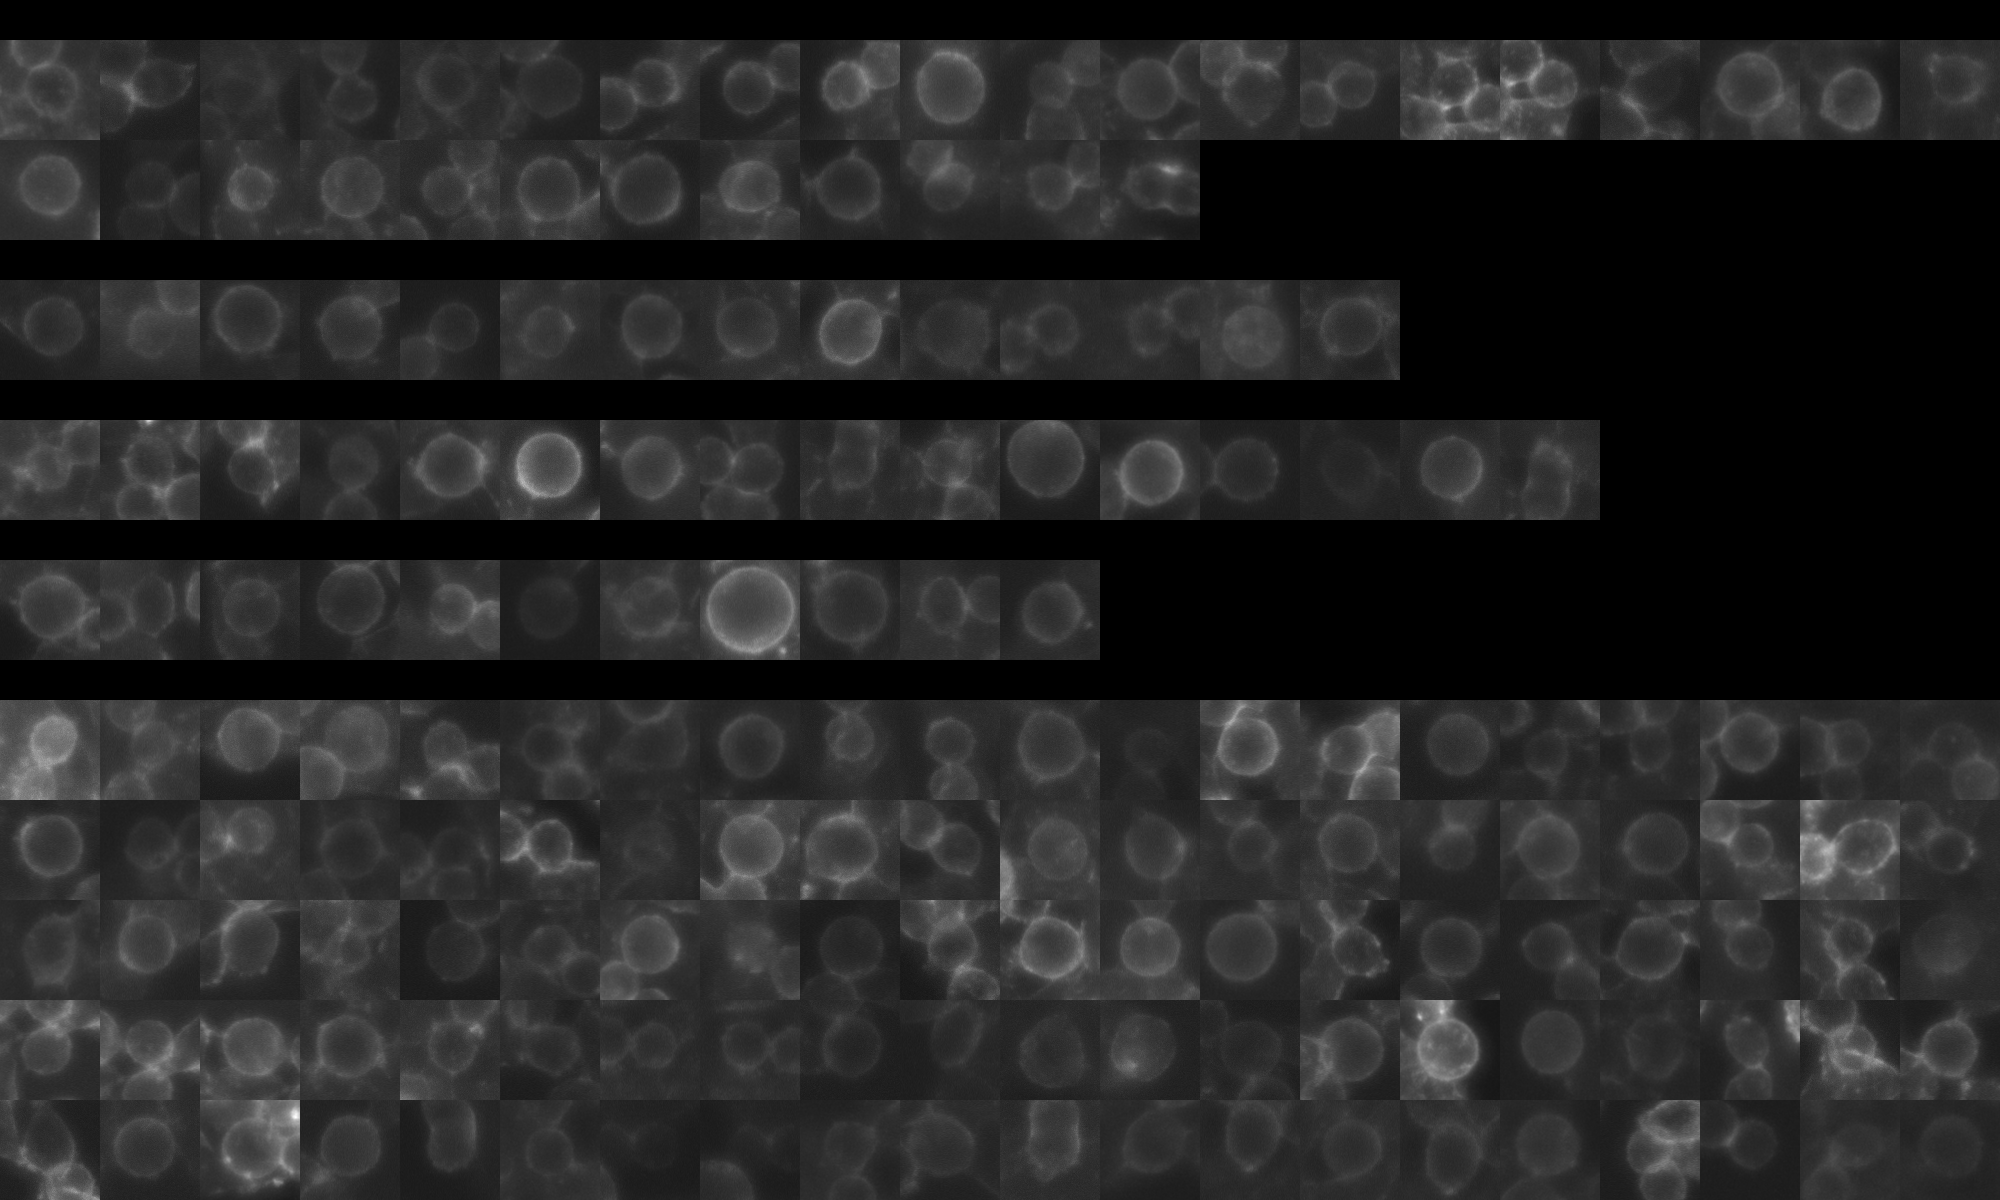
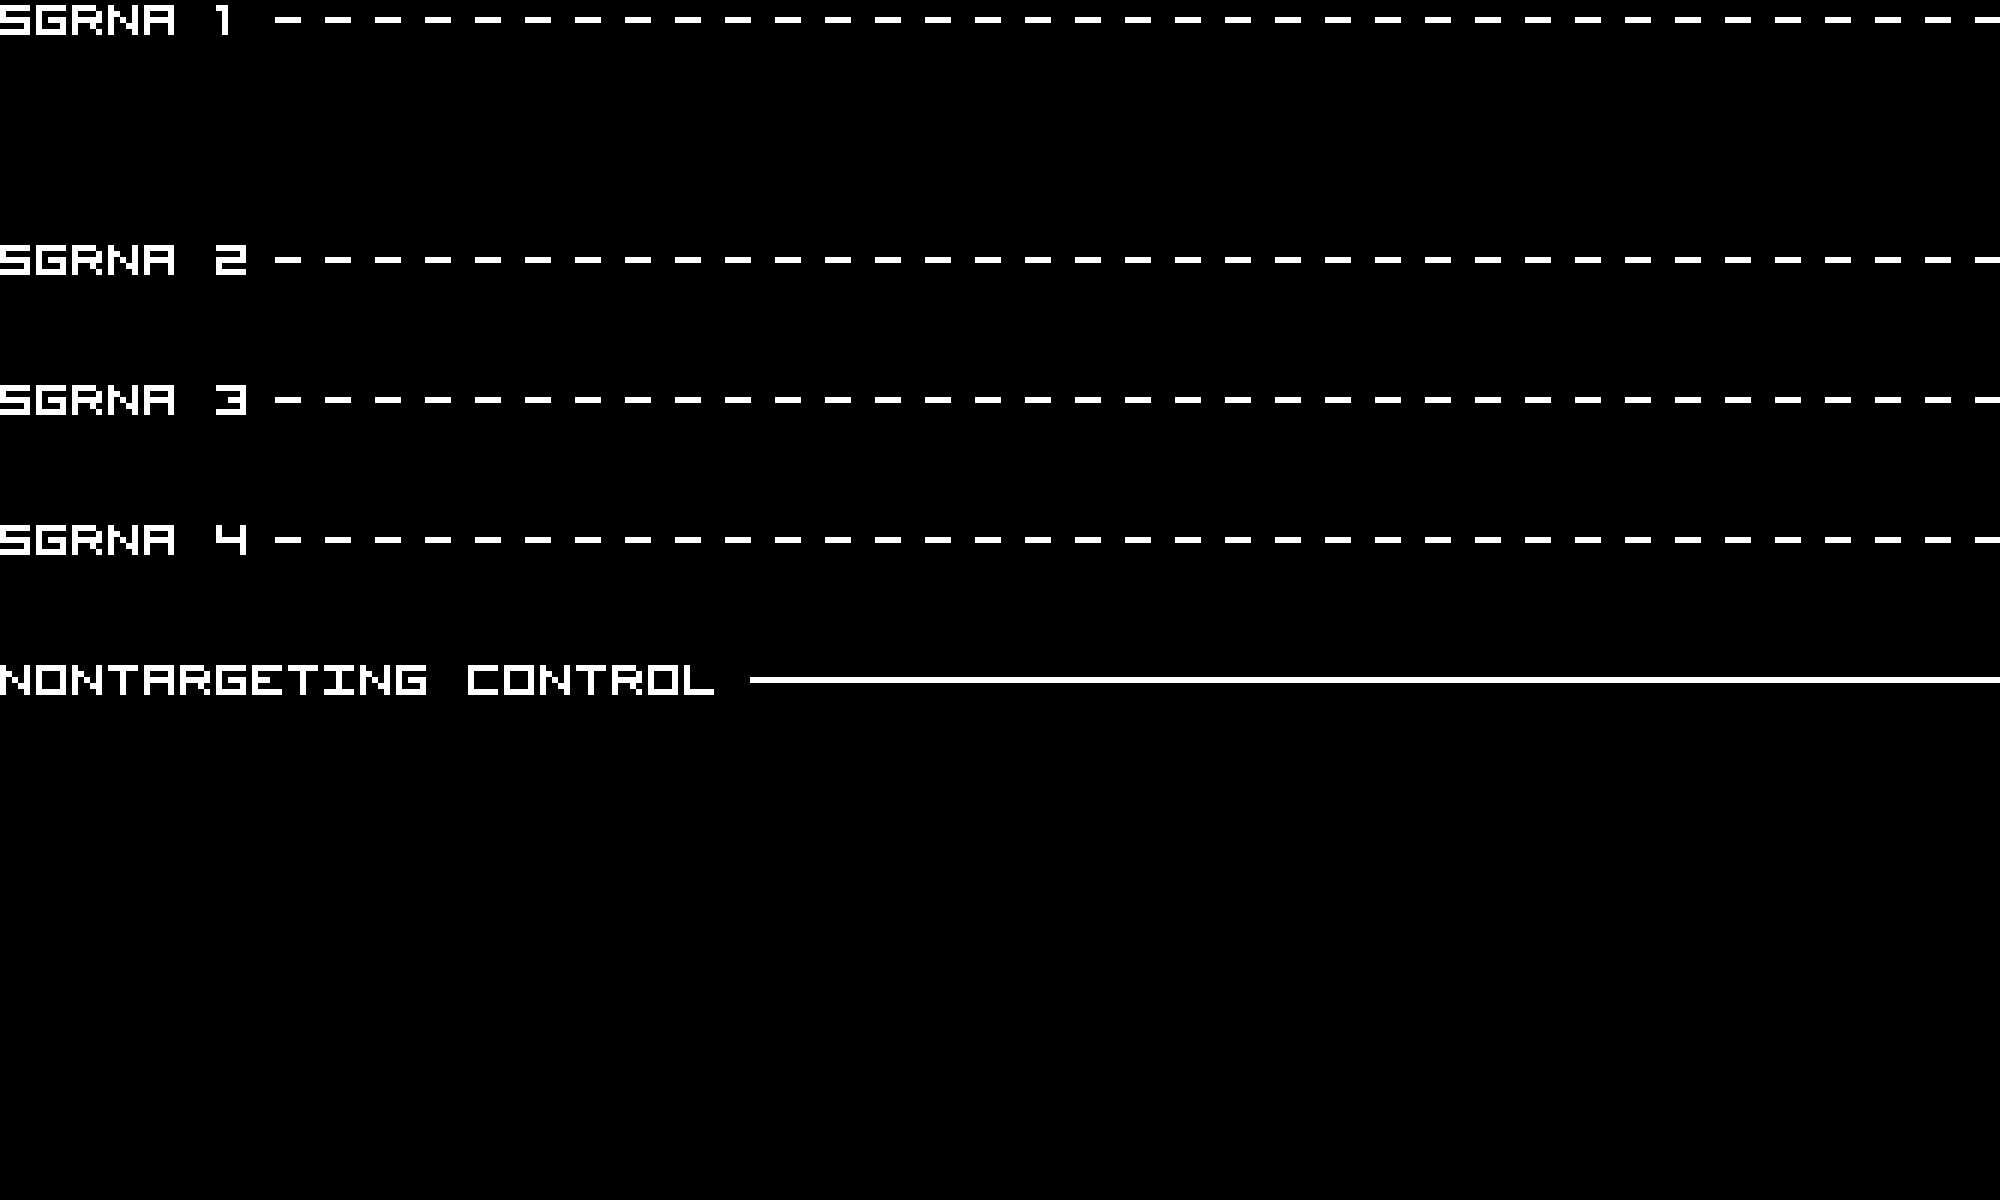
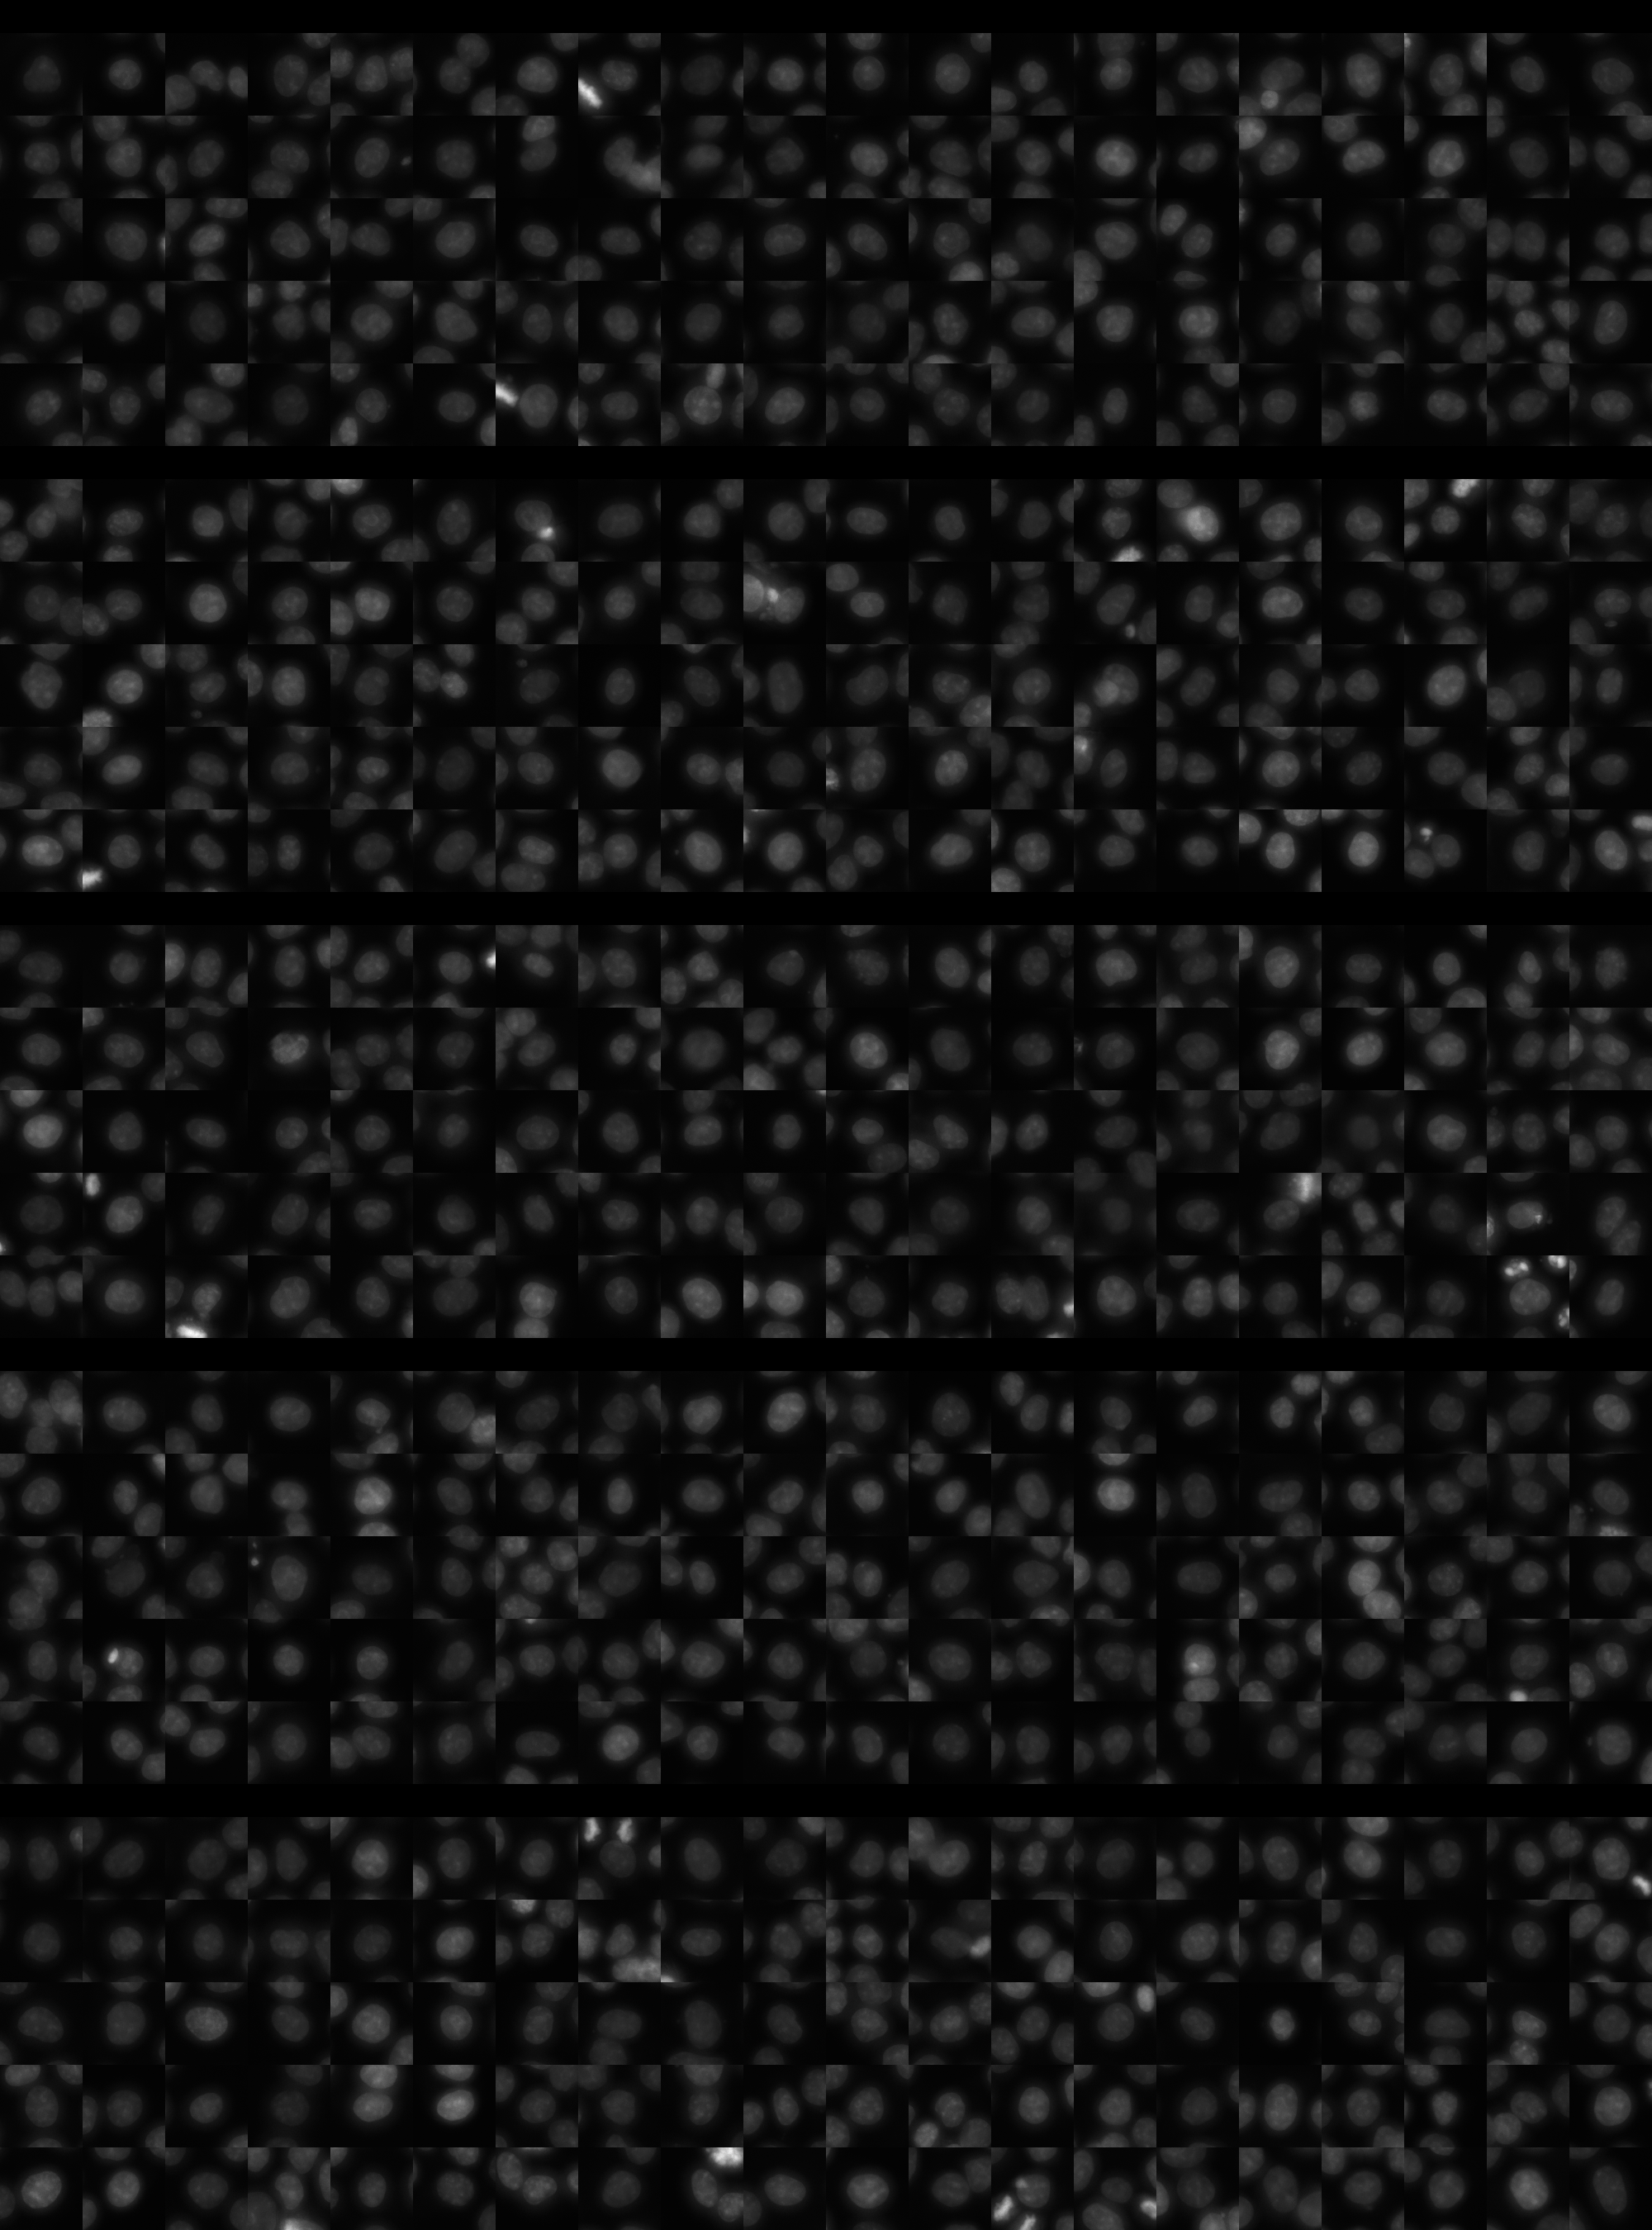
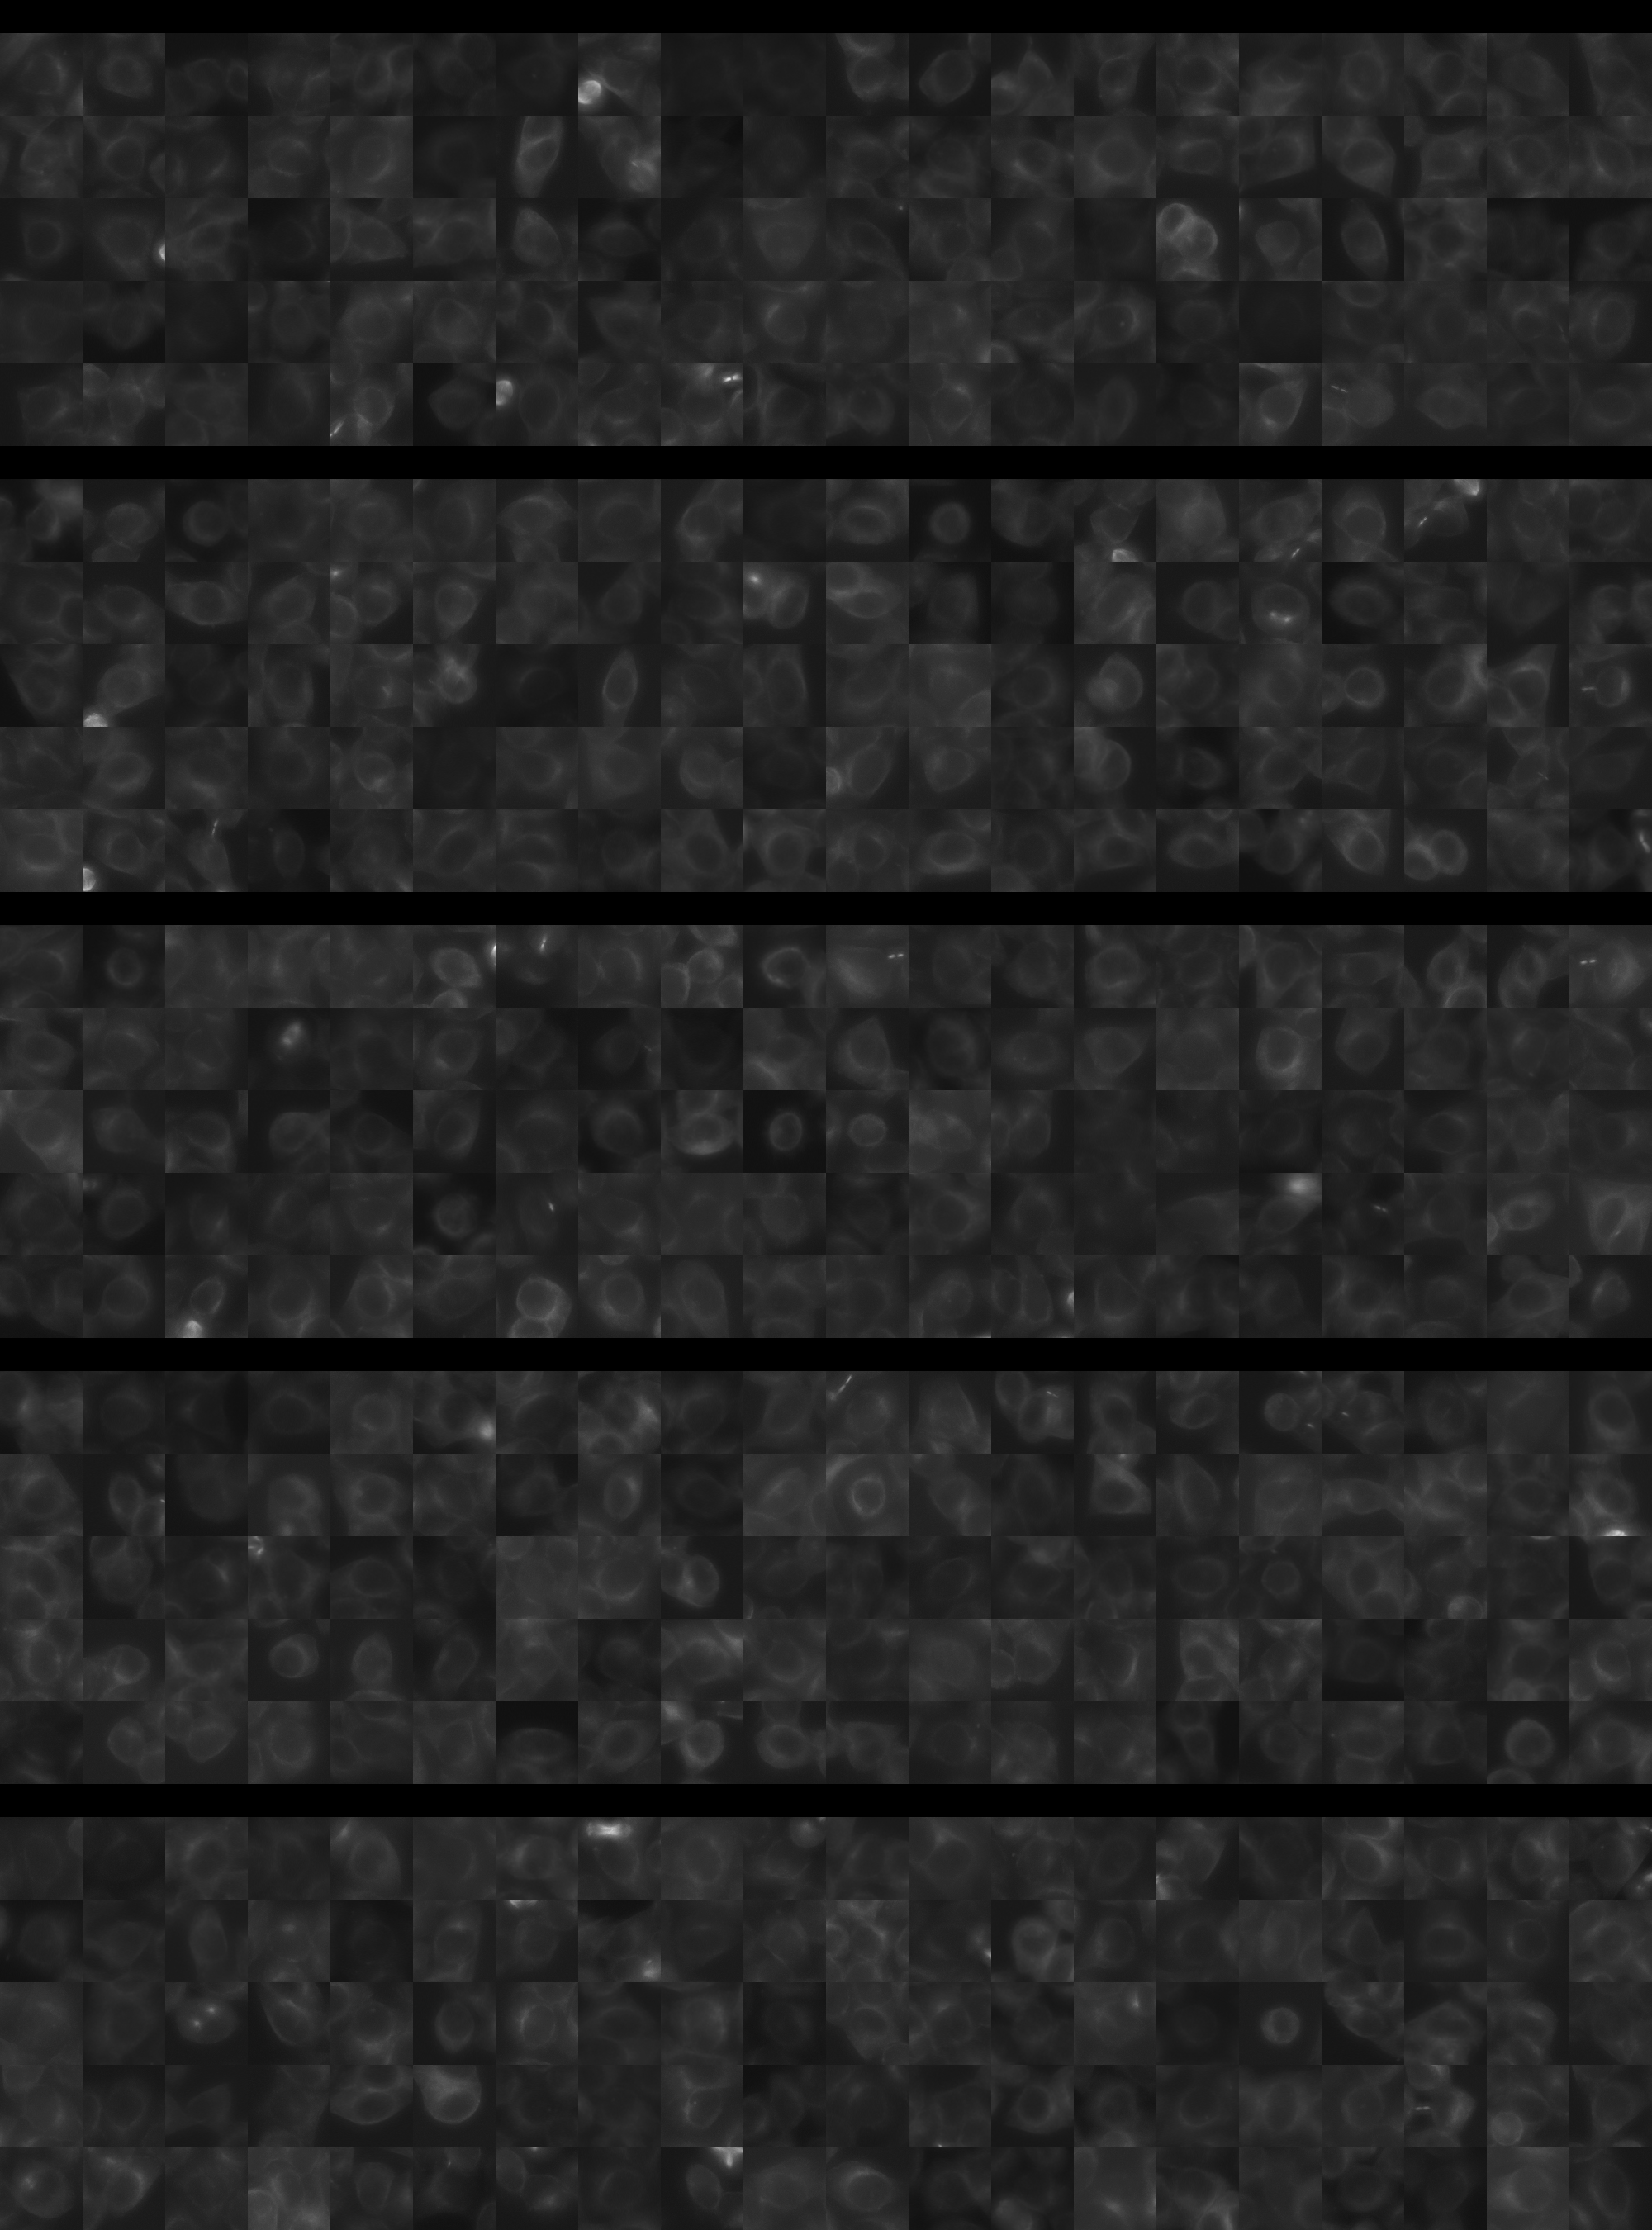
Each montage below shows randomly selected individual cell images for the same target gene separated by sgRNA, along with an example montage of cells expressing a non-targeting negative control sgRNA at the bottom. sgRNA labels in the montages correspond to the numbered sgRNA sequences in the gene info table above. The DNA (blue) and tubulin (green) channels are displayed by default, with gH2AX (grayscale) and actin (yellow) available using the check boxes. Channel brightness, contrast, and opacity are adjustable by clicking the arrow next to the channel name. When only one channel is selected, the display defaults to grayscale. Click the “Zoom” checkbox above the channel controls to enable image zooming (via scrolling) and panning (via click-and-drag).

The cell boxes displayed for this gene are square, 30.36 μm per side for the interphase montage and 30.36 μm per side for the mitotic montage.
Features

Interphase Score Rank FDR q-value
Nucleus DNA Integrated 0.026 1836 of 5322 0.776
Nucleus DNA Mean 0.043 921 of 5322 0.343
Nucleus gH2AX Mean 0.187 669 of 5322 1.367e-04
Nucleus DNA - gH2AX Correlation -8.073e-02 3469 of 5322 0.014
Nucleus Shape Area -4.972e-02 4466 of 5322 0.283
Nucleus Shape Eccentricity -7.152e-03 3697 of 5322 0.943
Nucleus Shape Form Factor -6.089e-02 3205 of 5322 0.167
Nucleus Shape Solidity -6.712e-02 3407 of 5322 0.078
Cell DNA Mass Displacement 0.016 3309 of 5322 0.859
Cell Tubulin Mean 0.122 364 of 5322 0.004
Cell Tubulin Mass Displacement 0.019 1857 of 5322 0.814
Cell Actin Mean 0.060 1351 of 5322 0.246
Cell Tubulin - Actin Correlation -2.371e-02 4596 of 5322 0.683
Cell DNA - Tubulin Correlation -1.062e-02 4187 of 5322 0.841
Cell Shape Area -5.369e-02 4429 of 5322 0.244
Cell Shape Eccentricity -2.863e-03 3900 of 5322 0.990
Mitotic Score Rank FDR q-value
Nucleus DNA Integrated 0.027 3564 of 5322 0.996
Nucleus DNA Mean -3.969e-01 5286 of 5322 1.000
Nucleus DNA Mass Displacement 0.009 3383 of 5322 0.999
Nucleus DNA Mean Frac 3 -9.908e-02 4425 of 5322 1.000
Nucleus gH2AX Mean 0.150 1132 of 5322 1.000
Nucleus gH2AX Mean Frac 0 -1.200e-01 4057 of 5322 1.000
Nucleus Tubulin Mean Frac 0 0.334 248 of 5322 0.999
Nucleus Tubulin Mean Edge -2.273e-01 4973 of 5322 0.996
Nucleus Tubulin Std Edge -1.445e-01 4305 of 5322 0.999
Nucleus Shape Area 0.103 2627 of 5322 0.990
Nucleus Shape Eccentricity -3.082e-03 2160 of 5322 1.000
Nucleus Shape Form Factor 0.156 198 of 5322 0.998
Cell Tubulin Mean -2.528e-01 5176 of 5322 0.975
Cell Tubulin Mean Frac 3 -4.657e-02 2257 of 5322 0.999
Cell Actin Mean -1.649e-01 4891 of 5322 0.997
Cell Shape Area 0.039 3416 of 5322 0.999
( Reset Zoom )
Brightness
Contrast
Opacity
Brightness
Contrast
Opacity
Brightness
Contrast
Opacity
Brightness
Contrast
Opacity
Brightness
Contrast
Opacity

( Reset Zoom )
Brightness
Contrast
Opacity
Brightness
Contrast
Opacity
Brightness
Contrast
Opacity
Brightness
Contrast
Opacity
Brightness
Contrast
Opacity

MIT Central Accessability