ABCG1

Gene symbol: ABCG1
Gene: 9619
Uniprot Function: Catalyzes the efflux of phospholipids such as sphingomyelin, cholesterol and its oxygenated derivatives like 7beta-hydroxycholesterol and this transport is coupled to hydrolysis of ATP (PubMed:17408620, PubMed:24576892). The lipid efflux is ALB-dependent (PubMed:16702602). Is an active component of the macrophage lipid export complex. Could also be involved in intracellular lipid transport processes. The role in cellular lipid homeostasis may not be limited to macrophages. Prevents cell death by transporting cytotoxic 7beta-hydroxycholesterol (PubMed:17408620).
Mitotic Index 0.0282
Interphase Cluster: #61 (29 genes)
Mitotic Cluster: #51 (29 genes)
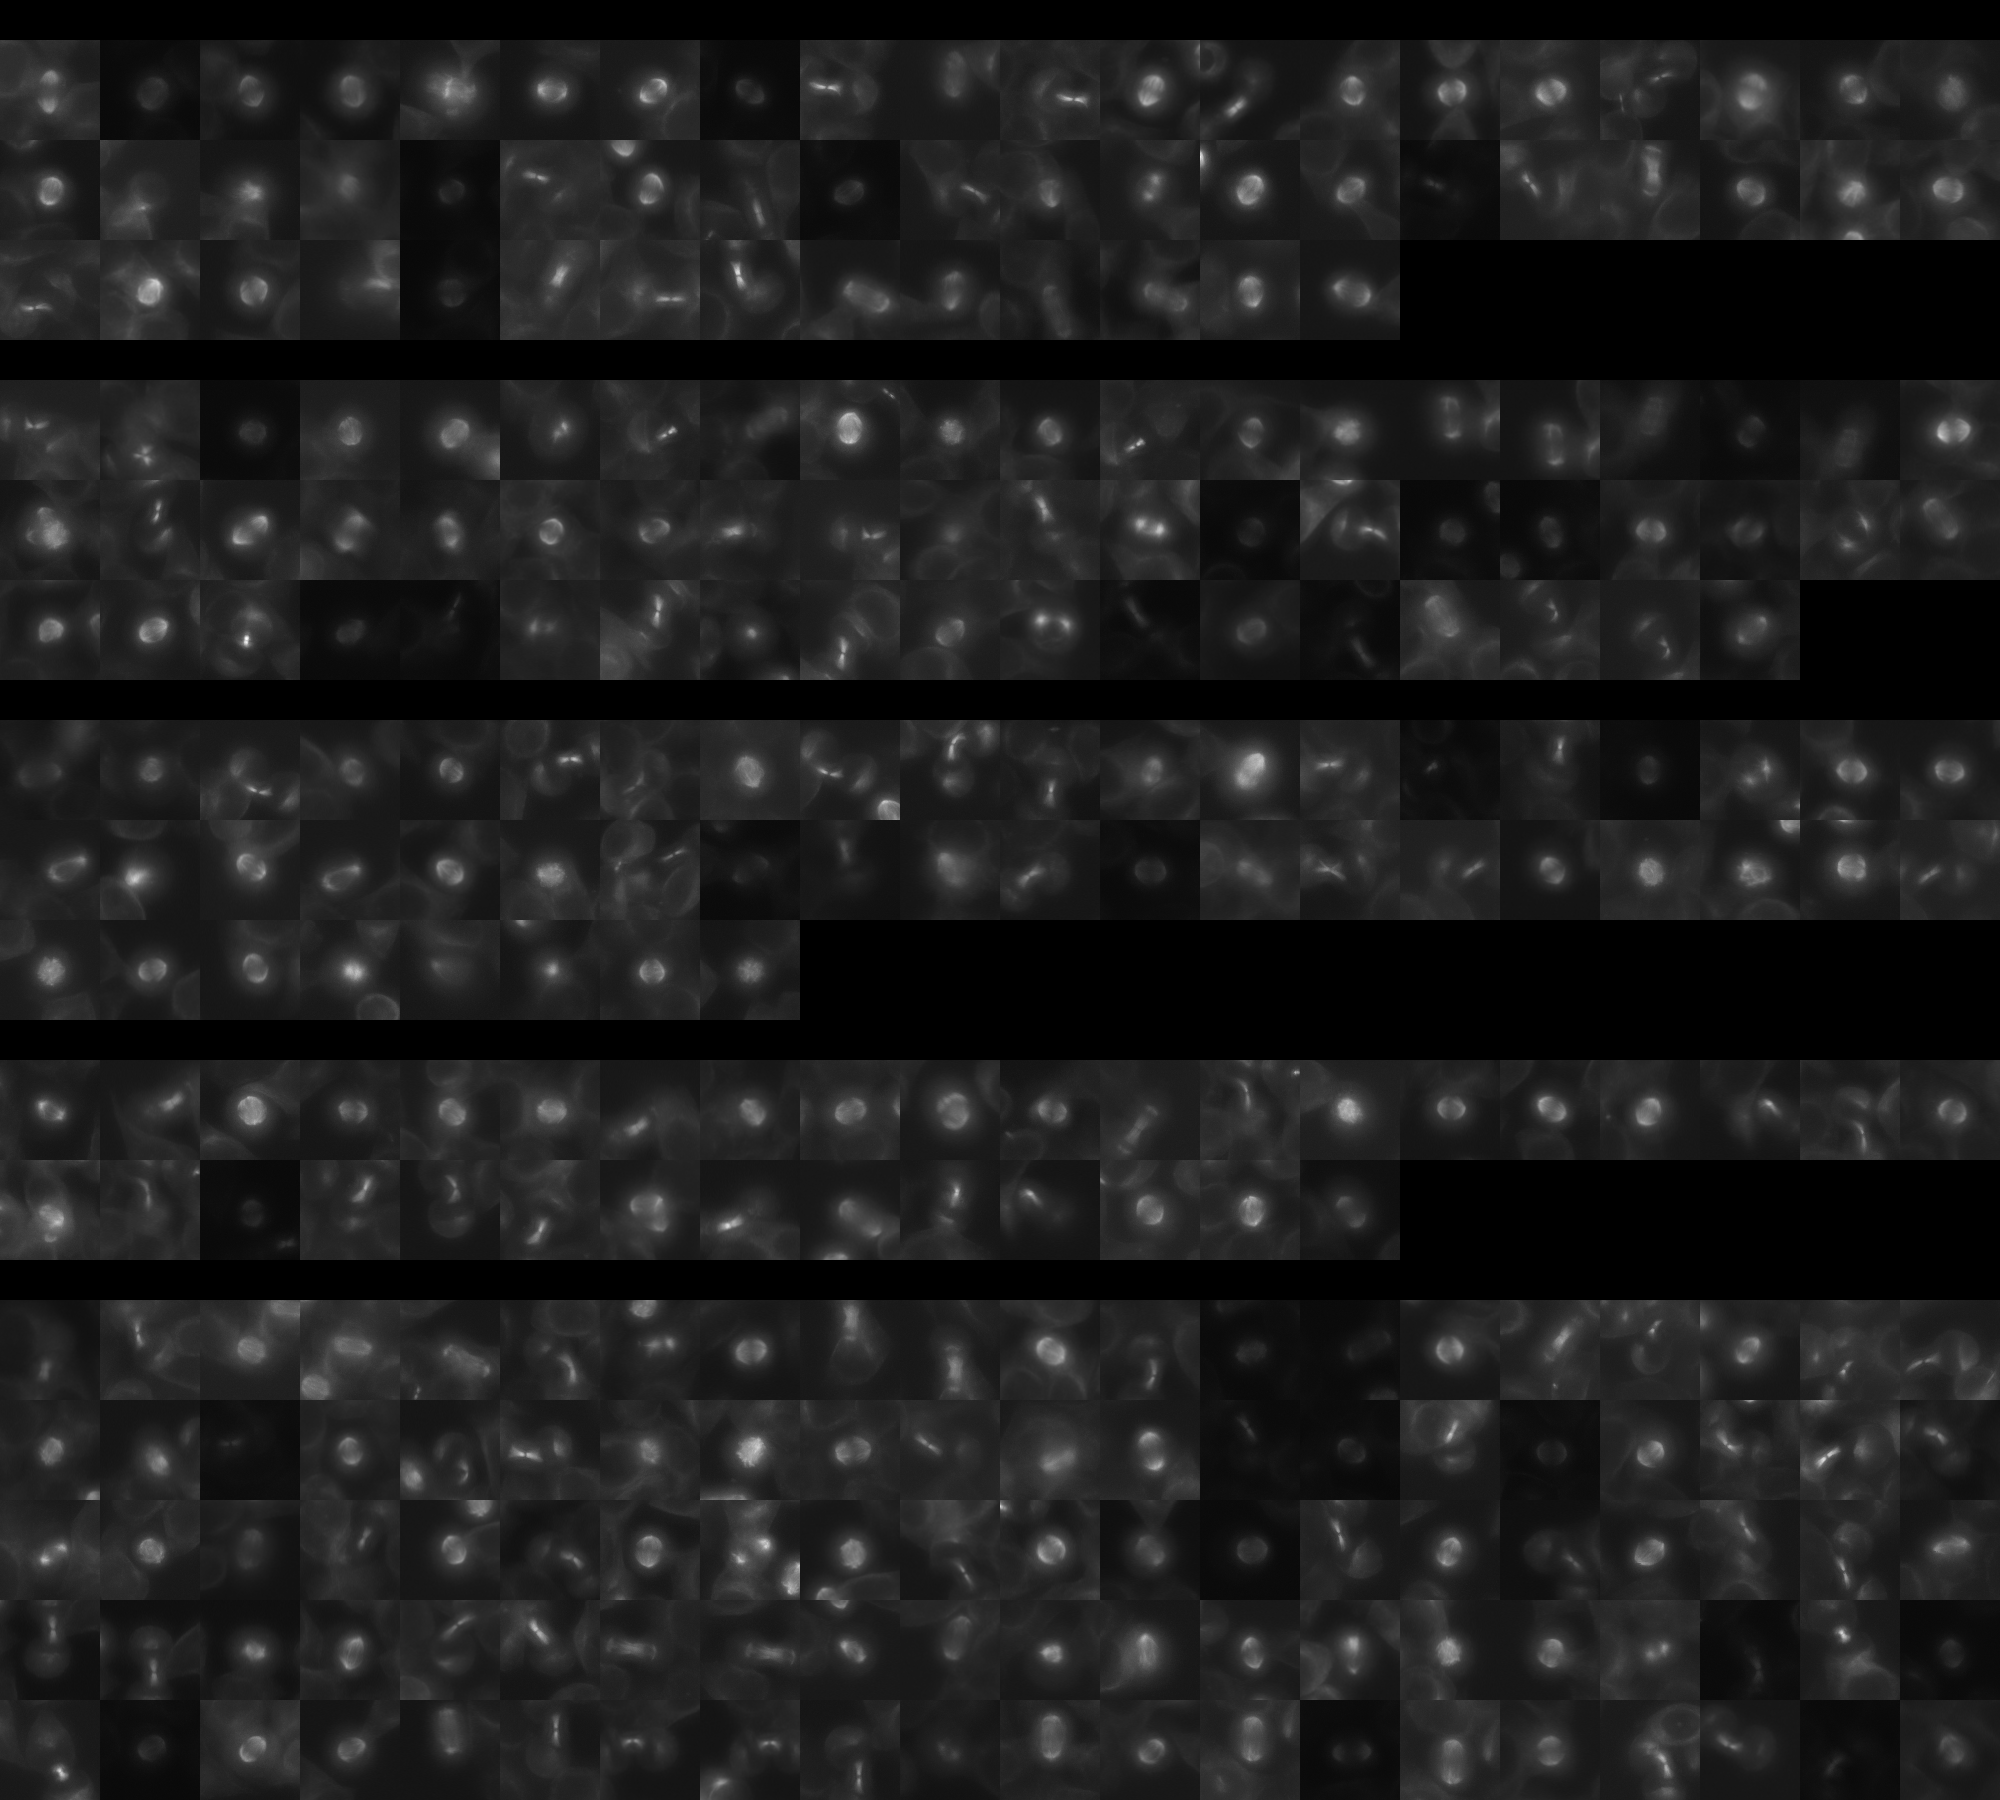
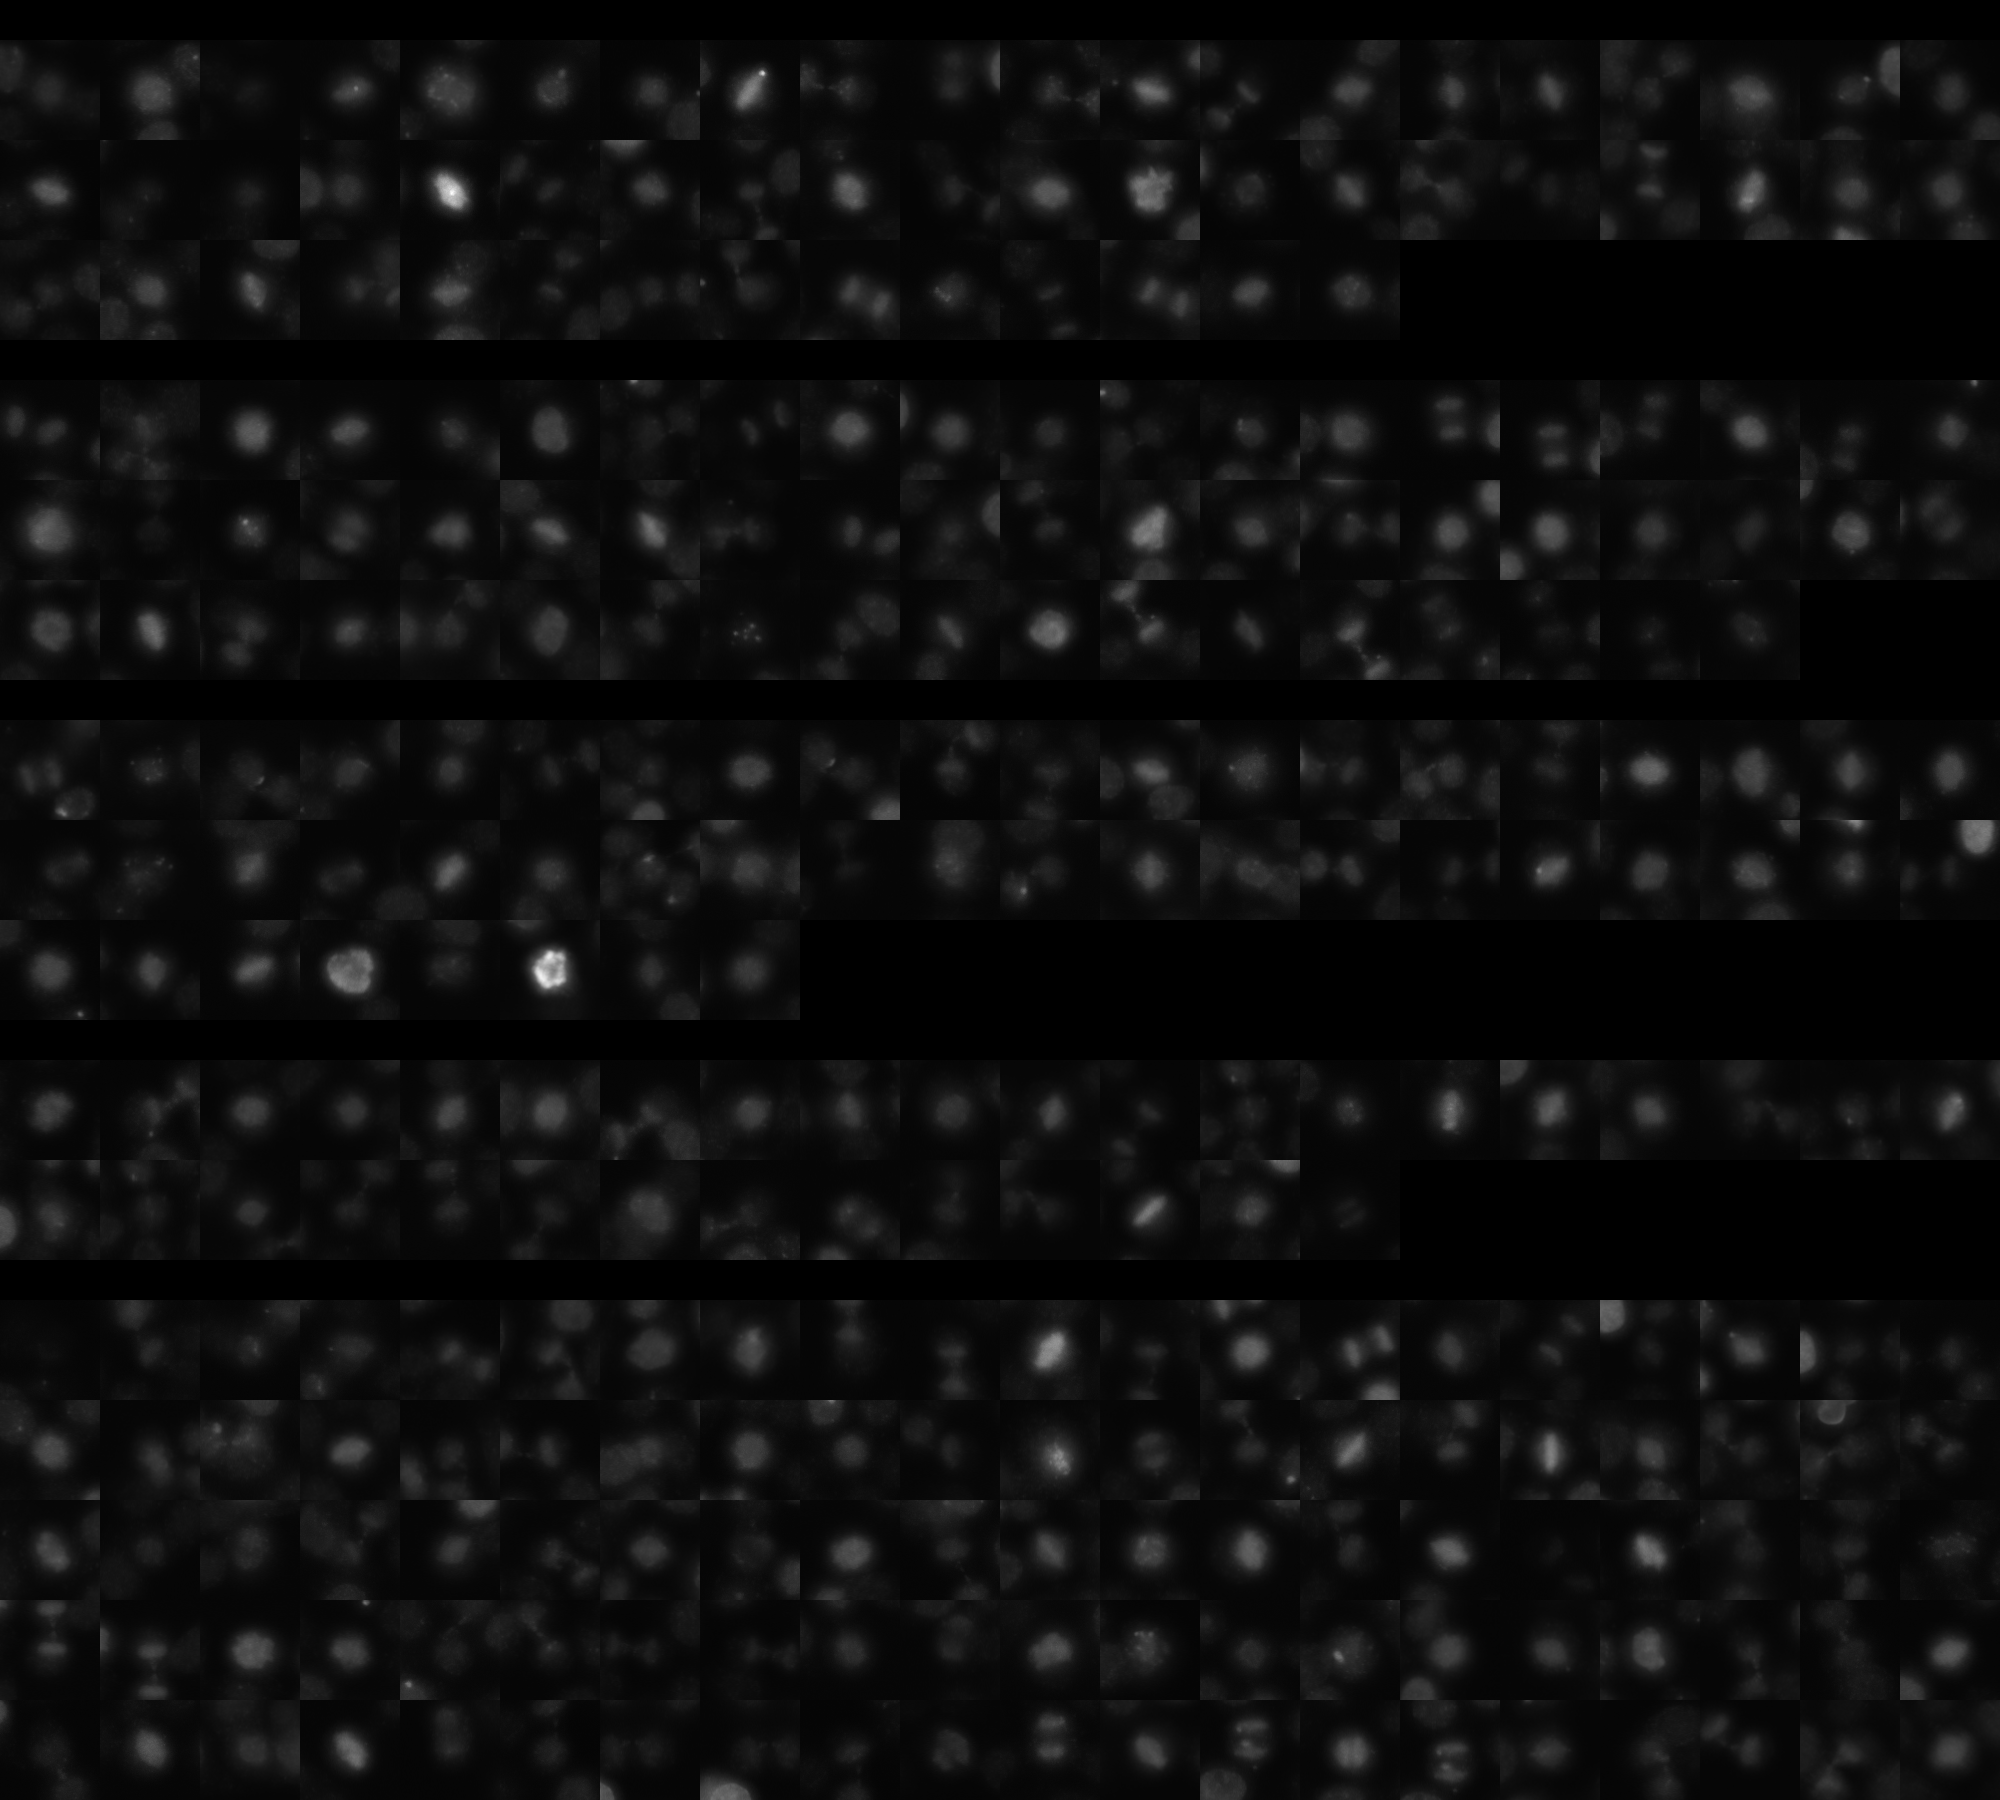
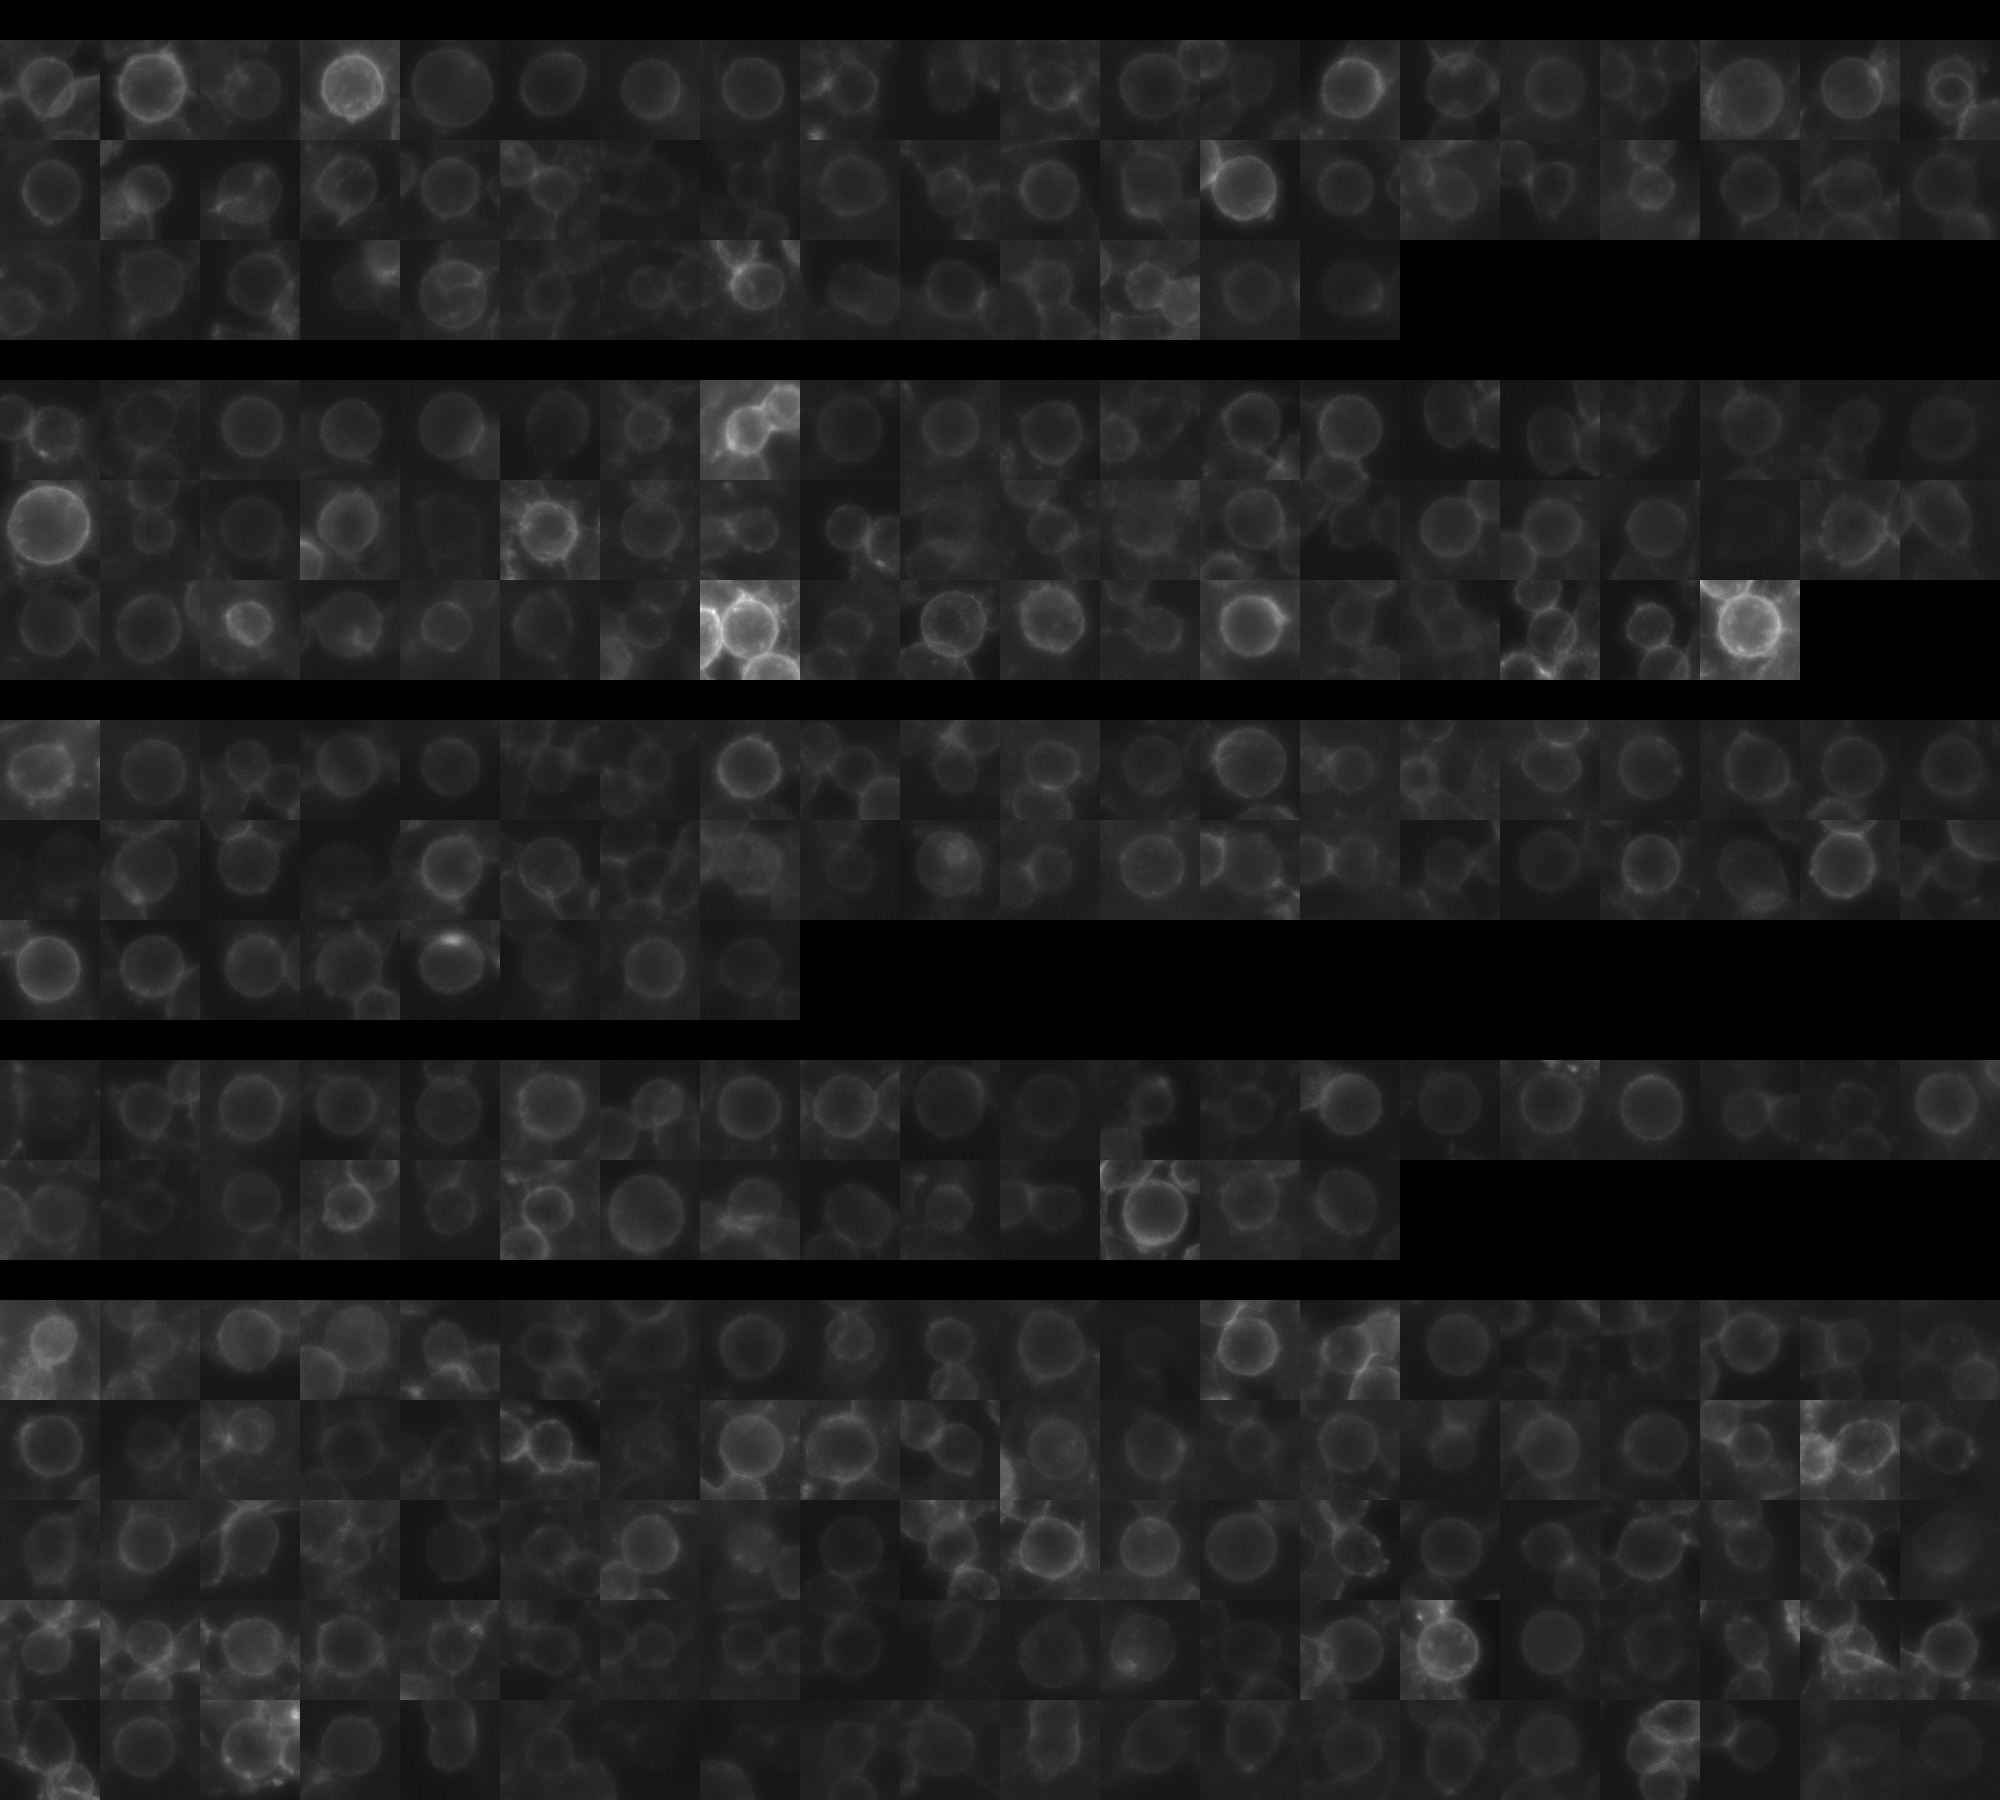
sgRNA 1: CTTCAGGAACCGAATAGGAA (interphase cells: 2066, mitotic cells: 54)
sgRNA 2: GACCACAAGAGAGACCTCGG (interphase cells: 1749, mitotic cells: 58)
sgRNA 3: GAGGCCGATCCCAATGTGCG (interphase cells: 1718, mitotic cells: 48)
sgRNA 4: TTTCTCGGTCGGCACCGCCA (interphase cells: 1157, mitotic cells: 34)

Interphase Cluster

Mitotic Cluster

Overview

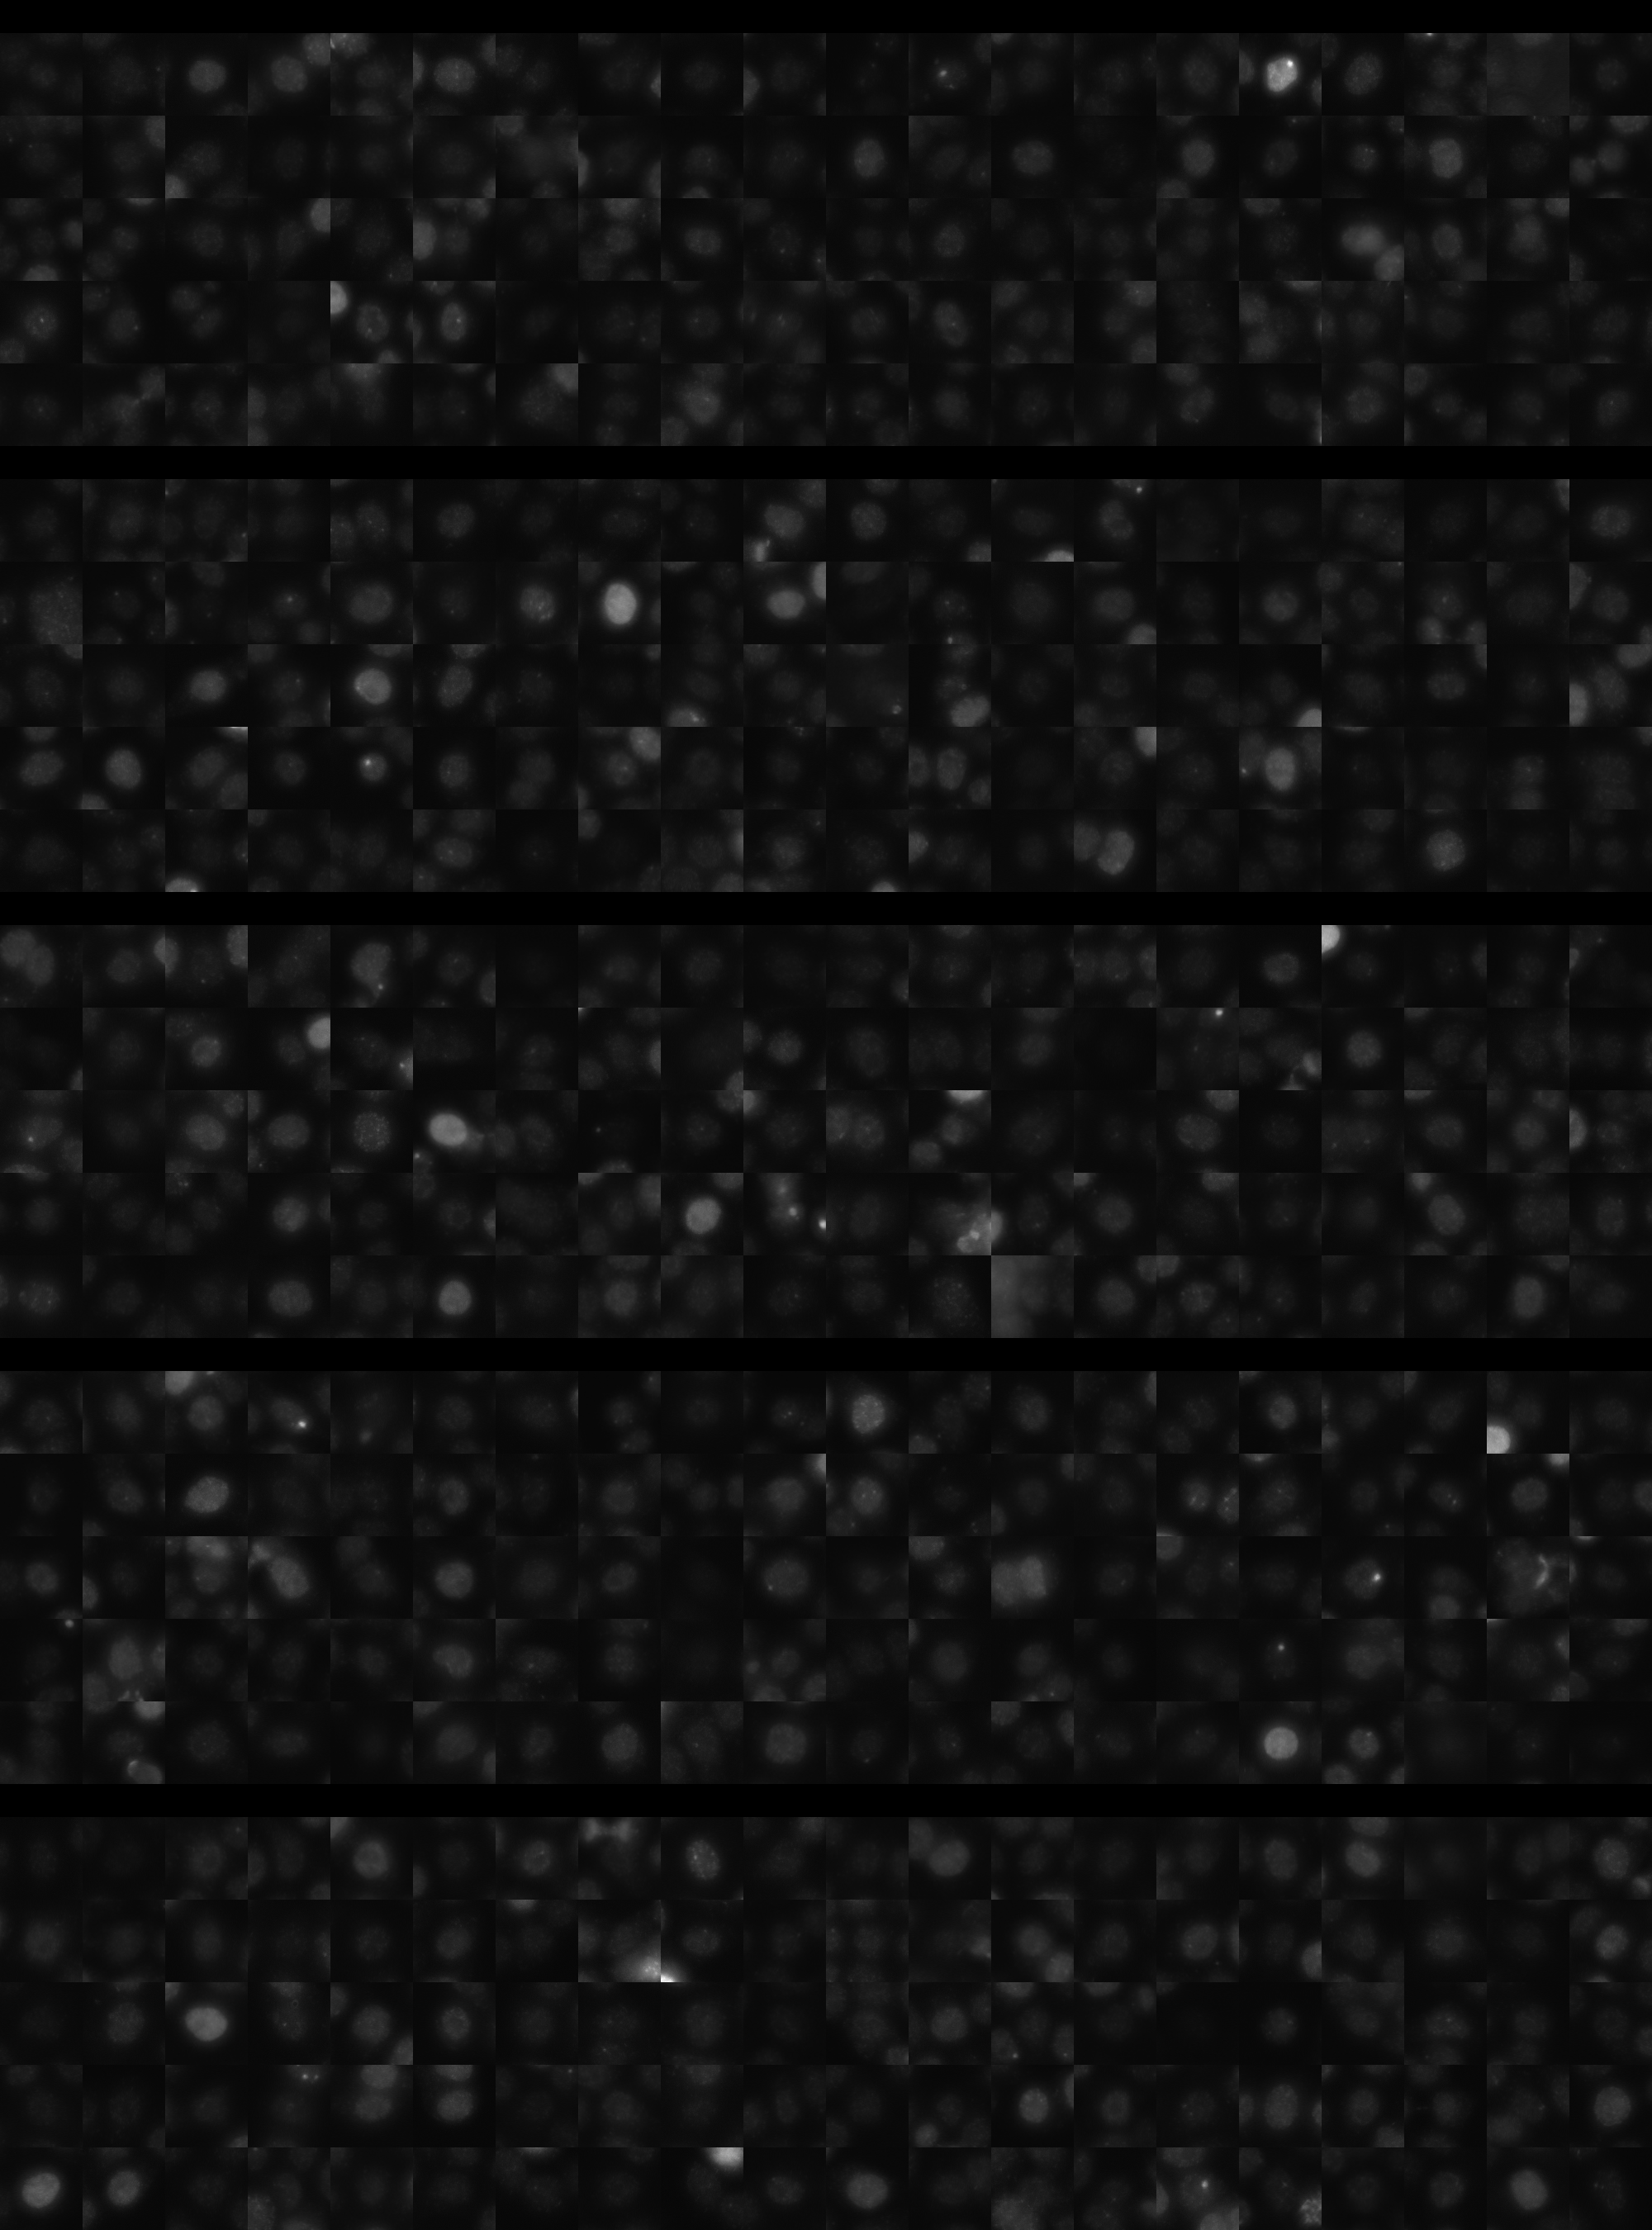
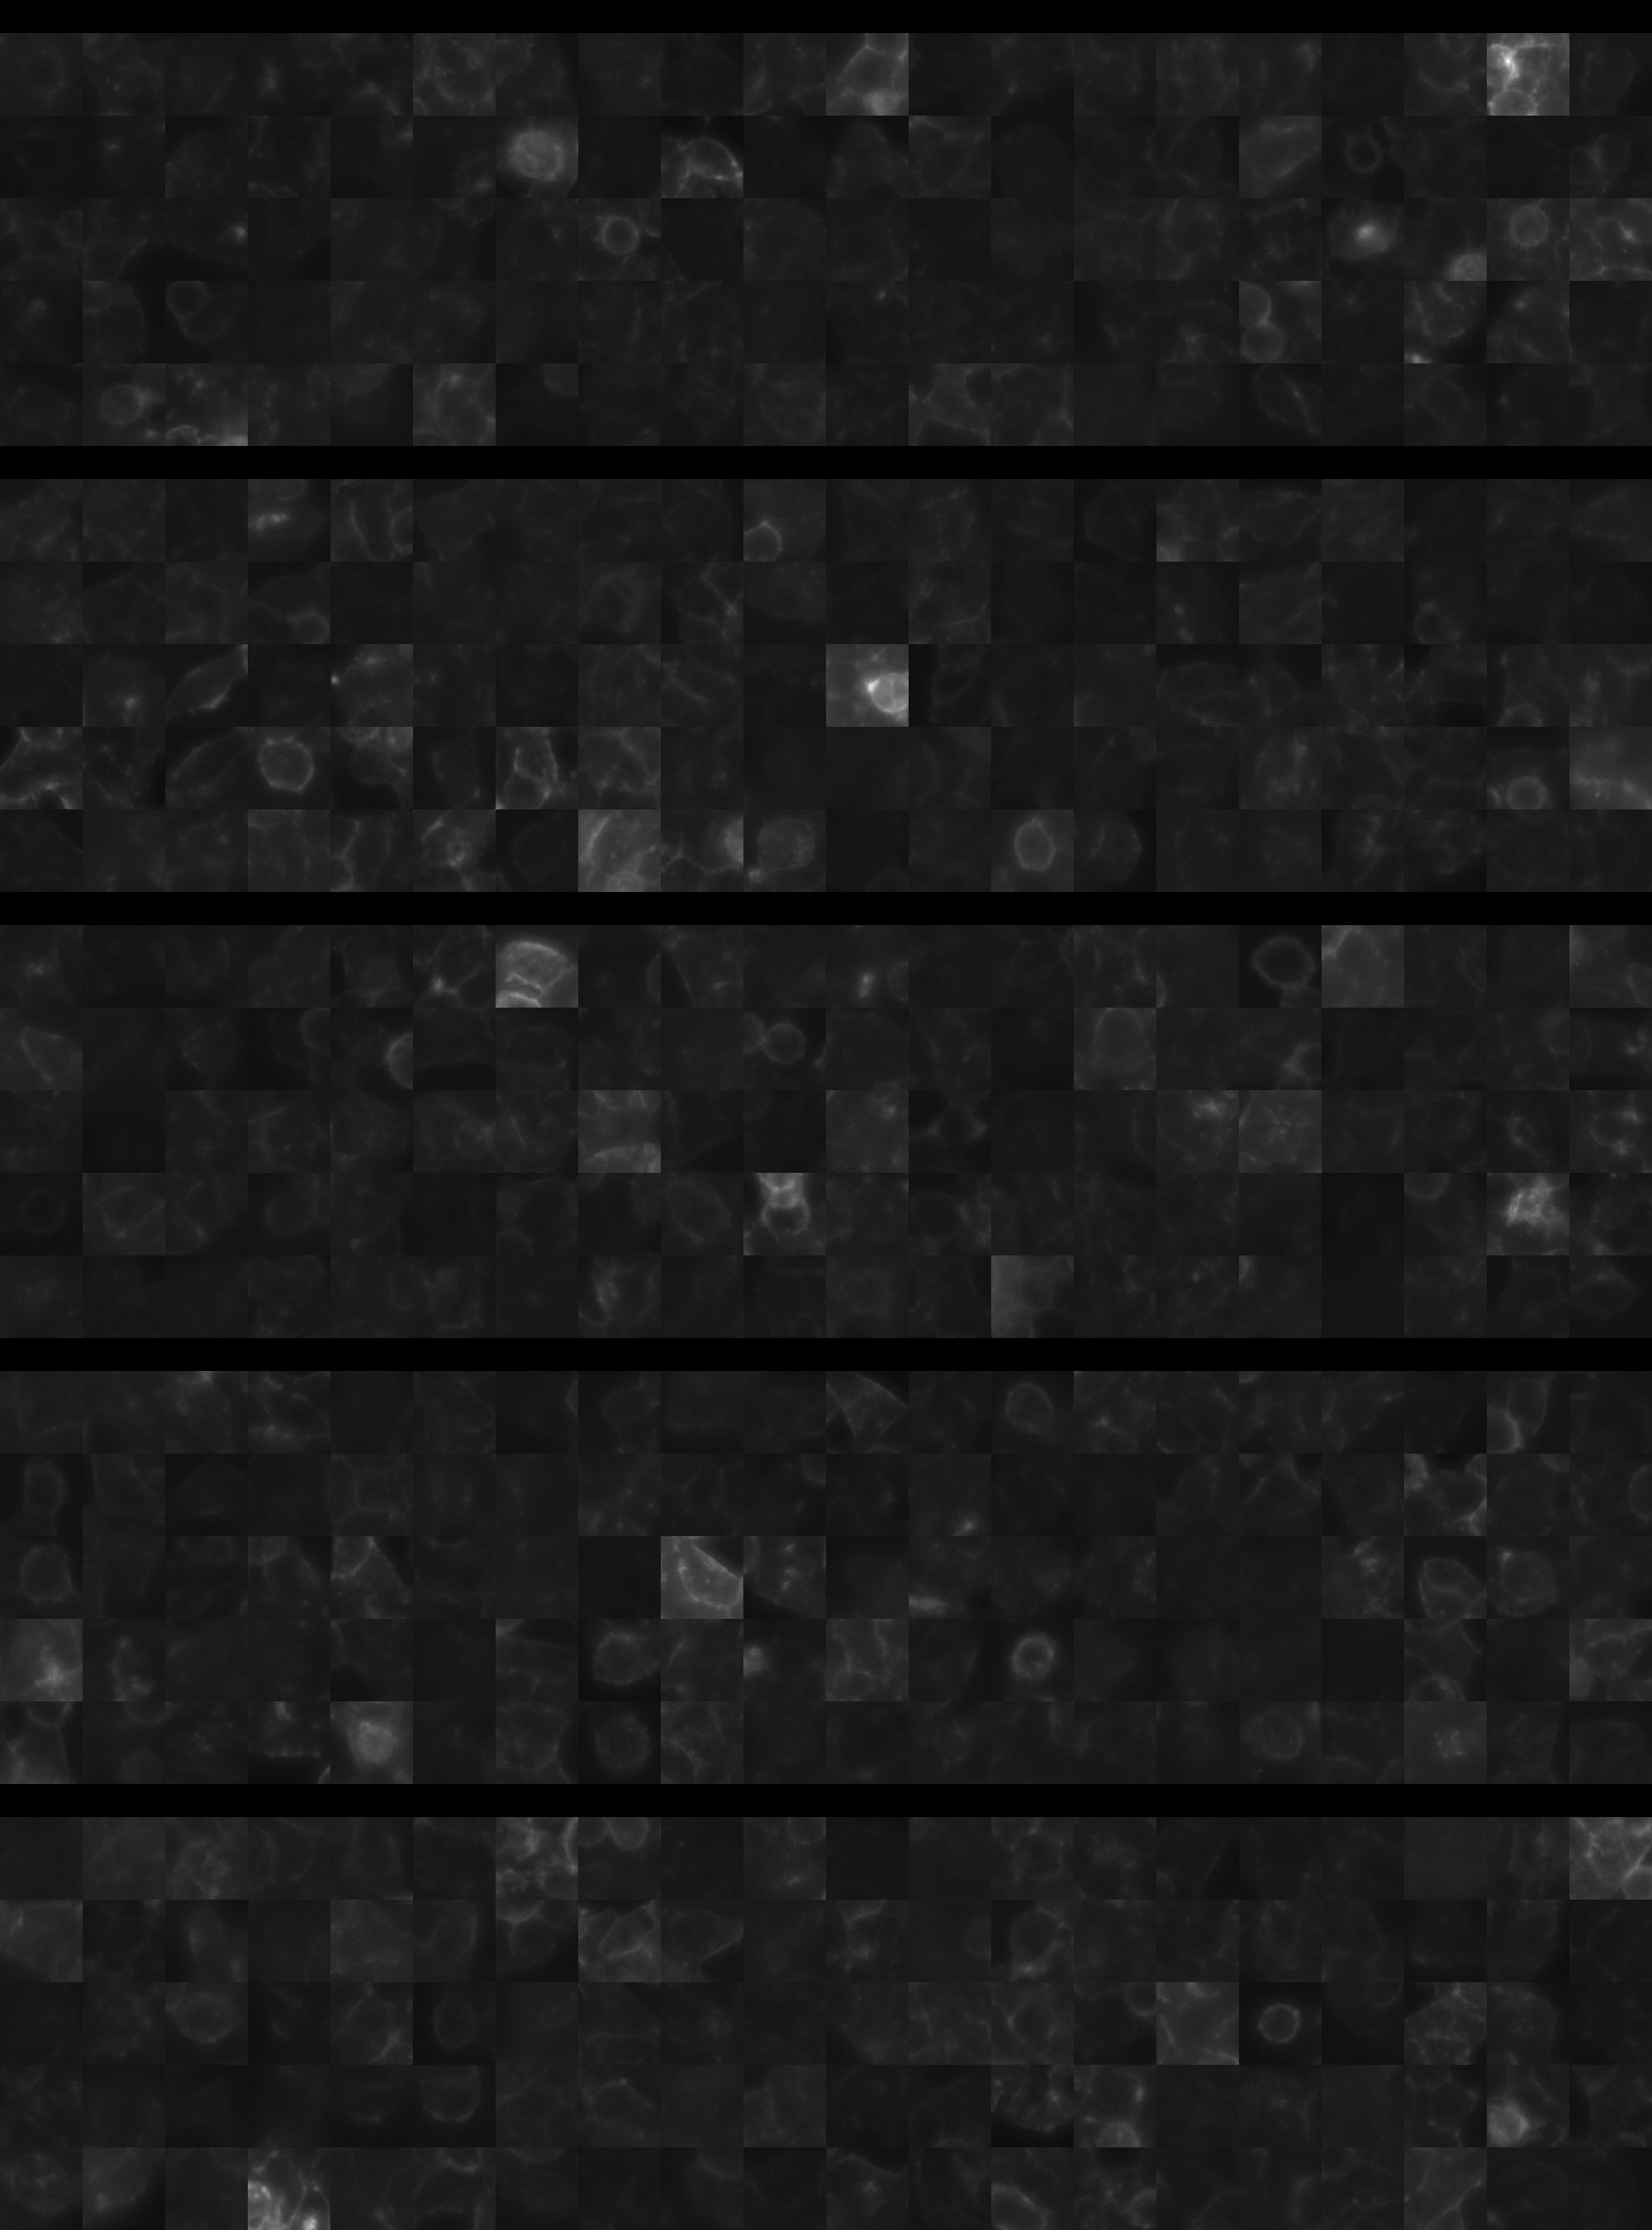
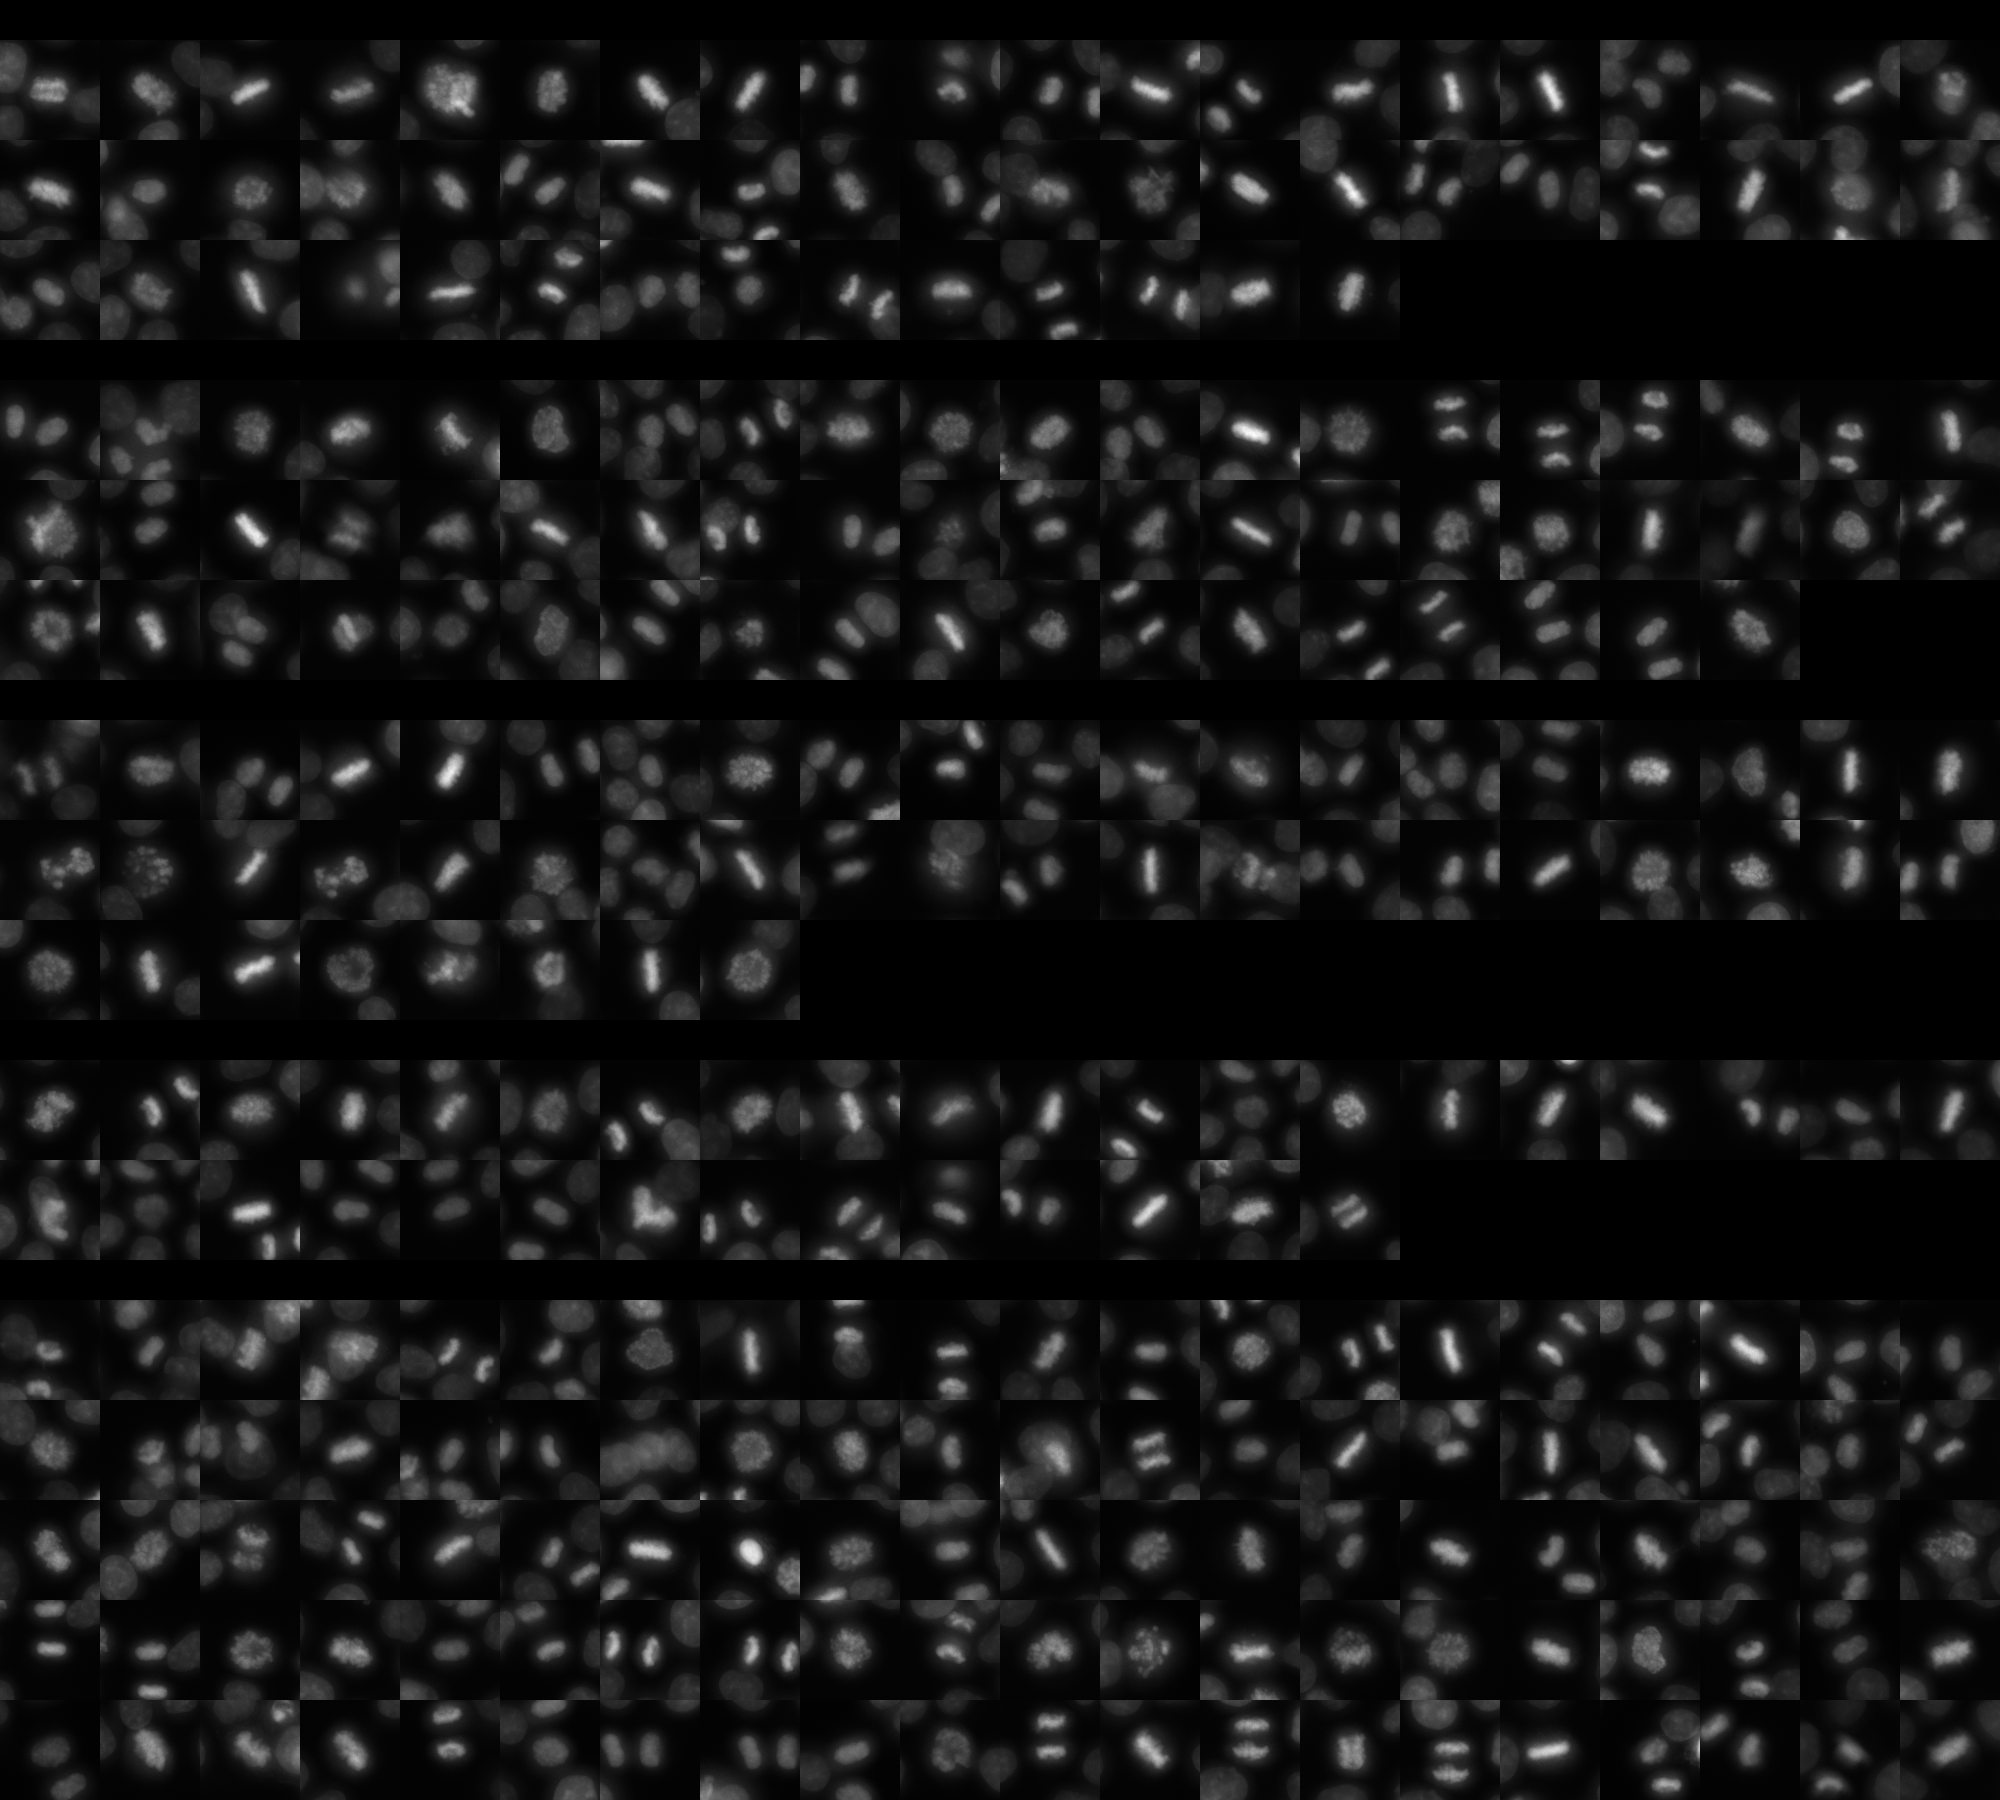
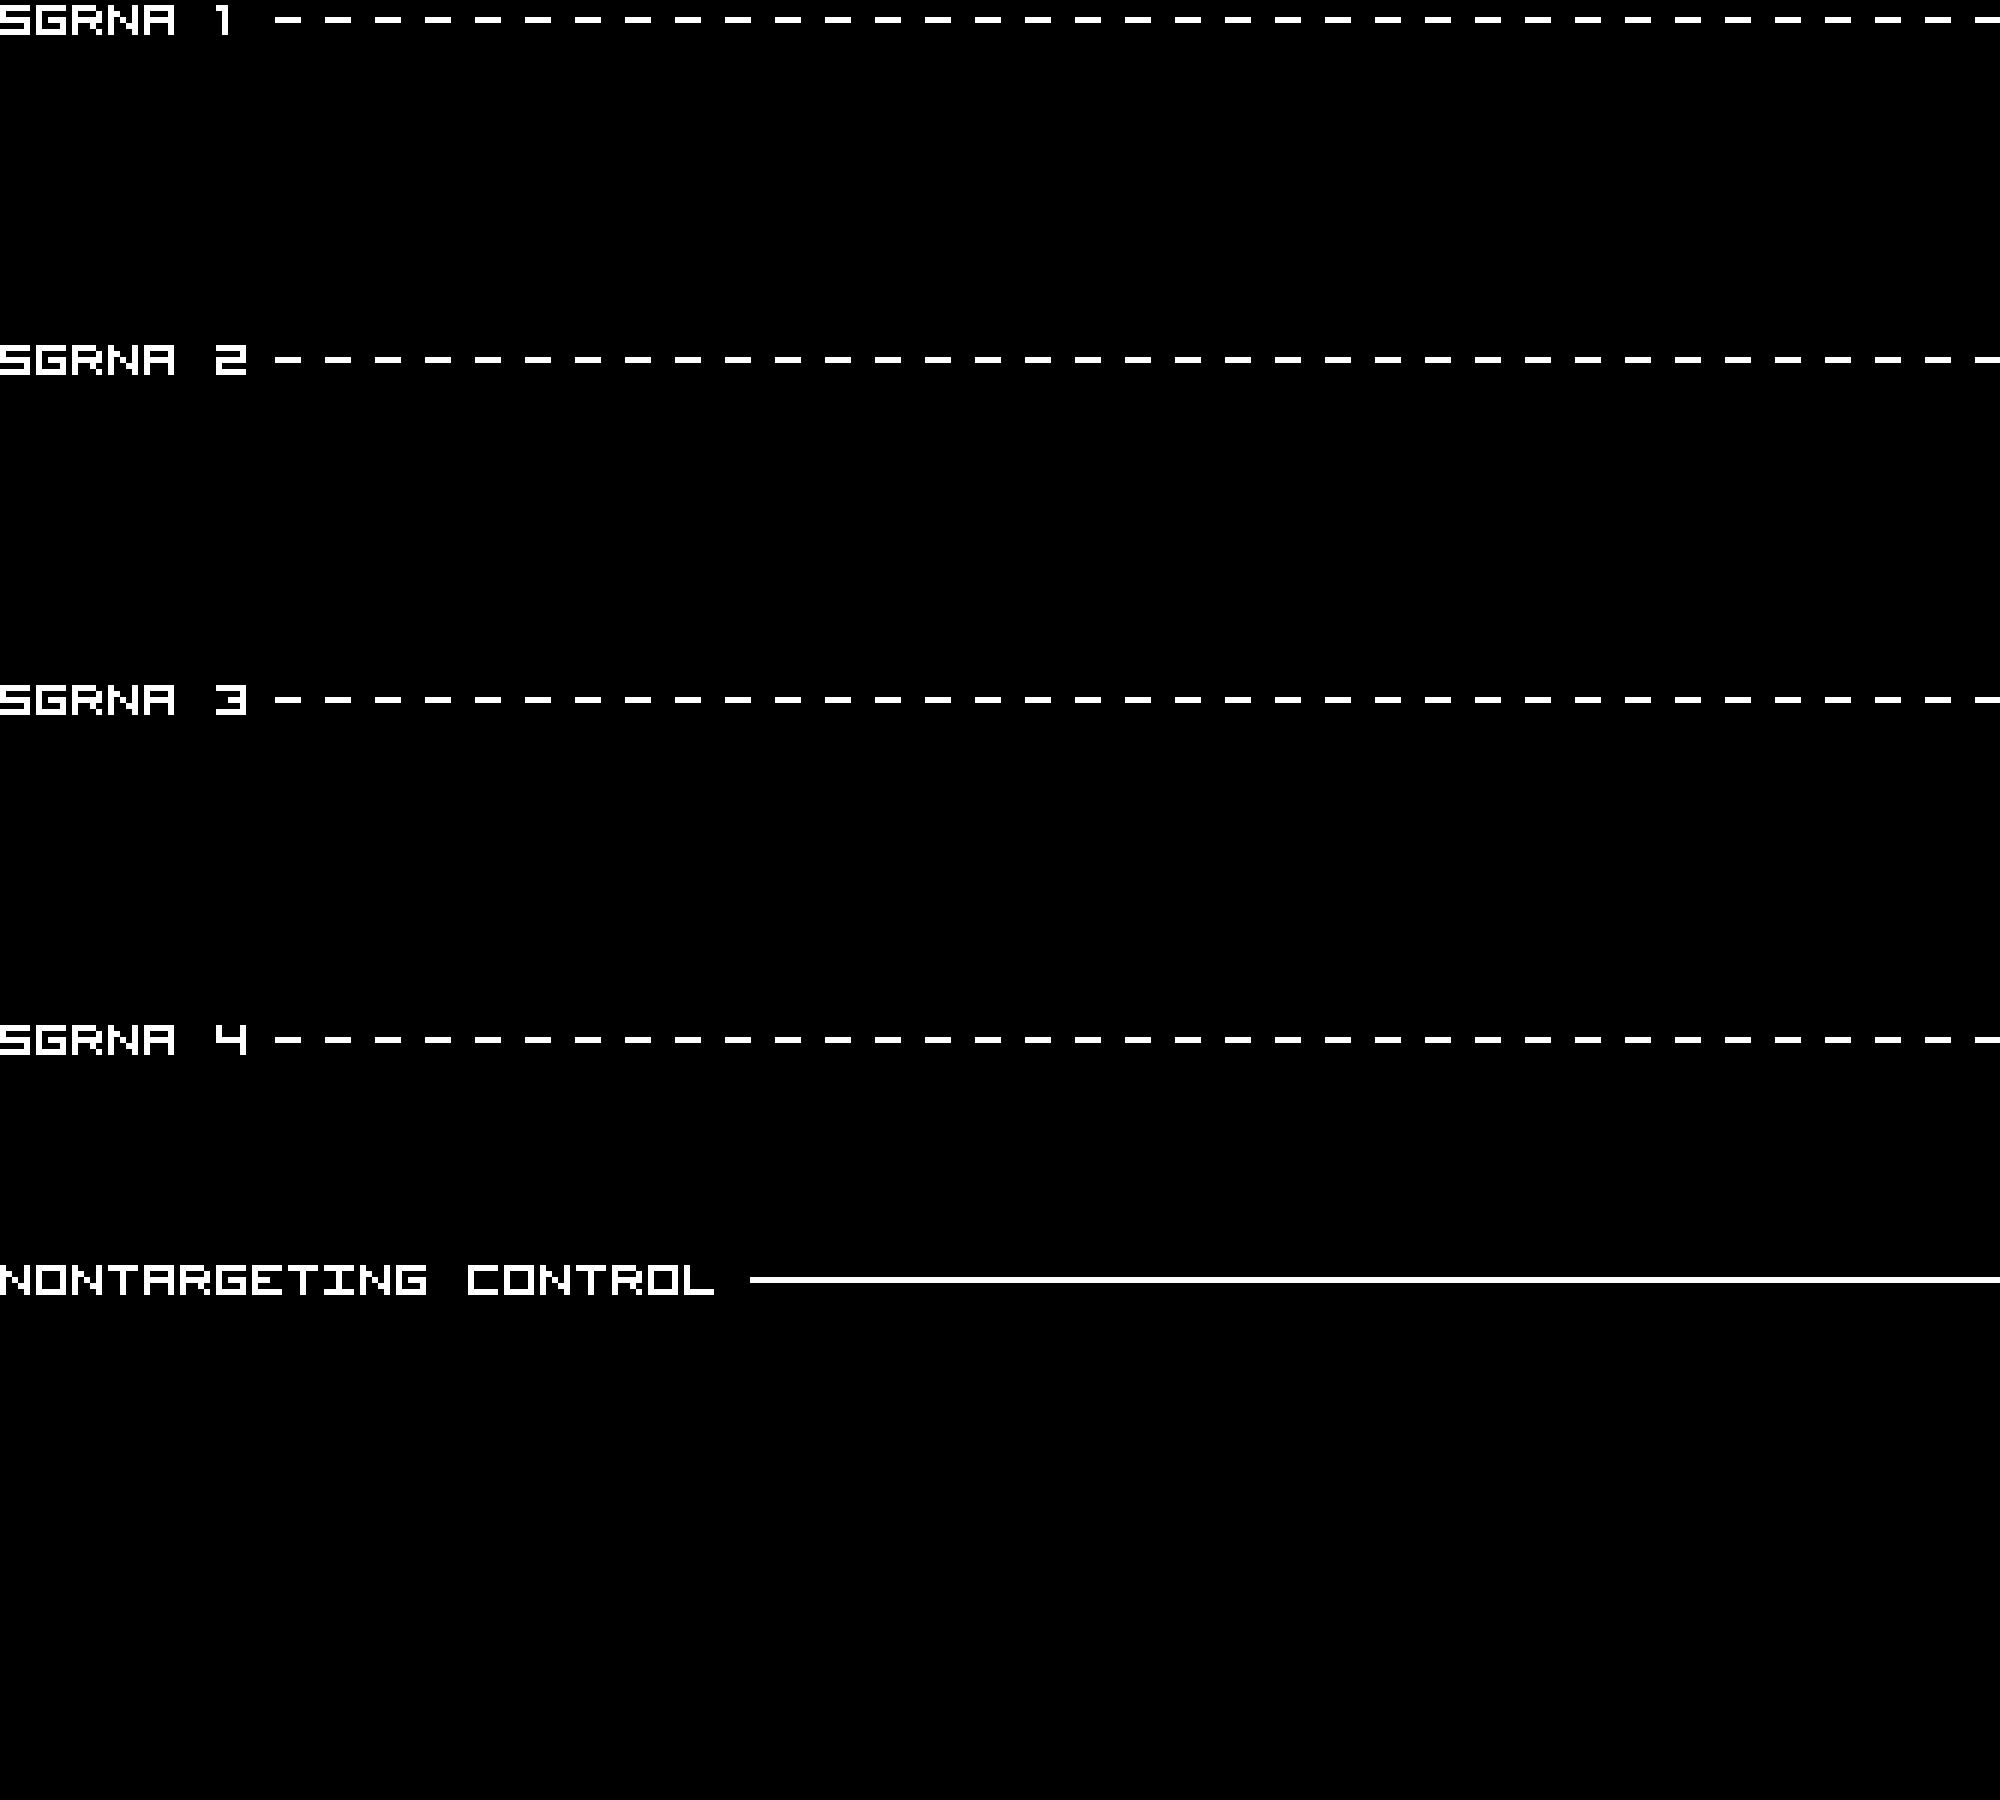
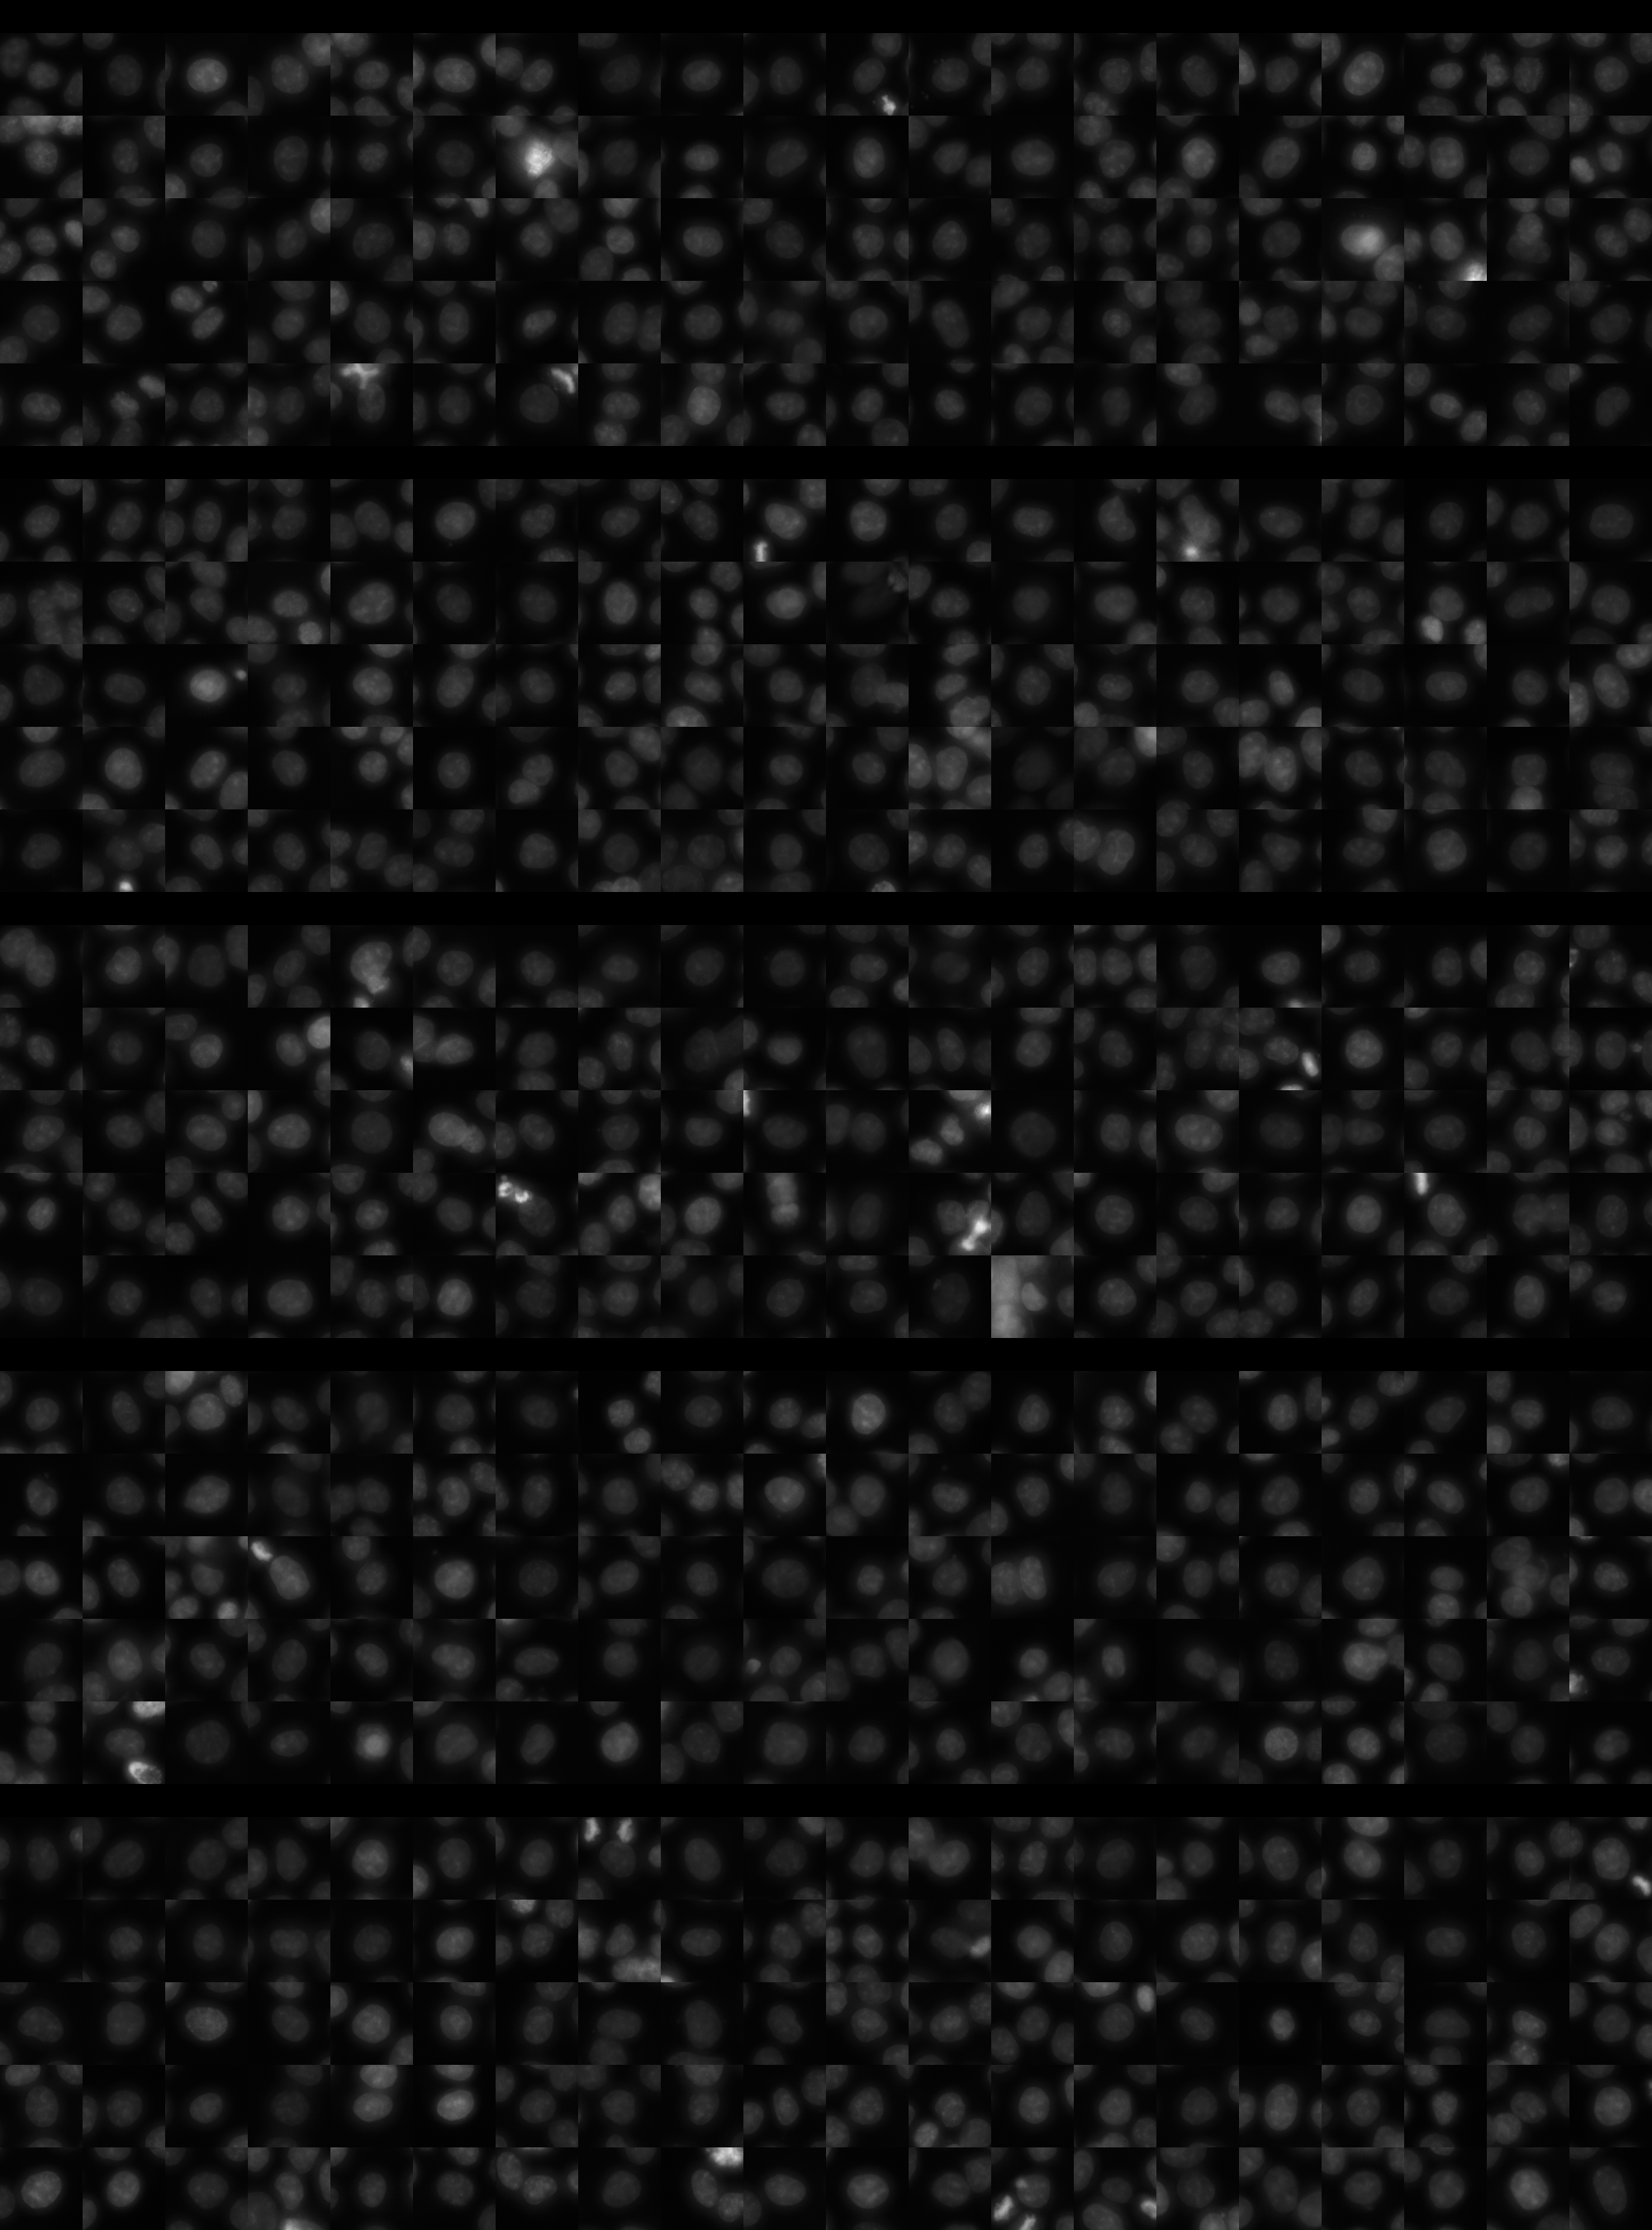
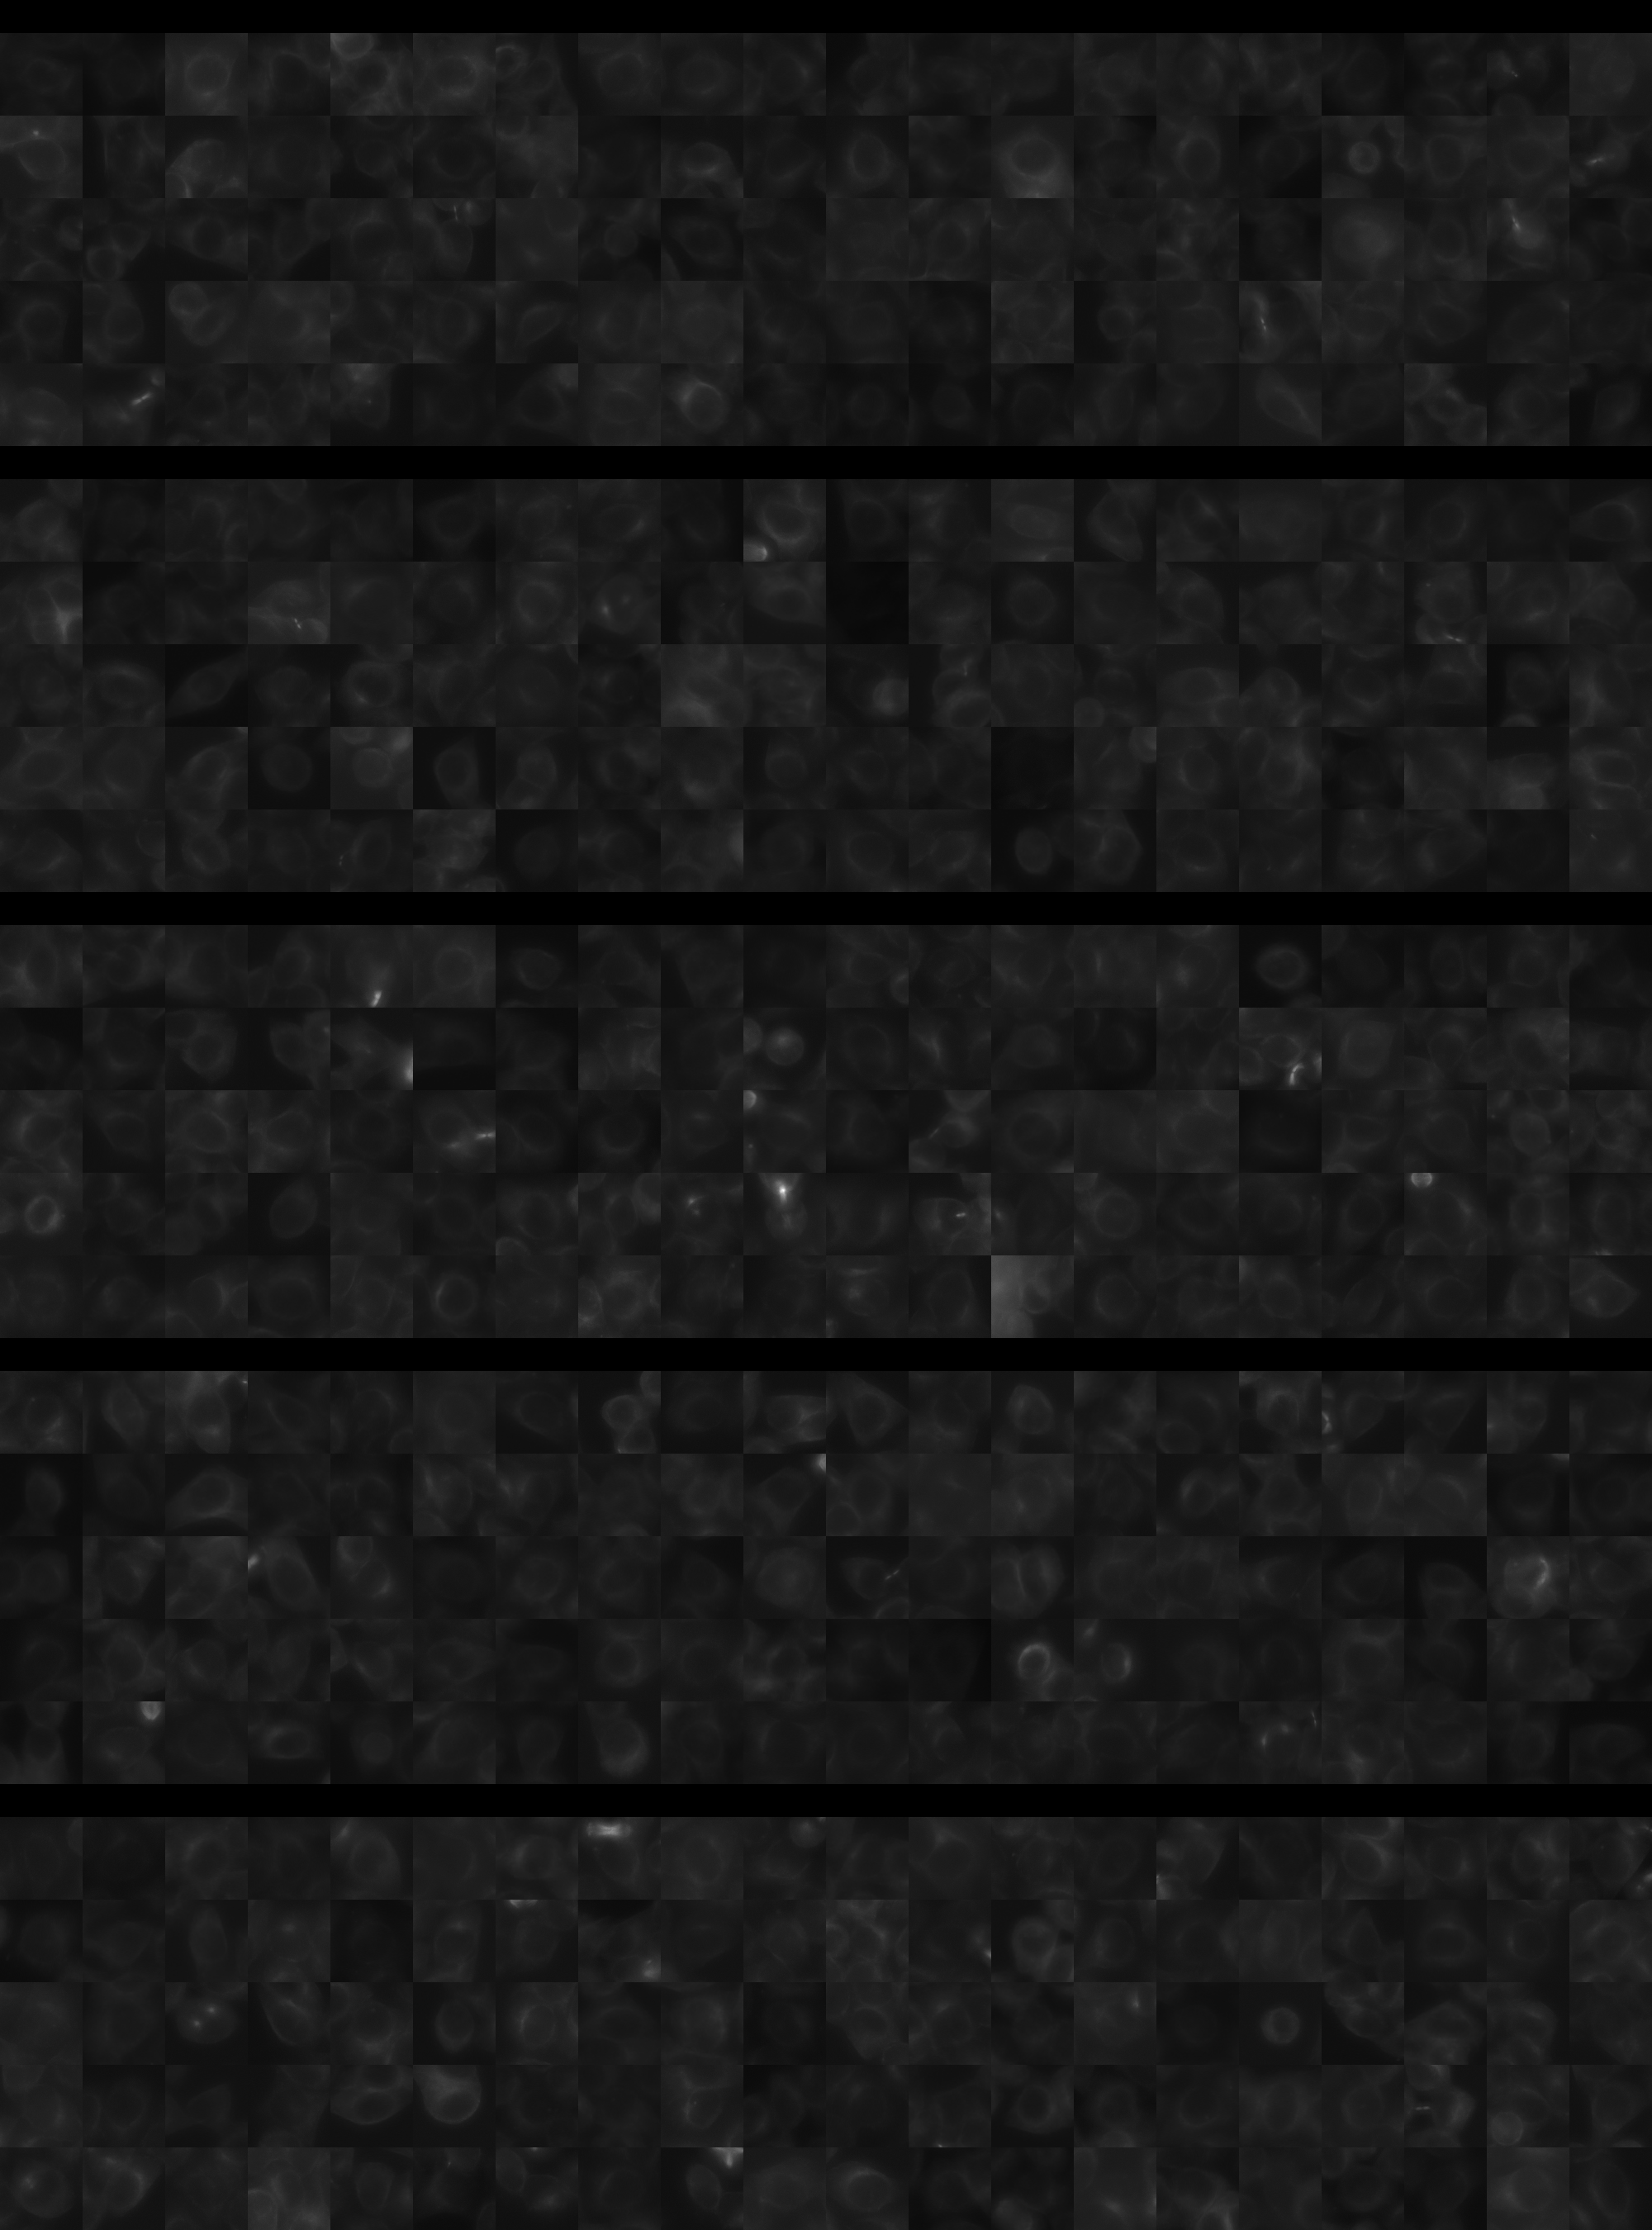
Each montage below shows randomly selected individual cell images for the same target gene separated by sgRNA, along with an example montage of cells expressing a non-targeting negative control sgRNA at the bottom. sgRNA labels in the montages correspond to the numbered sgRNA sequences in the gene info table above. The DNA (blue) and tubulin (green) channels are displayed by default, with gH2AX (grayscale) and actin (yellow) available using the check boxes. Channel brightness, contrast, and opacity are adjustable by clicking the arrow next to the channel name. When only one channel is selected, the display defaults to grayscale. Click the “Zoom” checkbox above the channel controls to enable image zooming (via scrolling) and panning (via click-and-drag).

The cell boxes displayed for this gene are square, 30.36 μm per side for the interphase montage and 30.36 μm per side for the mitotic montage.
Features

Interphase Score Rank FDR q-value
Nucleus DNA Integrated -2.432e-02 4202 of 5322 0.679
Nucleus DNA Mean -5.547e-02 3748 of 5322 0.182
Nucleus gH2AX Mean 0.034 3946 of 5322 0.368
Nucleus DNA - gH2AX Correlation -7.429e-02 3248 of 5322 0.009
Nucleus Shape Area 0.046 1766 of 5322 0.450
Nucleus Shape Eccentricity 0.021 2192 of 5322 0.616
Nucleus Shape Form Factor -6.876e-02 3507 of 5322 0.070
Nucleus Shape Solidity -4.087e-02 2281 of 5322 0.214
Cell DNA Mass Displacement -7.664e-03 4713 of 5322 0.869
Cell Tubulin Mean 0.037 1444 of 5322 0.364
Cell Tubulin Mass Displacement 0.006 2620 of 5322 0.933
Cell Actin Mean -8.997e-03 3292 of 5322 0.916
Cell Tubulin - Actin Correlation 0.007 3347 of 5322 0.888
Cell DNA - Tubulin Correlation 0.031 2545 of 5322 0.425
Cell Shape Area 0.015 2665 of 5322 0.944
Cell Shape Eccentricity -5.722e-03 4095 of 5322 0.973
Mitotic Score Rank FDR q-value
Nucleus DNA Integrated 0.098 2520 of 5322 0.965
Nucleus DNA Mean -6.521e-02 3899 of 5322 1.000
Nucleus DNA Mass Displacement -2.918e-02 3950 of 5322 0.999
Nucleus DNA Mean Frac 3 -1.590e-01 4856 of 5322 1.000
Nucleus gH2AX Mean -2.660e-02 3301 of 5322 1.000
Nucleus gH2AX Mean Frac 0 0.002 2244 of 5322 1.000
Nucleus Tubulin Mean Frac 0 -5.583e-02 4239 of 5322 0.999
Nucleus Tubulin Mean Edge -5.620e-02 3878 of 5322 0.999
Nucleus Tubulin Std Edge -6.006e-02 3396 of 5322 0.999
Nucleus Shape Area -1.164e-02 4069 of 5322 0.990
Nucleus Shape Eccentricity -6.999e-02 3171 of 5322 1.000
Nucleus Shape Form Factor -2.868e-01 4734 of 5322 0.867
Cell Tubulin Mean -9.647e-02 4536 of 5322 0.997
Cell Tubulin Mean Frac 3 0.093 785 of 5322 0.999
Cell Actin Mean -1.312e-02 3385 of 5322 1.000
Cell Shape Area 0.017 3687 of 5322 0.999
( Reset Zoom )
Brightness
Contrast
Opacity
Brightness
Contrast
Opacity
Brightness
Contrast
Opacity
Brightness
Contrast
Opacity
Brightness
Contrast
Opacity

( Reset Zoom )
Brightness
Contrast
Opacity
Brightness
Contrast
Opacity
Brightness
Contrast
Opacity
Brightness
Contrast
Opacity
Brightness
Contrast
Opacity

MIT Central Accessability