ABCE1

Gene symbol: ABCE1
Gene: 6059
Uniprot Function: Cotranslational quality control factor involved in the No-Go Decay (NGD) pathway (PubMed:21448132). Together with PELO and HBS1L, is required for 48S complex formation from 80S ribosomes and dissociation of vacant 80S ribosomes (PubMed:21448132). Together with PELO and HBS1L, recognizes stalled ribosomes and promotes dissociation of elongation complexes assembled on non-stop mRNAs; this triggers endonucleolytic cleavage of the mRNA, a mechanism to release non-functional ribosomes and to degrade damaged mRNAs as part of the No-Go Decay (NGD) pathway (PubMed:21448132). Plays a role in the regulation of mRNA turnover (By similarity). Plays a role in quality control of translation of mitochondrial outer membrane-localized mRNA (PubMed:29861391). As part of the PINK1-regulated signaling, ubiquitinated by CNOT4 upon mitochondria damage; this modification generates polyubiquitin signals that recruit autophagy receptors to the mitochondrial outer membrane and initiate mitophagy (PubMed:29861391). RNASEL-specific protein inhibitor which antagonizes the binding of 2-5A (5'-phosphorylated 2',5'-linked oligoadenylates) to RNASEL (PubMed:9660177). Negative regulator of the anti-viral effect of the interferon-regulated 2-5A/RNASEL pathway (PubMed:9660177, PubMed:9847332, PubMed:11585831).
Mitotic Index 0.0232
Interphase Cluster: #97 (24 genes)
Mitotic Cluster: #191 (13 genes)
sgRNA 1: AGTTGTCCTGTAGTTCGAAT (interphase cells: 1204, mitotic cells: 32)
sgRNA 2: CCAAAACTTCACCTGGACGA (interphase cells: 1804, mitotic cells: 45)
sgRNA 3: TATGGTGTACCAAGCGCCTA (interphase cells: 1082, mitotic cells: 28)
sgRNA 4: TTTCAGATATATCATTGTGG (interphase cells: 2444, mitotic cells: 50)

Interphase Cluster

Mitotic Cluster

Overview

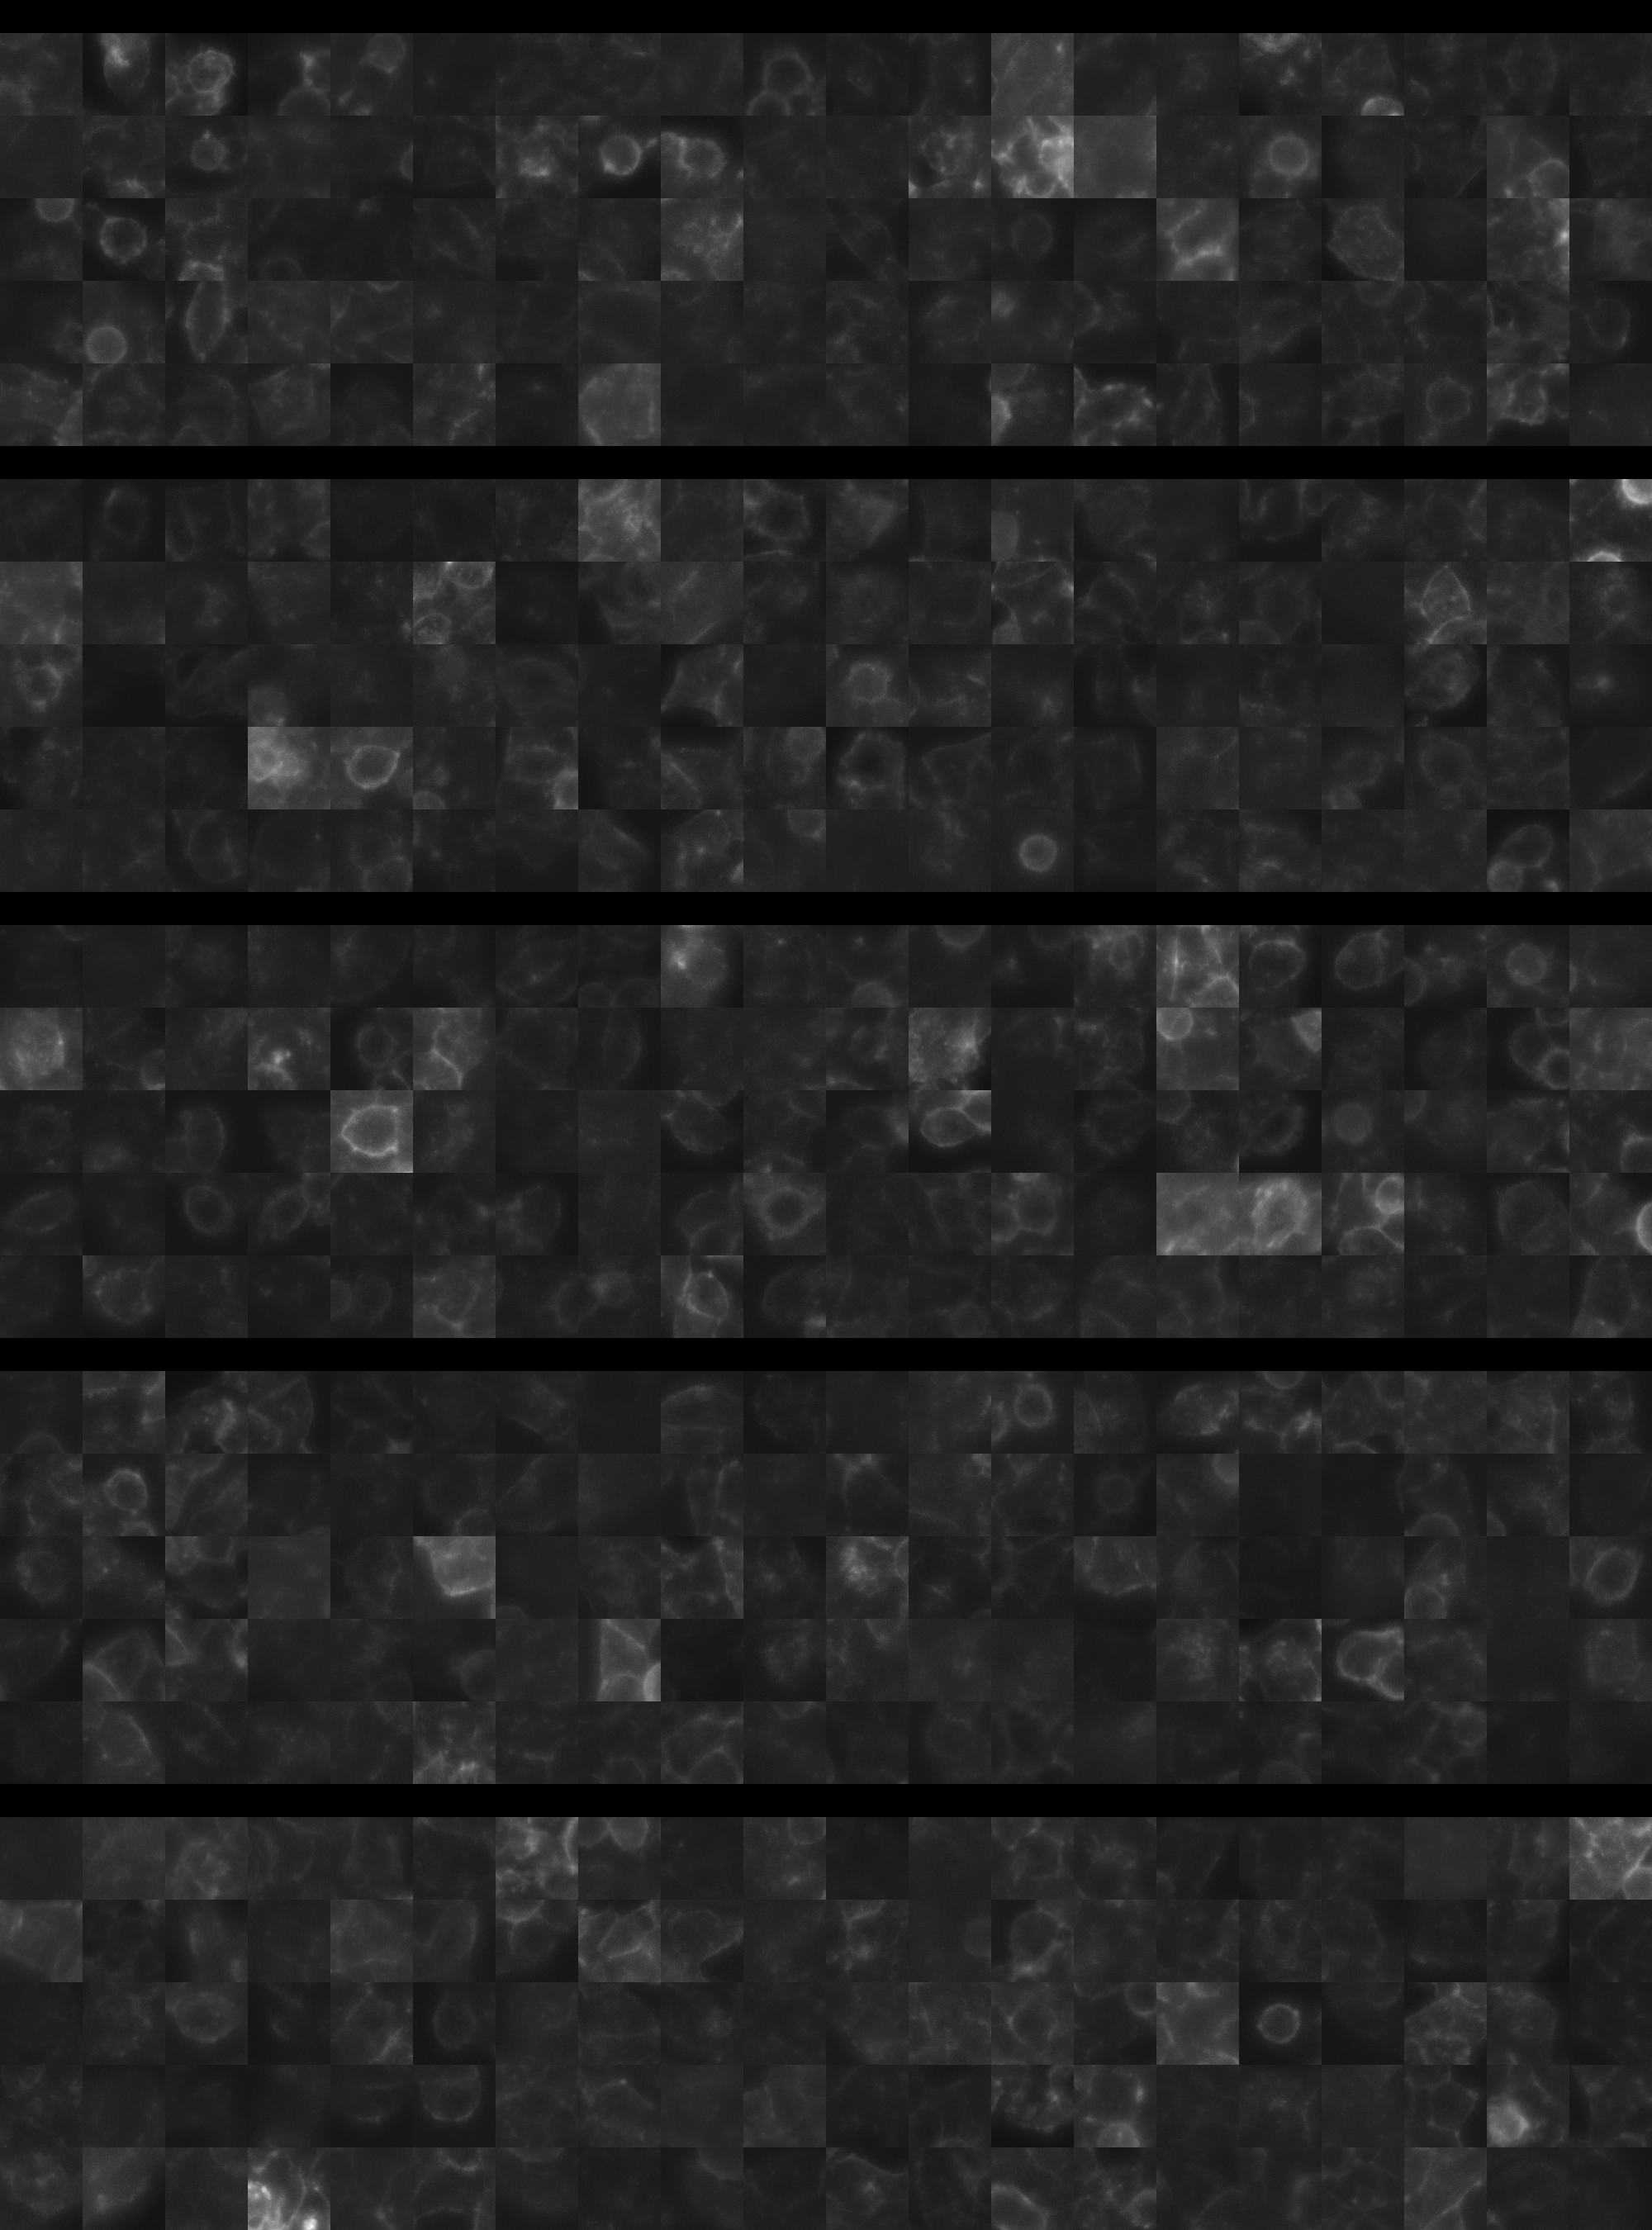
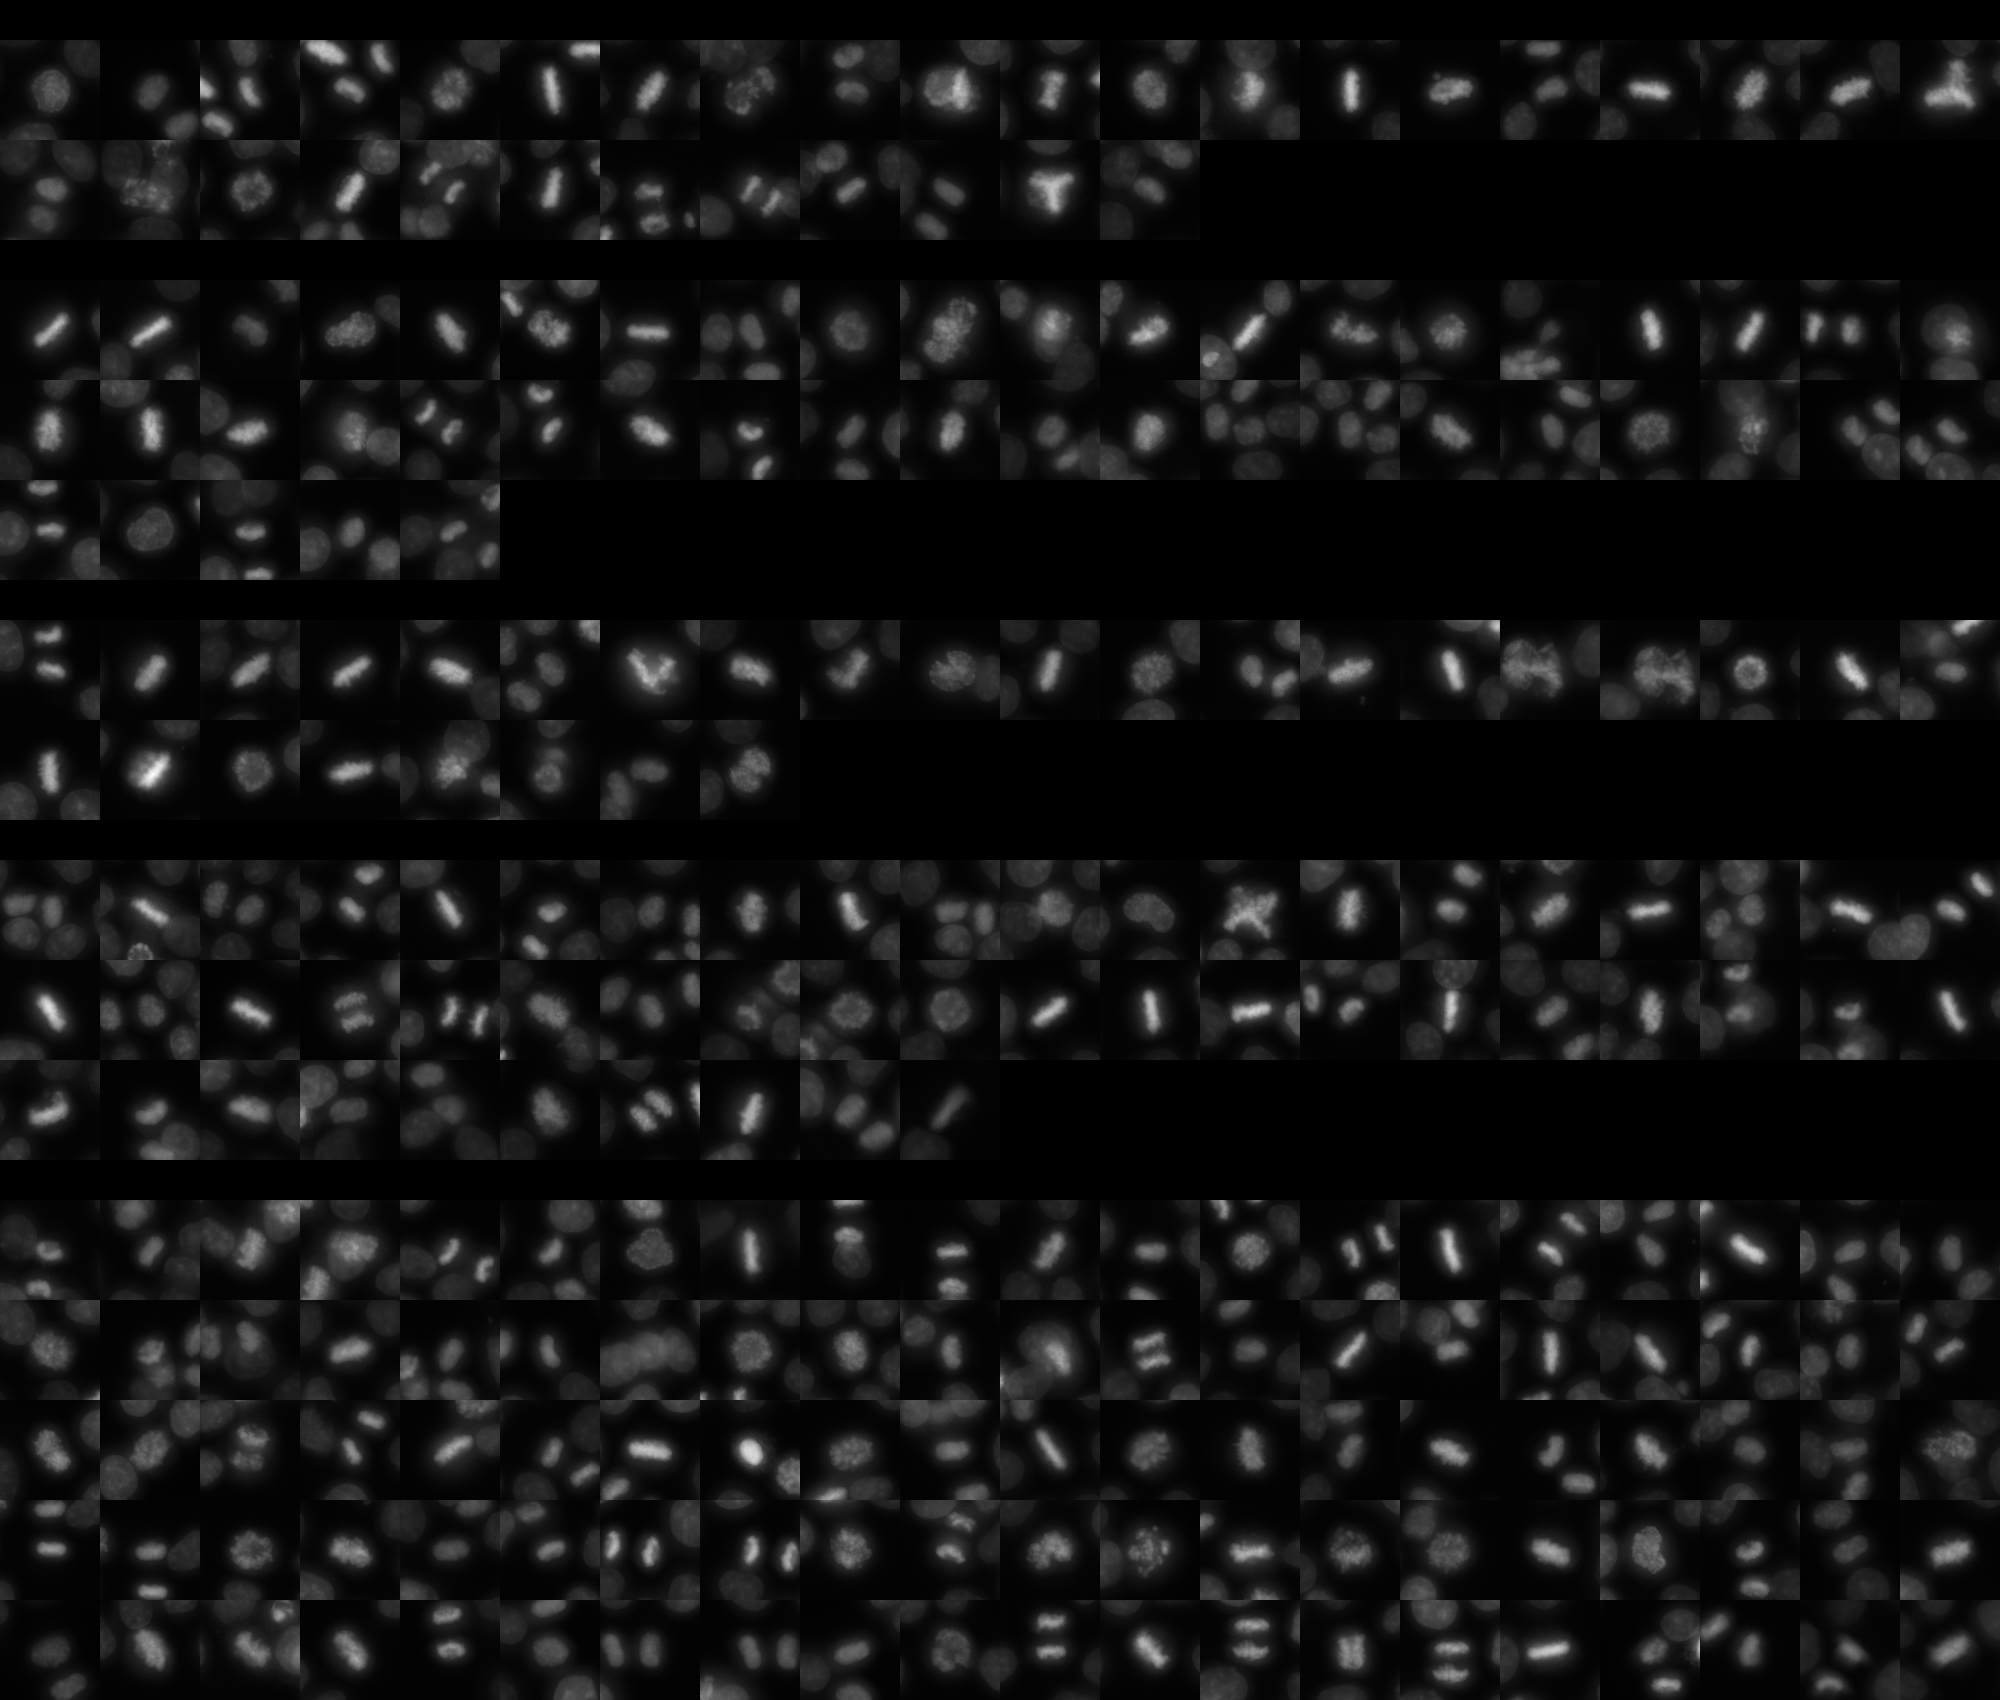
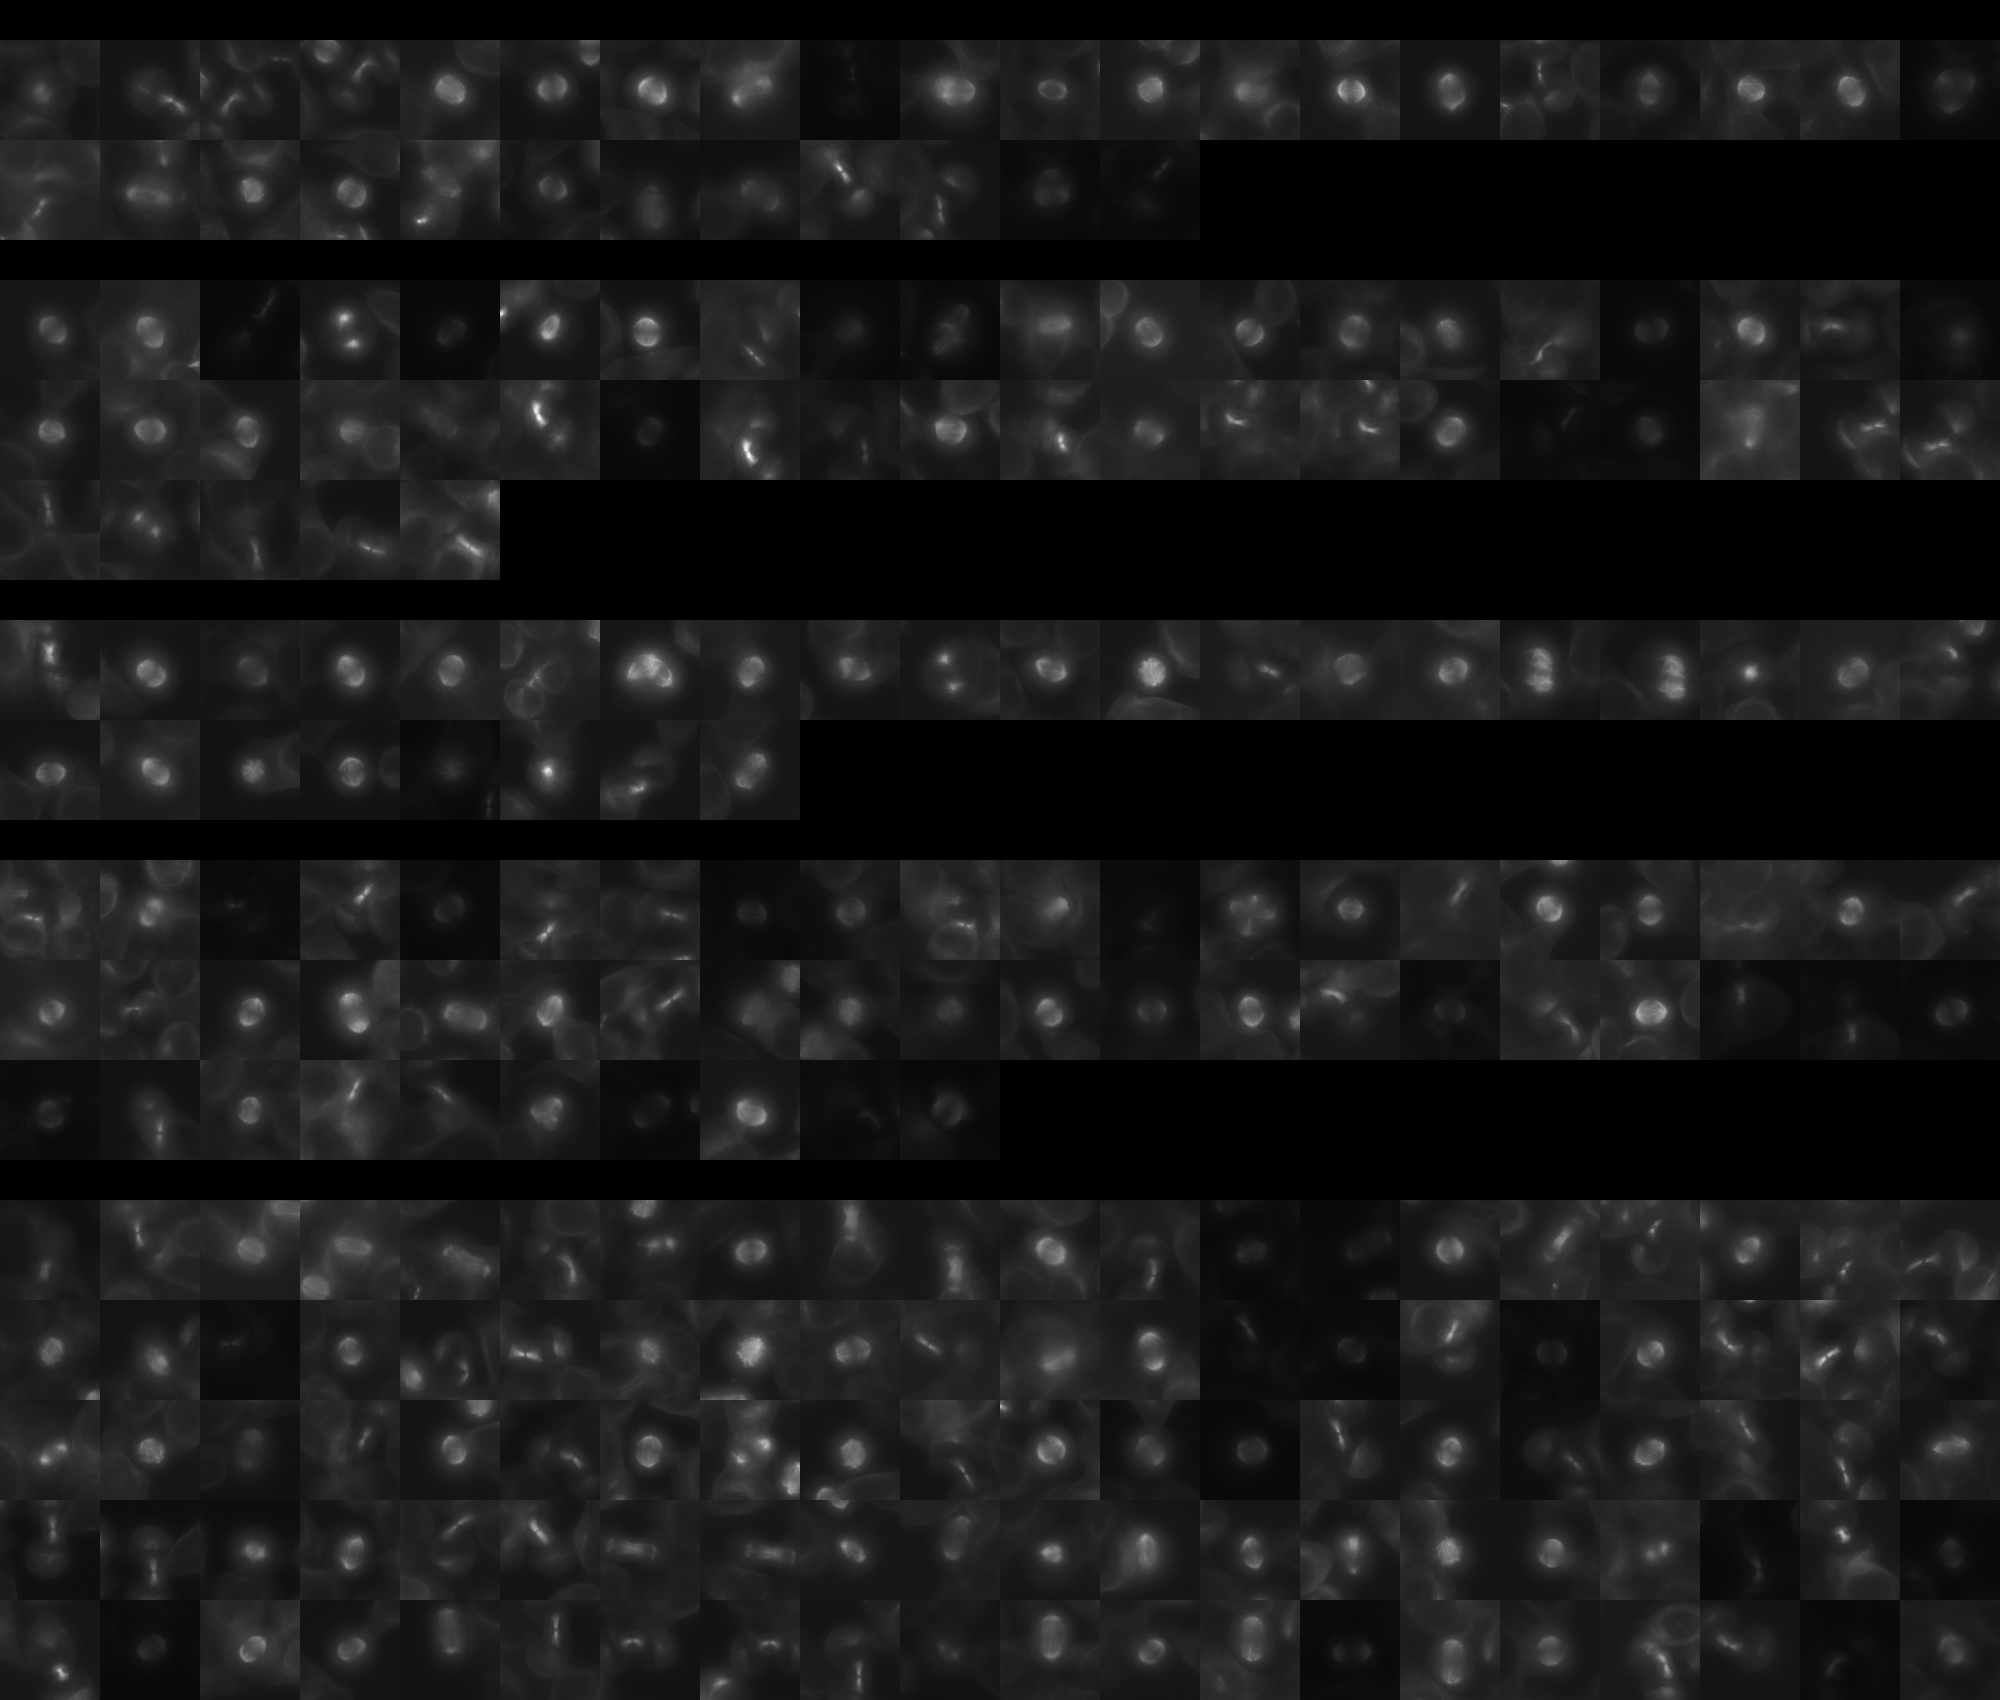
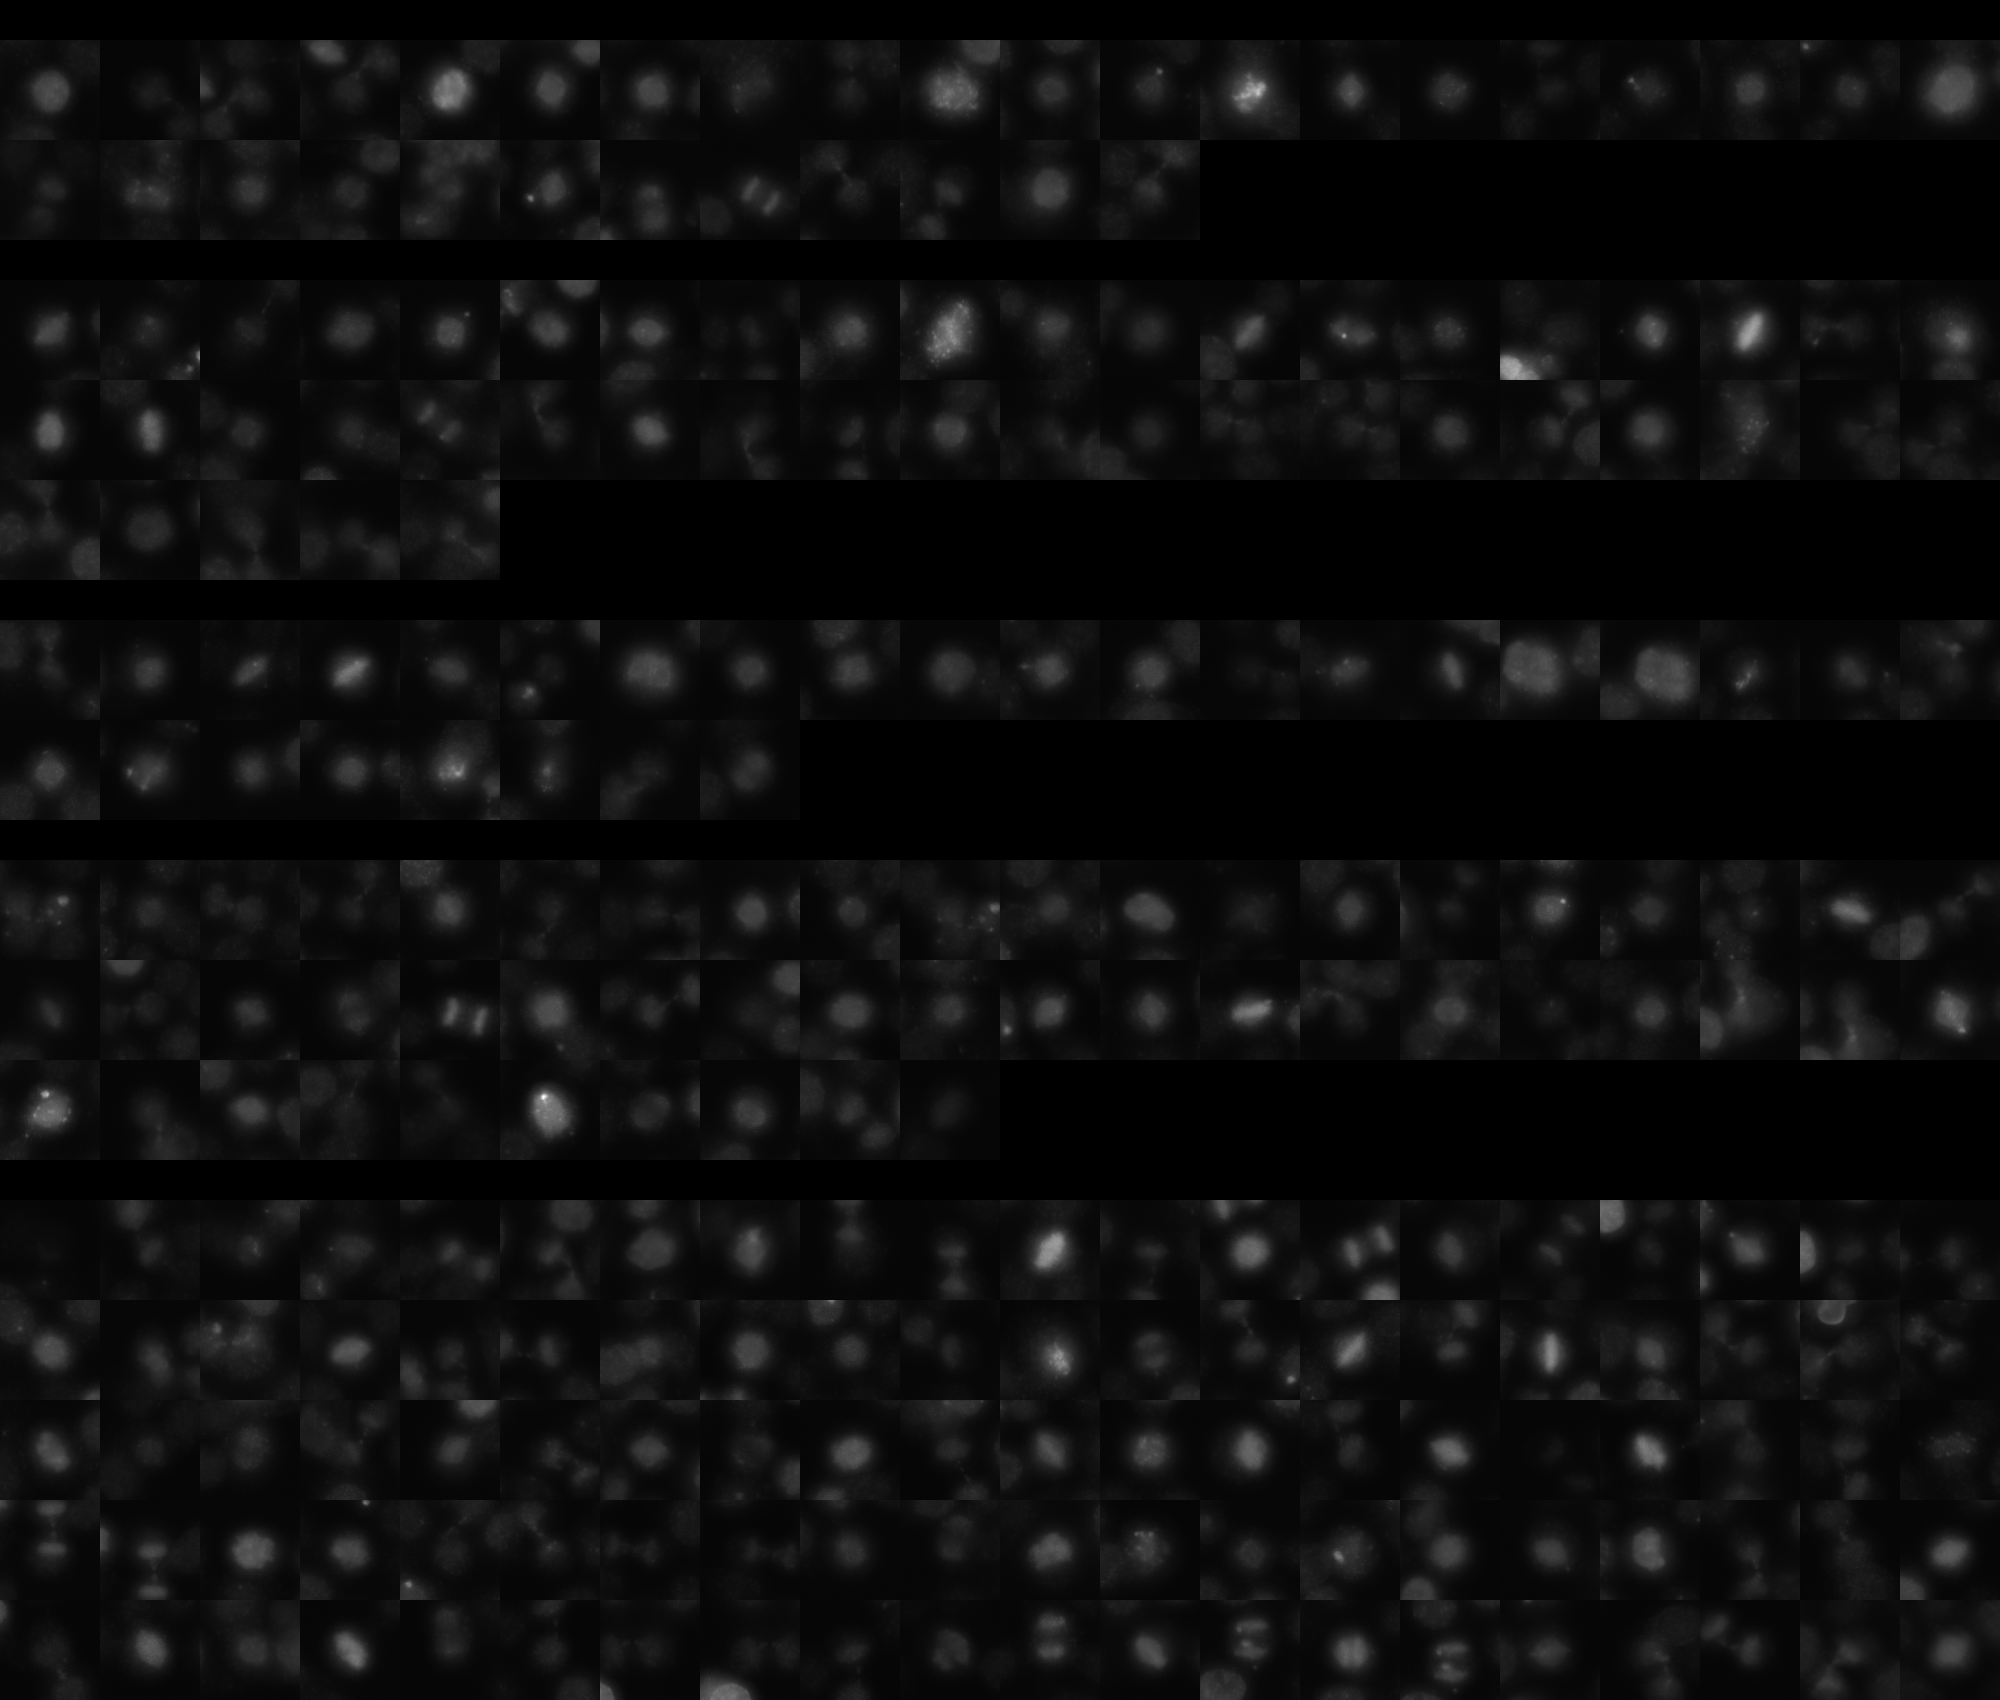
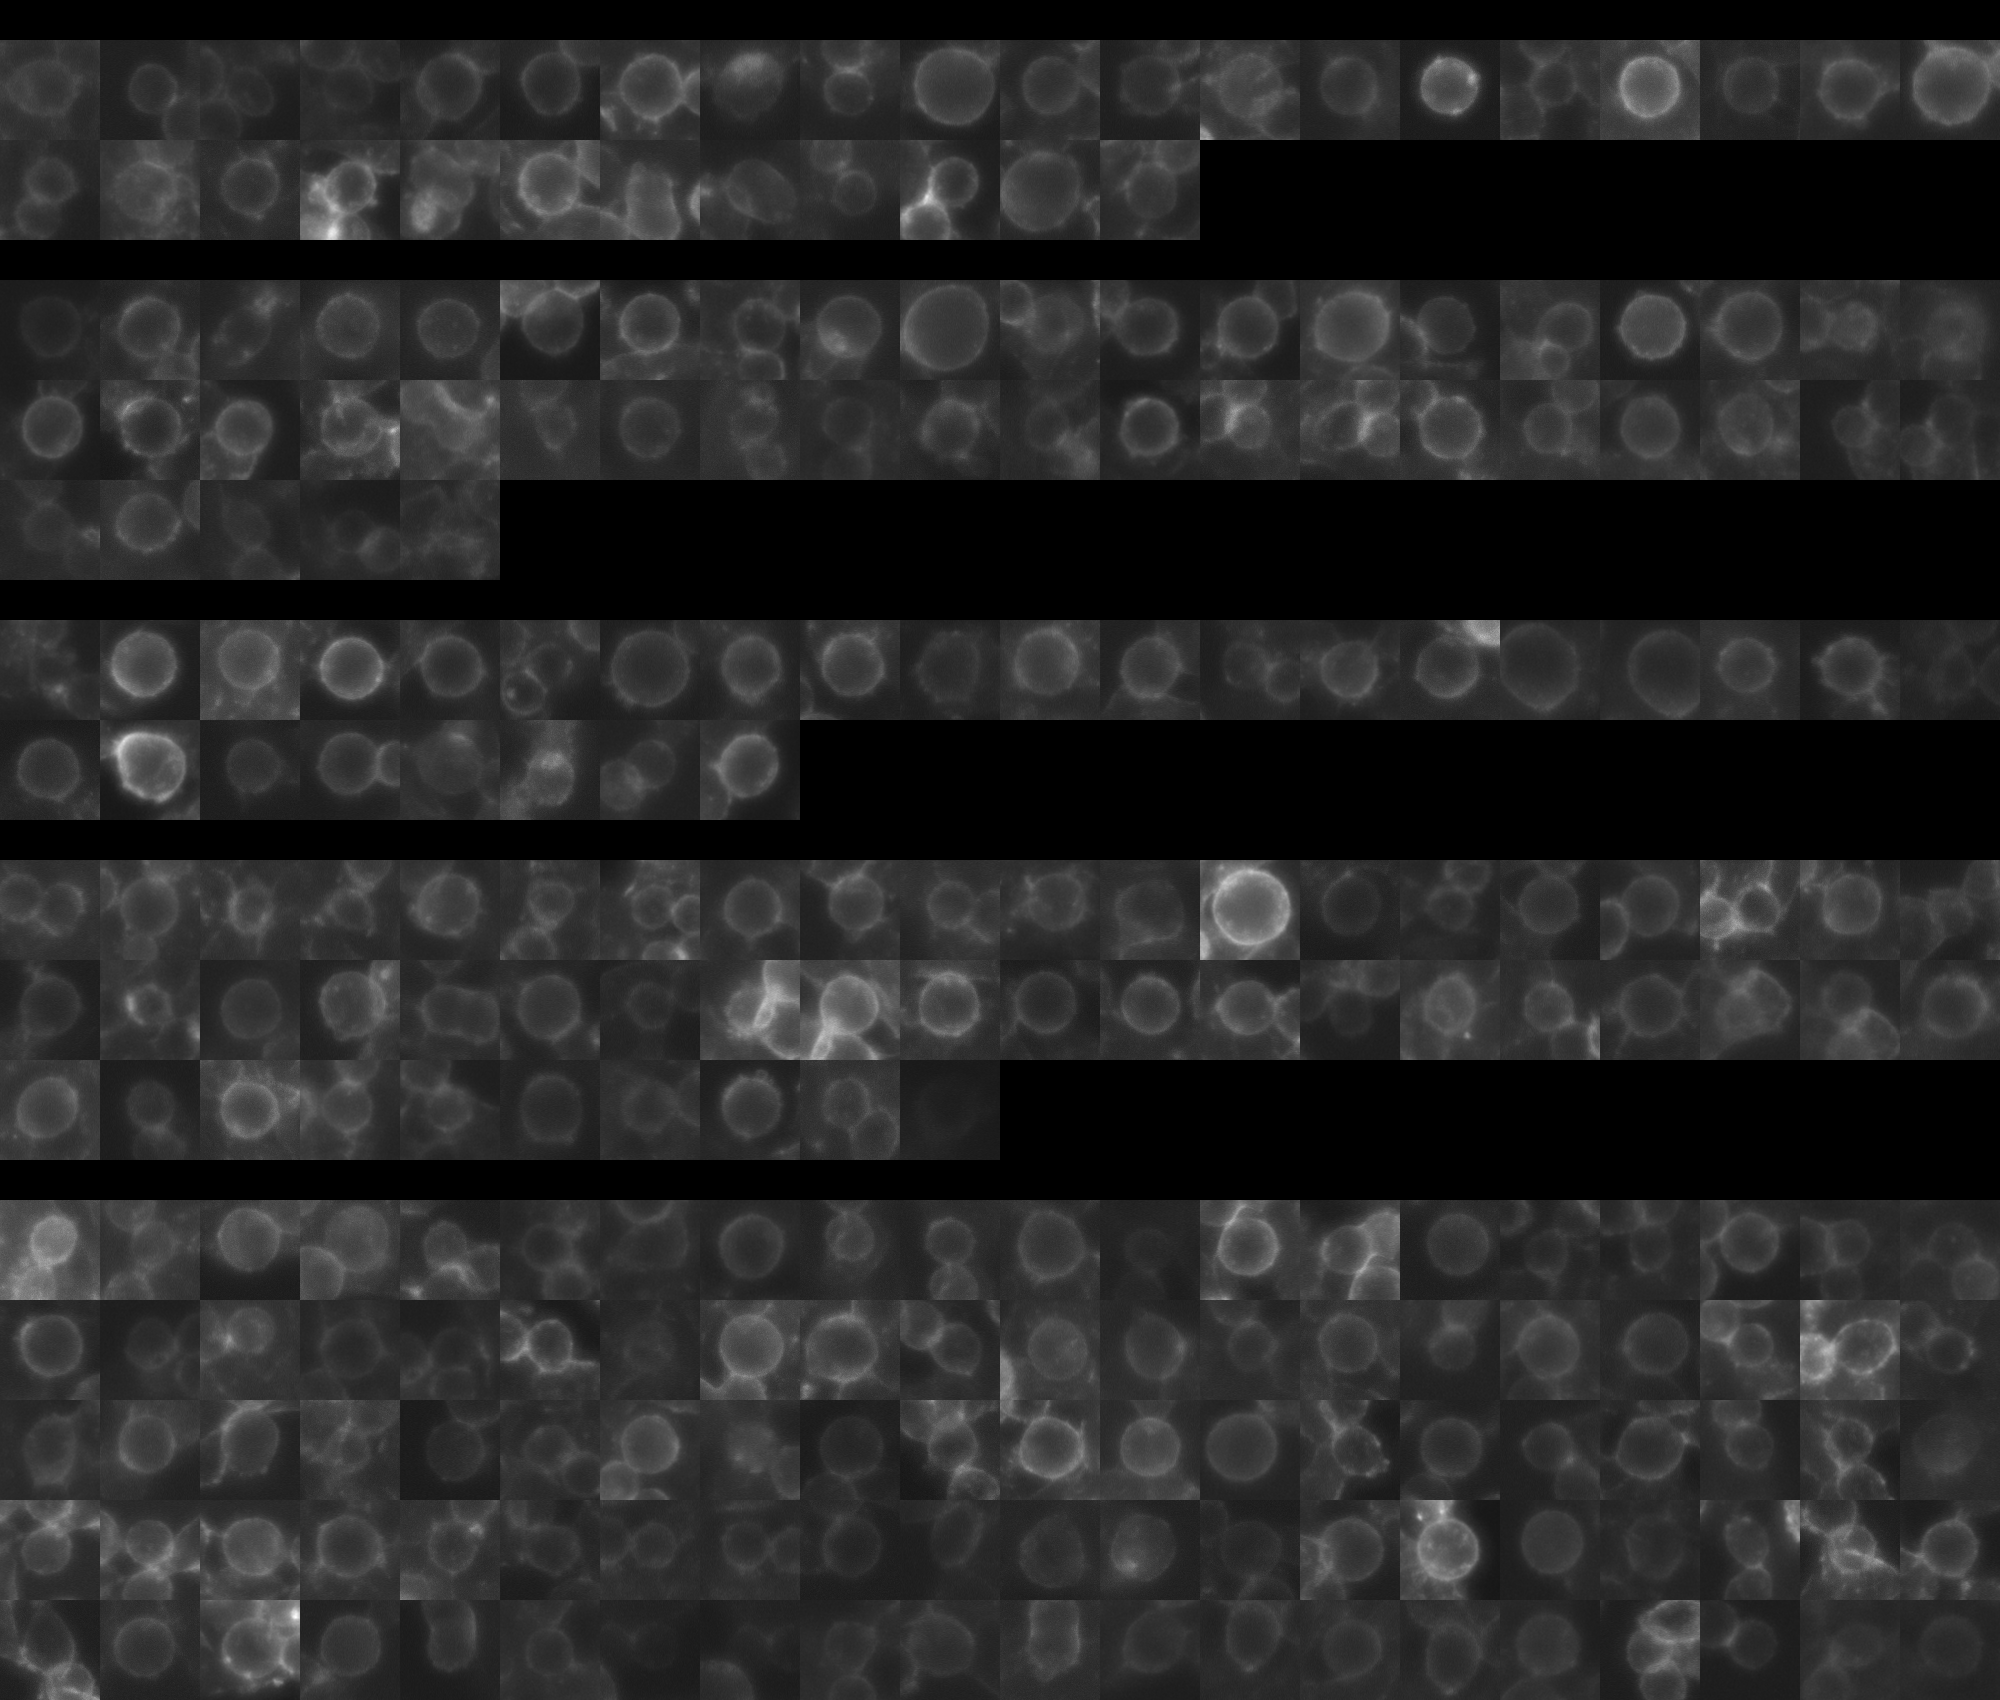
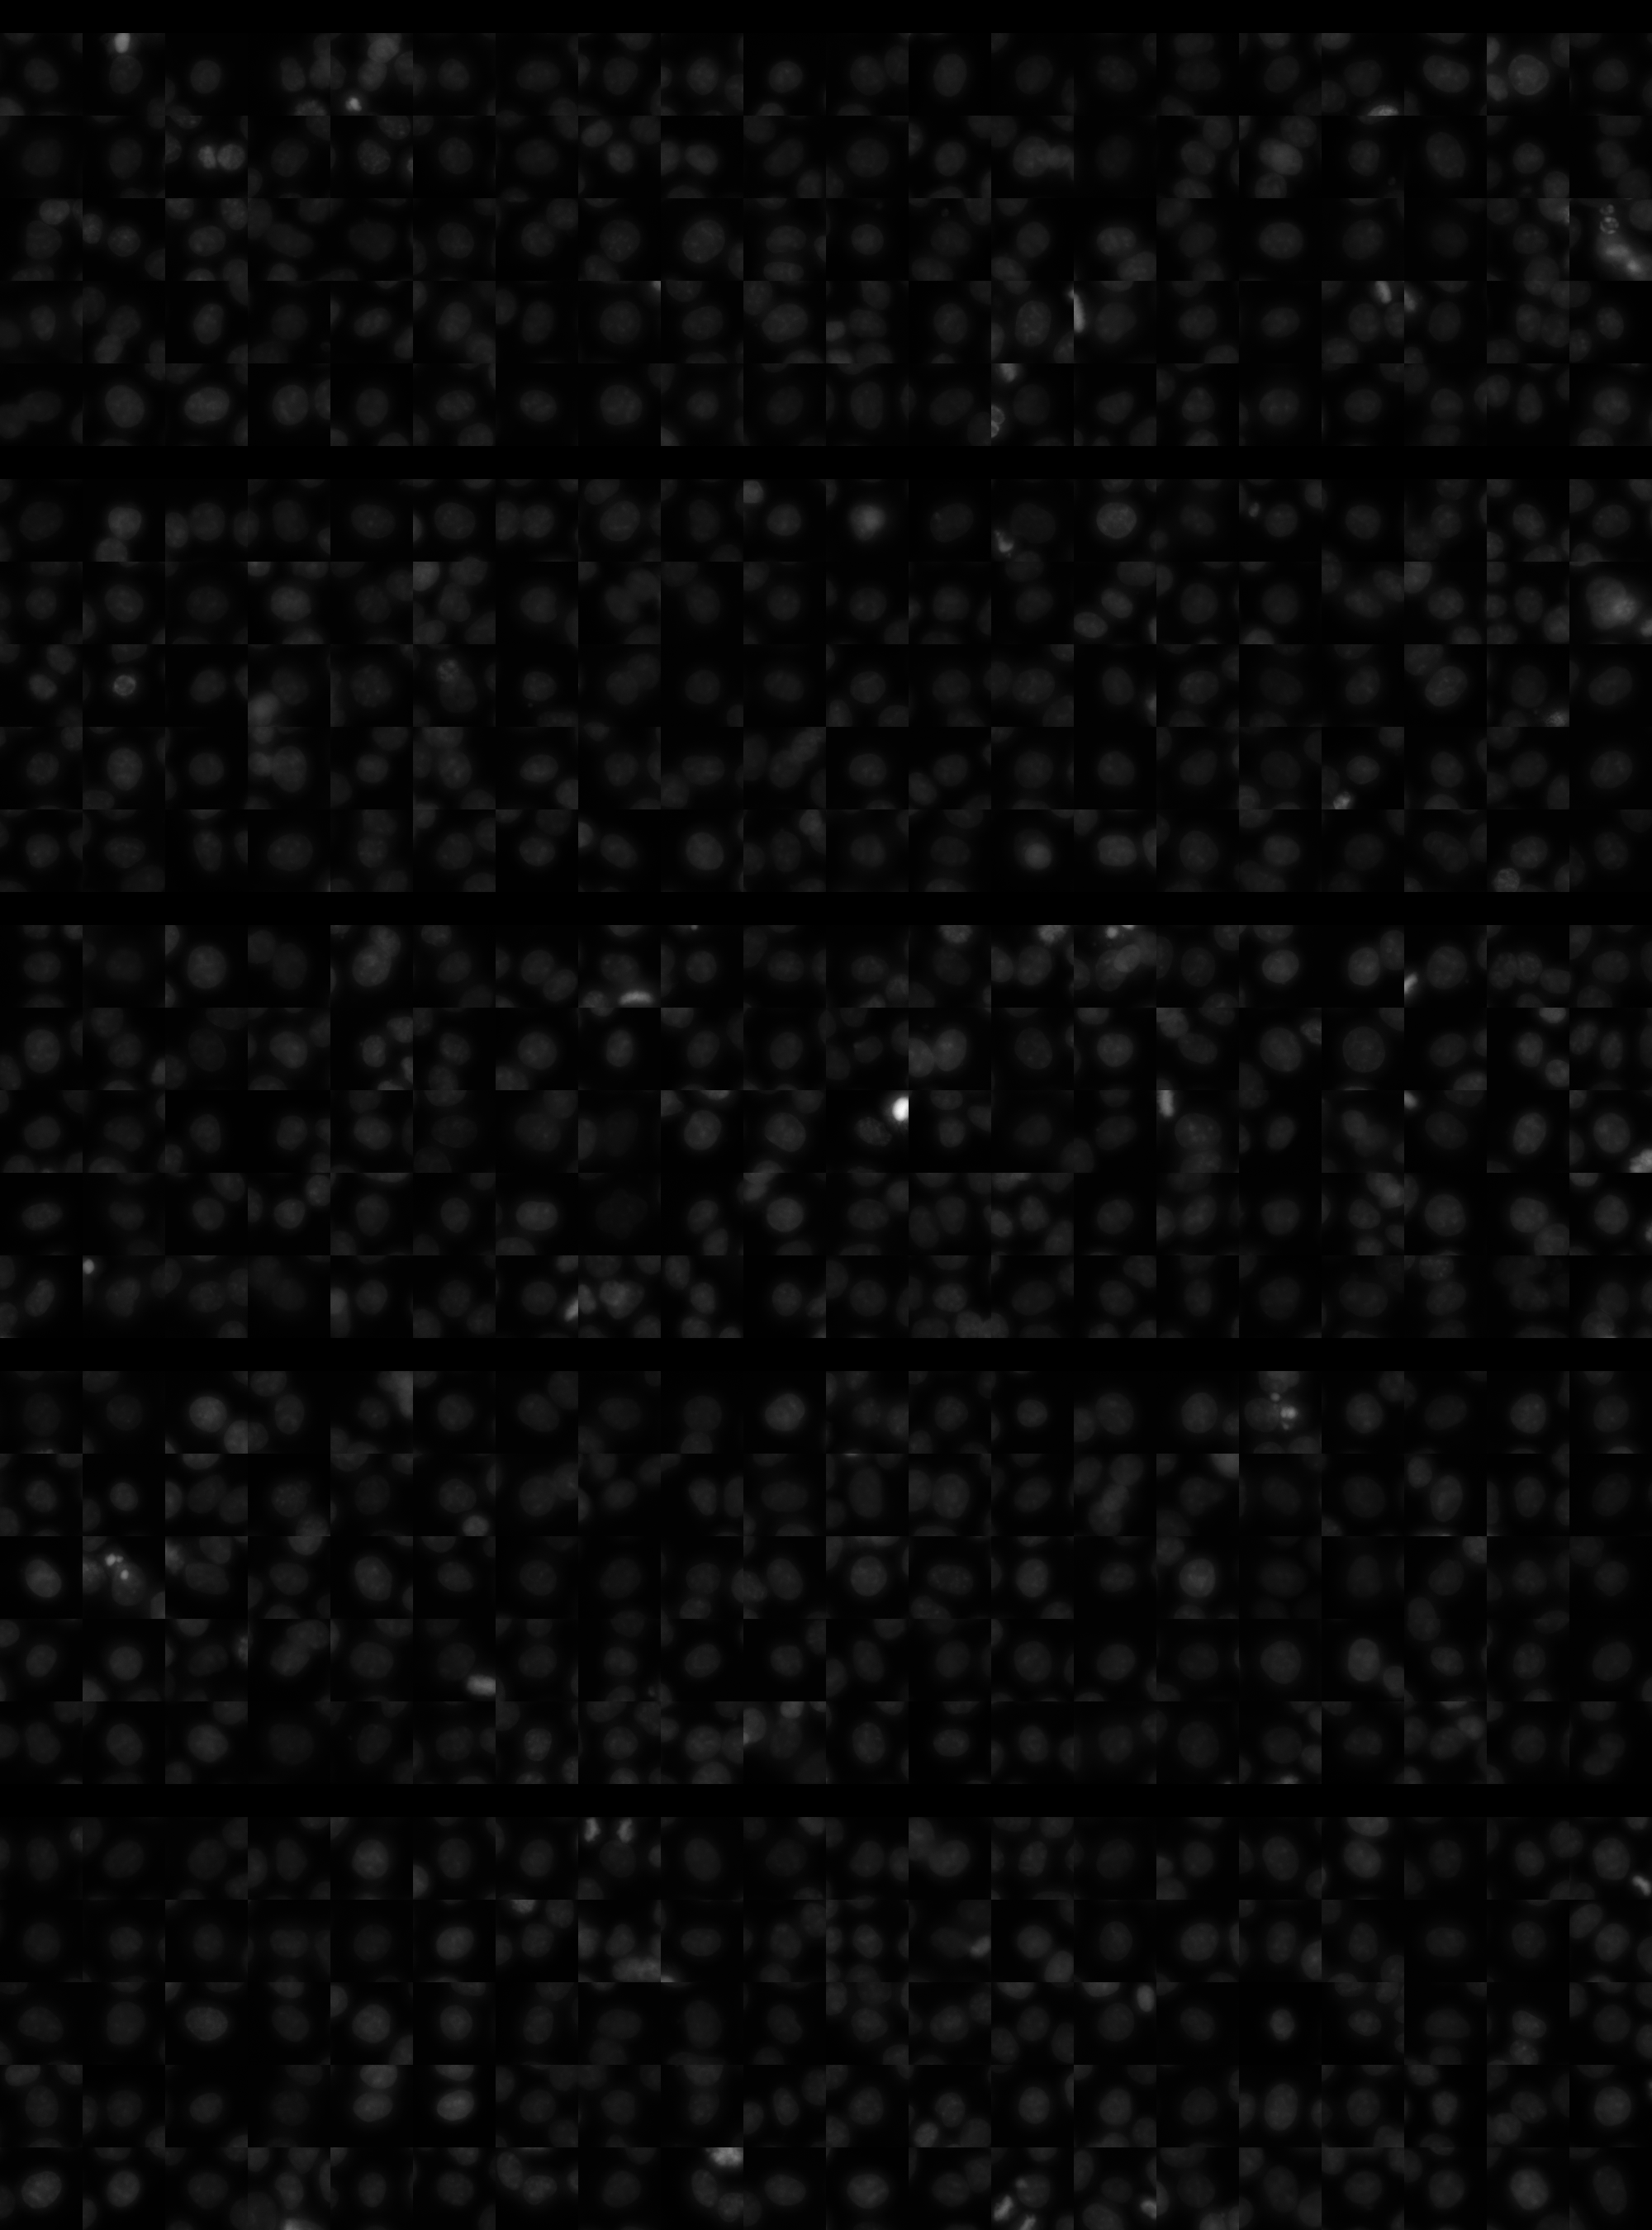
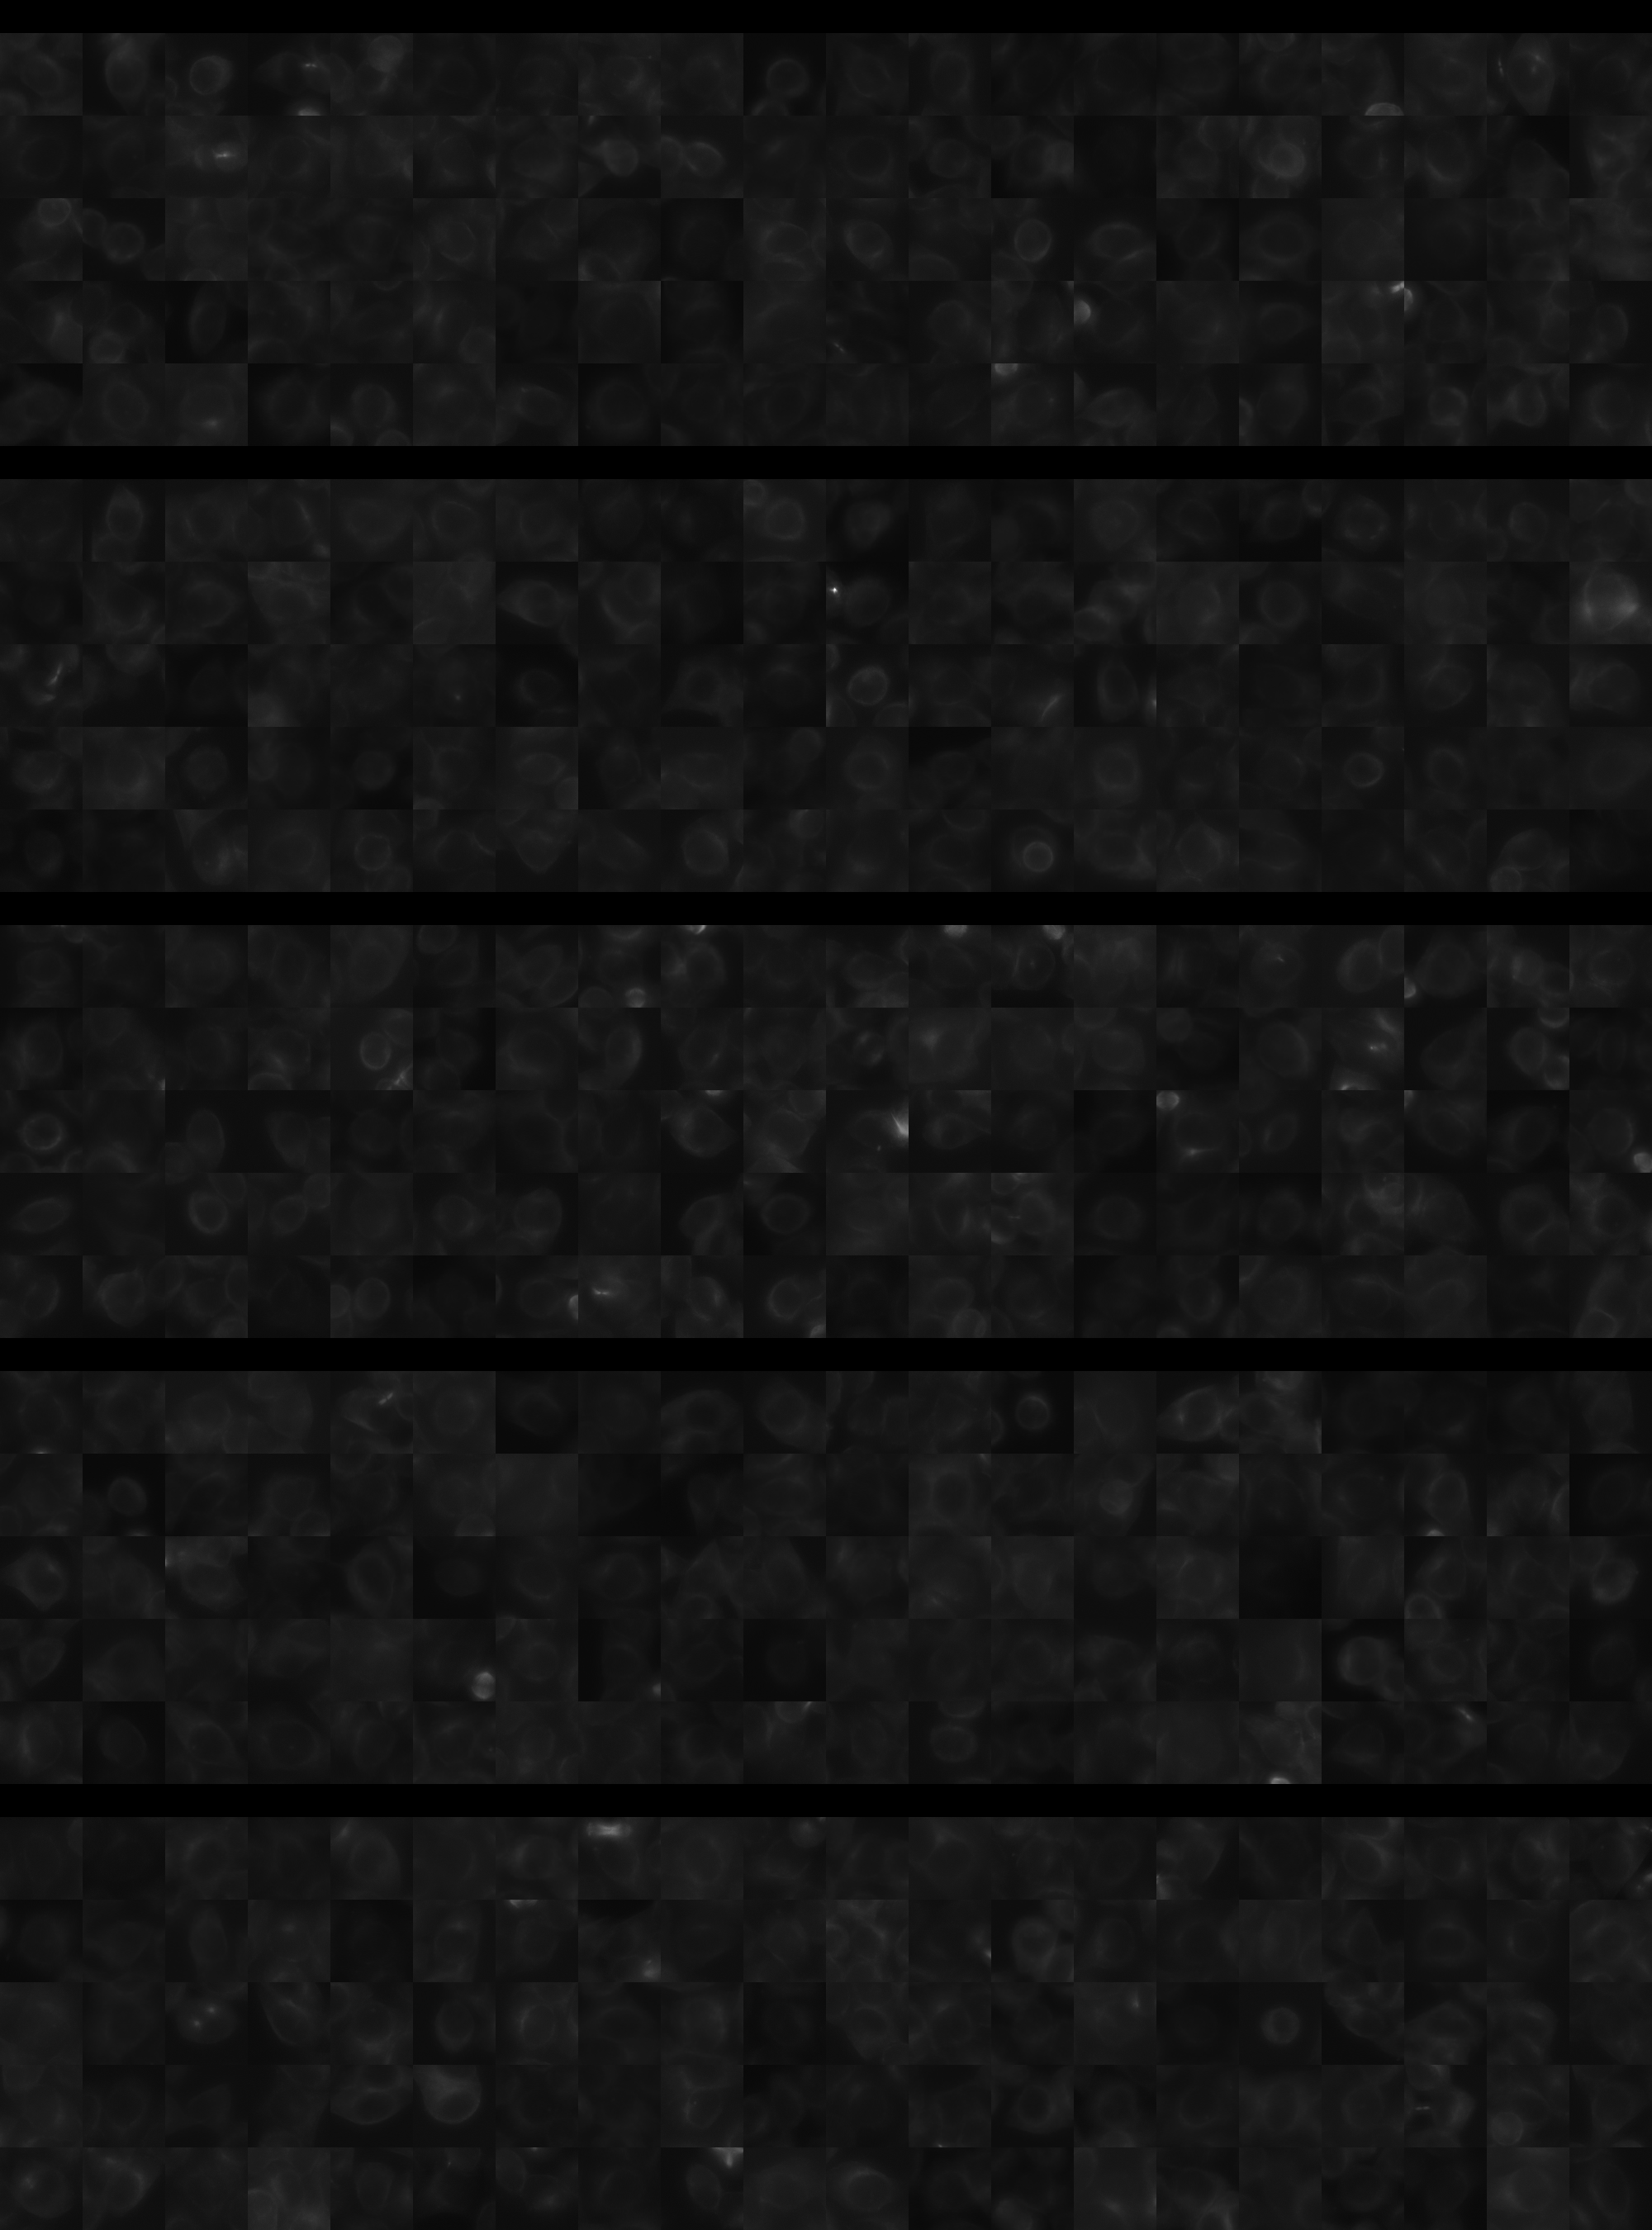
Each montage below shows randomly selected individual cell images for the same target gene separated by sgRNA, along with an example montage of cells expressing a non-targeting negative control sgRNA at the bottom. sgRNA labels in the montages correspond to the numbered sgRNA sequences in the gene info table above. The DNA (blue) and tubulin (green) channels are displayed by default, with gH2AX (grayscale) and actin (yellow) available using the check boxes. Channel brightness, contrast, and opacity are adjustable by clicking the arrow next to the channel name. When only one channel is selected, the display defaults to grayscale. Click the “Zoom” checkbox above the channel controls to enable image zooming (via scrolling) and panning (via click-and-drag).

The cell boxes displayed for this gene are square, 30.36 μm per side for the interphase montage and 30.36 μm per side for the mitotic montage.
Features

Interphase Score Rank FDR q-value
Nucleus DNA Integrated 0.079 531 of 5322 0.138
Nucleus DNA Mean -3.702e-02 3213 of 5322 0.422
Nucleus gH2AX Mean 0.073 2739 of 5322 0.056
Nucleus DNA - gH2AX Correlation -1.759e-01 4982 of 5322 1.021e-04
Nucleus Shape Area 0.047 1760 of 5322 0.447
Nucleus Shape Eccentricity -3.930e-02 4678 of 5322 0.356
Nucleus Shape Form Factor -9.121e-02 4197 of 5322 0.017
Nucleus Shape Solidity -9.084e-02 4110 of 5322 0.007
Cell DNA Mass Displacement 0.070 556 of 5322 0.123
Cell Tubulin Mean -2.831e-02 3788 of 5322 0.607
Cell Tubulin Mass Displacement 0.134 118 of 5322 3.984e-04
Cell Actin Mean -8.893e-02 4838 of 5322 0.042
Cell Tubulin - Actin Correlation 0.251 101 of 5322 2.896e-04
Cell DNA - Tubulin Correlation 0.329 129 of 5322 1.948e-04
Cell Shape Area -8.012e-02 4686 of 5322 0.042
Cell Shape Eccentricity 0.013 2648 of 5322 0.893
Mitotic Score Rank FDR q-value
Nucleus DNA Integrated 0.188 1386 of 5322 0.875
Nucleus DNA Mean 0.078 1753 of 5322 1.000
Nucleus DNA Mass Displacement 0.014 3304 of 5322 0.999
Nucleus DNA Mean Frac 3 0.165 866 of 5322 1.000
Nucleus gH2AX Mean -4.189e-02 3537 of 5322 1.000
Nucleus gH2AX Mean Frac 0 -3.371e-01 5241 of 5322 1.000
Nucleus Tubulin Mean Frac 0 0.017 3230 of 5322 0.999
Nucleus Tubulin Mean Edge 0.151 1247 of 5322 0.999
Nucleus Tubulin Std Edge 0.040 1994 of 5322 0.999
Nucleus Shape Area 0.119 2392 of 5322 0.989
Nucleus Shape Eccentricity 0.207 210 of 5322 1.000
Nucleus Shape Form Factor -1.835e-01 3973 of 5322 0.998
Cell Tubulin Mean -1.390e-02 3686 of 5322 0.998
Cell Tubulin Mean Frac 3 -8.911e-02 2785 of 5322 0.999
Cell Actin Mean 0.069 2295 of 5322 0.997
Cell Shape Area 0.164 1799 of 5322 0.998
( Reset Zoom )
Brightness
Contrast
Opacity
Brightness
Contrast
Opacity
Brightness
Contrast
Opacity
Brightness
Contrast
Opacity
Brightness
Contrast
Opacity

( Reset Zoom )
Brightness
Contrast
Opacity
Brightness
Contrast
Opacity
Brightness
Contrast
Opacity
Brightness
Contrast
Opacity
Brightness
Contrast
Opacity

MIT Central Accessability