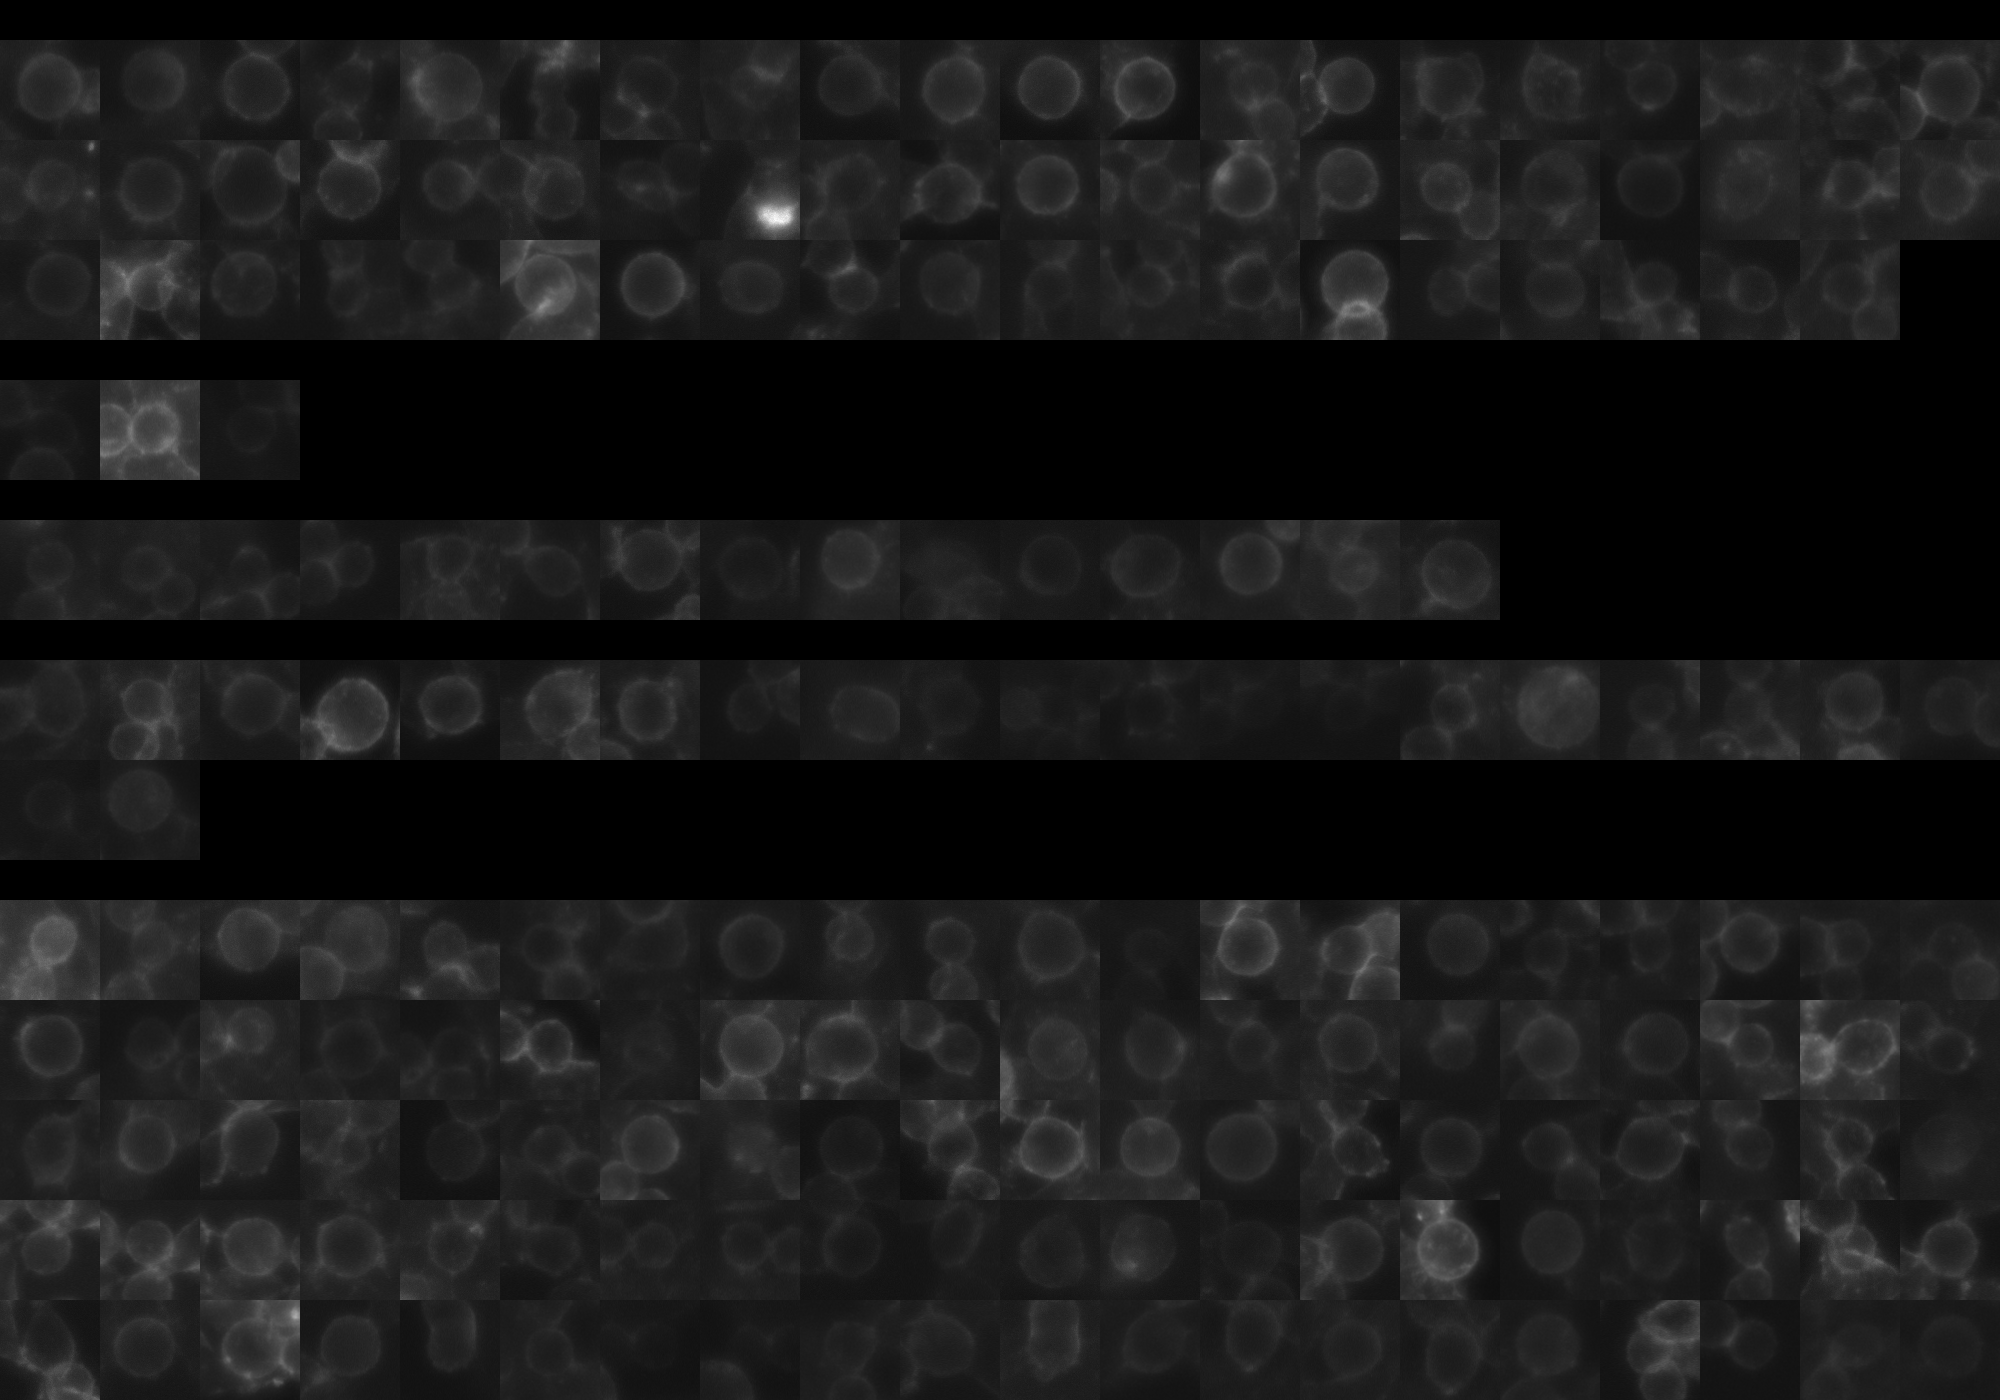
AASDHPPT

Gene symbol: AASDHPPT
Gene: 60496
Uniprot Function: Catalyzes the post-translational modification of target proteins by phosphopantetheine. Can transfer the 4'-phosphopantetheine moiety from coenzyme A, regardless of whether the CoA is presented in the free thiol form or as an acetyl thioester, to a serine residue of a broad range of acceptors including the acyl carrier domain of FASN.
Mitotic Index 0.0195
Interphase Cluster: #137 (21 genes)
Mitotic Cluster: #4 (52 genes)
sgRNA 1: AGGAAAACCAGTTCTTGCAA (interphase cells: 2842, mitotic cells: 59)
sgRNA 2: AGTGCGATCGATTCAGCCCG (interphase cells: 245, mitotic cells: 3)
sgRNA 3: CCCGAGGAGAAGGAGCGCAT (interphase cells: 812, mitotic cells: 15)
sgRNA 4: TGGCCAGTTCGTCTTTGCCC (interphase cells: 1087, mitotic cells: 22)

Interphase Cluster

Mitotic Cluster

Overview

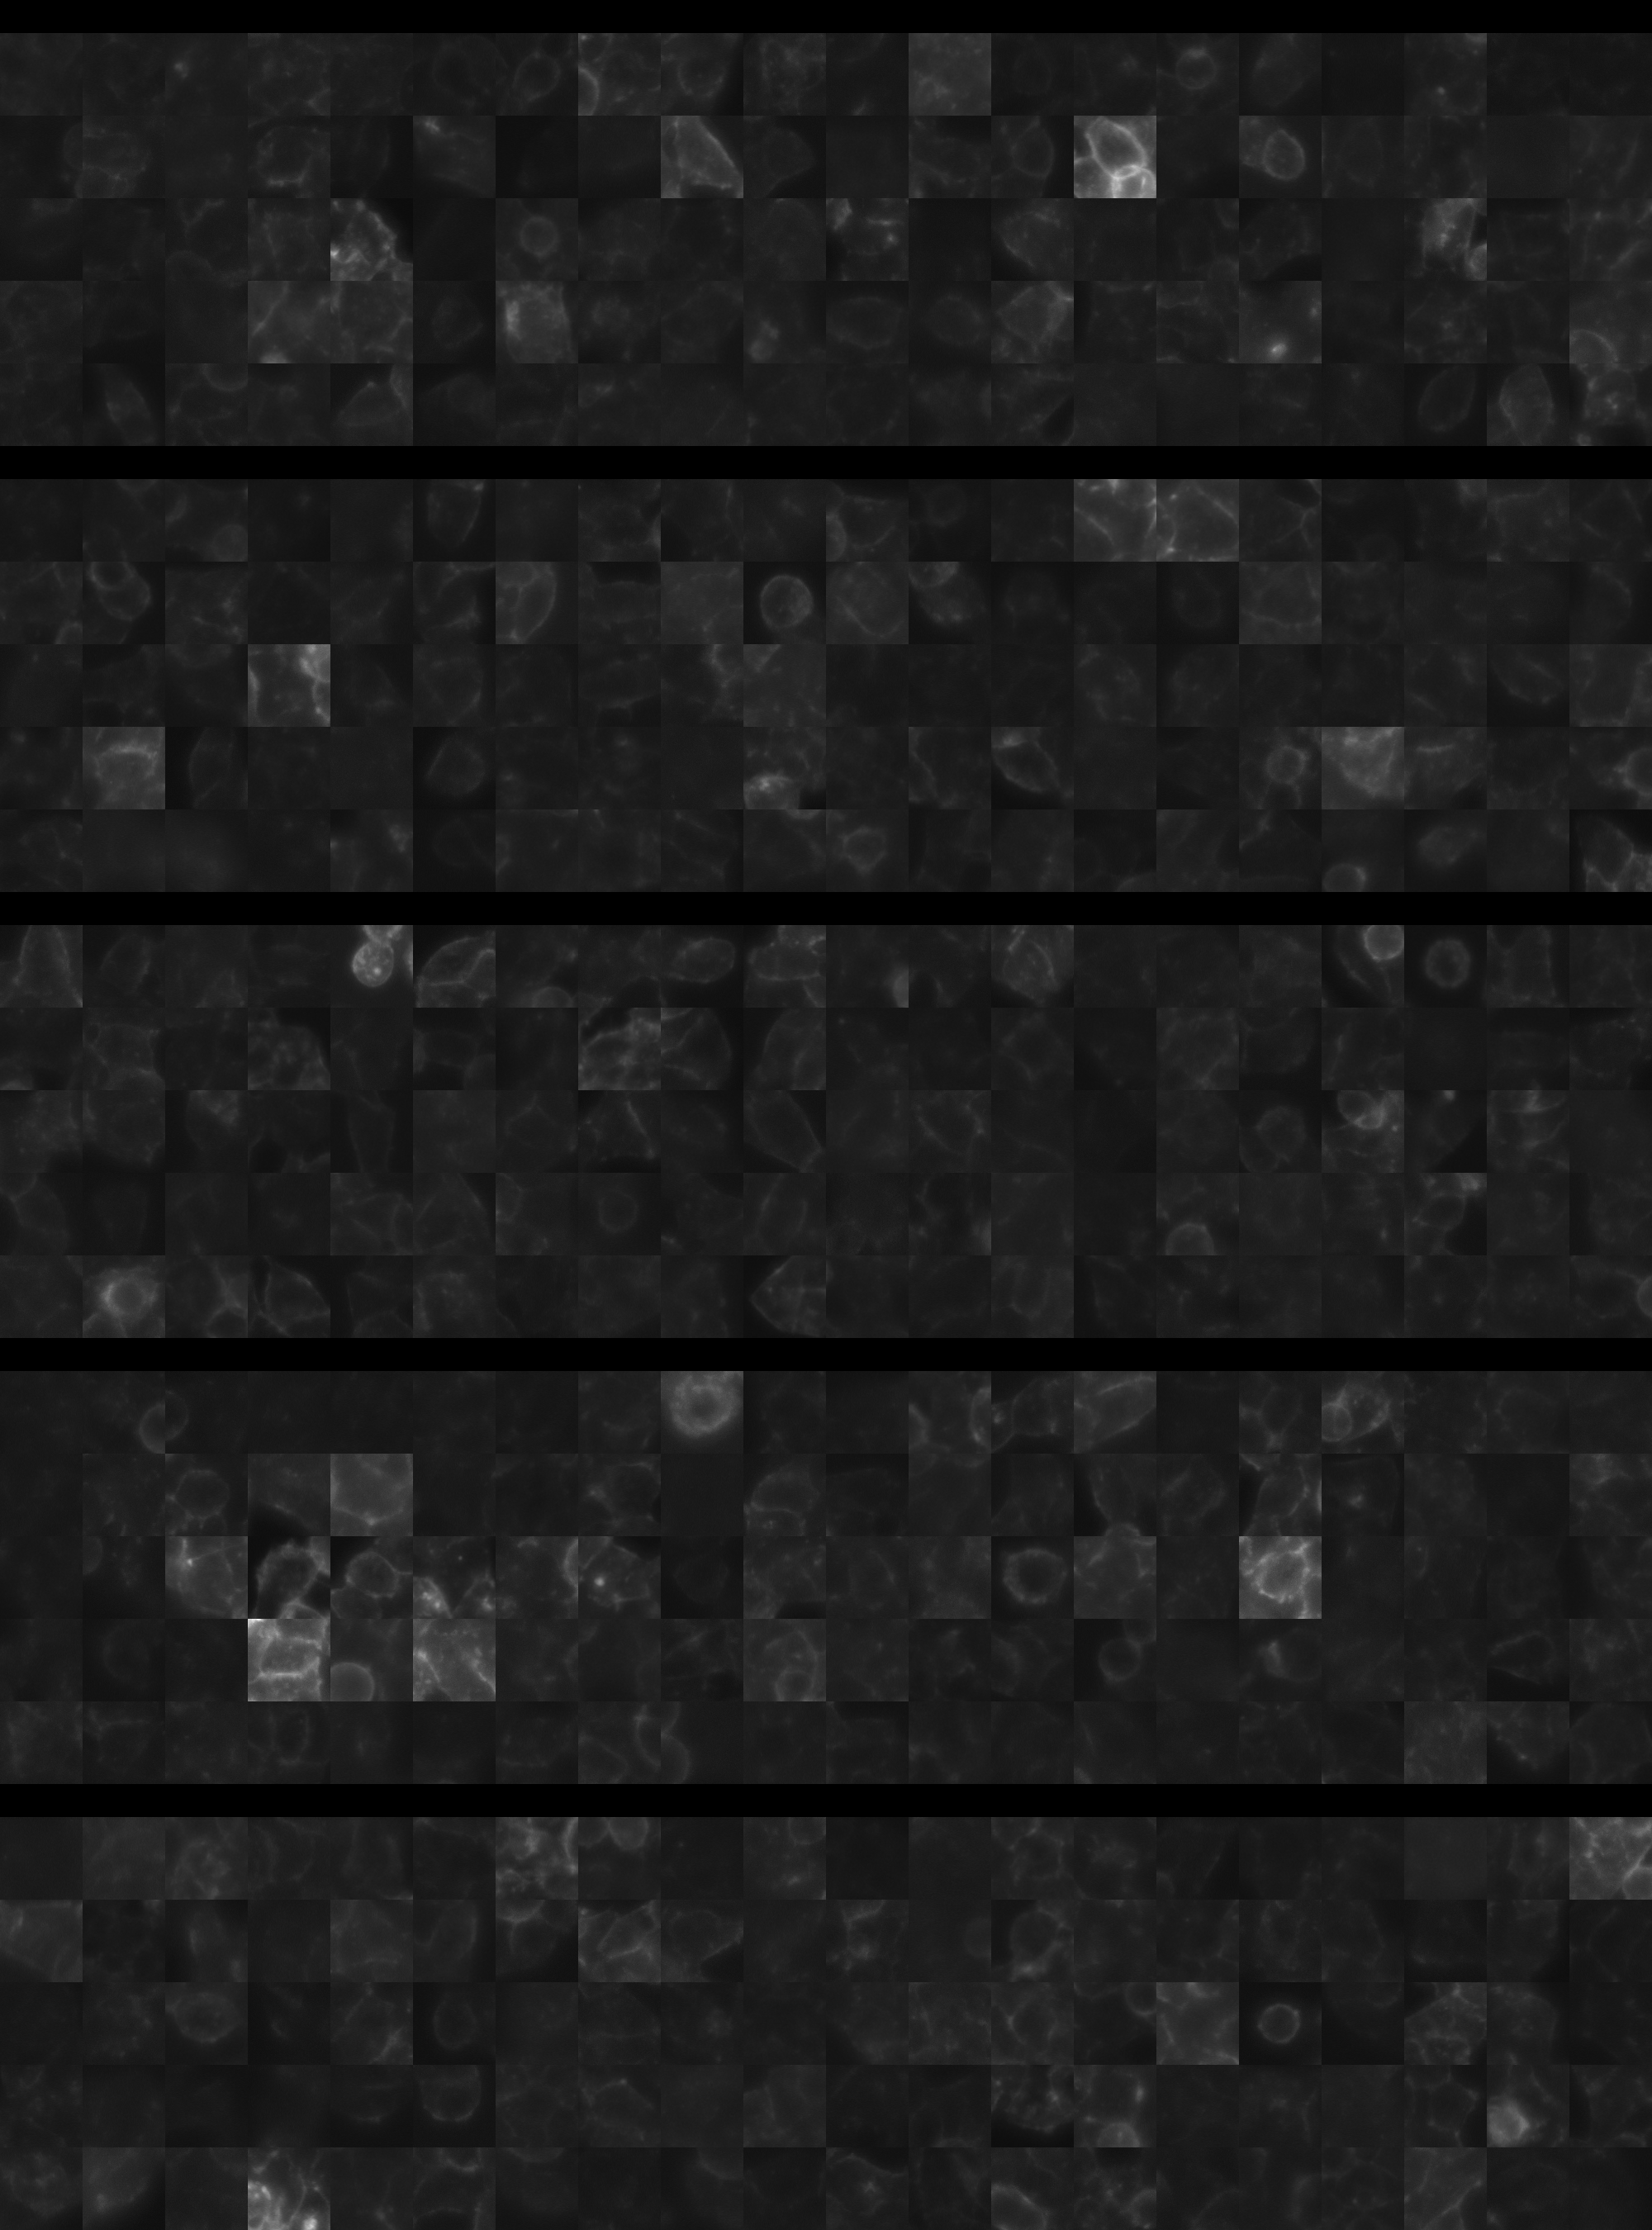
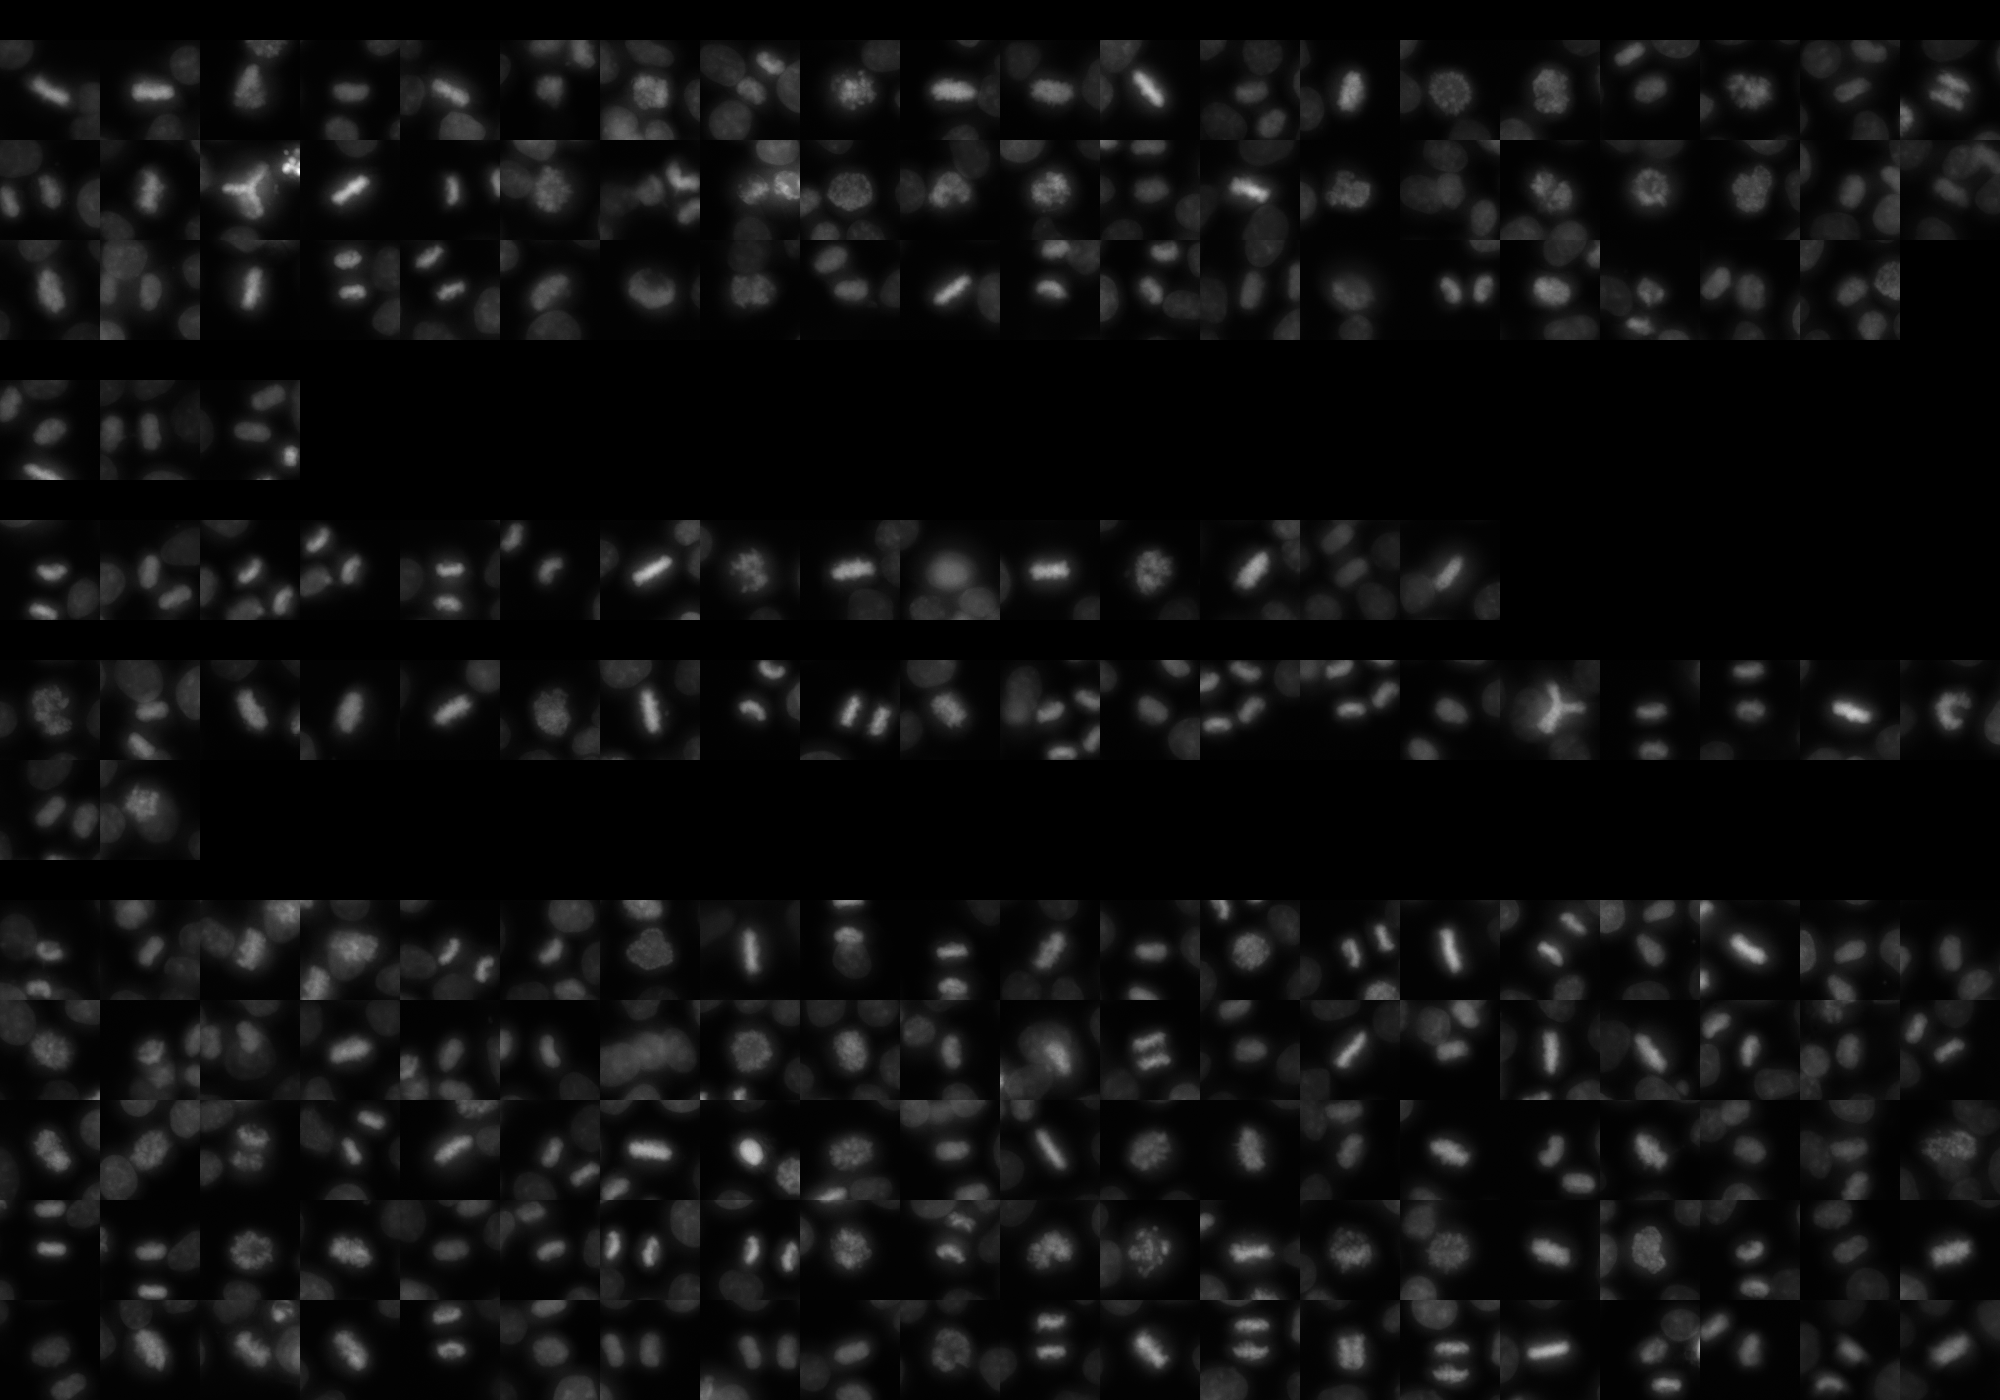
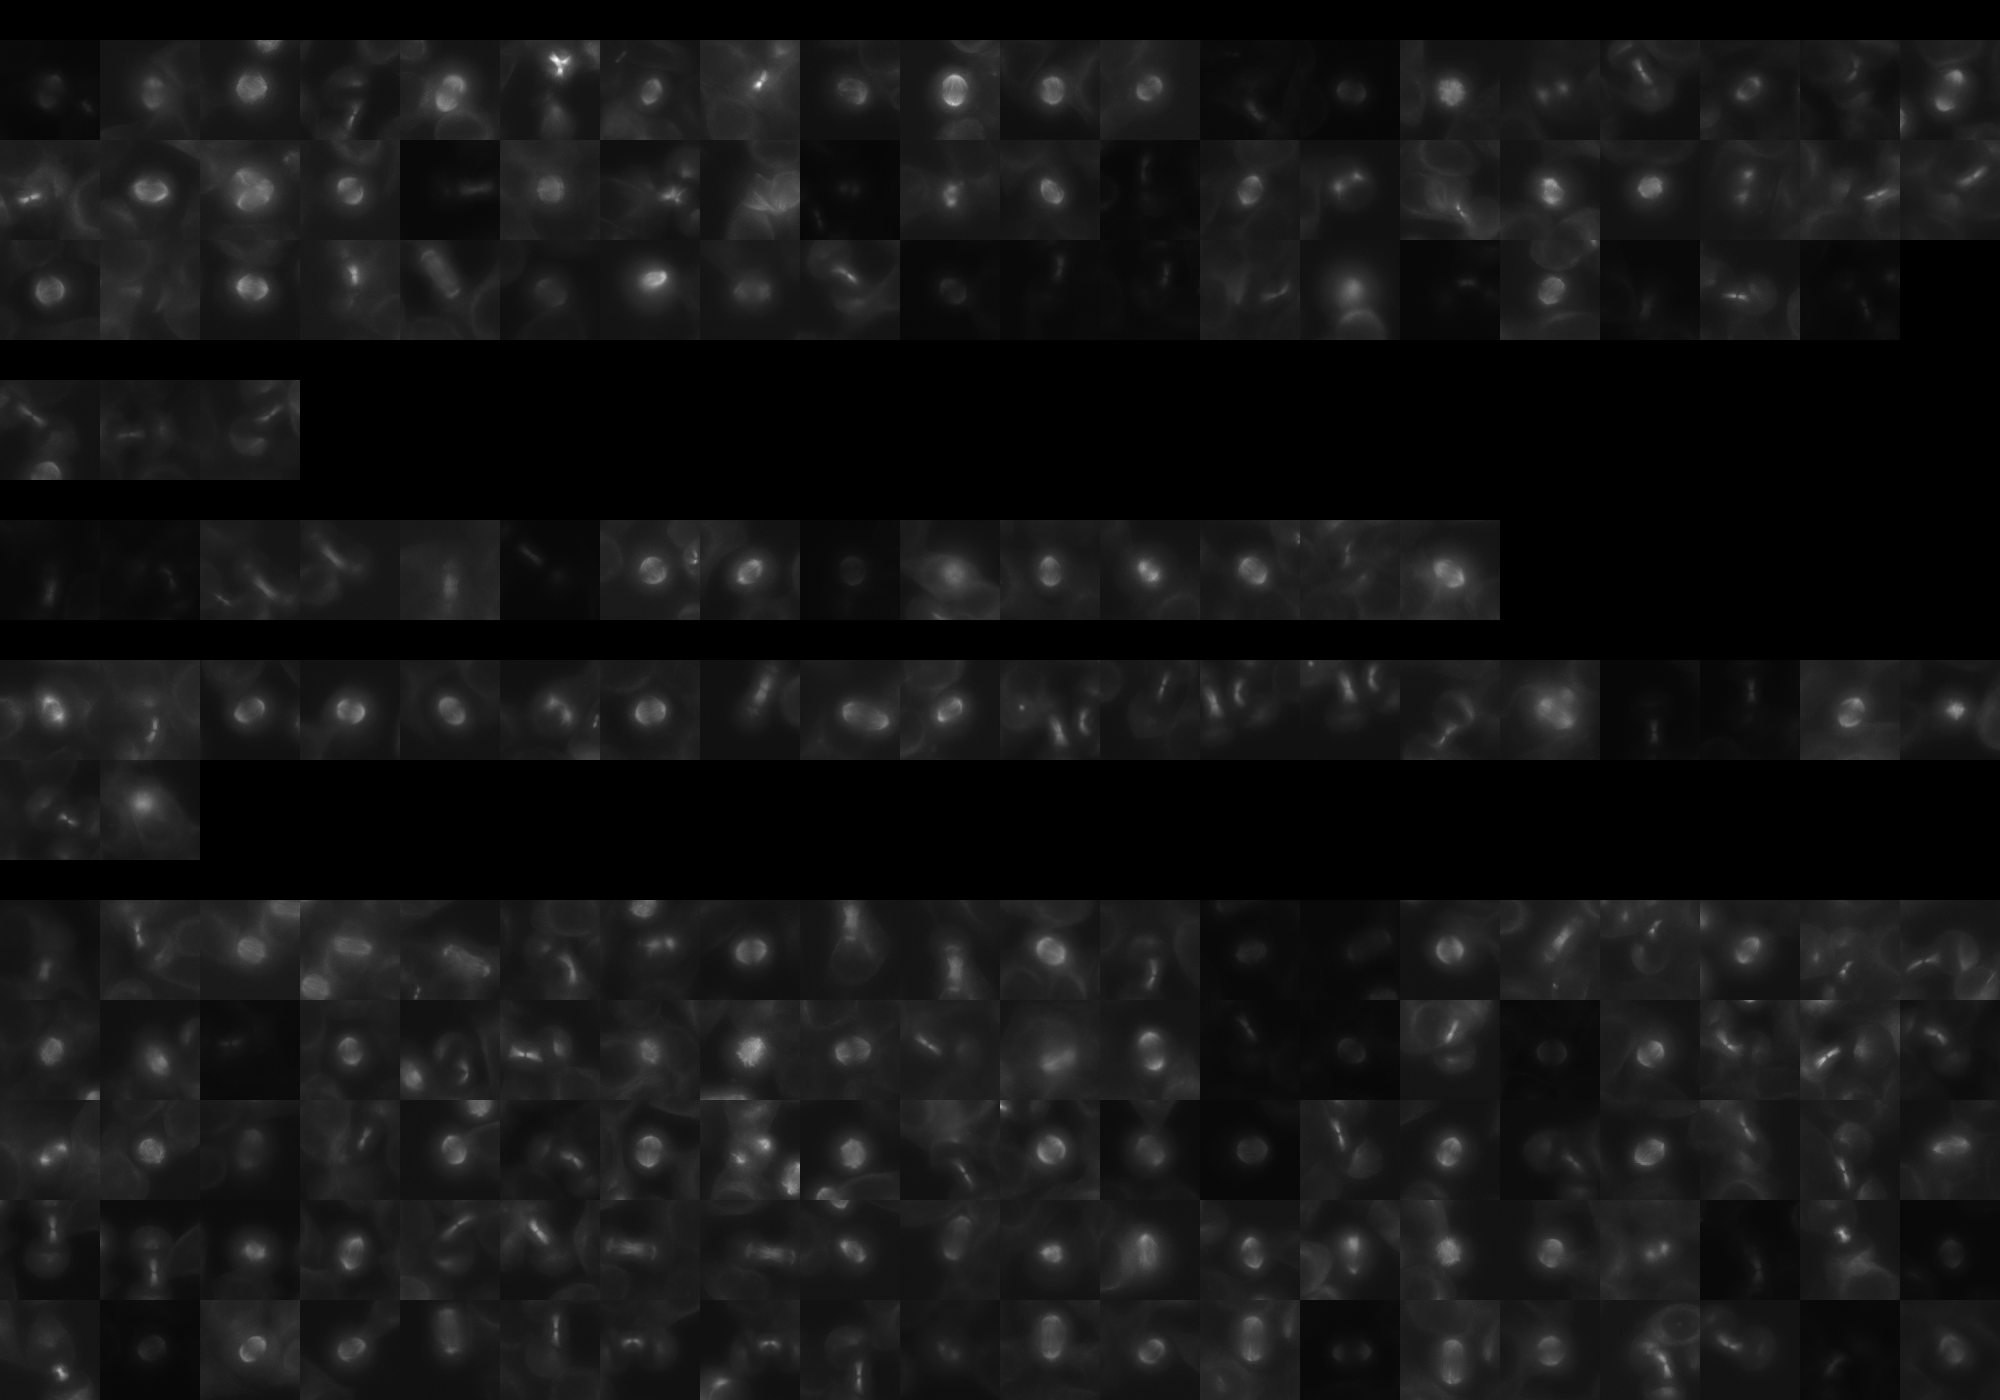
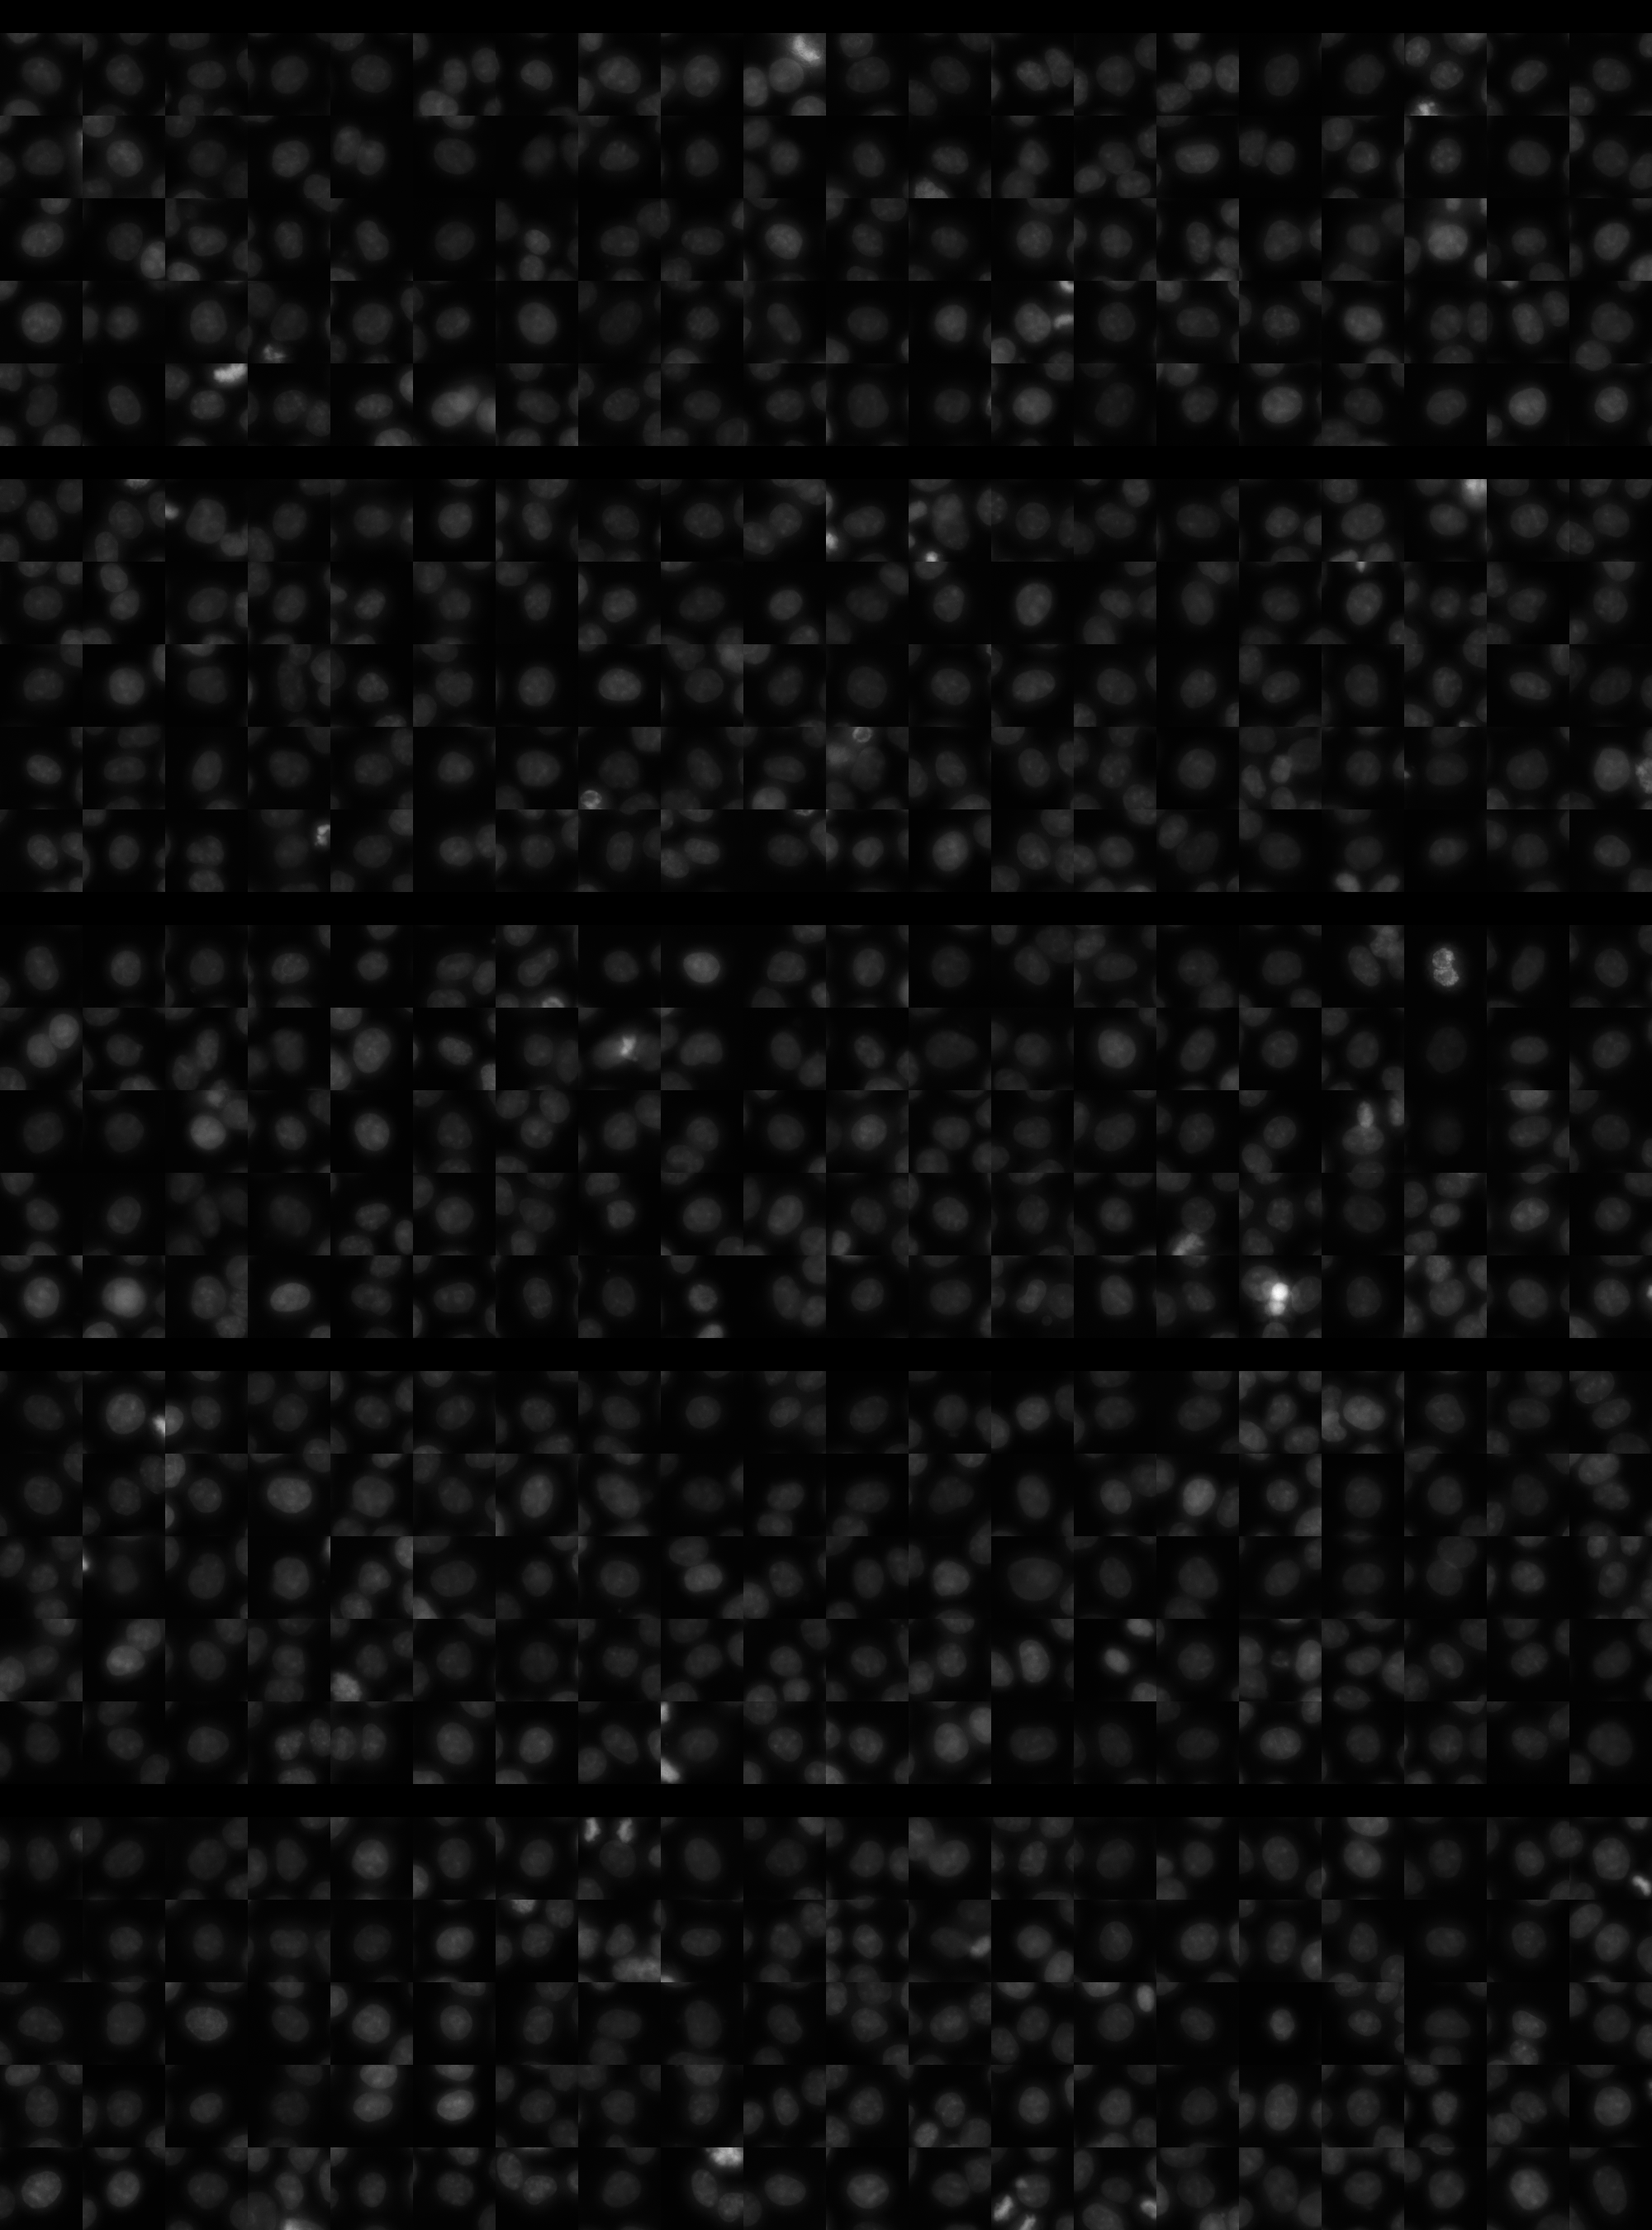
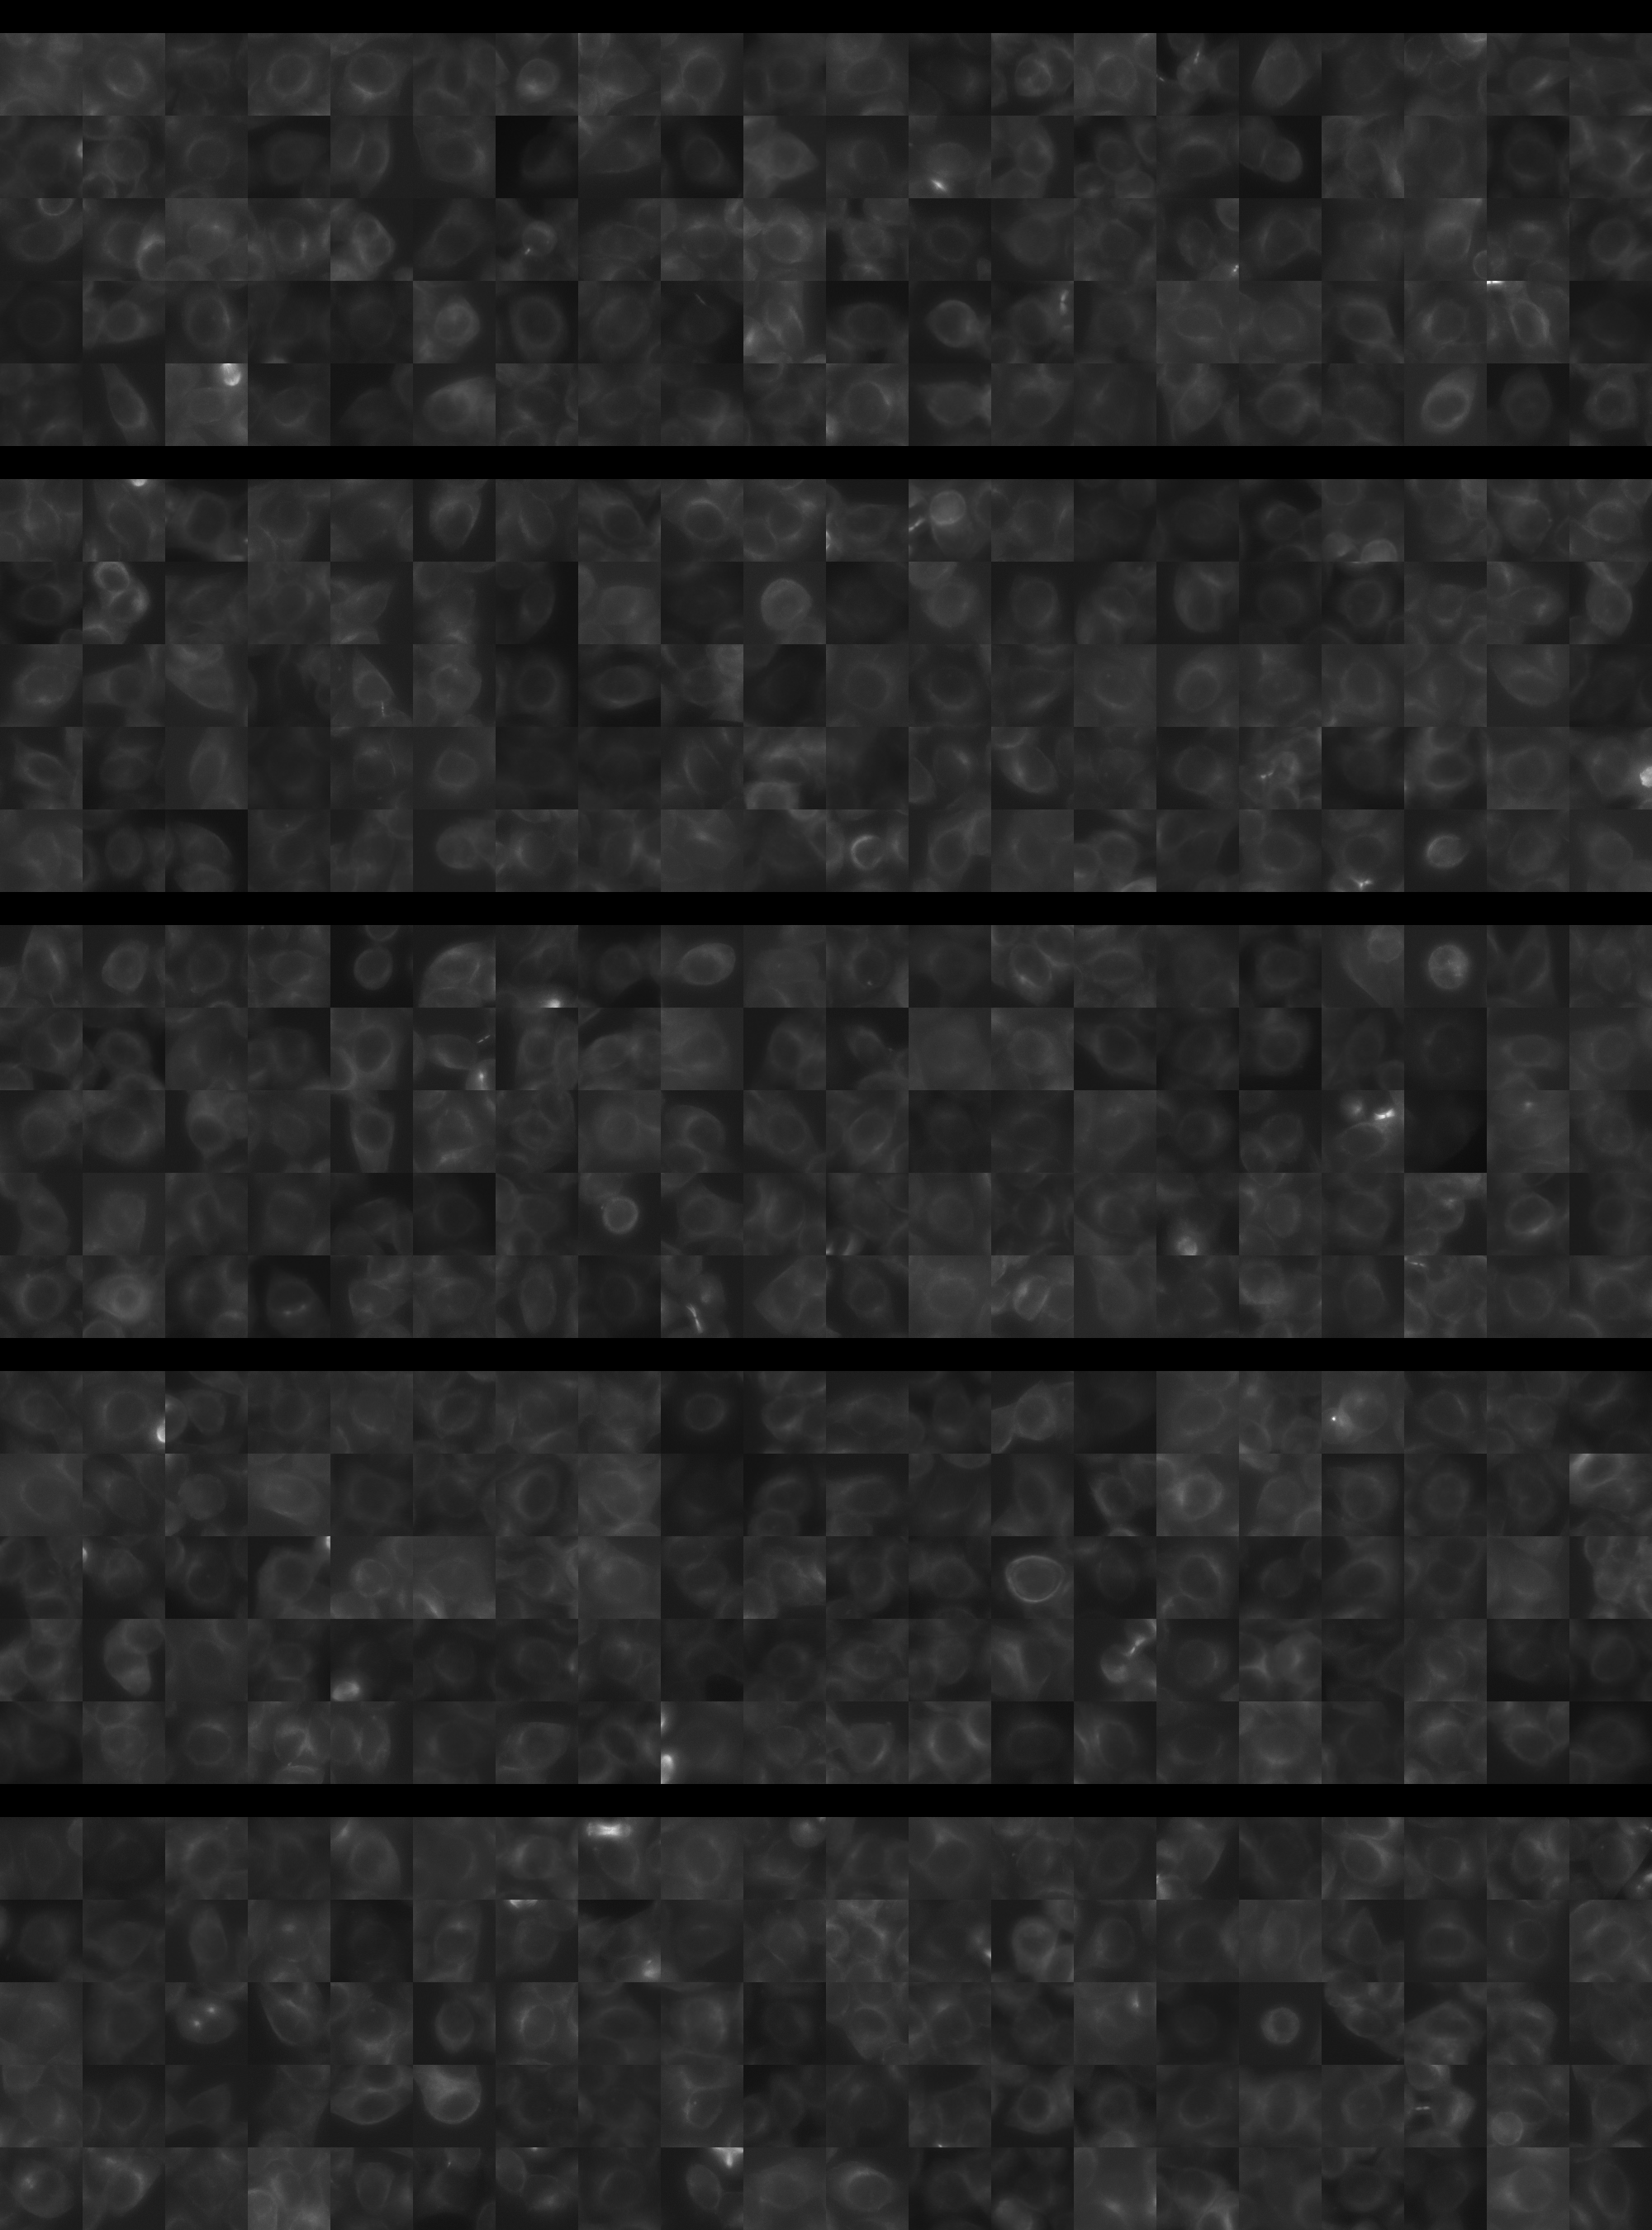
Each montage below shows randomly selected individual cell images for the same target gene separated by sgRNA, along with an example montage of cells expressing a non-targeting negative control sgRNA at the bottom. sgRNA labels in the montages correspond to the numbered sgRNA sequences in the gene info table above. The DNA (blue) and tubulin (green) channels are displayed by default, with gH2AX (grayscale) and actin (yellow) available using the check boxes. Channel brightness, contrast, and opacity are adjustable by clicking the arrow next to the channel name. When only one channel is selected, the display defaults to grayscale. Click the “Zoom” checkbox above the channel controls to enable image zooming (via scrolling) and panning (via click-and-drag).

The cell boxes displayed for this gene are square, 30.36 μm per side for the interphase montage and 30.36 μm per side for the mitotic montage.
Features

Interphase Score Rank FDR q-value
Nucleus DNA Integrated 0.079 528 of 5322 0.221
Nucleus DNA Mean 0.008 1737 of 5322 0.863
Nucleus gH2AX Mean 0.087 2322 of 5322 0.055
Nucleus DNA - gH2AX Correlation -3.794e-02 1971 of 5322 0.260
Nucleus Shape Area 0.047 1756 of 5322 0.529
Nucleus Shape Eccentricity -4.786e-02 4803 of 5322 0.341
Nucleus Shape Form Factor -5.258e-02 2817 of 5322 0.261
Nucleus Shape Solidity -3.001e-02 1744 of 5322 0.474
Cell DNA Mass Displacement 0.065 644 of 5322 0.281
Cell Tubulin Mean -2.940e-03 2907 of 5322 0.997
Cell Tubulin Mass Displacement -1.531e-02 3833 of 5322 0.870
Cell Actin Mean -4.413e-02 4243 of 5322 0.474
Cell Tubulin - Actin Correlation 0.019 2723 of 5322 0.758
Cell DNA - Tubulin Correlation 0.104 889 of 5322 0.012
Cell Shape Area 0.027 2254 of 5322 0.833
Cell Shape Eccentricity -7.329e-03 4189 of 5322 0.972
Mitotic Score Rank FDR q-value
Nucleus DNA Integrated -1.715e-01 5104 of 5322 0.930
Nucleus DNA Mean -1.322e-01 4586 of 5322 1.000
Nucleus DNA Mass Displacement 0.204 733 of 5322 0.999
Nucleus DNA Mean Frac 3 -5.768e-02 3938 of 5322 1.000
Nucleus gH2AX Mean -3.161e-01 5192 of 5322 1.000
Nucleus gH2AX Mean Frac 0 -2.195e-01 4897 of 5322 1.000
Nucleus Tubulin Mean Frac 0 -1.046e-01 4714 of 5322 0.999
Nucleus Tubulin Mean Edge -2.916e-01 5101 of 5322 0.958
Nucleus Tubulin Std Edge -1.060e-01 3956 of 5322 0.999
Nucleus Shape Area -2.544e-01 5234 of 5322 0.864
Nucleus Shape Eccentricity 0.080 1050 of 5322 1.000
Nucleus Shape Form Factor 0.136 257 of 5322 0.998
Cell Tubulin Mean -5.245e-01 5306 of 5322 0.208
Cell Tubulin Mean Frac 3 0.456 11 of 5322 0.647
Cell Actin Mean -5.980e-01 5318 of 5322 0.143
Cell Shape Area -1.360e-01 4976 of 5322 0.998
( Reset Zoom )
Brightness
Contrast
Opacity
Brightness
Contrast
Opacity
Brightness
Contrast
Opacity
Brightness
Contrast
Opacity
Brightness
Contrast
Opacity

( Reset Zoom )
Brightness
Contrast
Opacity
Brightness
Contrast
Opacity
Brightness
Contrast
Opacity
Brightness
Contrast
Opacity
Brightness
Contrast
Opacity

MIT Central Accessability