AARS2

Due to sgRNA sequence design constraints two or more of the sgRNAs used to target this gene have multiple genomic target sites, potentially impacting the observed phenotype through increased DNA damage.
Gene symbol: AARS2
Gene: 57505
Uniprot Function: Catalyzes the attachment of alanine to tRNA(Ala) in a two-step reaction: alanine is first activated by ATP to form Ala-AMP and then transferred to the acceptor end of tRNA(Ala). Also edits incorrectly charged tRNA(Ala) via its editing domain.
Mitotic Index 0.0217
Interphase Cluster: #131 (21 genes)
Mitotic Cluster: #209 (10 genes)
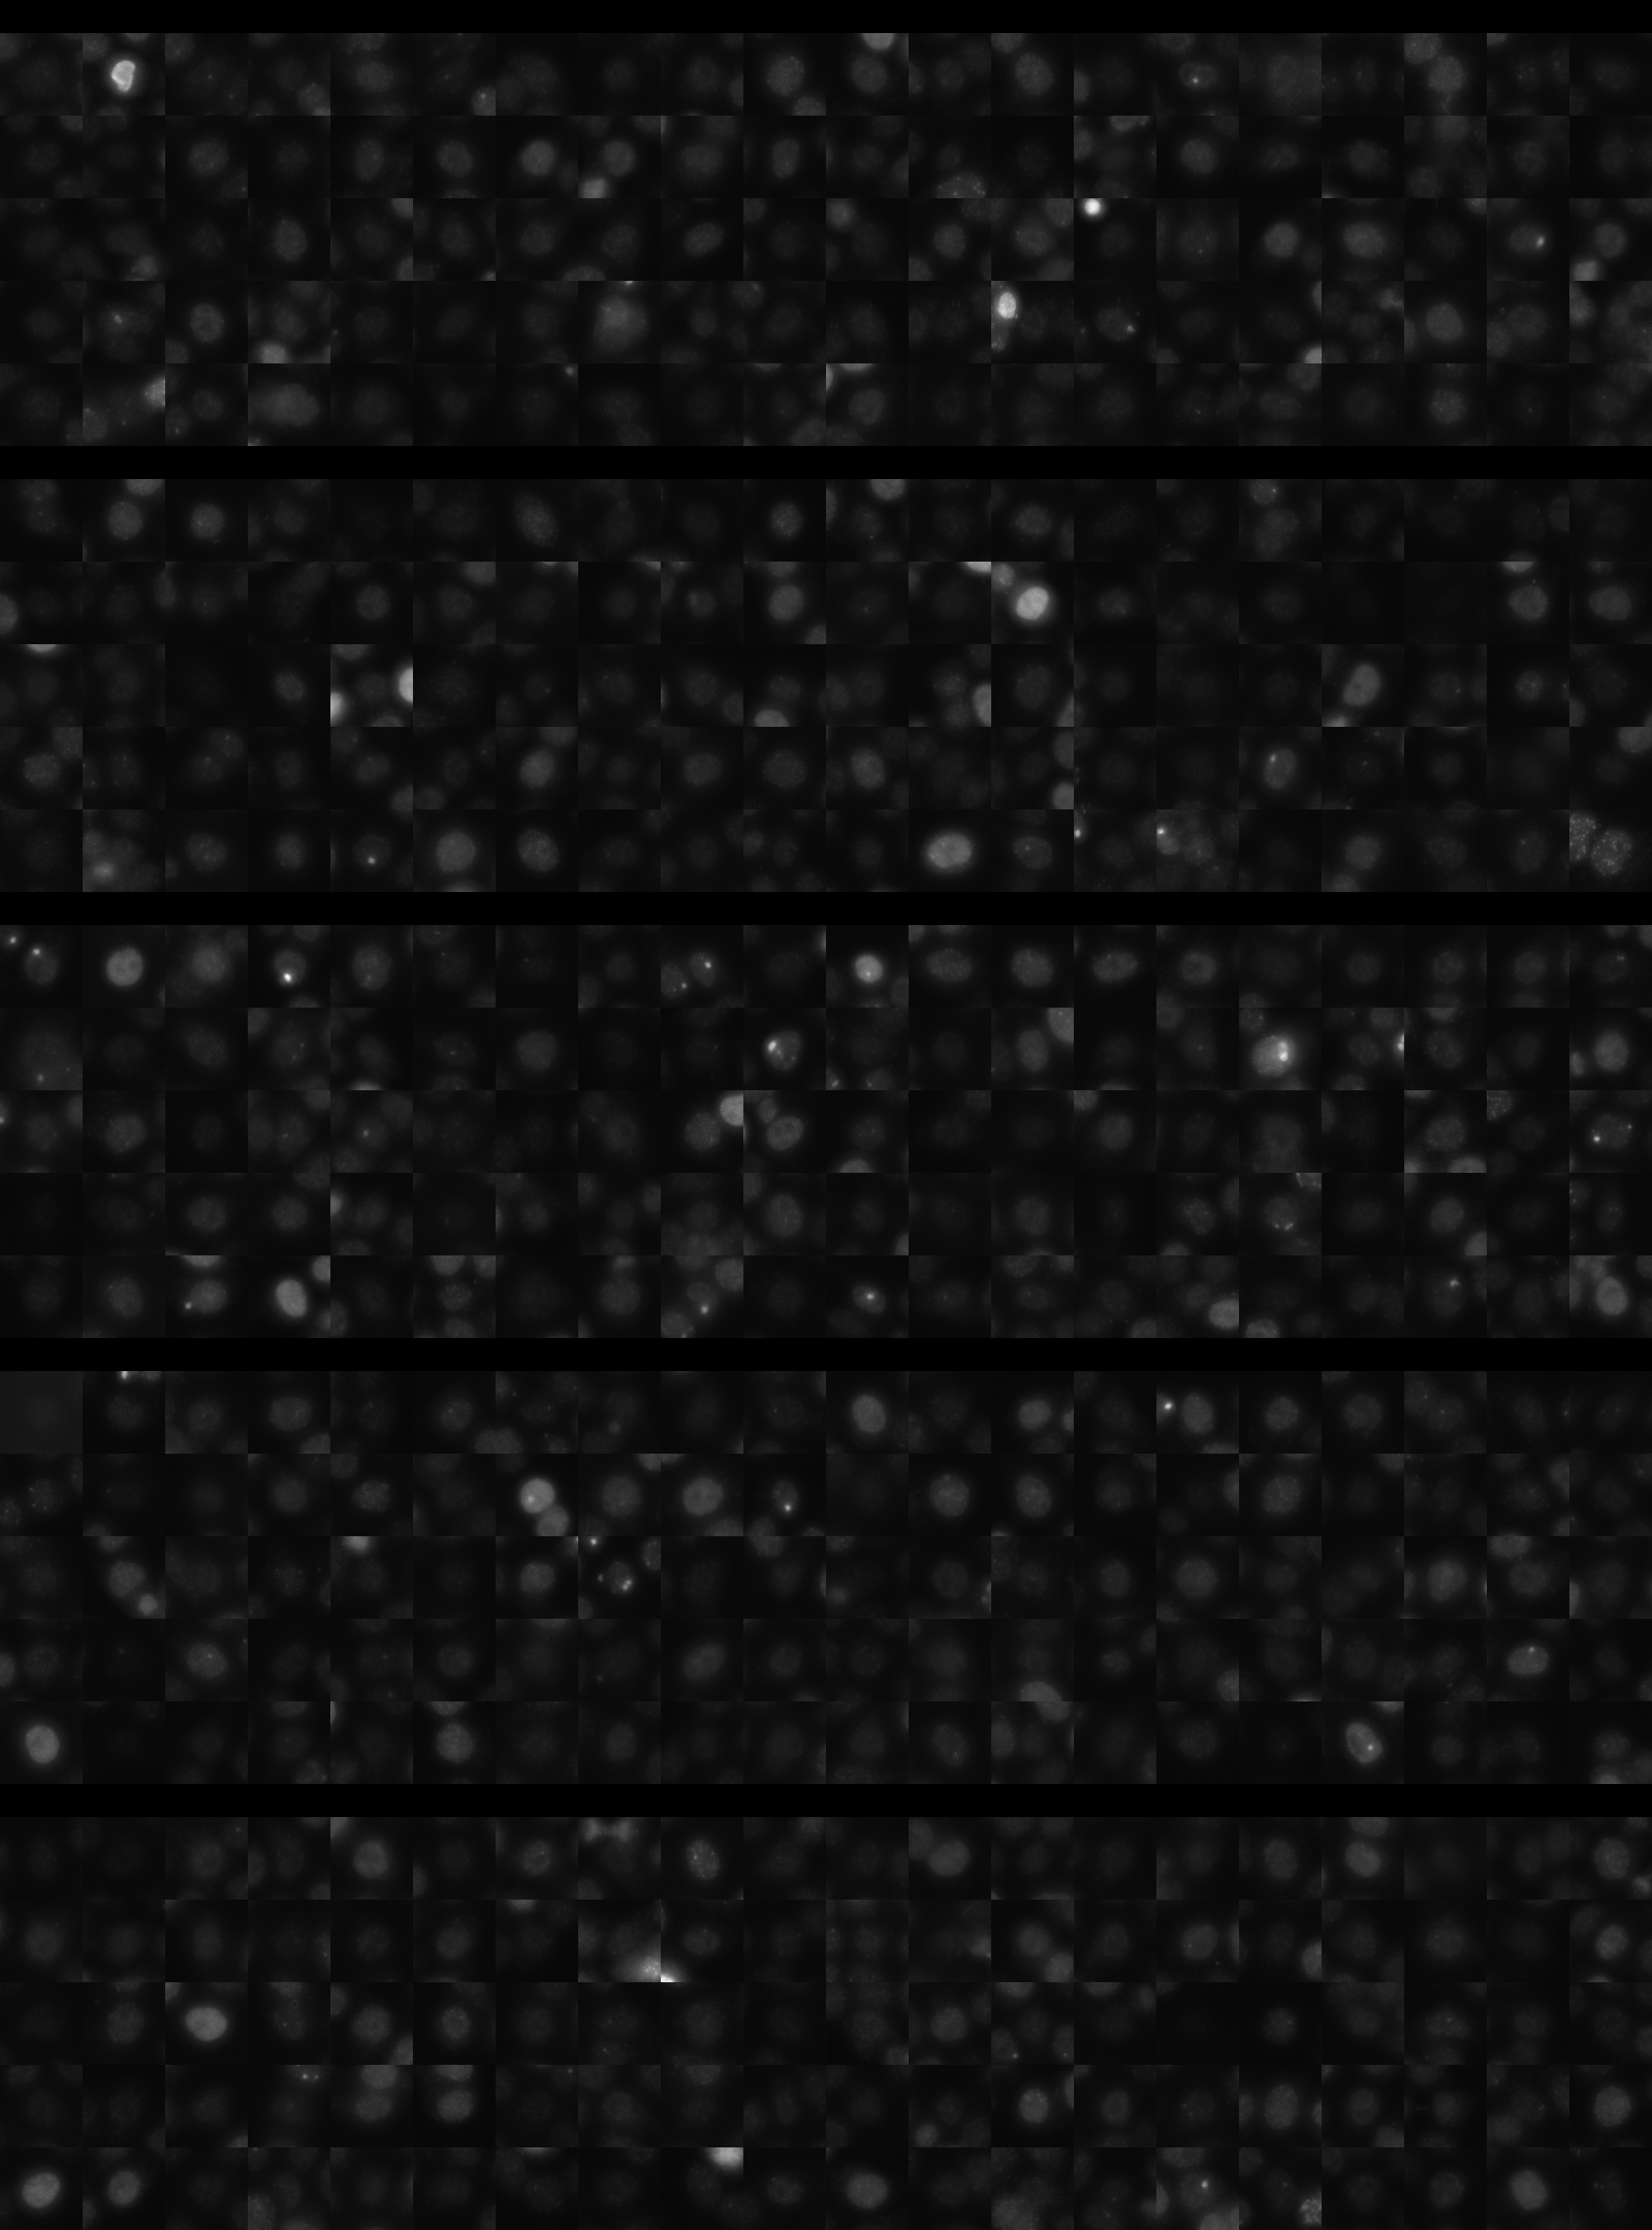
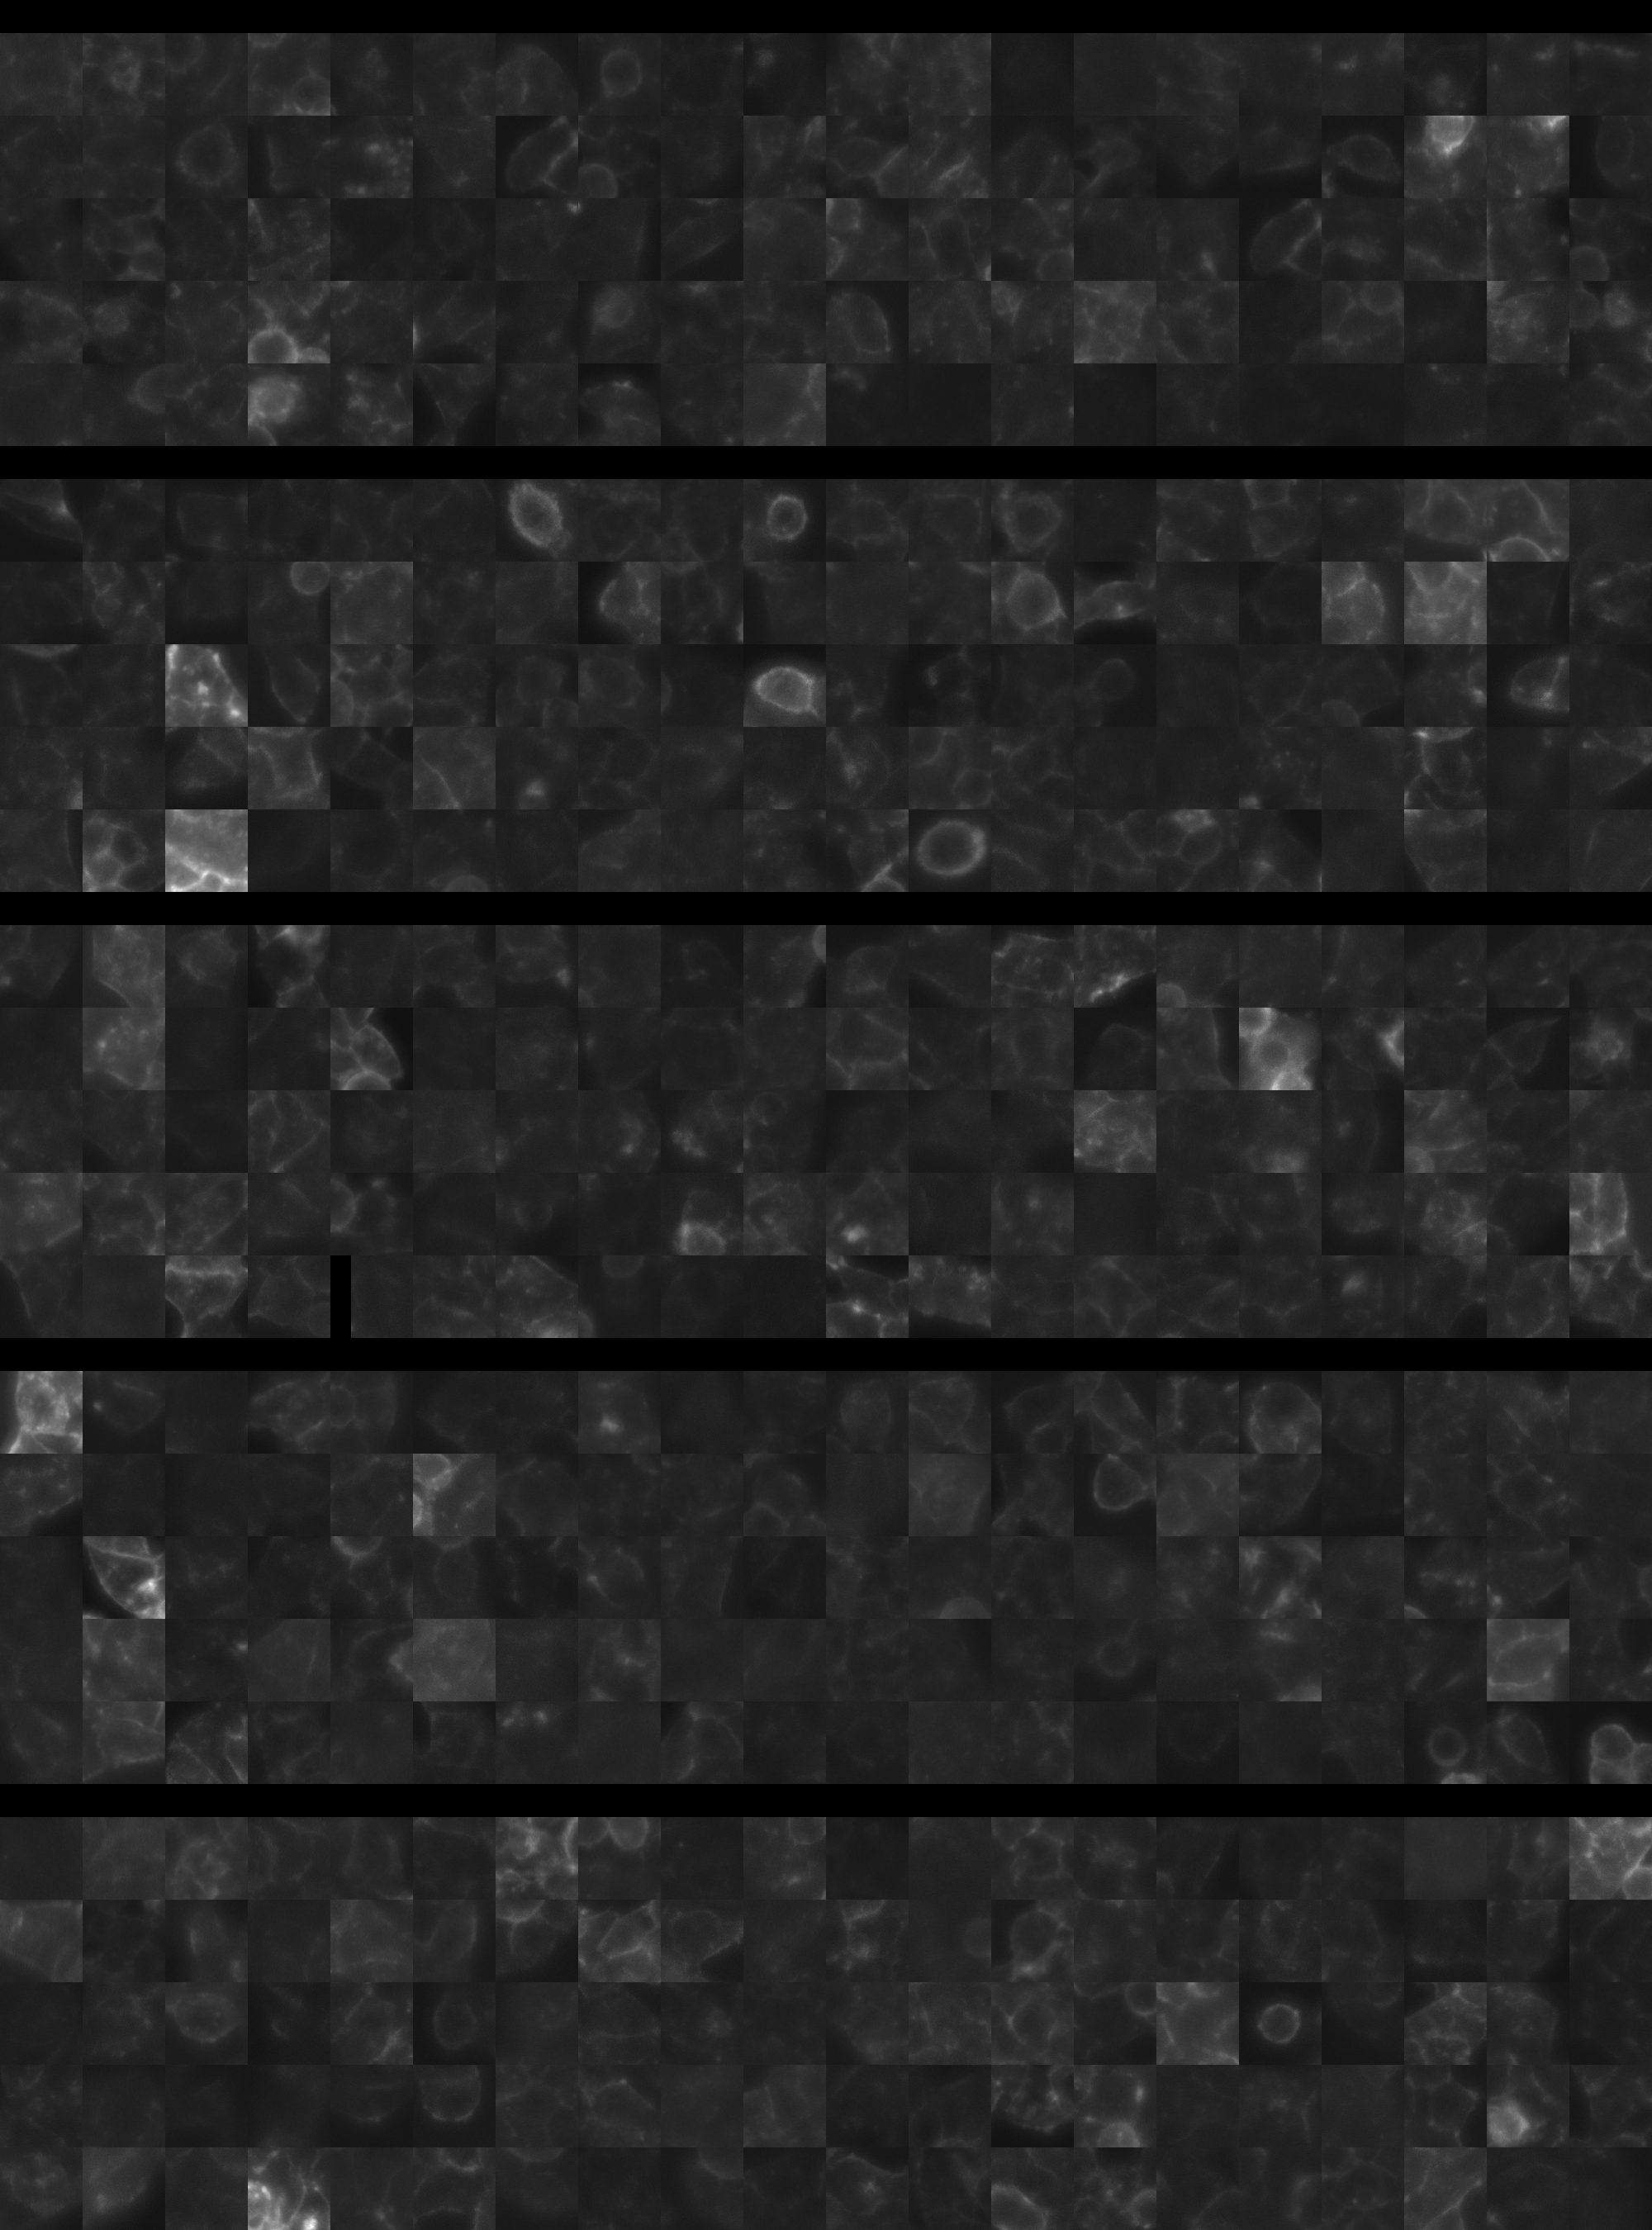
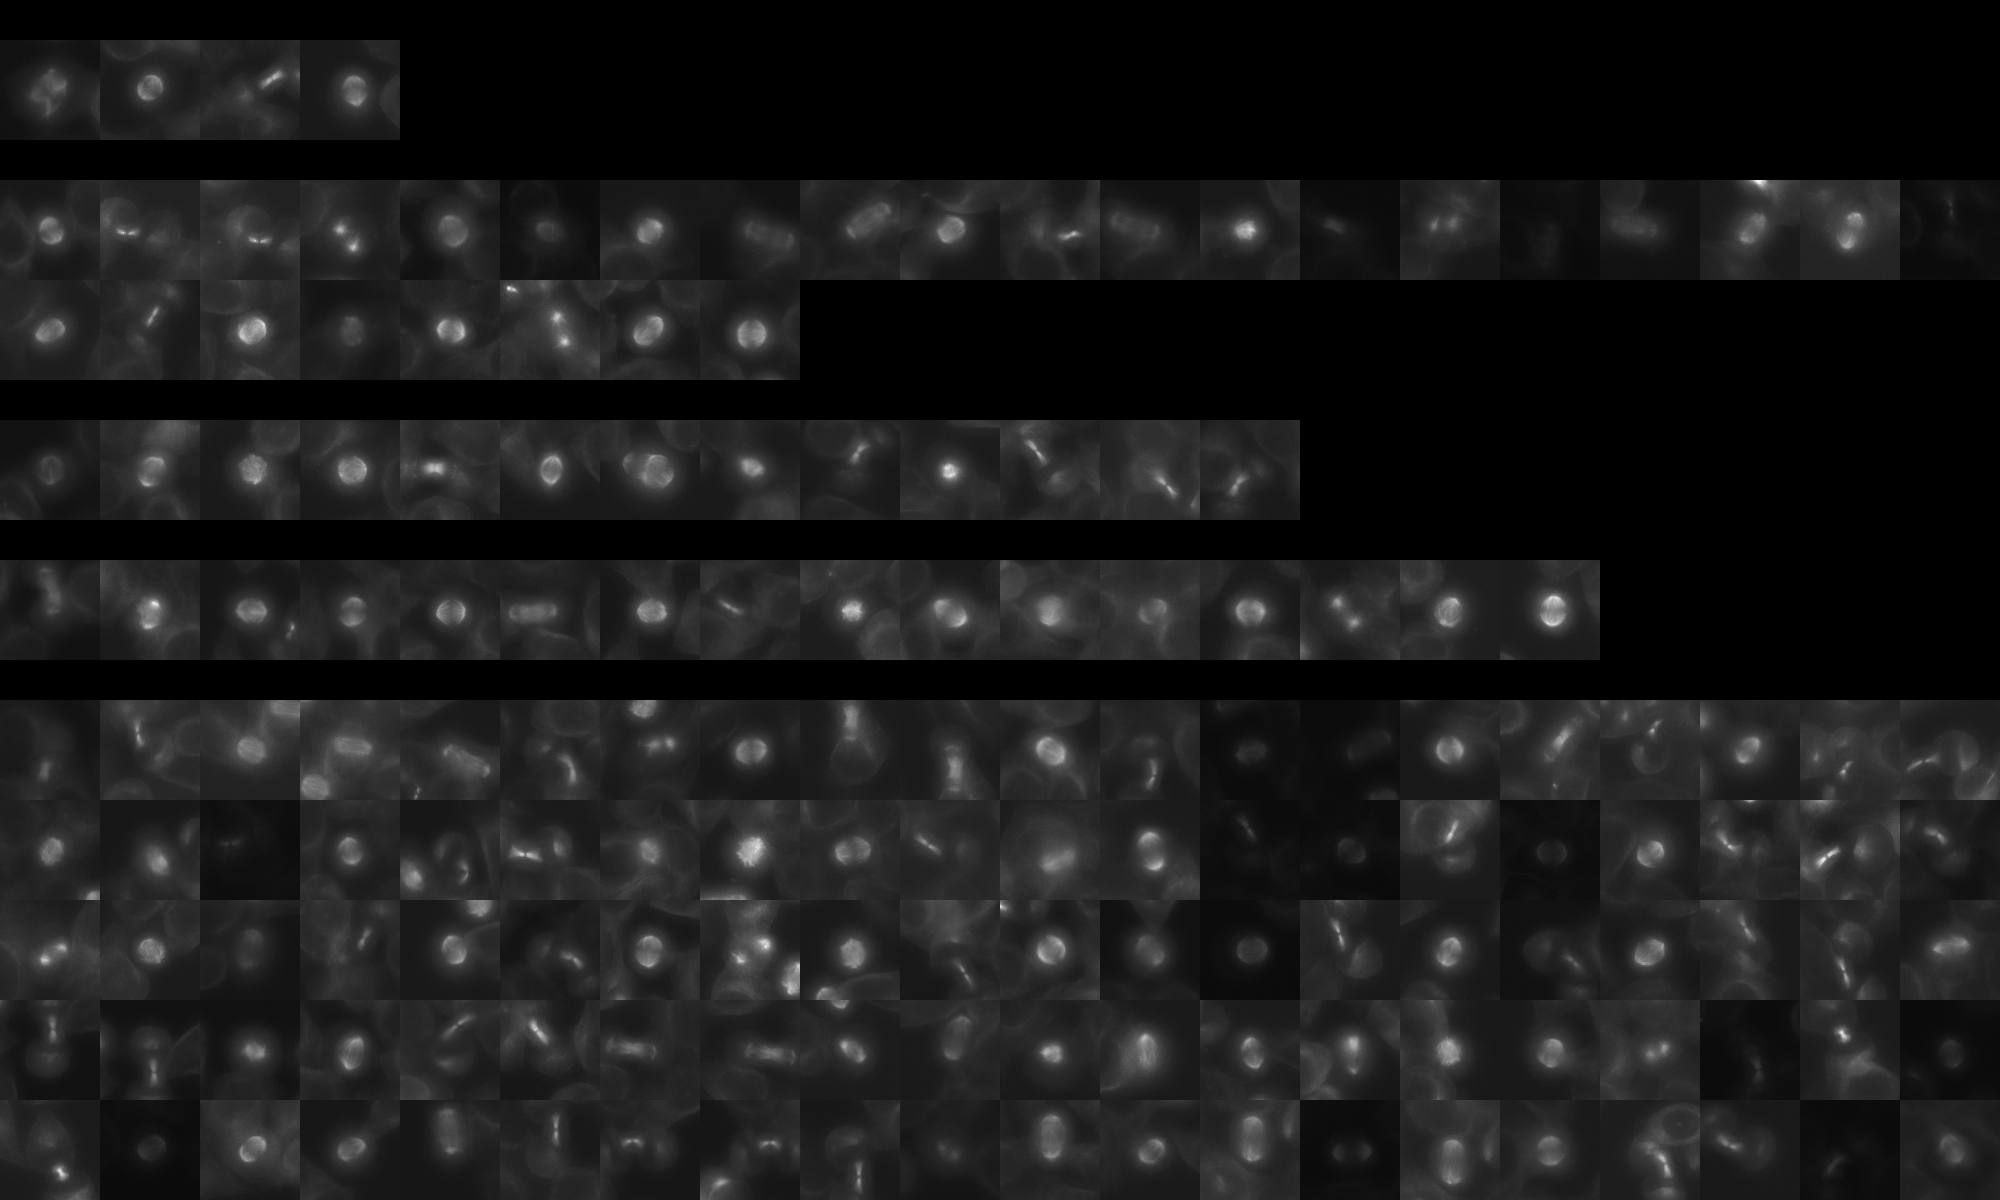
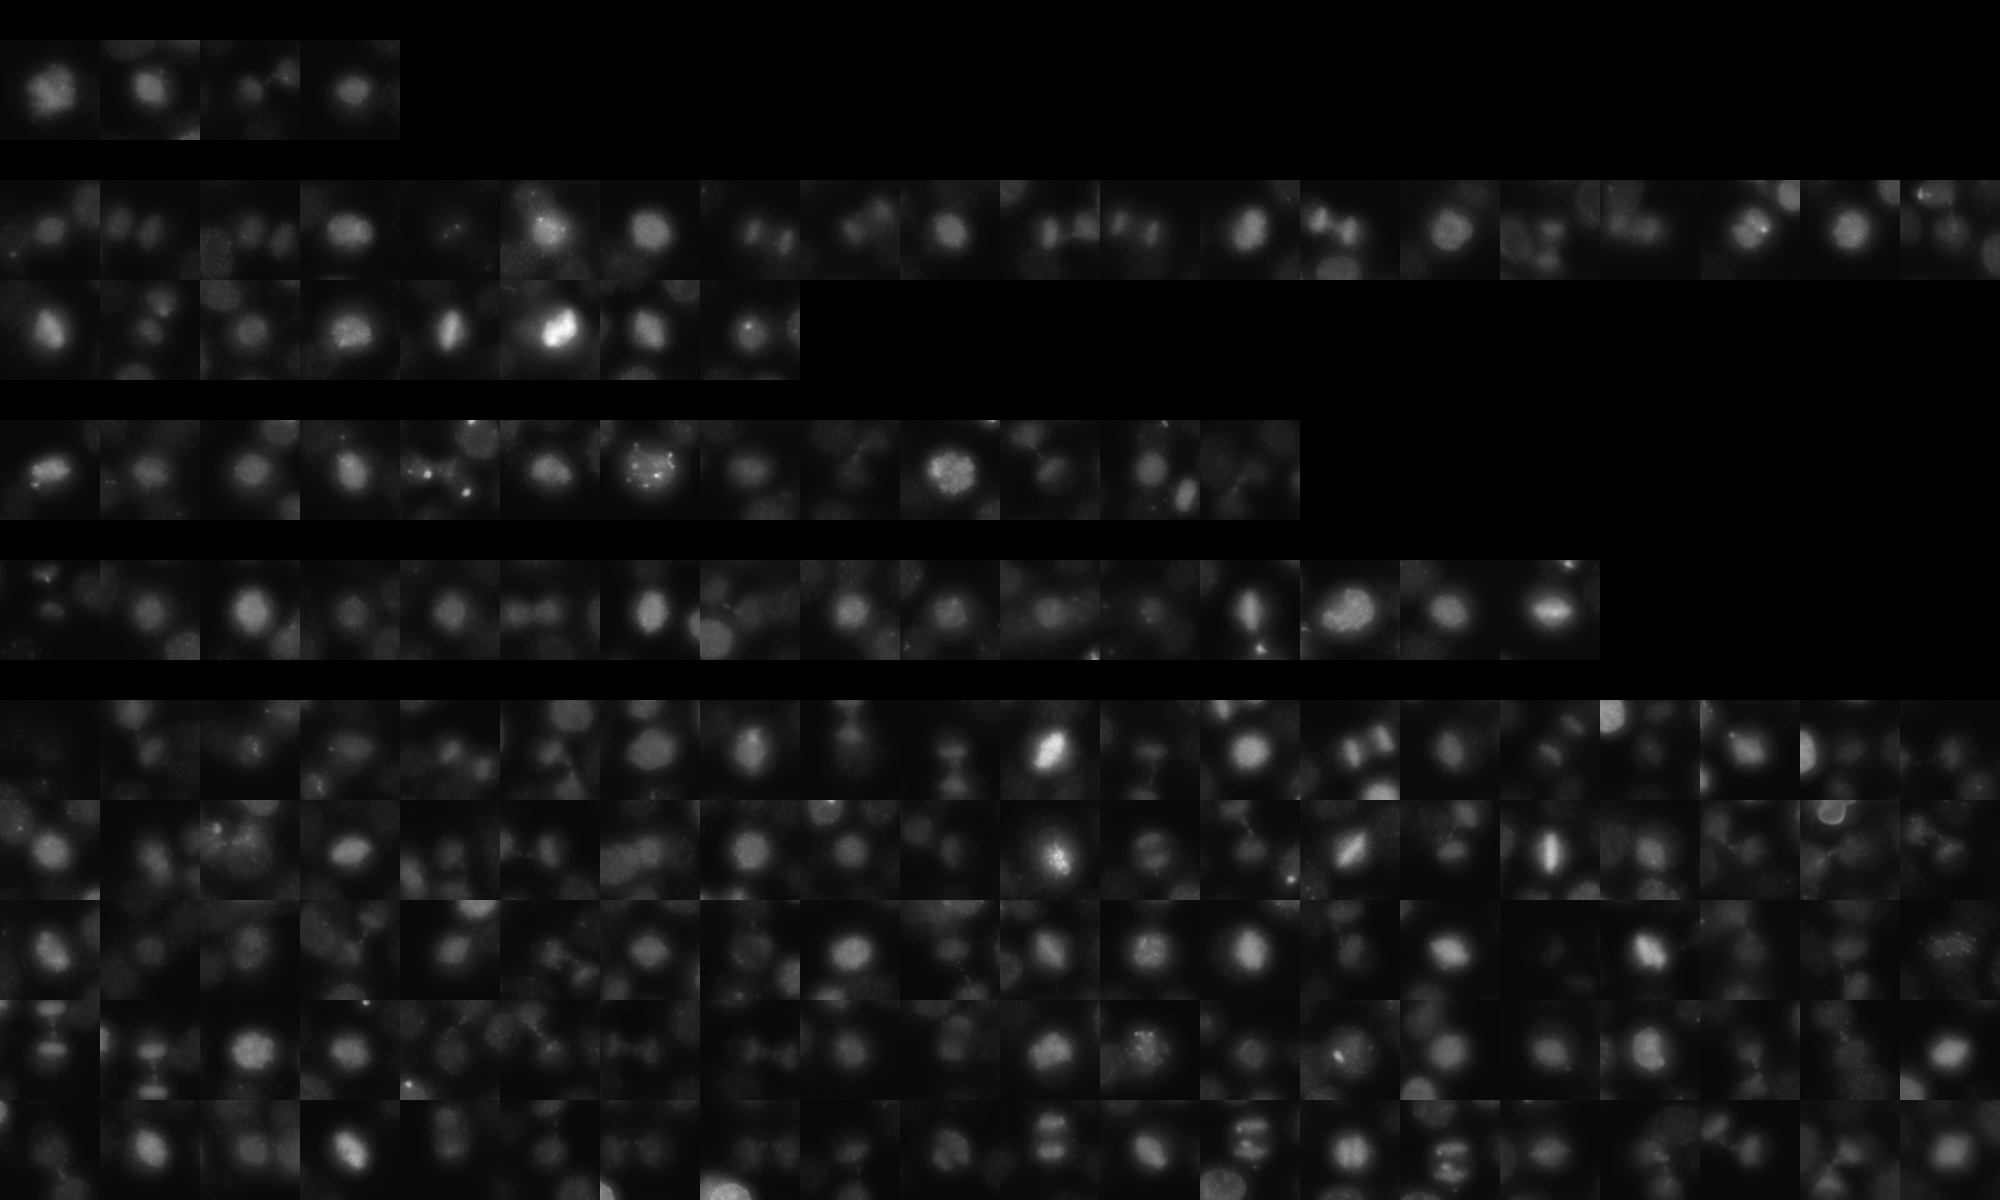
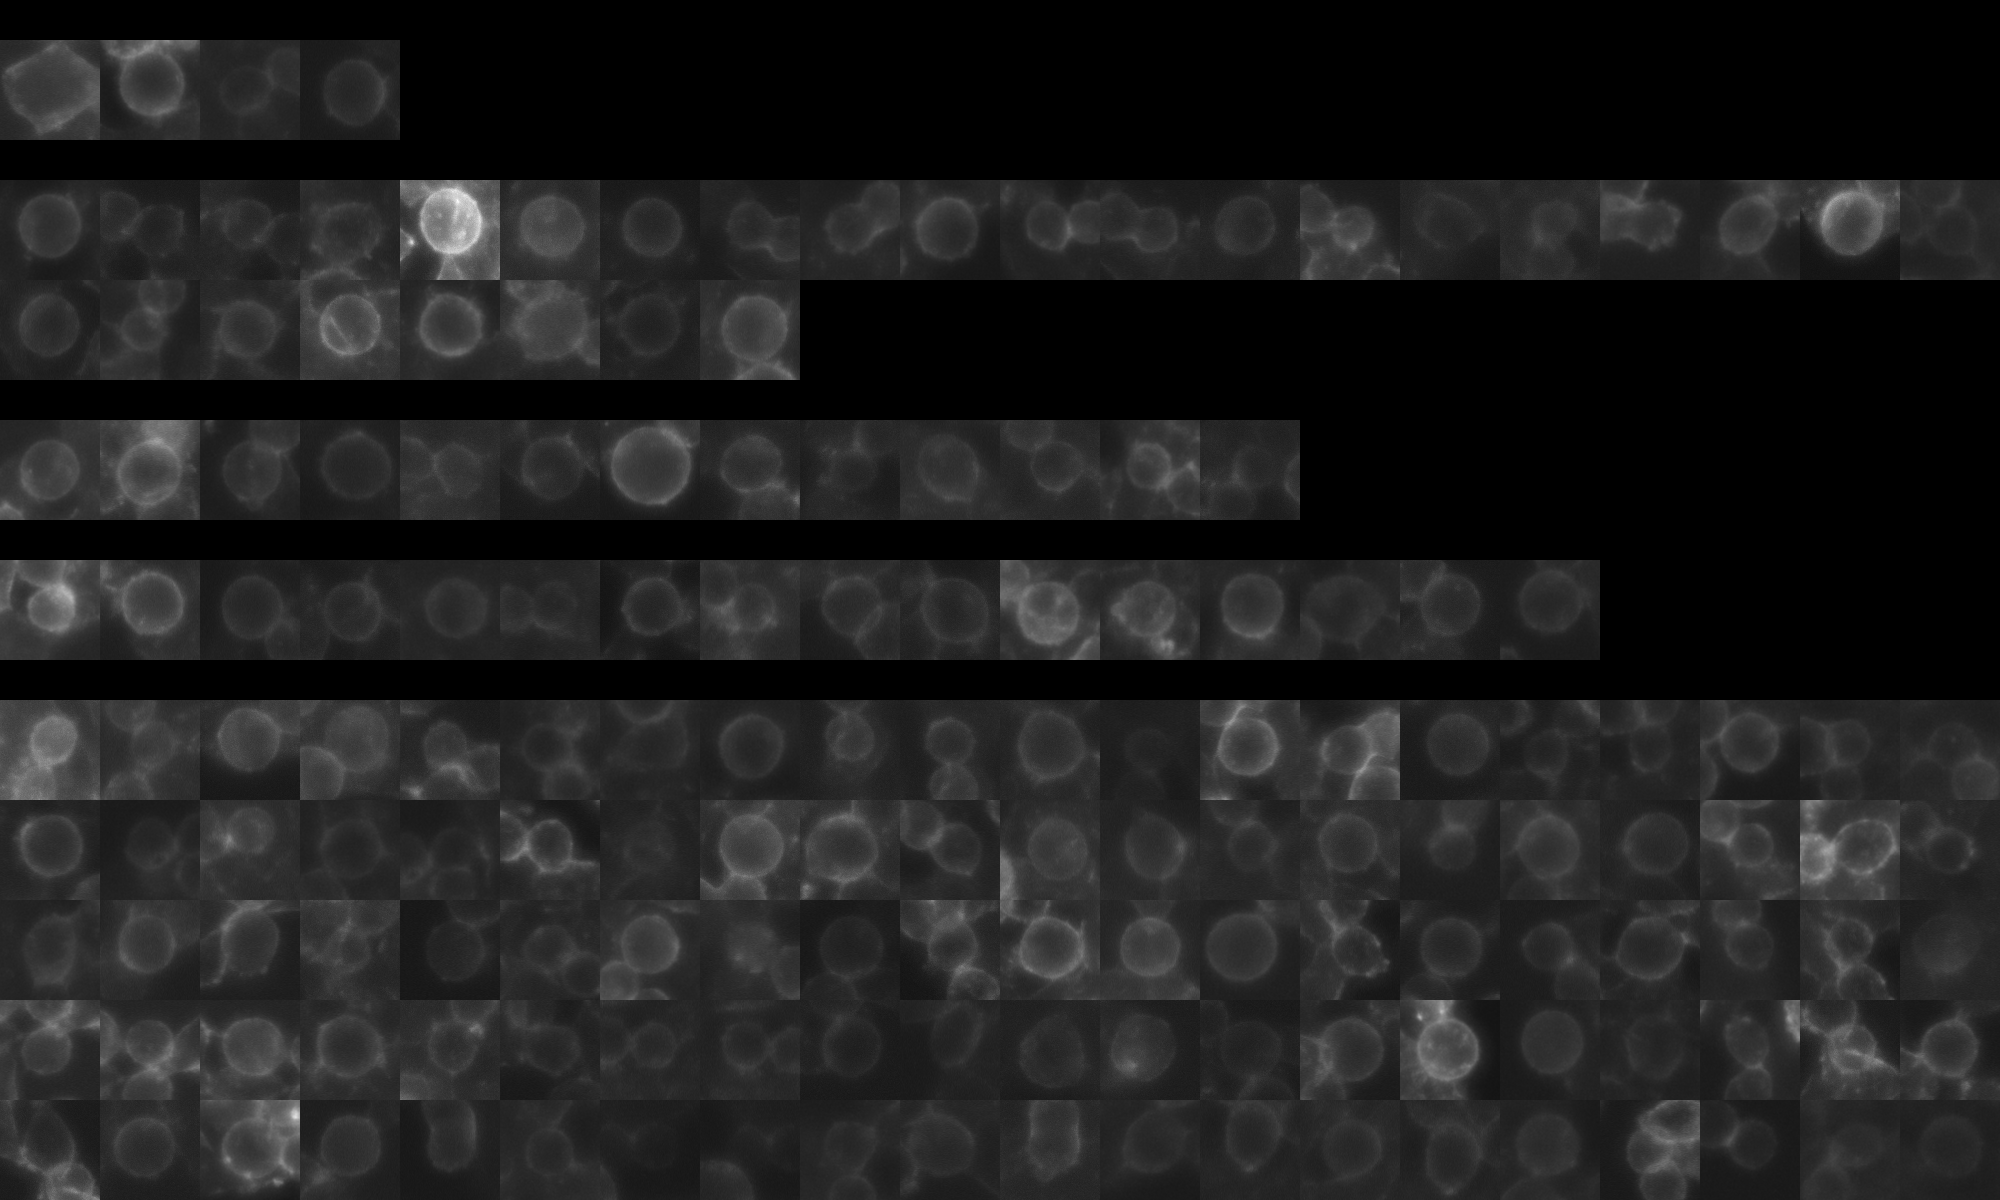
sgRNA 1: AAAGGCGGCCCTCACGGCCG (interphase cells: 182, mitotic cells: 4)
sgRNA 2: AGCAAACTGGGGTCGCCGCG (interphase cells: 1066, mitotic cells: 28)
sgRNA 3: GCTGCTCAACGCCATACAGC (interphase cells: 765, mitotic cells: 13)
sgRNA 4: GGTTCCAAAGCTCTACCAGC (interphase cells: 734, mitotic cells: 16)

Interphase Cluster

Mitotic Cluster

Overview

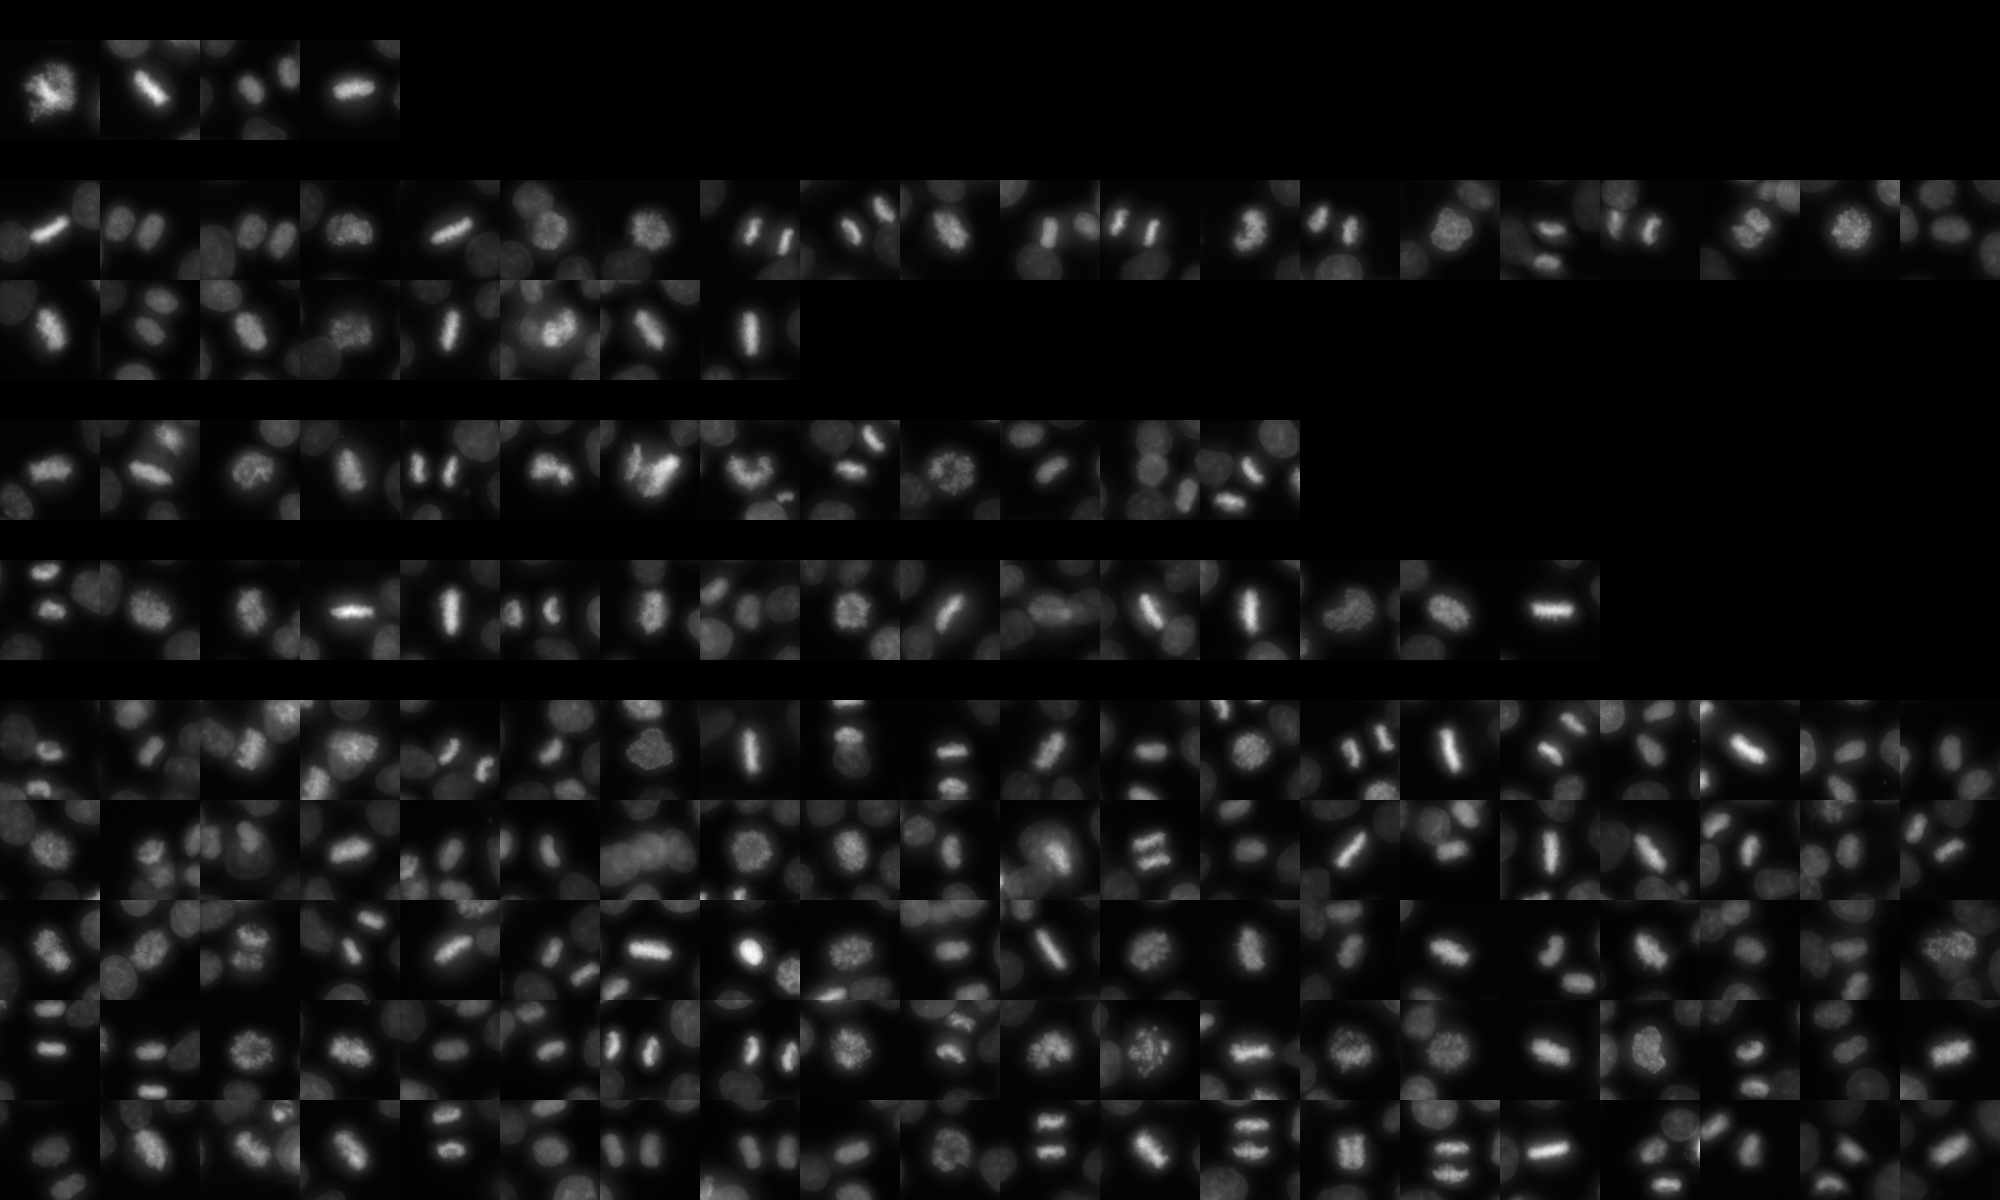
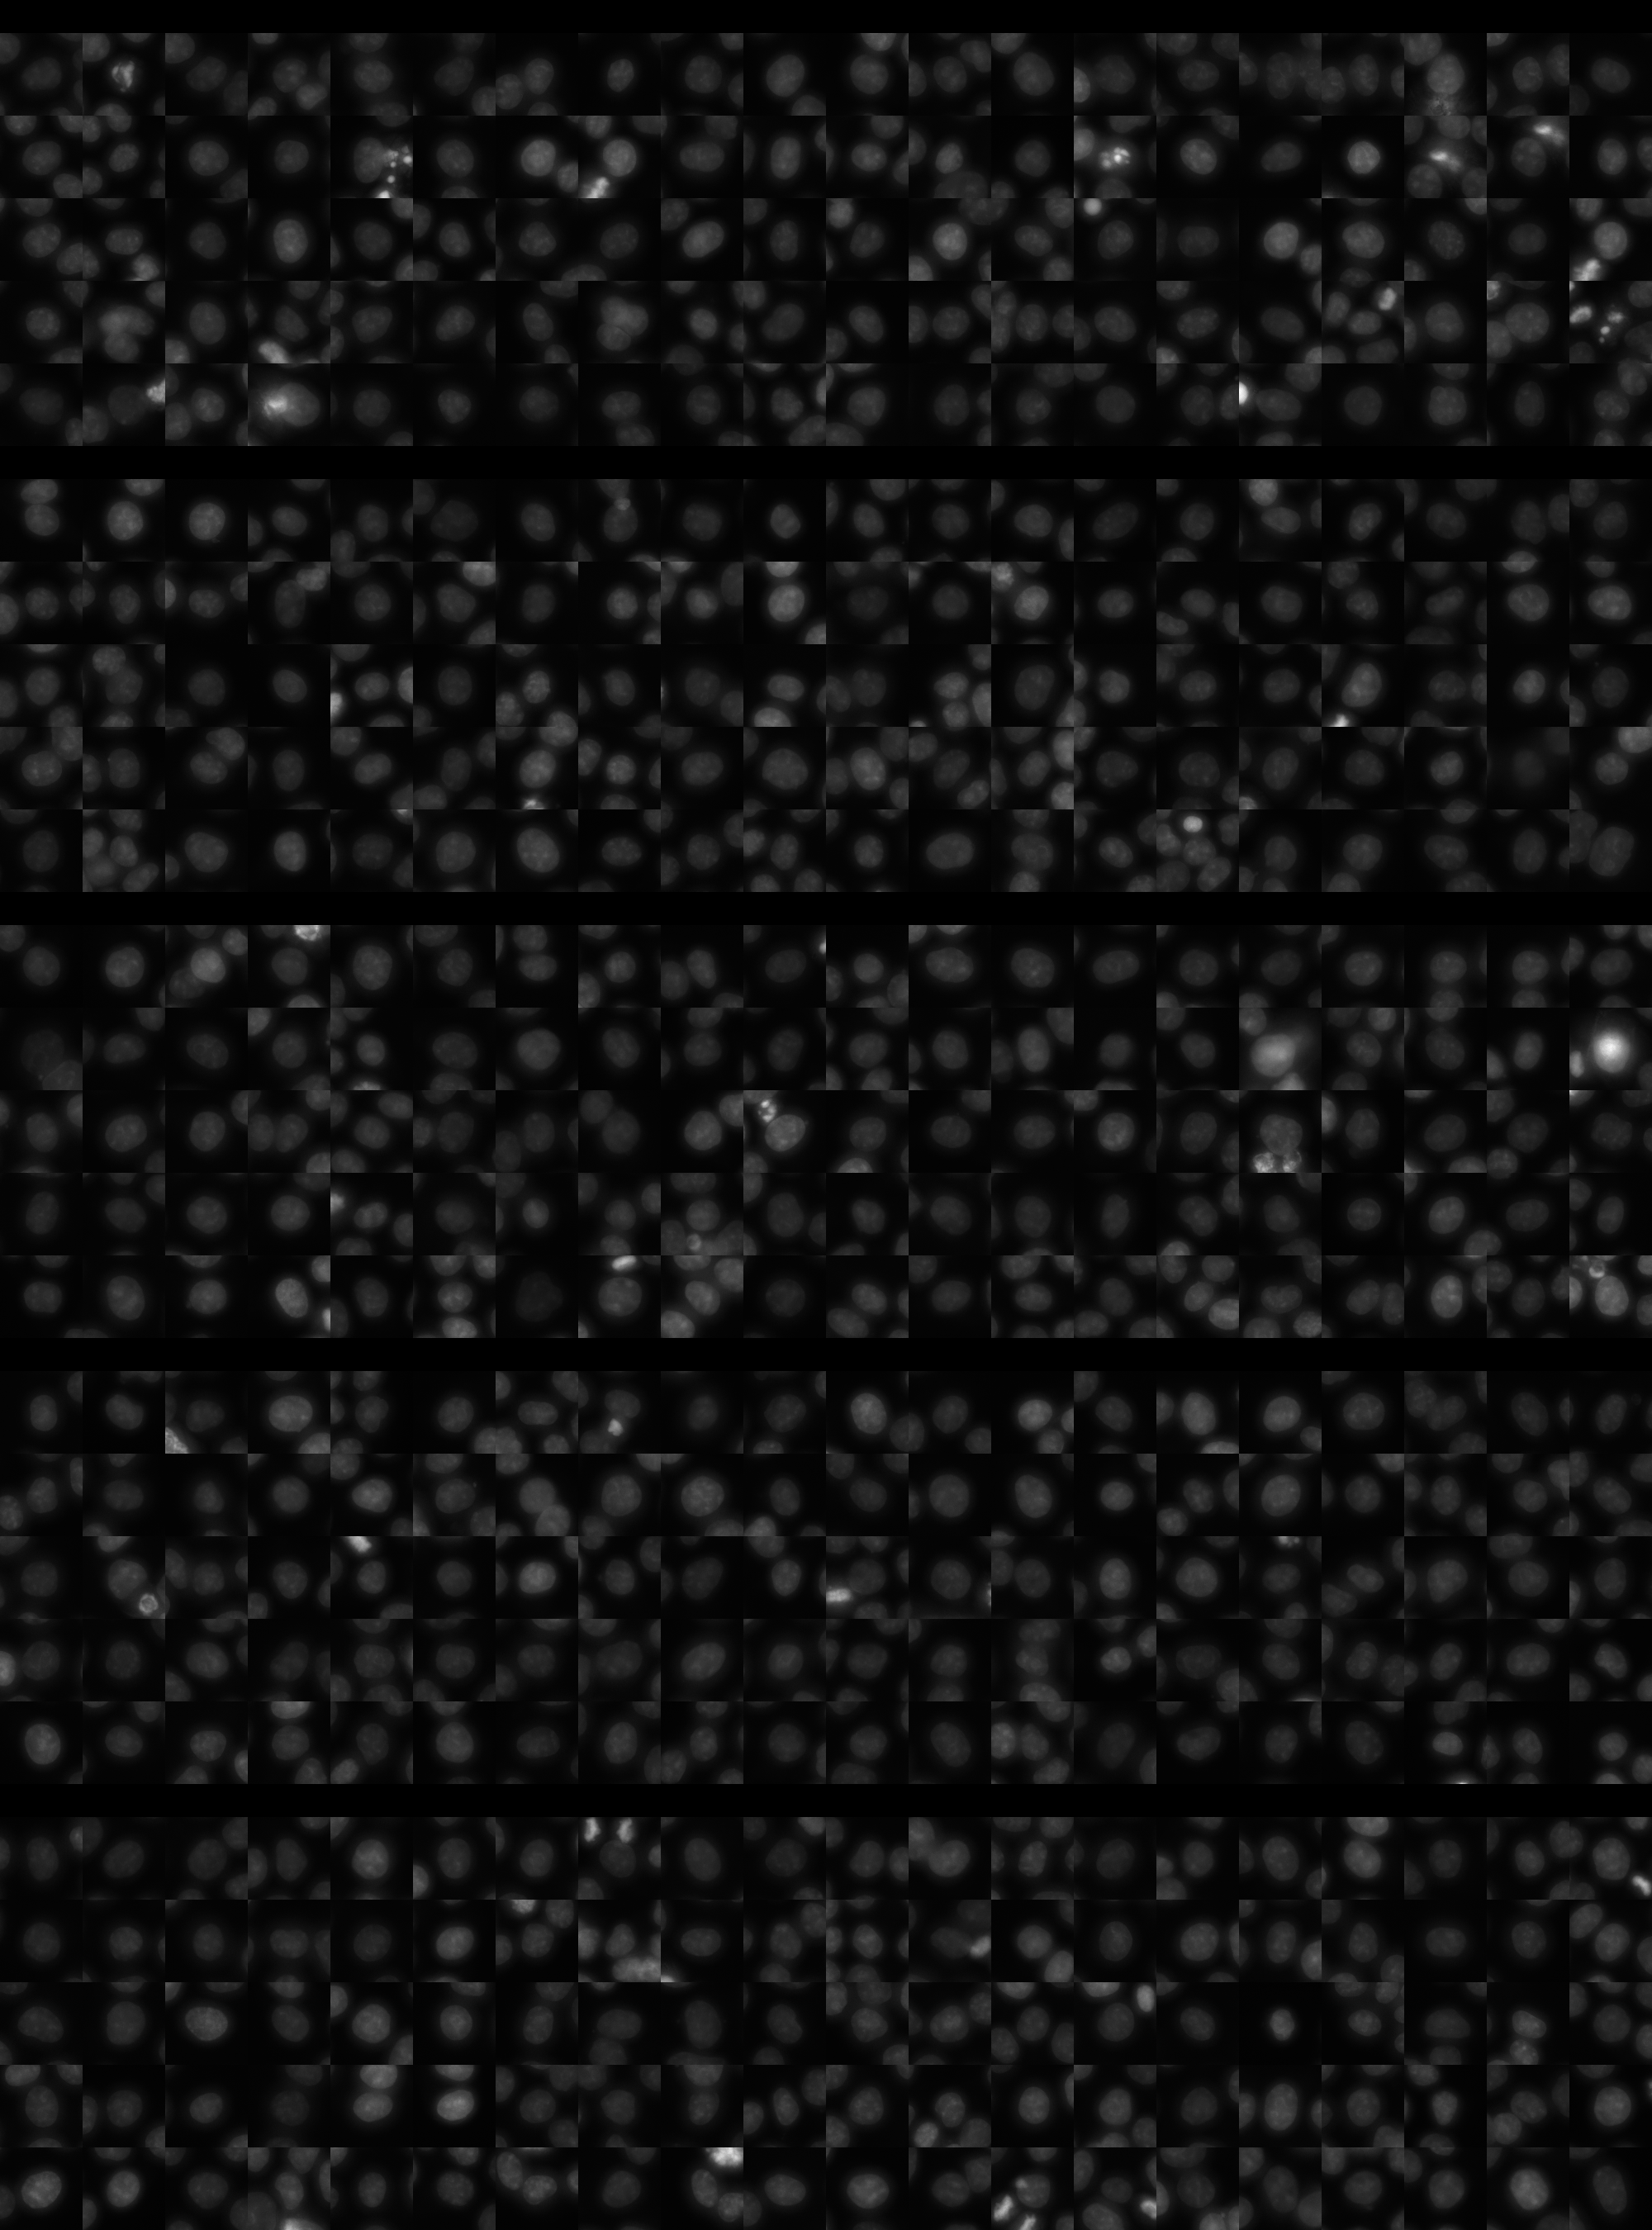
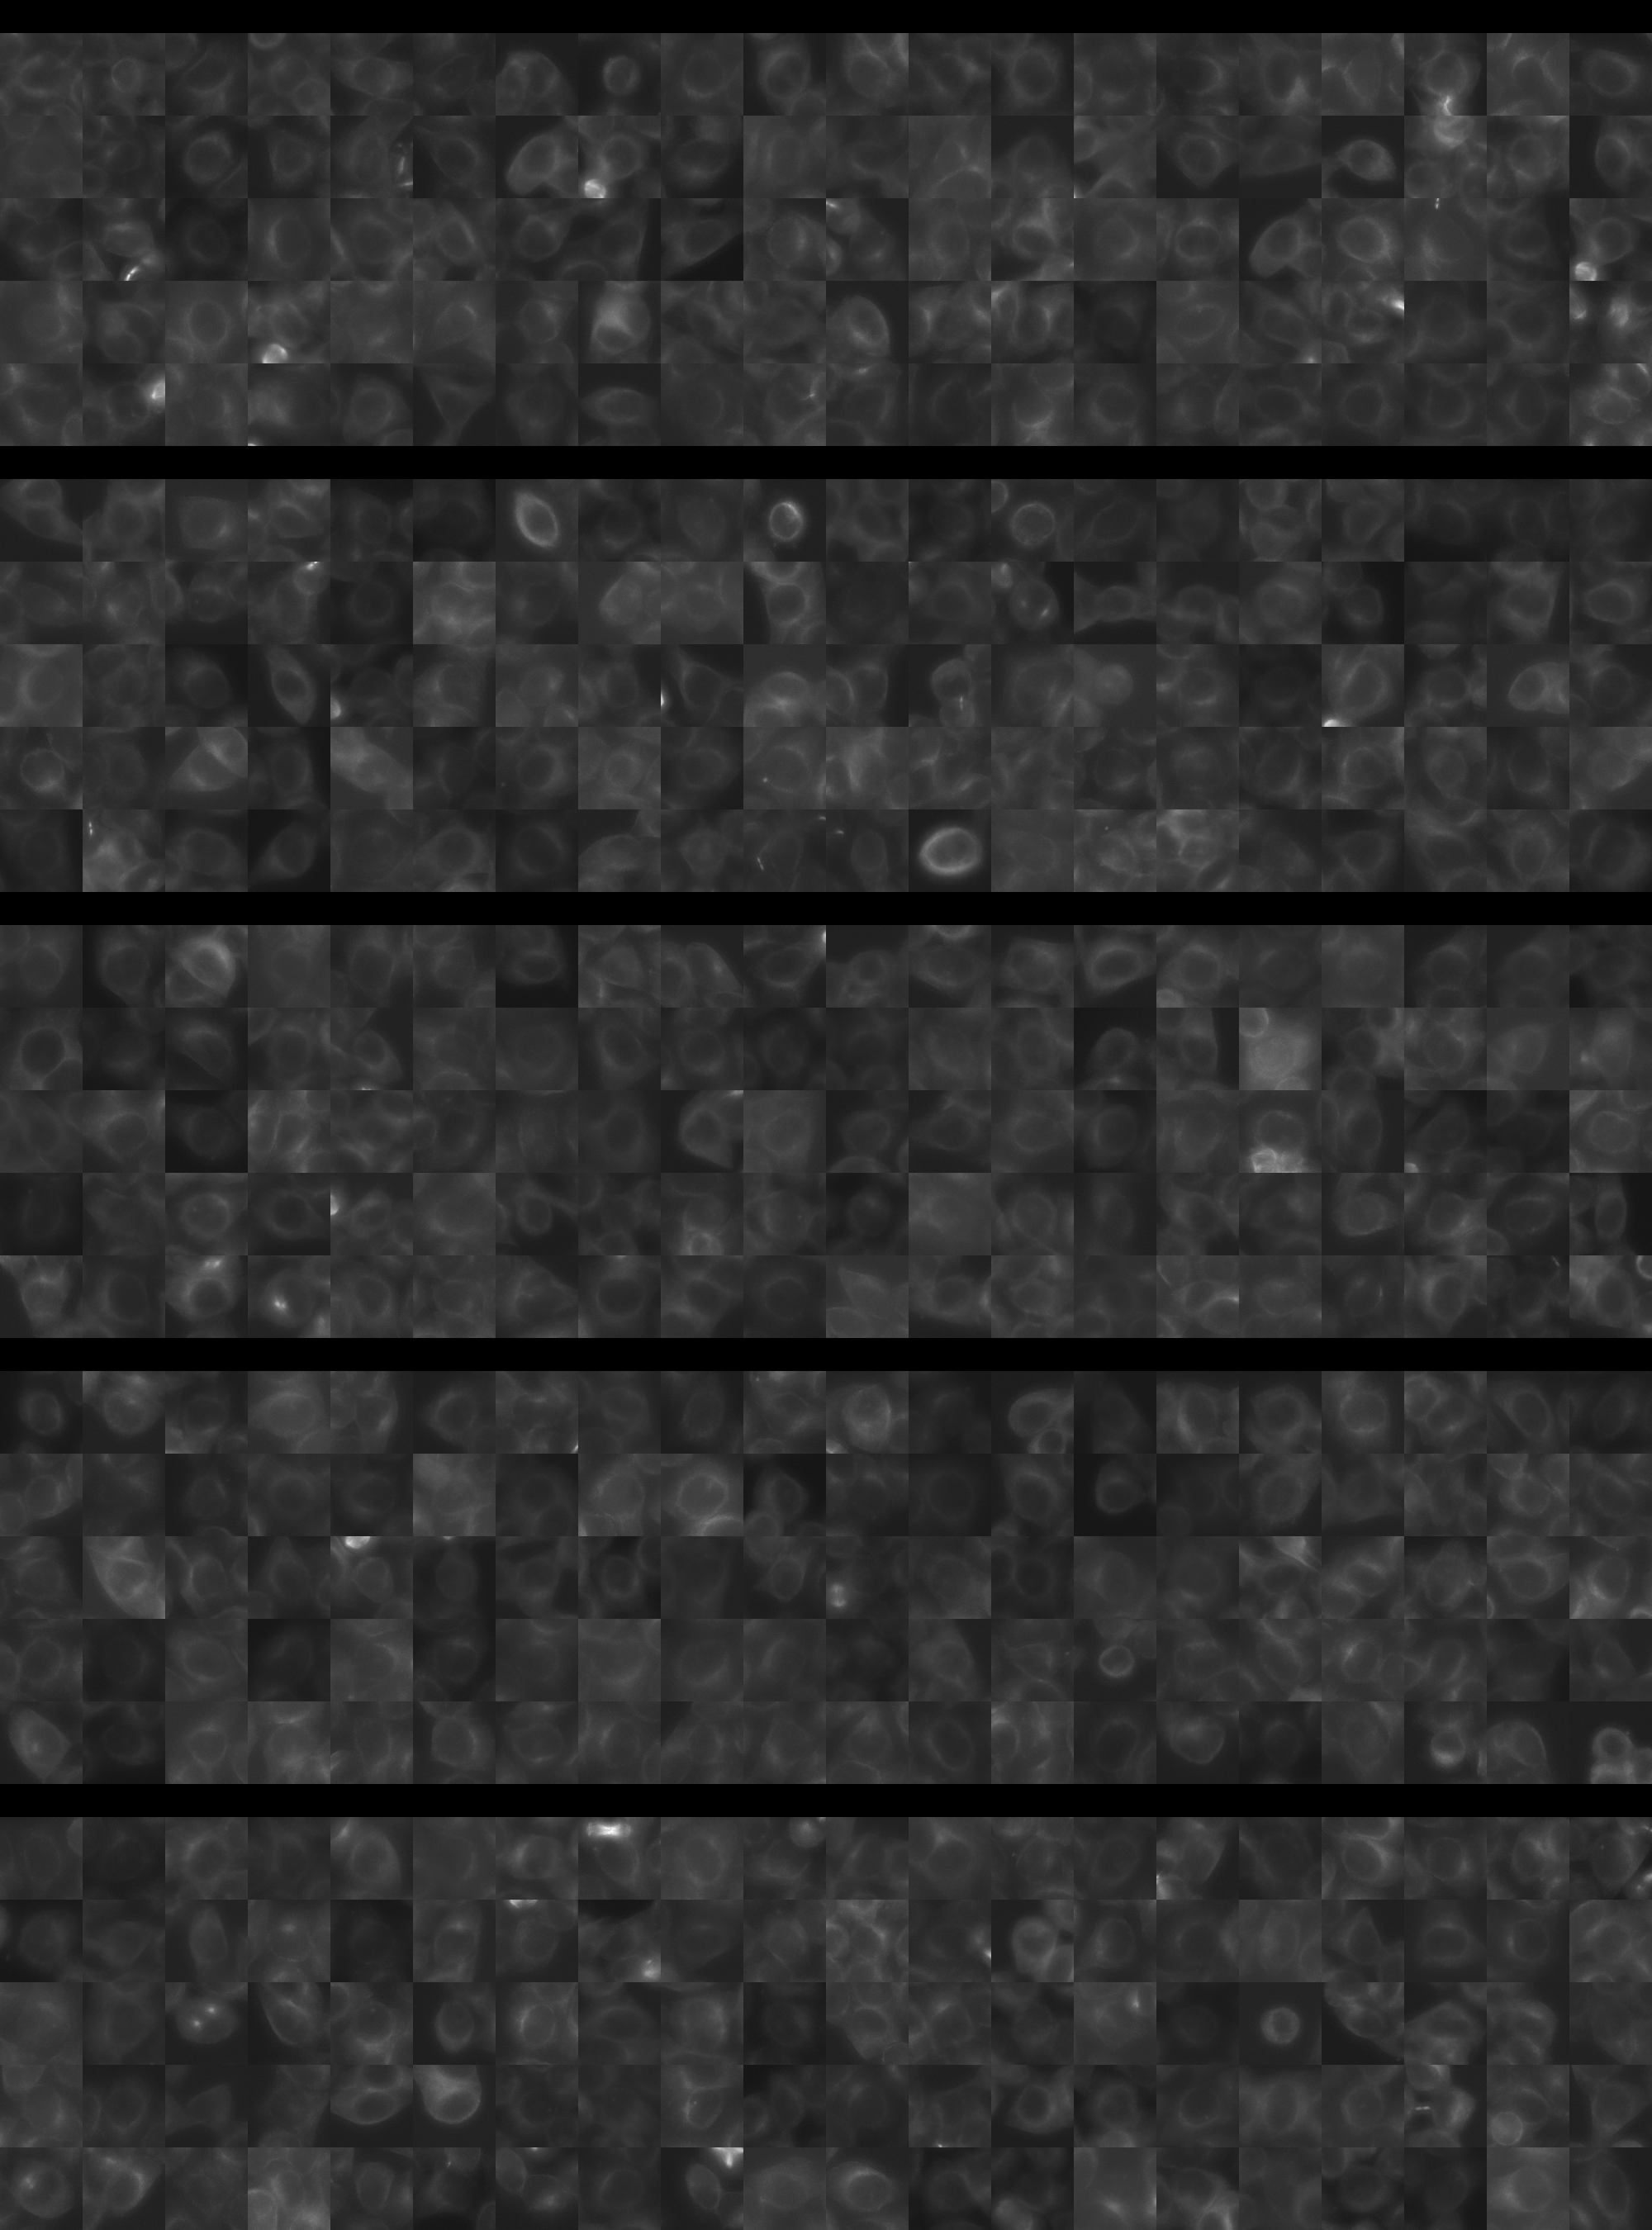
Each montage below shows randomly selected individual cell images for the same target gene separated by sgRNA, along with an example montage of cells expressing a non-targeting negative control sgRNA at the bottom. sgRNA labels in the montages correspond to the numbered sgRNA sequences in the gene info table above. The DNA (blue) and tubulin (green) channels are displayed by default, with gH2AX (grayscale) and actin (yellow) available using the check boxes. Channel brightness, contrast, and opacity are adjustable by clicking the arrow next to the channel name. When only one channel is selected, the display defaults to grayscale. Click the “Zoom” checkbox above the channel controls to enable image zooming (via scrolling) and panning (via click-and-drag).

The cell boxes displayed for this gene are square, 30.36 μm per side for the interphase montage and 30.36 μm per side for the mitotic montage.
Features

Interphase Score Rank FDR q-value
Nucleus DNA Integrated 0.094 423 of 5322 0.180
Nucleus DNA Mean 0.045 905 of 5322 0.407
Nucleus gH2AX Mean 0.101 1919 of 5322 0.042
Nucleus DNA - gH2AX Correlation -1.131e-02 1187 of 5322 0.753
Nucleus Shape Area 0.121 538 of 5322 0.045
Nucleus Shape Eccentricity -3.748e-02 4642 of 5322 0.559
Nucleus Shape Form Factor -4.449e-02 2404 of 5322 0.396
Nucleus Shape Solidity -5.751e-02 3050 of 5322 0.201
Cell DNA Mass Displacement 0.003 4185 of 5322 0.999
Cell Tubulin Mean 0.007 2505 of 5322 0.905
Cell Tubulin Mass Displacement -5.295e-02 4831 of 5322 0.426
Cell Actin Mean 0.023 2234 of 5322 0.743
Cell Tubulin - Actin Correlation 0.049 1438 of 5322 0.385
Cell DNA - Tubulin Correlation -6.648e-02 5079 of 5322 0.155
Cell Shape Area 0.120 452 of 5322 0.046
Cell Shape Eccentricity -6.097e-03 4123 of 5322 0.980
Mitotic Score Rank FDR q-value
Nucleus DNA Integrated 0.330 425 of 5322 0.806
Nucleus DNA Mean 0.234 418 of 5322 1.000
Nucleus DNA Mass Displacement 0.003 3481 of 5322 0.999
Nucleus DNA Mean Frac 3 -4.504e-02 3770 of 5322 1.000
Nucleus gH2AX Mean 0.110 1506 of 5322 1.000
Nucleus gH2AX Mean Frac 0 0.095 1014 of 5322 1.000
Nucleus Tubulin Mean Frac 0 0.257 500 of 5322 0.999
Nucleus Tubulin Mean Edge -8.965e-02 4248 of 5322 0.999
Nucleus Tubulin Std Edge 0.020 2294 of 5322 0.999
Nucleus Shape Area 0.244 1124 of 5322 0.929
Nucleus Shape Eccentricity -9.400e-02 3493 of 5322 1.000
Nucleus Shape Form Factor -1.555e-01 3640 of 5322 0.998
Cell Tubulin Mean -8.975e-02 4495 of 5322 0.997
Cell Tubulin Mean Frac 3 -3.177e-01 4795 of 5322 0.999
Cell Actin Mean 0.007 3103 of 5322 1.000
Cell Shape Area 0.229 1131 of 5322 0.998
( Reset Zoom )
Brightness
Contrast
Opacity
Brightness
Contrast
Opacity
Brightness
Contrast
Opacity
Brightness
Contrast
Opacity
Brightness
Contrast
Opacity

( Reset Zoom )
Brightness
Contrast
Opacity
Brightness
Contrast
Opacity
Brightness
Contrast
Opacity
Brightness
Contrast
Opacity
Brightness
Contrast
Opacity

MIT Central Accessability