AAAS

Gene symbol: AAAS
Gene: 8086
Uniprot Function: Plays a role in the normal development of the peripheral and central nervous system (PubMed:11062474, PubMed:11159947, PubMed:16022285). Required for the correct localization of aurora kinase AURKA and the microtubule minus end-binding protein NUMA1 as well as a subset of AURKA targets which ensures proper spindle formation and timely chromosome alignment (PubMed:26246606).
Mitotic Index 0.0247
Interphase Cluster: #2 (51 genes)
Mitotic Cluster: #170 (16 genes)
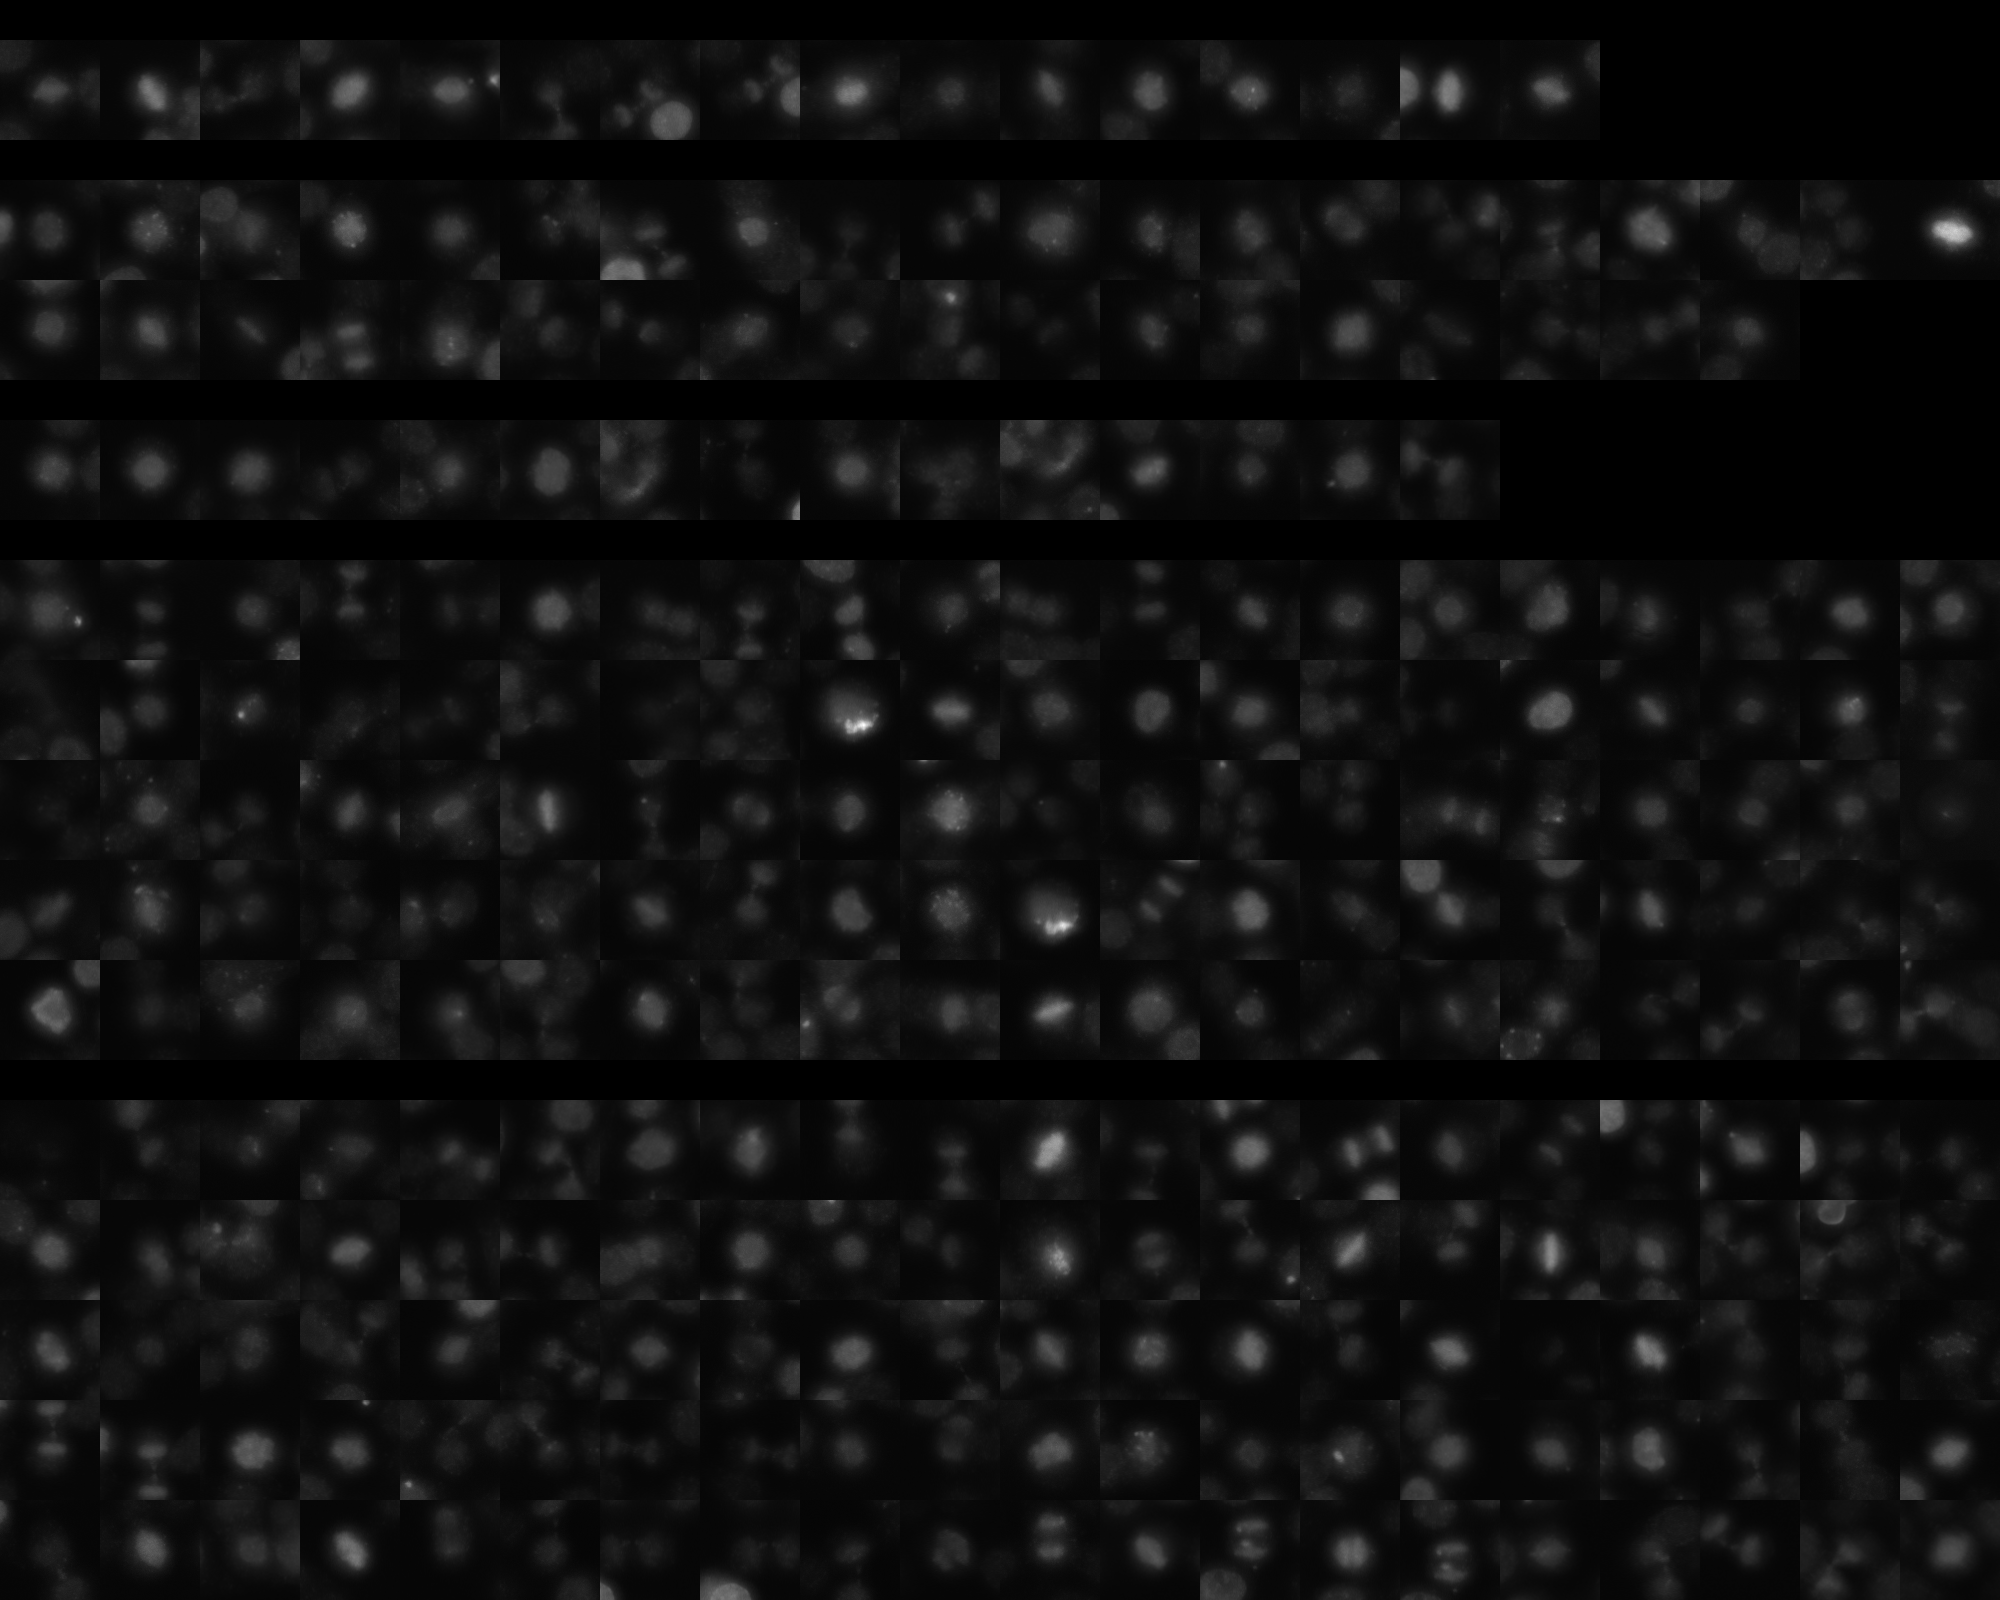
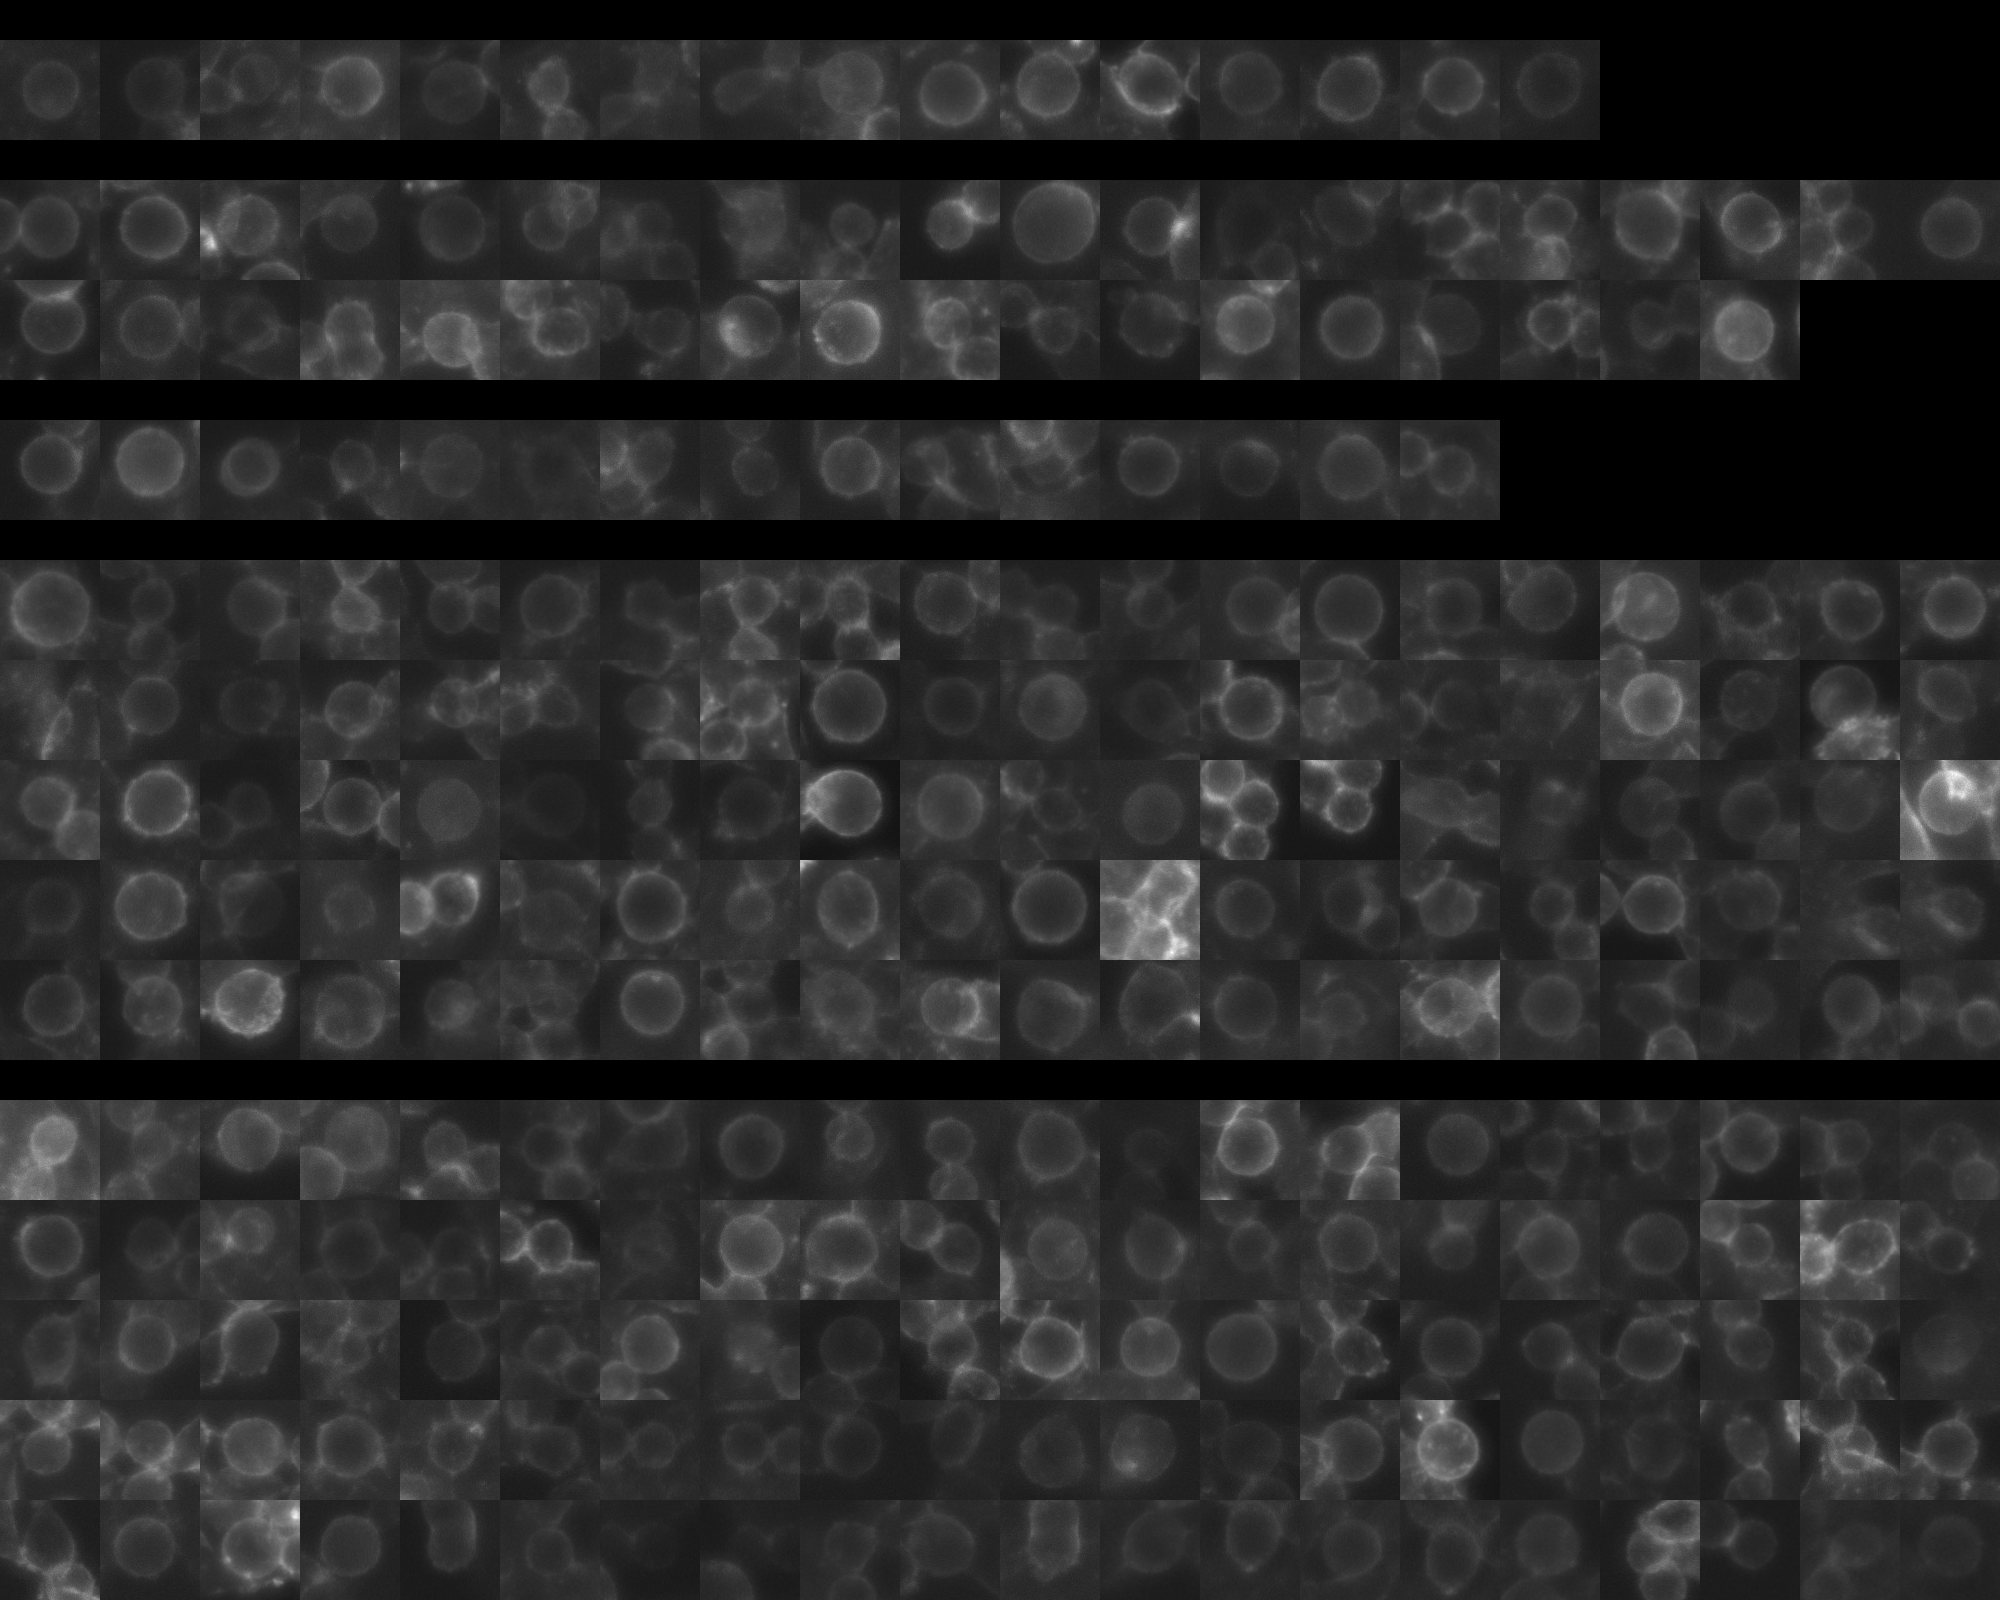
sgRNA 1: ATATGAGCACAATAACGAGC (interphase cells: 671, mitotic cells: 16)
sgRNA 2: CCACACCAACAAGTTTGCAG (interphase cells: 1394, mitotic cells: 38)
sgRNA 3: CCCAGGGTGAGACAGCACTT (interphase cells: 920, mitotic cells: 15)
sgRNA 4: TGGGCATTGACAAAGTACAG (interphase cells: 4864, mitotic cells: 130)

Interphase Cluster

Mitotic Cluster

Overview

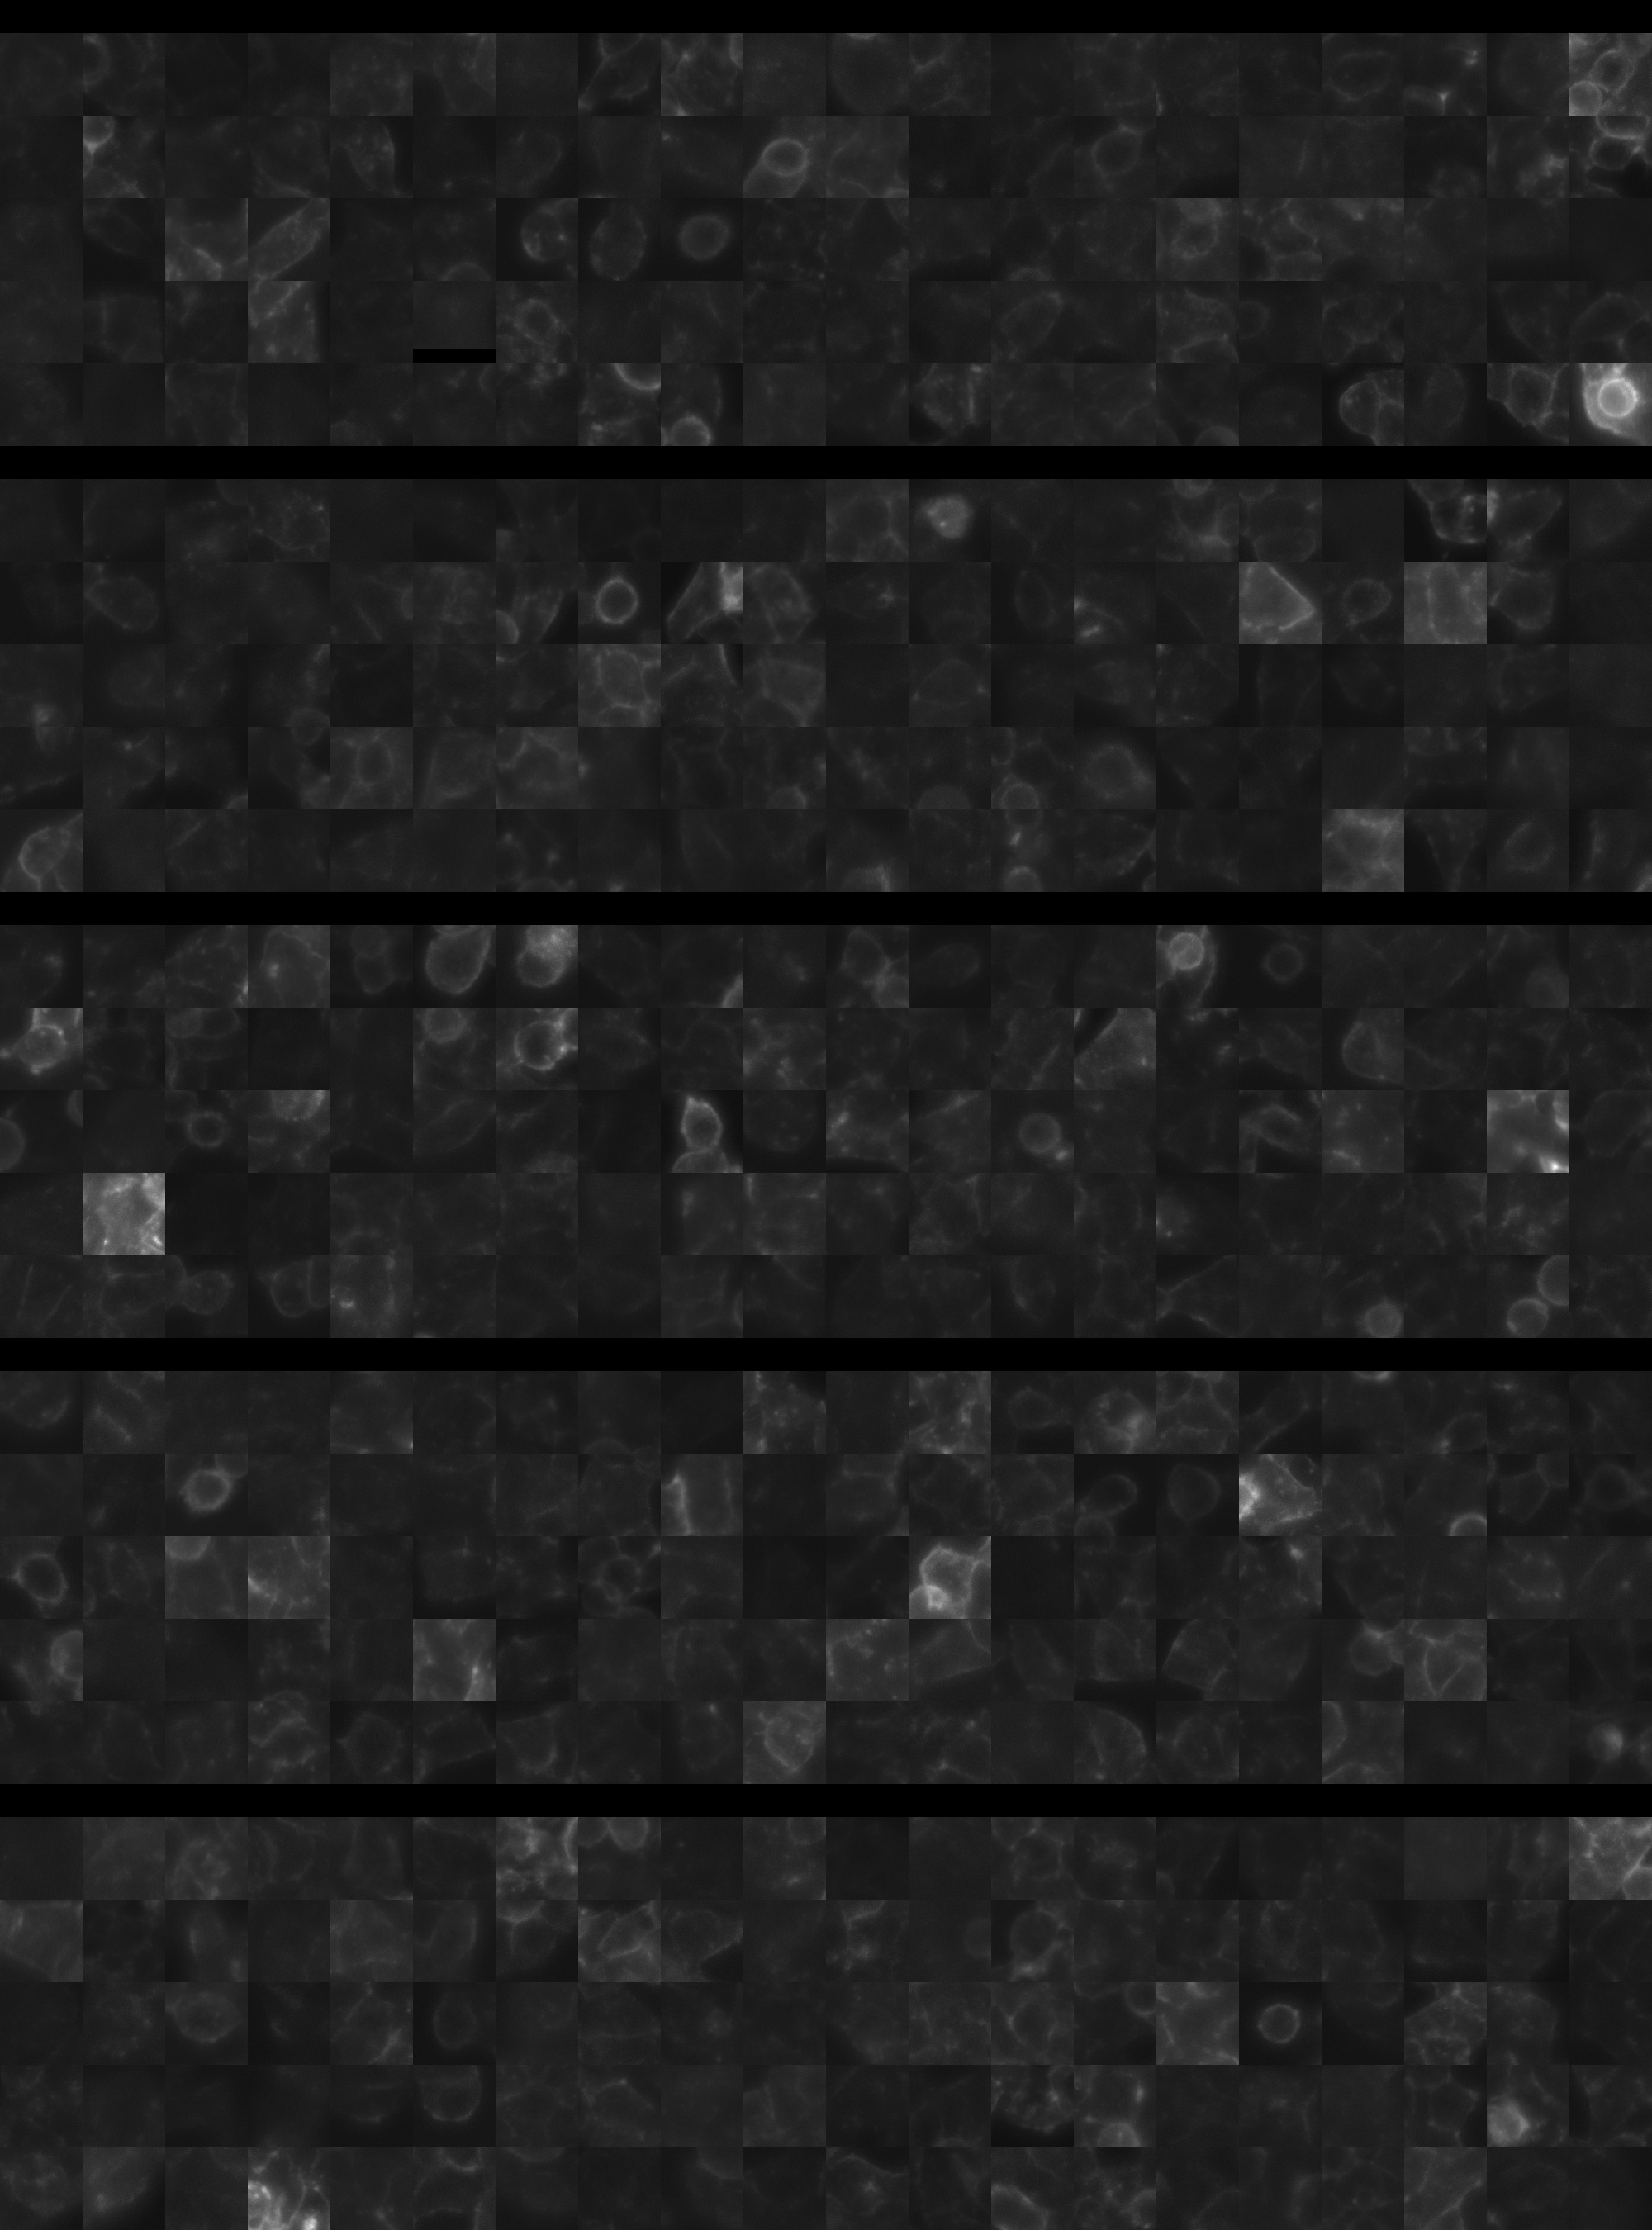
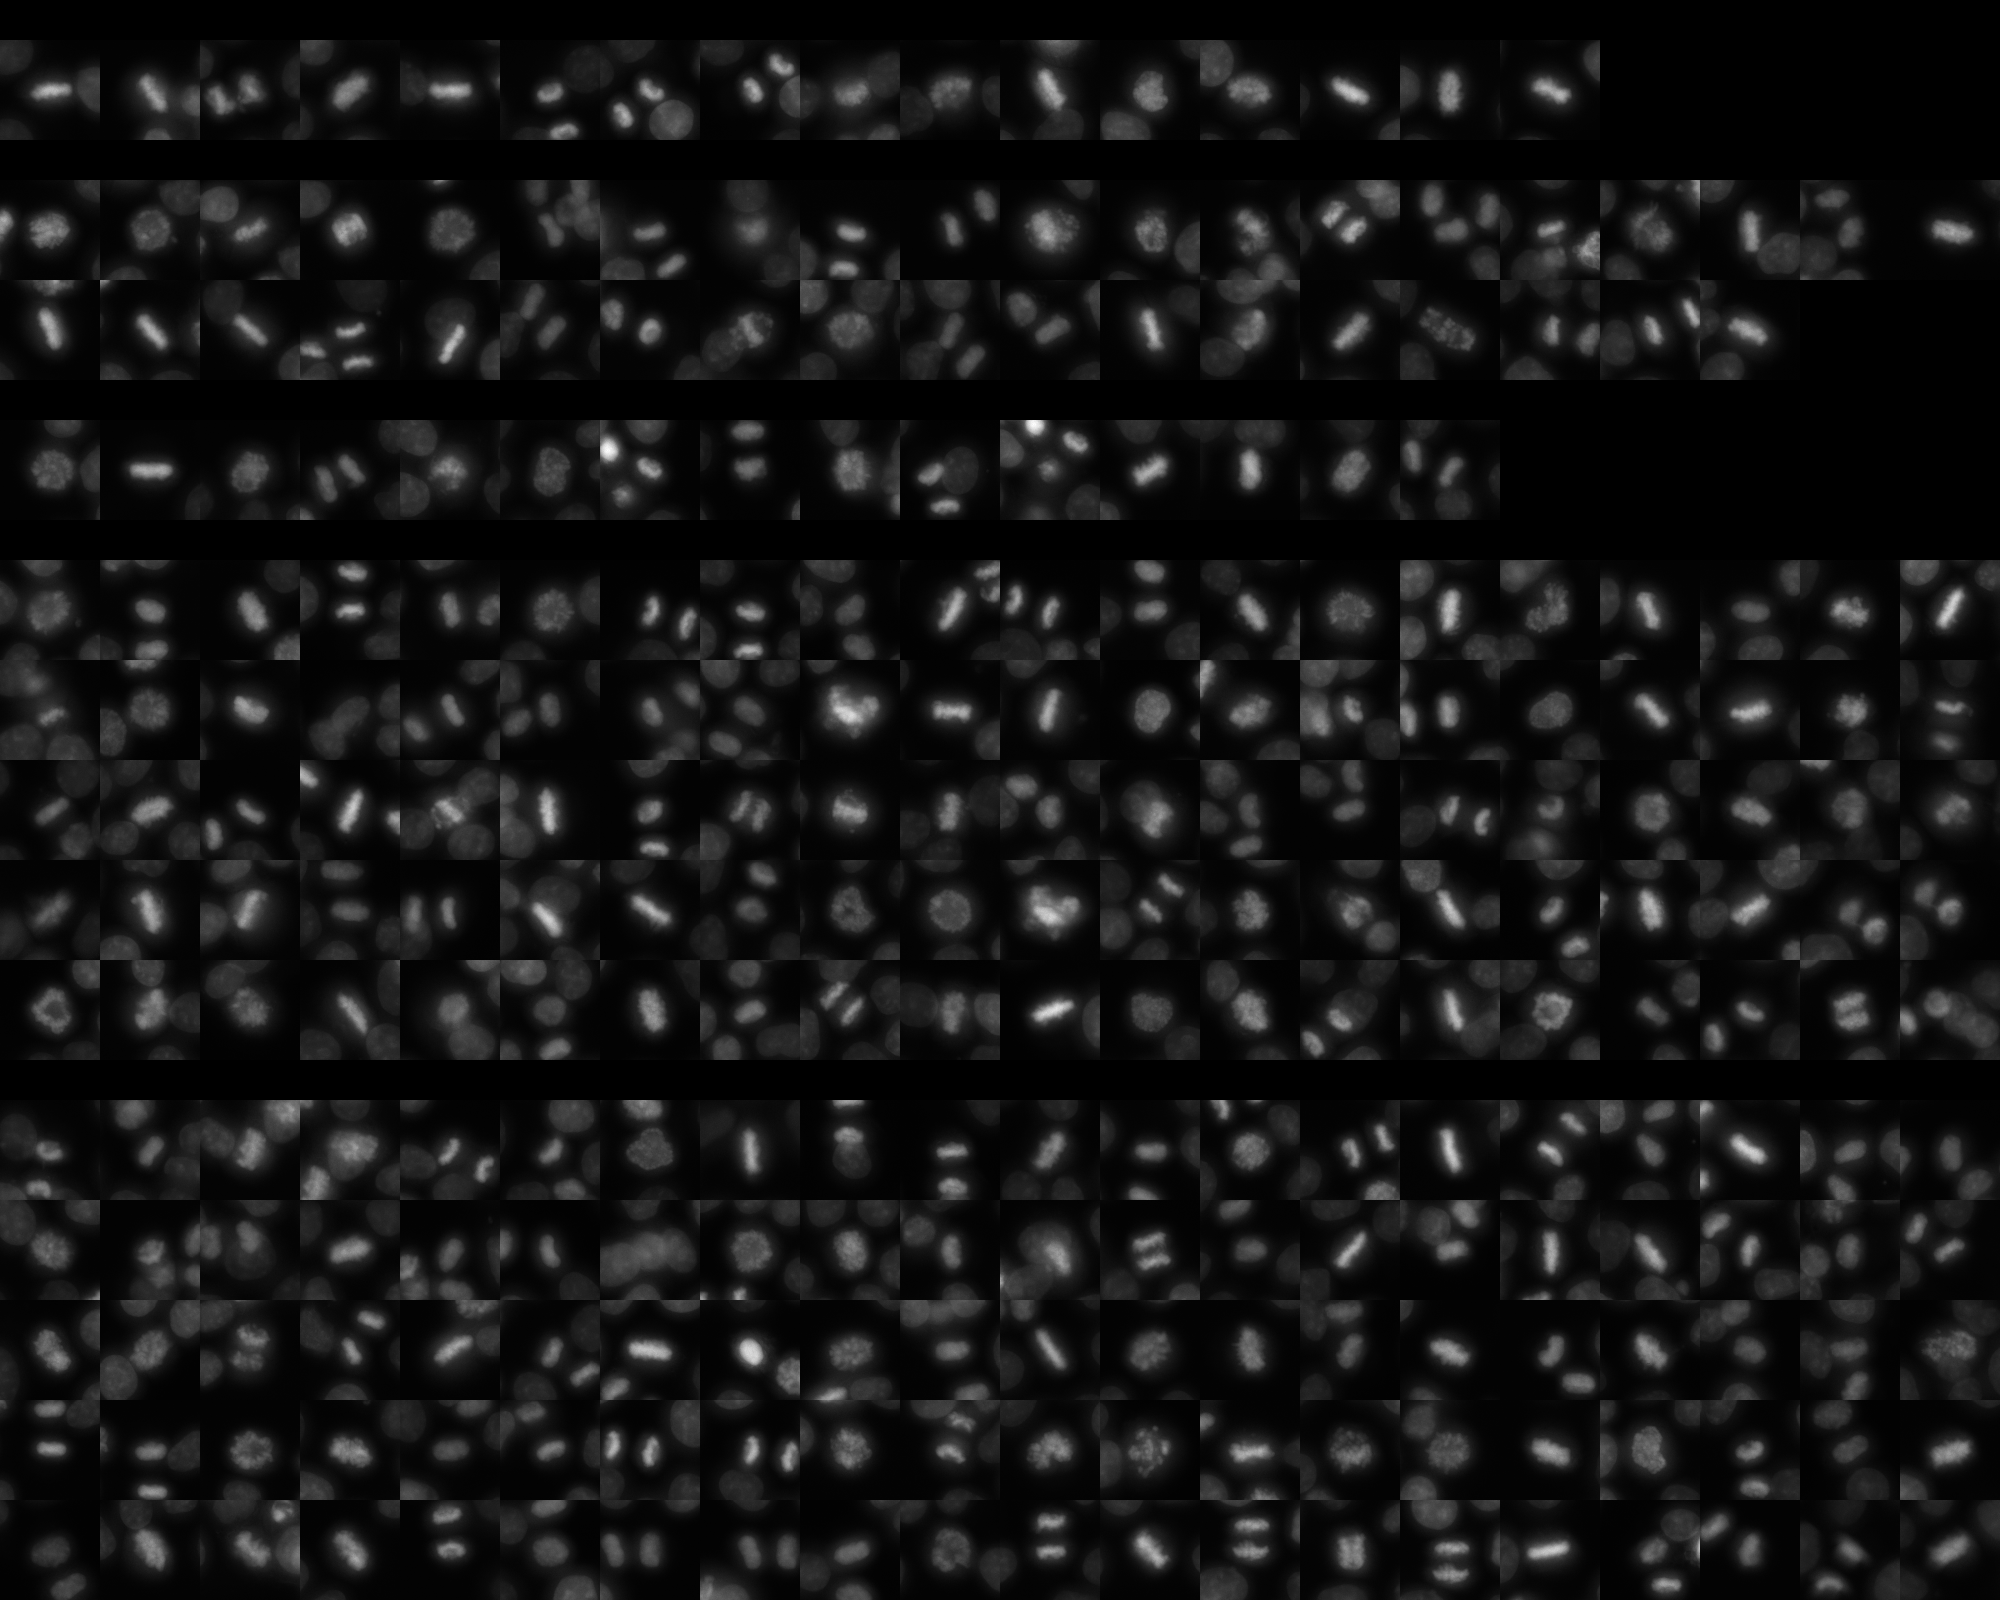
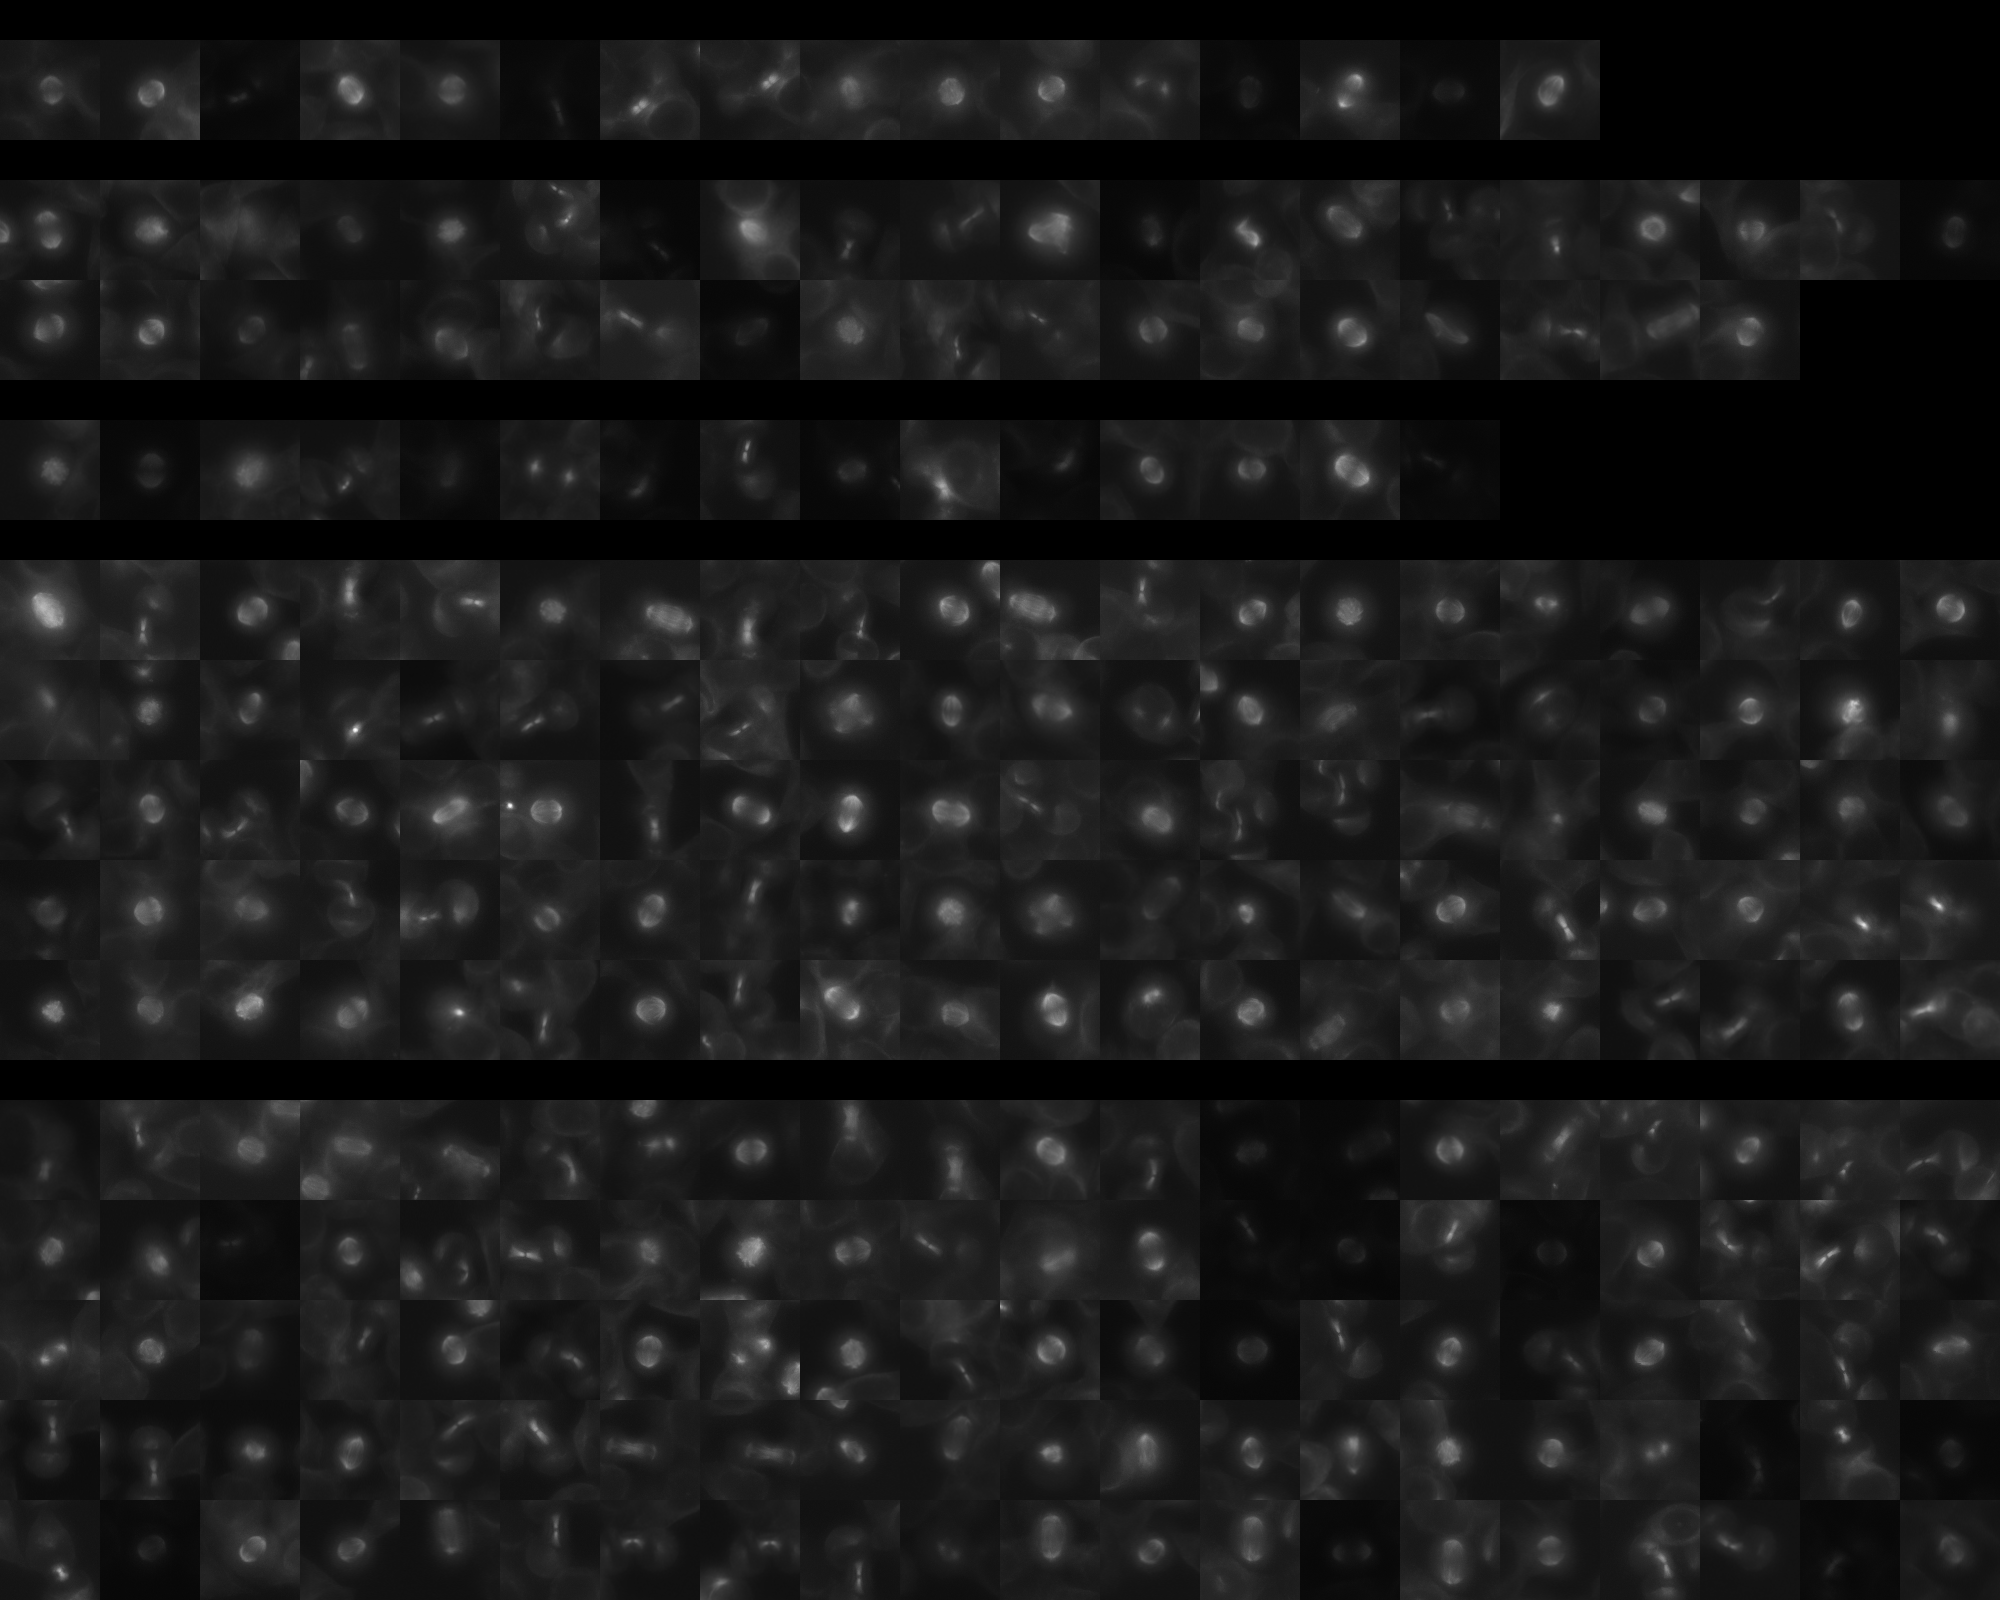
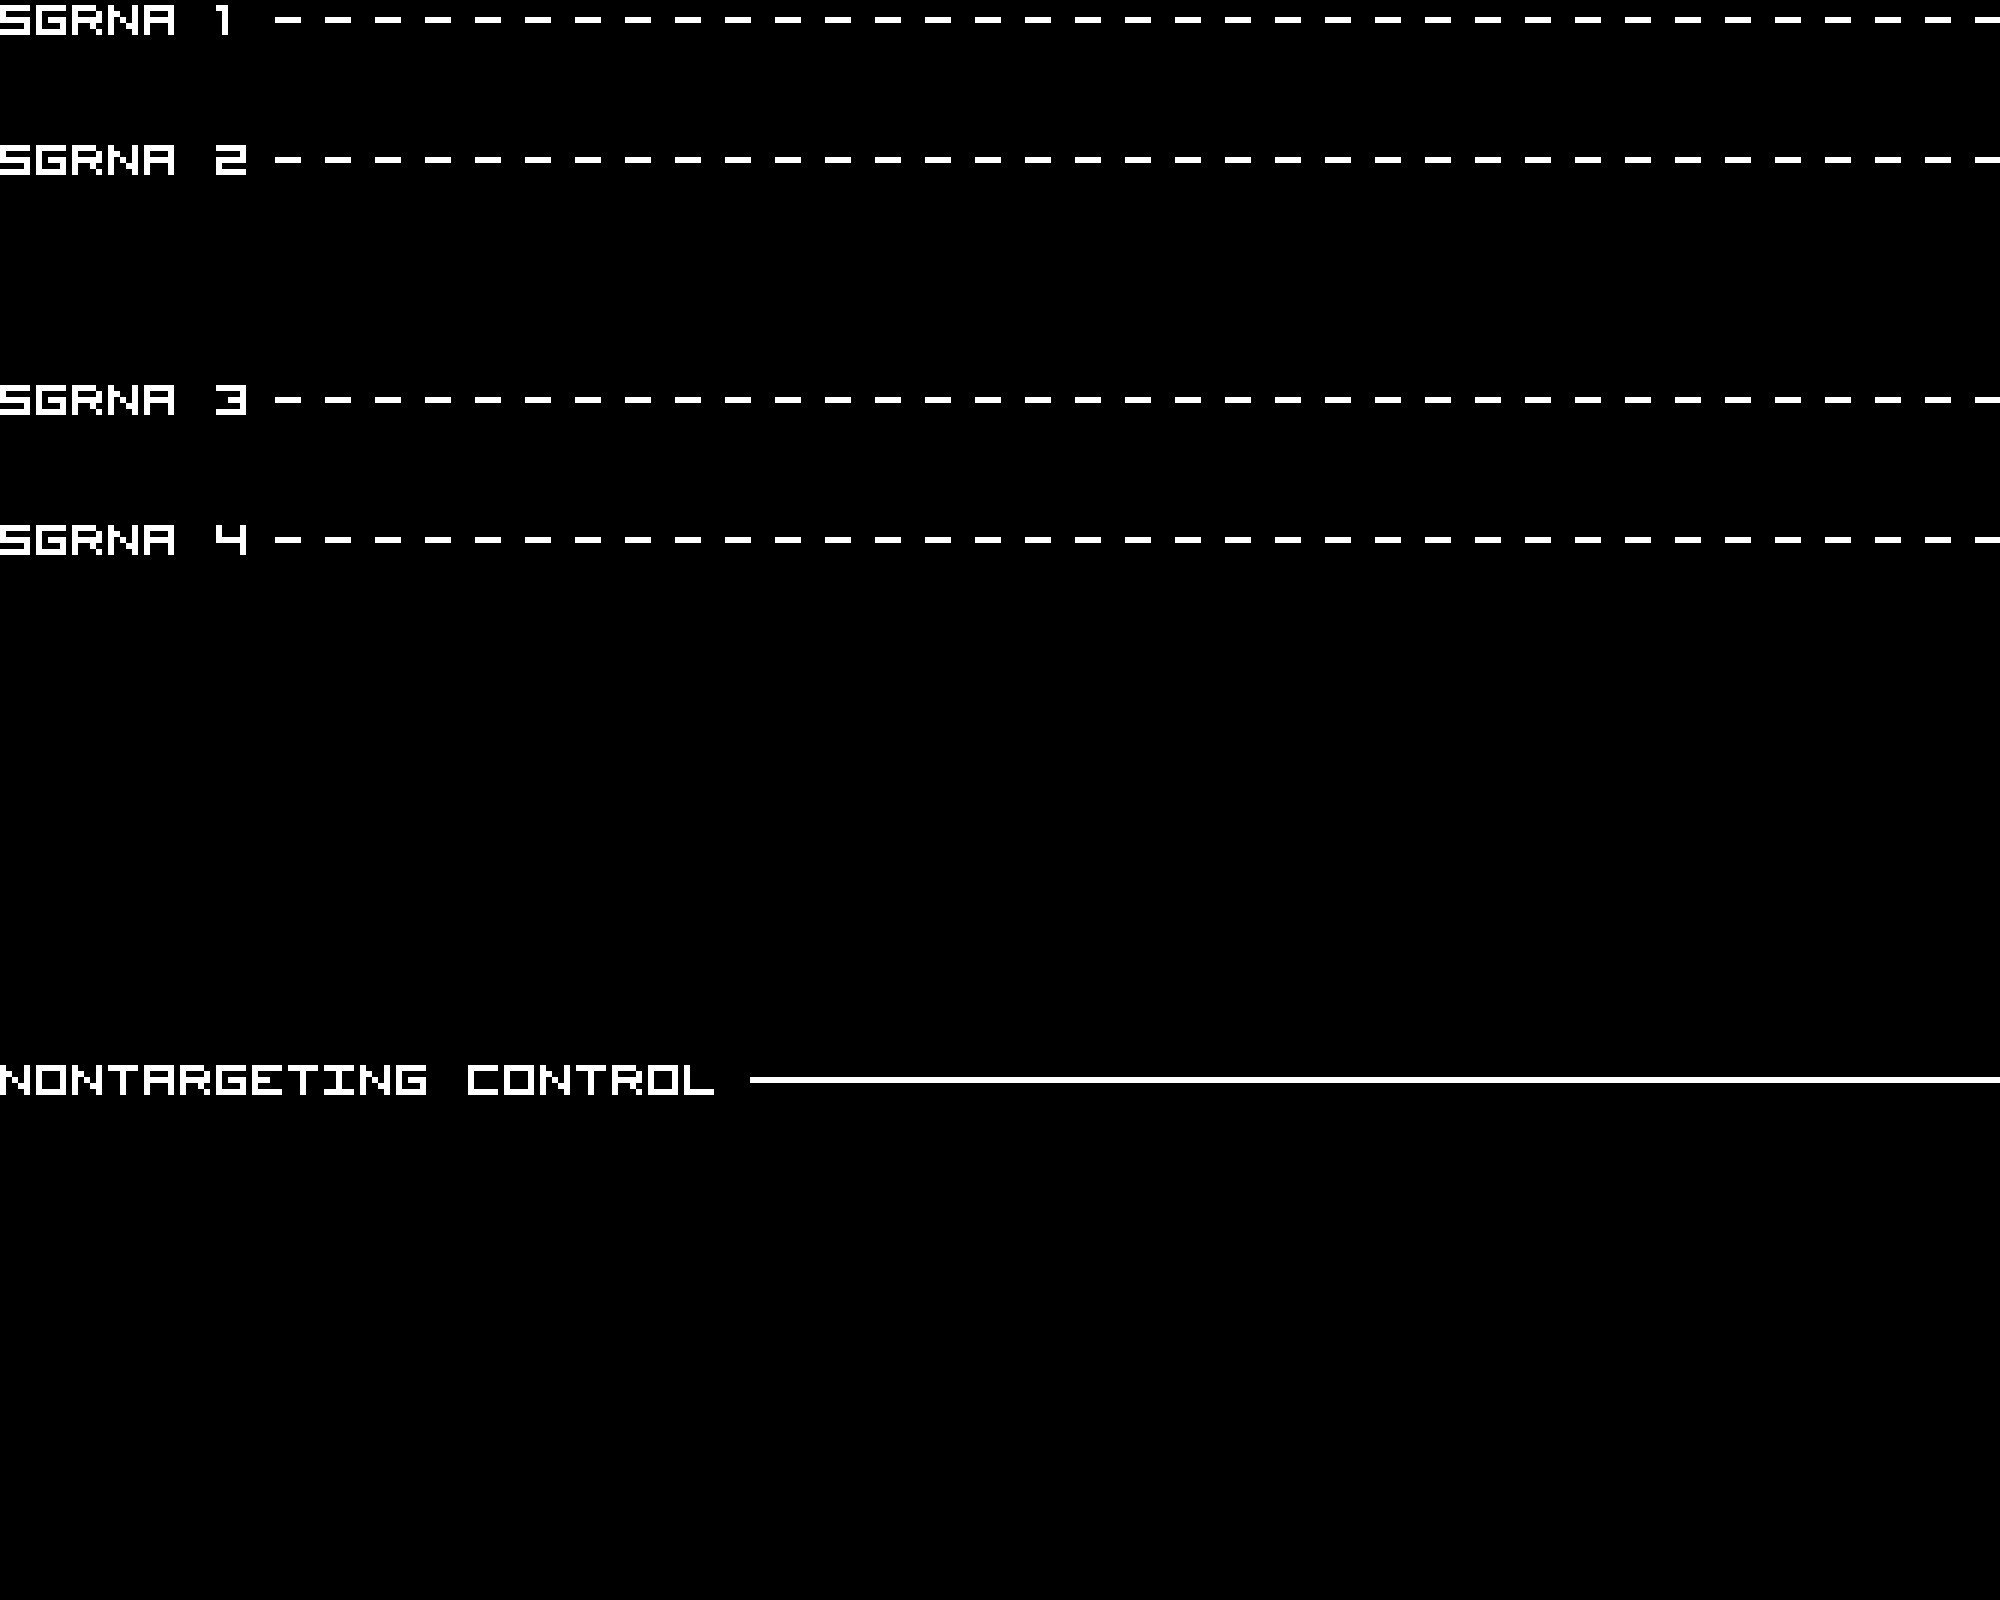
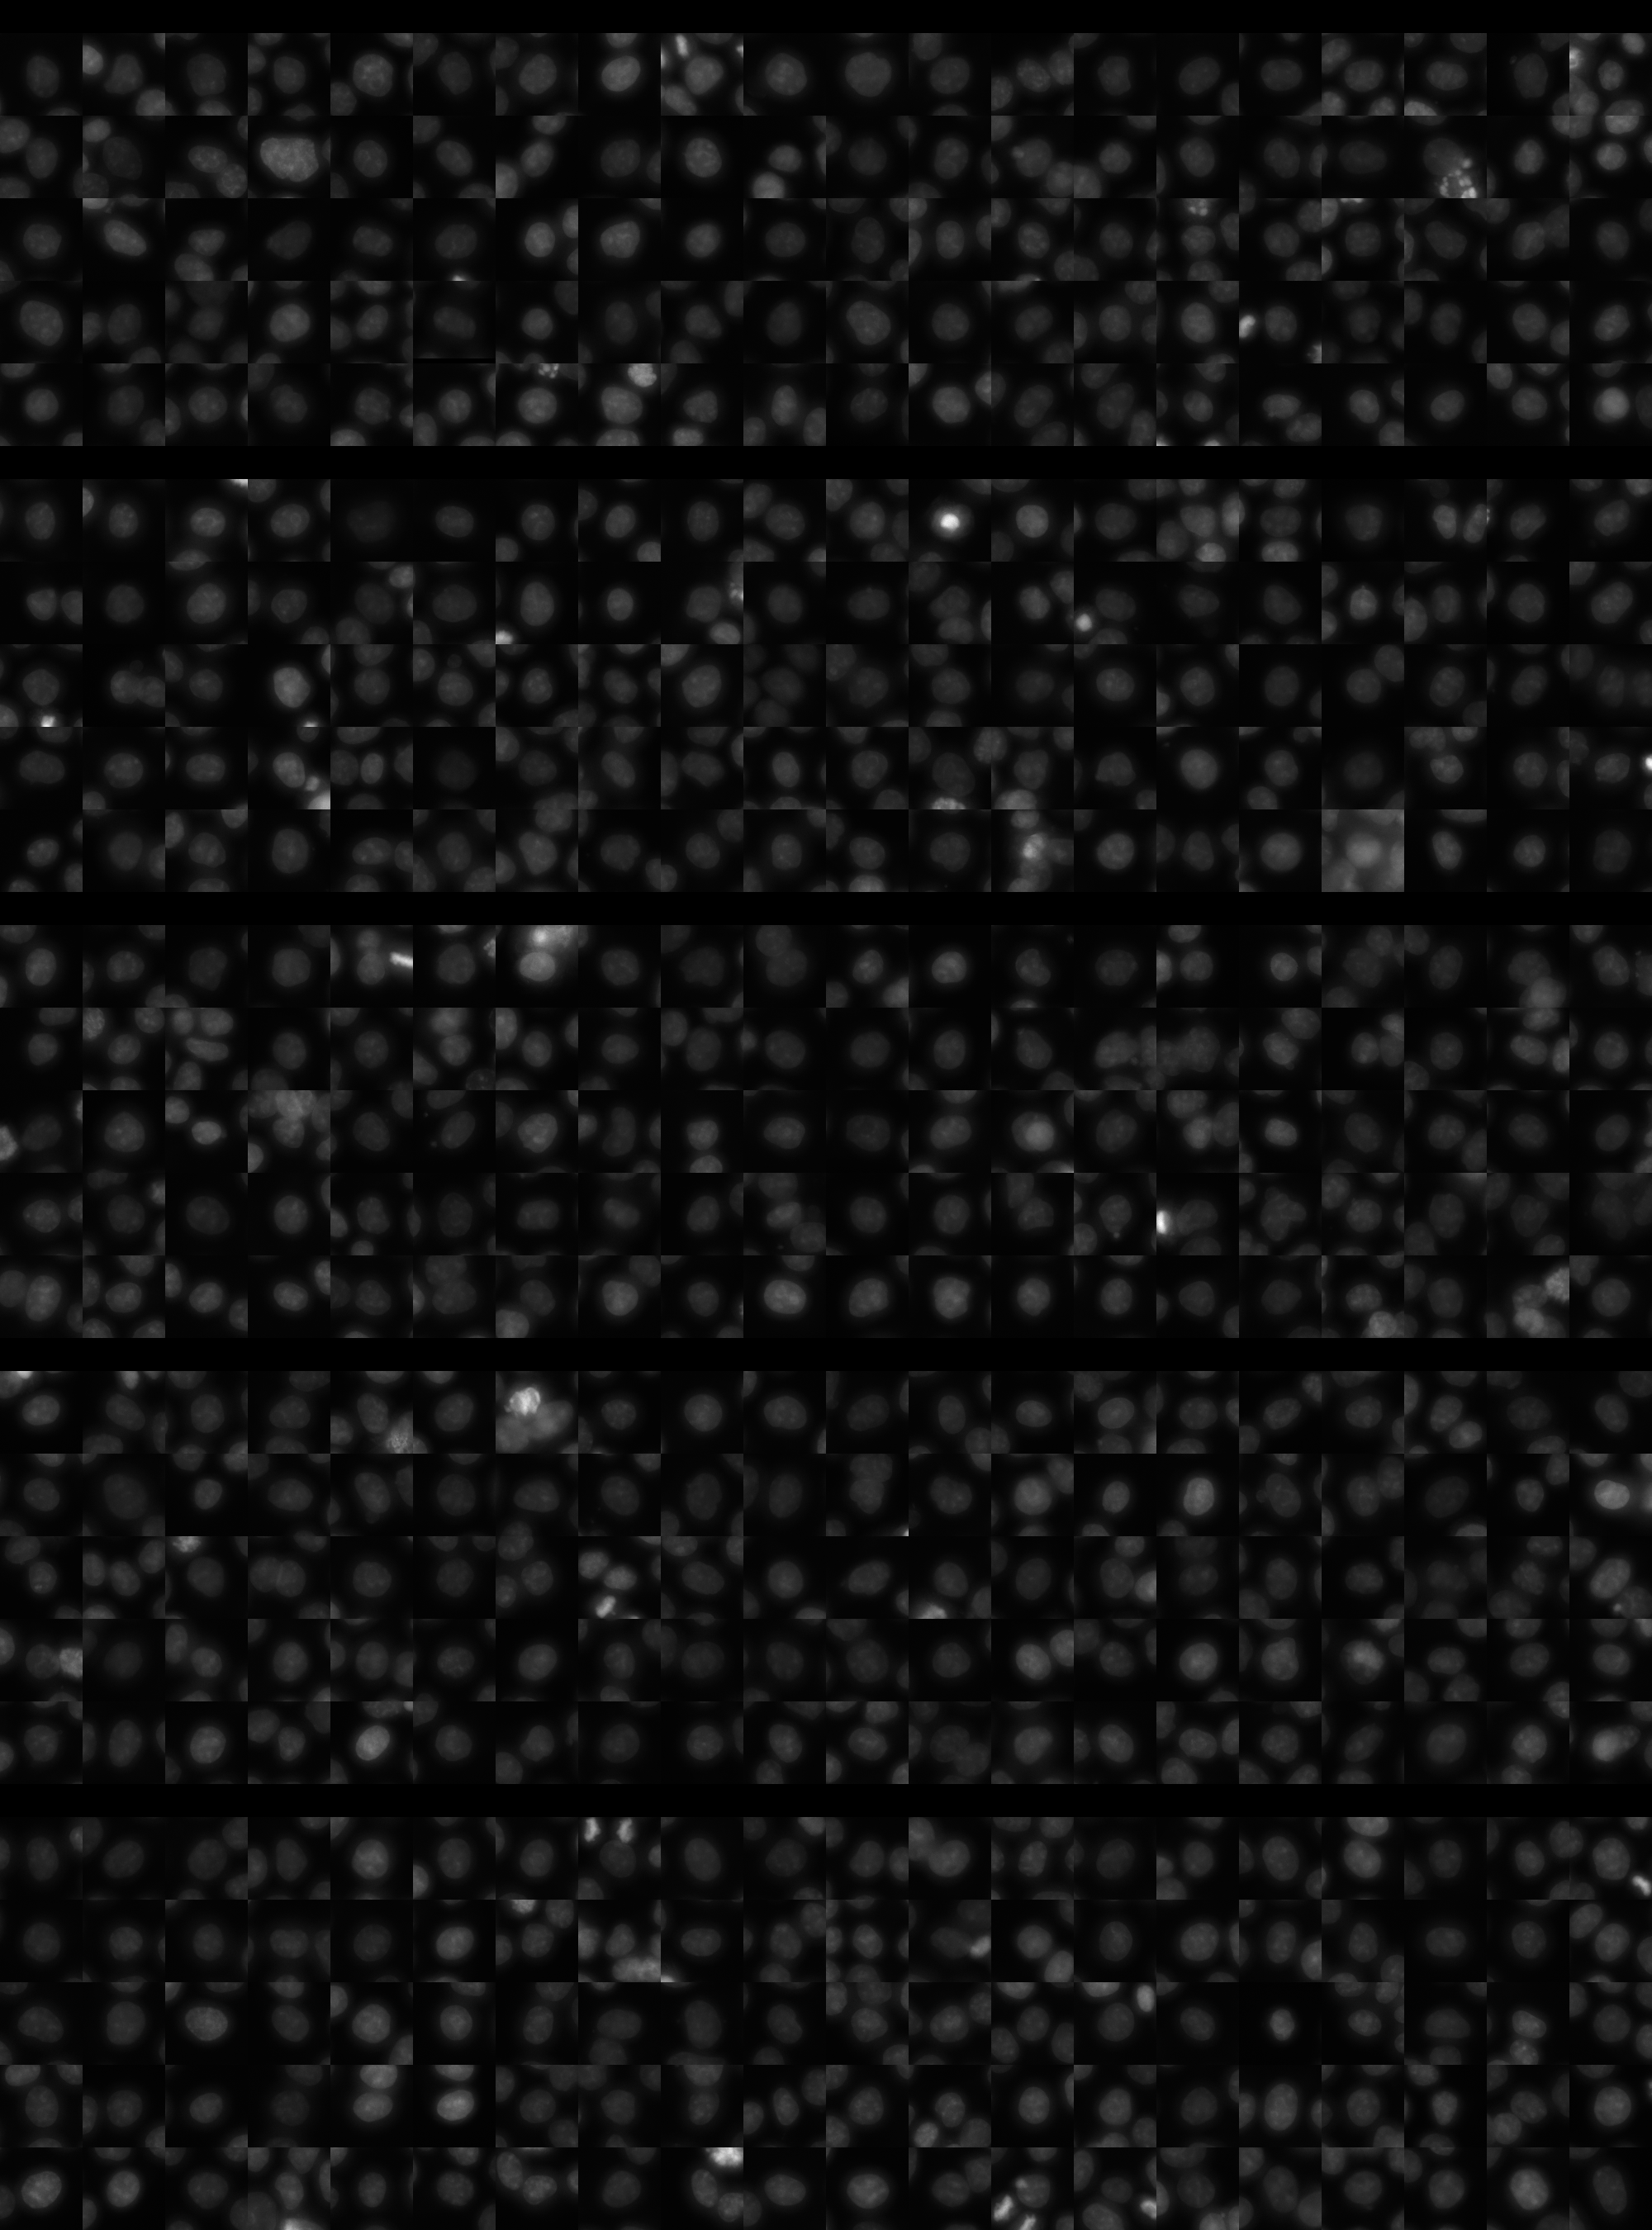
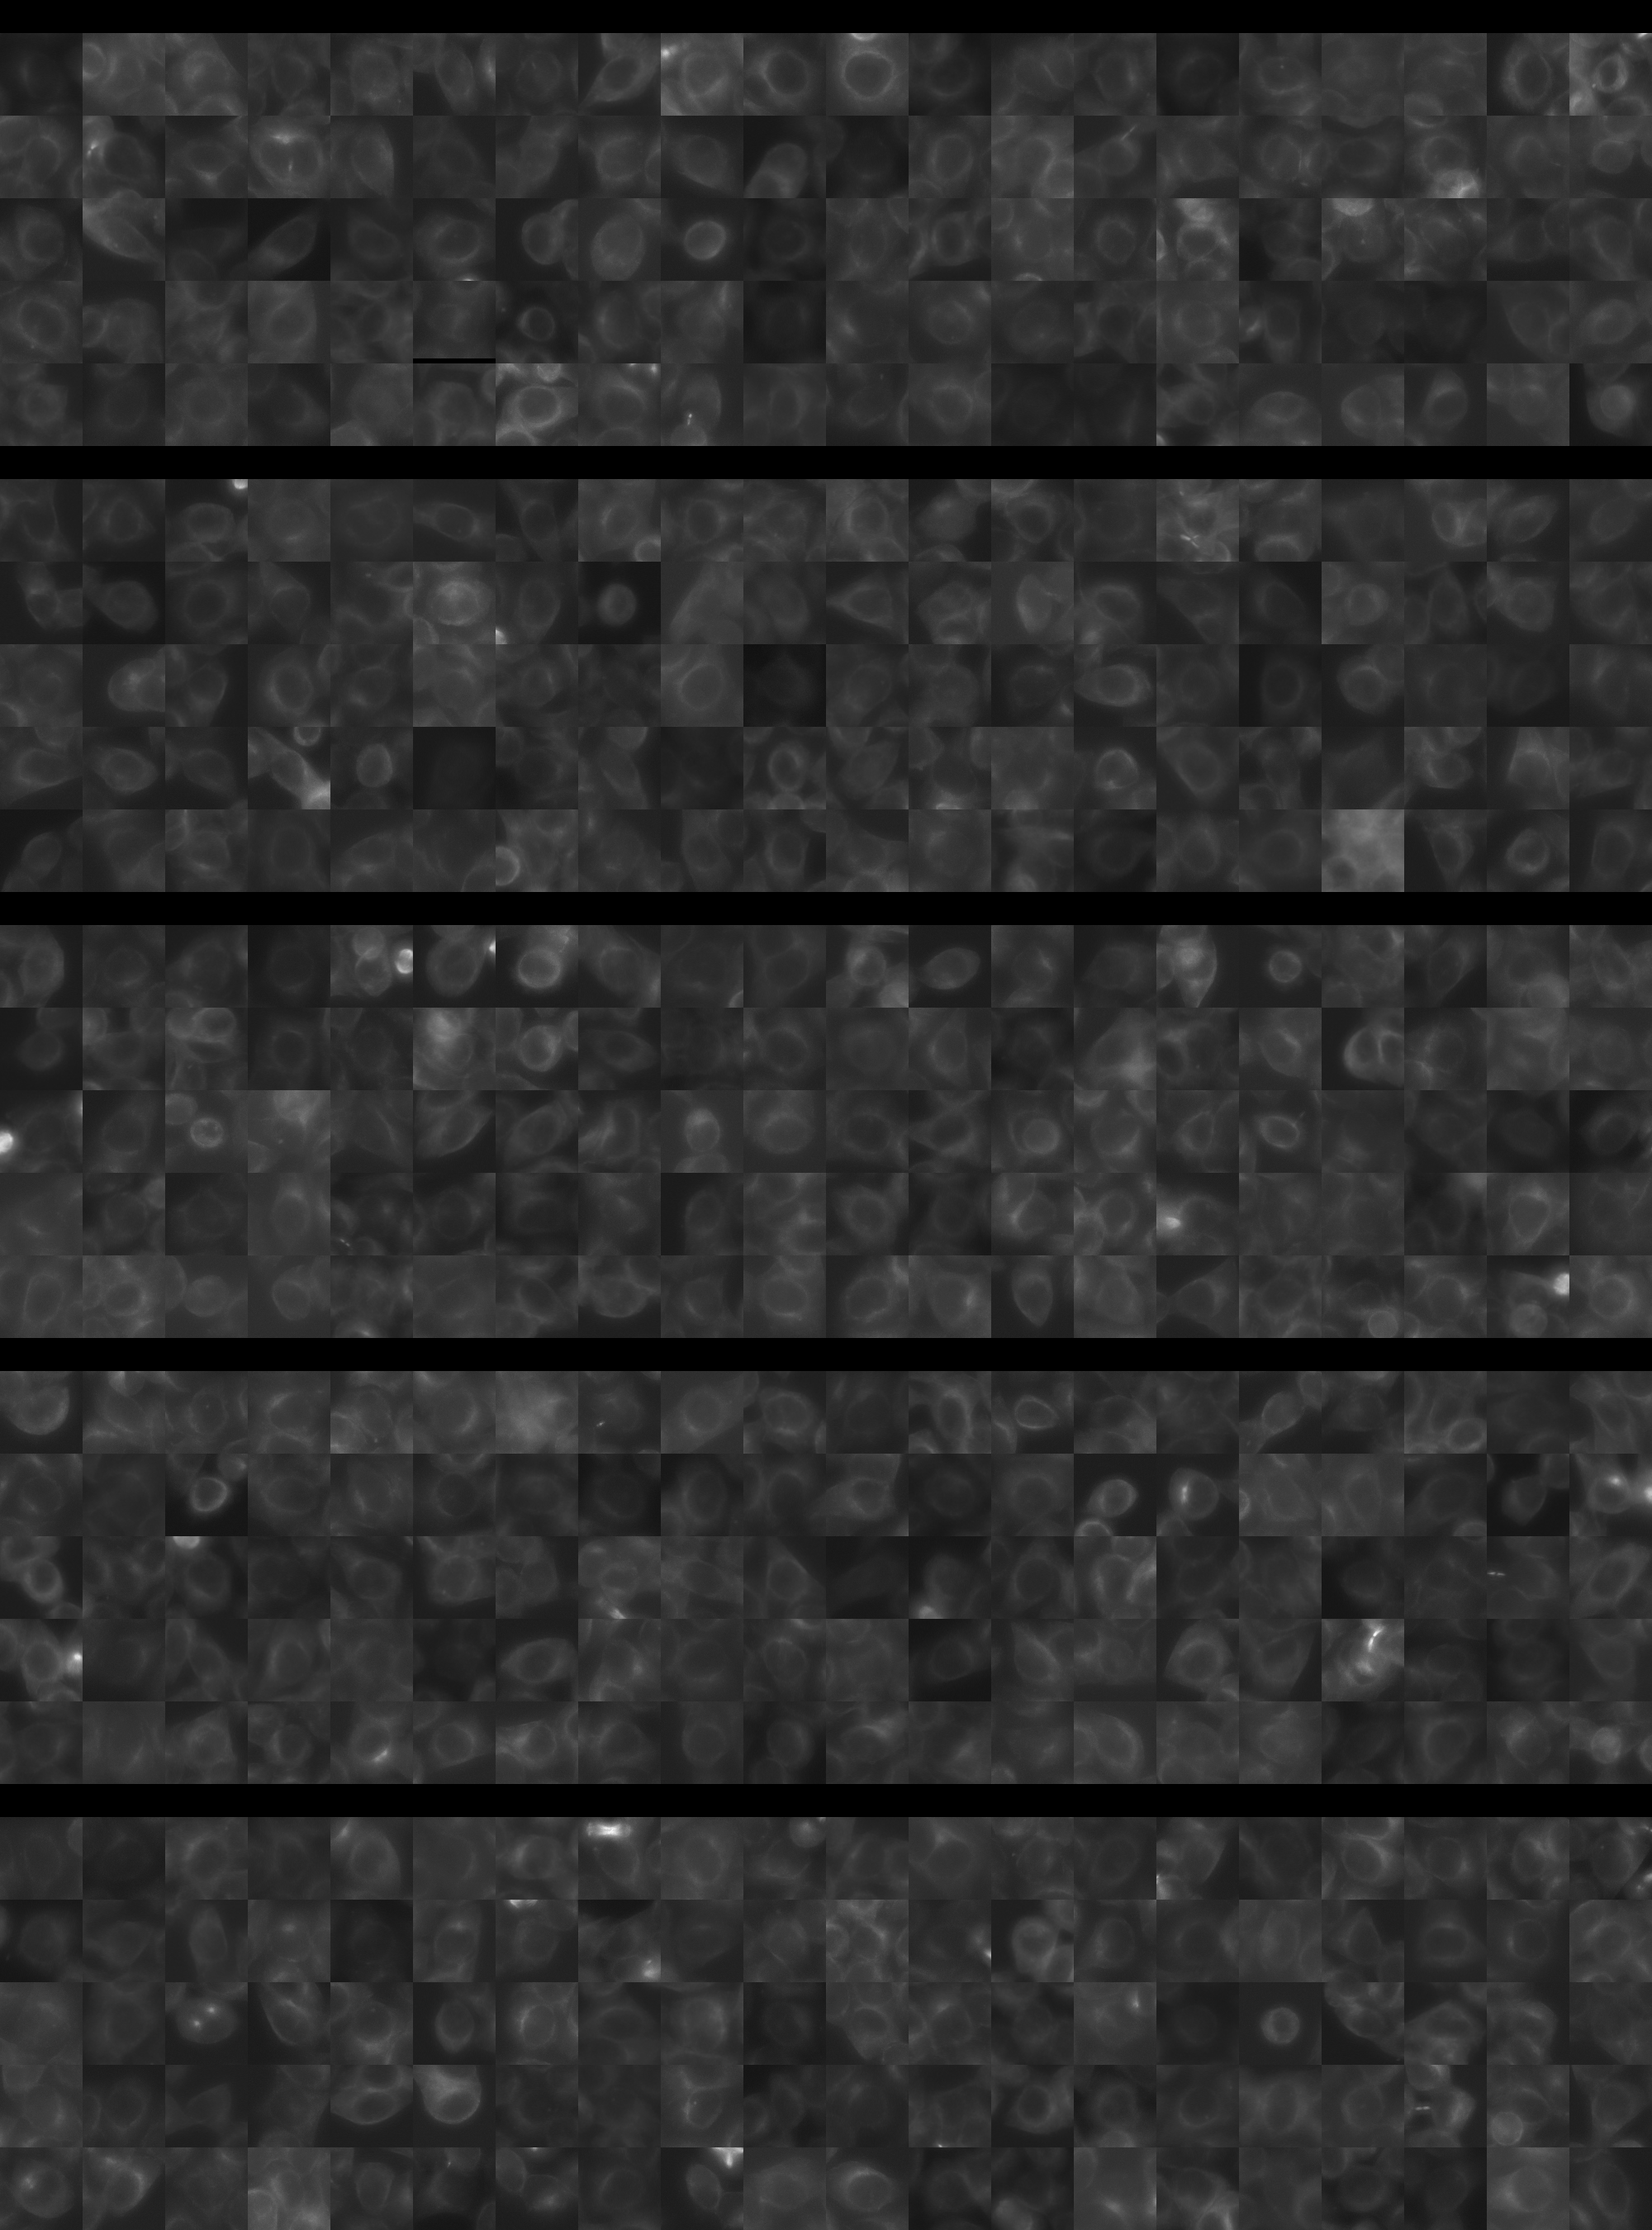
Each montage below shows randomly selected individual cell images for the same target gene separated by sgRNA, along with an example montage of cells expressing a non-targeting negative control sgRNA at the bottom. sgRNA labels in the montages correspond to the numbered sgRNA sequences in the gene info table above. The DNA (blue) and tubulin (green) channels are displayed by default, with gH2AX (grayscale) and actin (yellow) available using the check boxes. Channel brightness, contrast, and opacity are adjustable by clicking the arrow next to the channel name. When only one channel is selected, the display defaults to grayscale. Click the “Zoom” checkbox above the channel controls to enable image zooming (via scrolling) and panning (via click-and-drag).

The cell boxes displayed for this gene are square, 30.36 μm per side for the interphase montage and 30.36 μm per side for the mitotic montage.
Features

Interphase Score Rank FDR q-value
Nucleus DNA Integrated 0.015 2395 of 5322 0.888
Nucleus DNA Mean -1.165e-01 4754 of 5322 0.004
Nucleus gH2AX Mean 0.050 3508 of 5322 0.209
Nucleus DNA - gH2AX Correlation -1.496e-01 4759 of 5322 1.021e-04
Nucleus Shape Area 0.083 940 of 5322 0.120
Nucleus Shape Eccentricity 0.055 810 of 5322 0.153
Nucleus Shape Form Factor -1.439e-01 4934 of 5322 5.247e-04
Nucleus Shape Solidity -1.751e-01 5013 of 5322 1.903e-04
Cell DNA Mass Displacement 0.115 156 of 5322 0.007
Cell Tubulin Mean 0.015 2153 of 5322 0.753
Cell Tubulin Mass Displacement 0.030 1299 of 5322 0.599
Cell Actin Mean 0.130 589 of 5322 0.002
Cell Tubulin - Actin Correlation 0.032 2094 of 5322 0.484
Cell DNA - Tubulin Correlation 0.170 424 of 5322 1.948e-04
Cell Shape Area 0.061 1214 of 5322 0.340
Cell Shape Eccentricity 0.101 45 of 5322 0.033
Mitotic Score Rank FDR q-value
Nucleus DNA Integrated 0.064 3024 of 5322 0.984
Nucleus DNA Mean -1.635e-01 4789 of 5322 1.000
Nucleus DNA Mass Displacement 0.144 1315 of 5322 0.999
Nucleus DNA Mean Frac 3 0.246 369 of 5322 1.000
Nucleus gH2AX Mean -4.215e-03 3007 of 5322 1.000
Nucleus gH2AX Mean Frac 0 -2.421e-01 5003 of 5322 1.000
Nucleus Tubulin Mean Frac 0 -8.074e-02 4522 of 5322 0.999
Nucleus Tubulin Mean Edge 0.349 189 of 5322 0.747
Nucleus Tubulin Std Edge 0.249 275 of 5322 0.999
Nucleus Shape Area 0.228 1238 of 5322 0.864
Nucleus Shape Eccentricity 0.080 1064 of 5322 1.000
Nucleus Shape Form Factor -1.204e-01 3139 of 5322 0.998
Cell Tubulin Mean 0.119 1811 of 5322 0.997
Cell Tubulin Mean Frac 3 0.020 1452 of 5322 0.999
Cell Actin Mean 0.095 1970 of 5322 0.997
Cell Shape Area 0.251 960 of 5322 0.986
( Reset Zoom )
Brightness
Contrast
Opacity
Brightness
Contrast
Opacity
Brightness
Contrast
Opacity
Brightness
Contrast
Opacity
Brightness
Contrast
Opacity

( Reset Zoom )
Brightness
Contrast
Opacity
Brightness
Contrast
Opacity
Brightness
Contrast
Opacity
Brightness
Contrast
Opacity
Brightness
Contrast
Opacity

Day 3

Day 4

MIT Central Accessability