USP1

Gene symbol: USP1
Gene: 7398
Uniprot Function: Negative regulator of DNA damage repair which specifically deubiquitinates monoubiquitinated FANCD2 (PubMed:15694335). Also involved in PCNA-mediated translesion synthesis (TLS) by deubiquitinating monoubiquitinated PCNA (PubMed:16531995). Has almost no deubiquitinating activity by itself and requires the interaction with WDR48 to have a high activity (PubMed:18082604, PubMed:26388029).
Mitotic Index 0.0255
Interphase Cluster: #104 (23 genes)
Mitotic Cluster: #96 (24 genes)
sgRNA 1: GAAGTTAAACCCATAAACAA (interphase cells: 2630, mitotic cells: 72)
sgRNA 2: GGCGACTGCTTAACACACTG (interphase cells: 2636, mitotic cells: 66)
sgRNA 3: TGGTATTAACAGCATAGAGA (interphase cells: 1510, mitotic cells: 28)
sgRNA 4: TTTACTCCAGATTTAAAACC (interphase cells: 1987, mitotic cells: 63)

Interphase Cluster

Mitotic Cluster

Overview

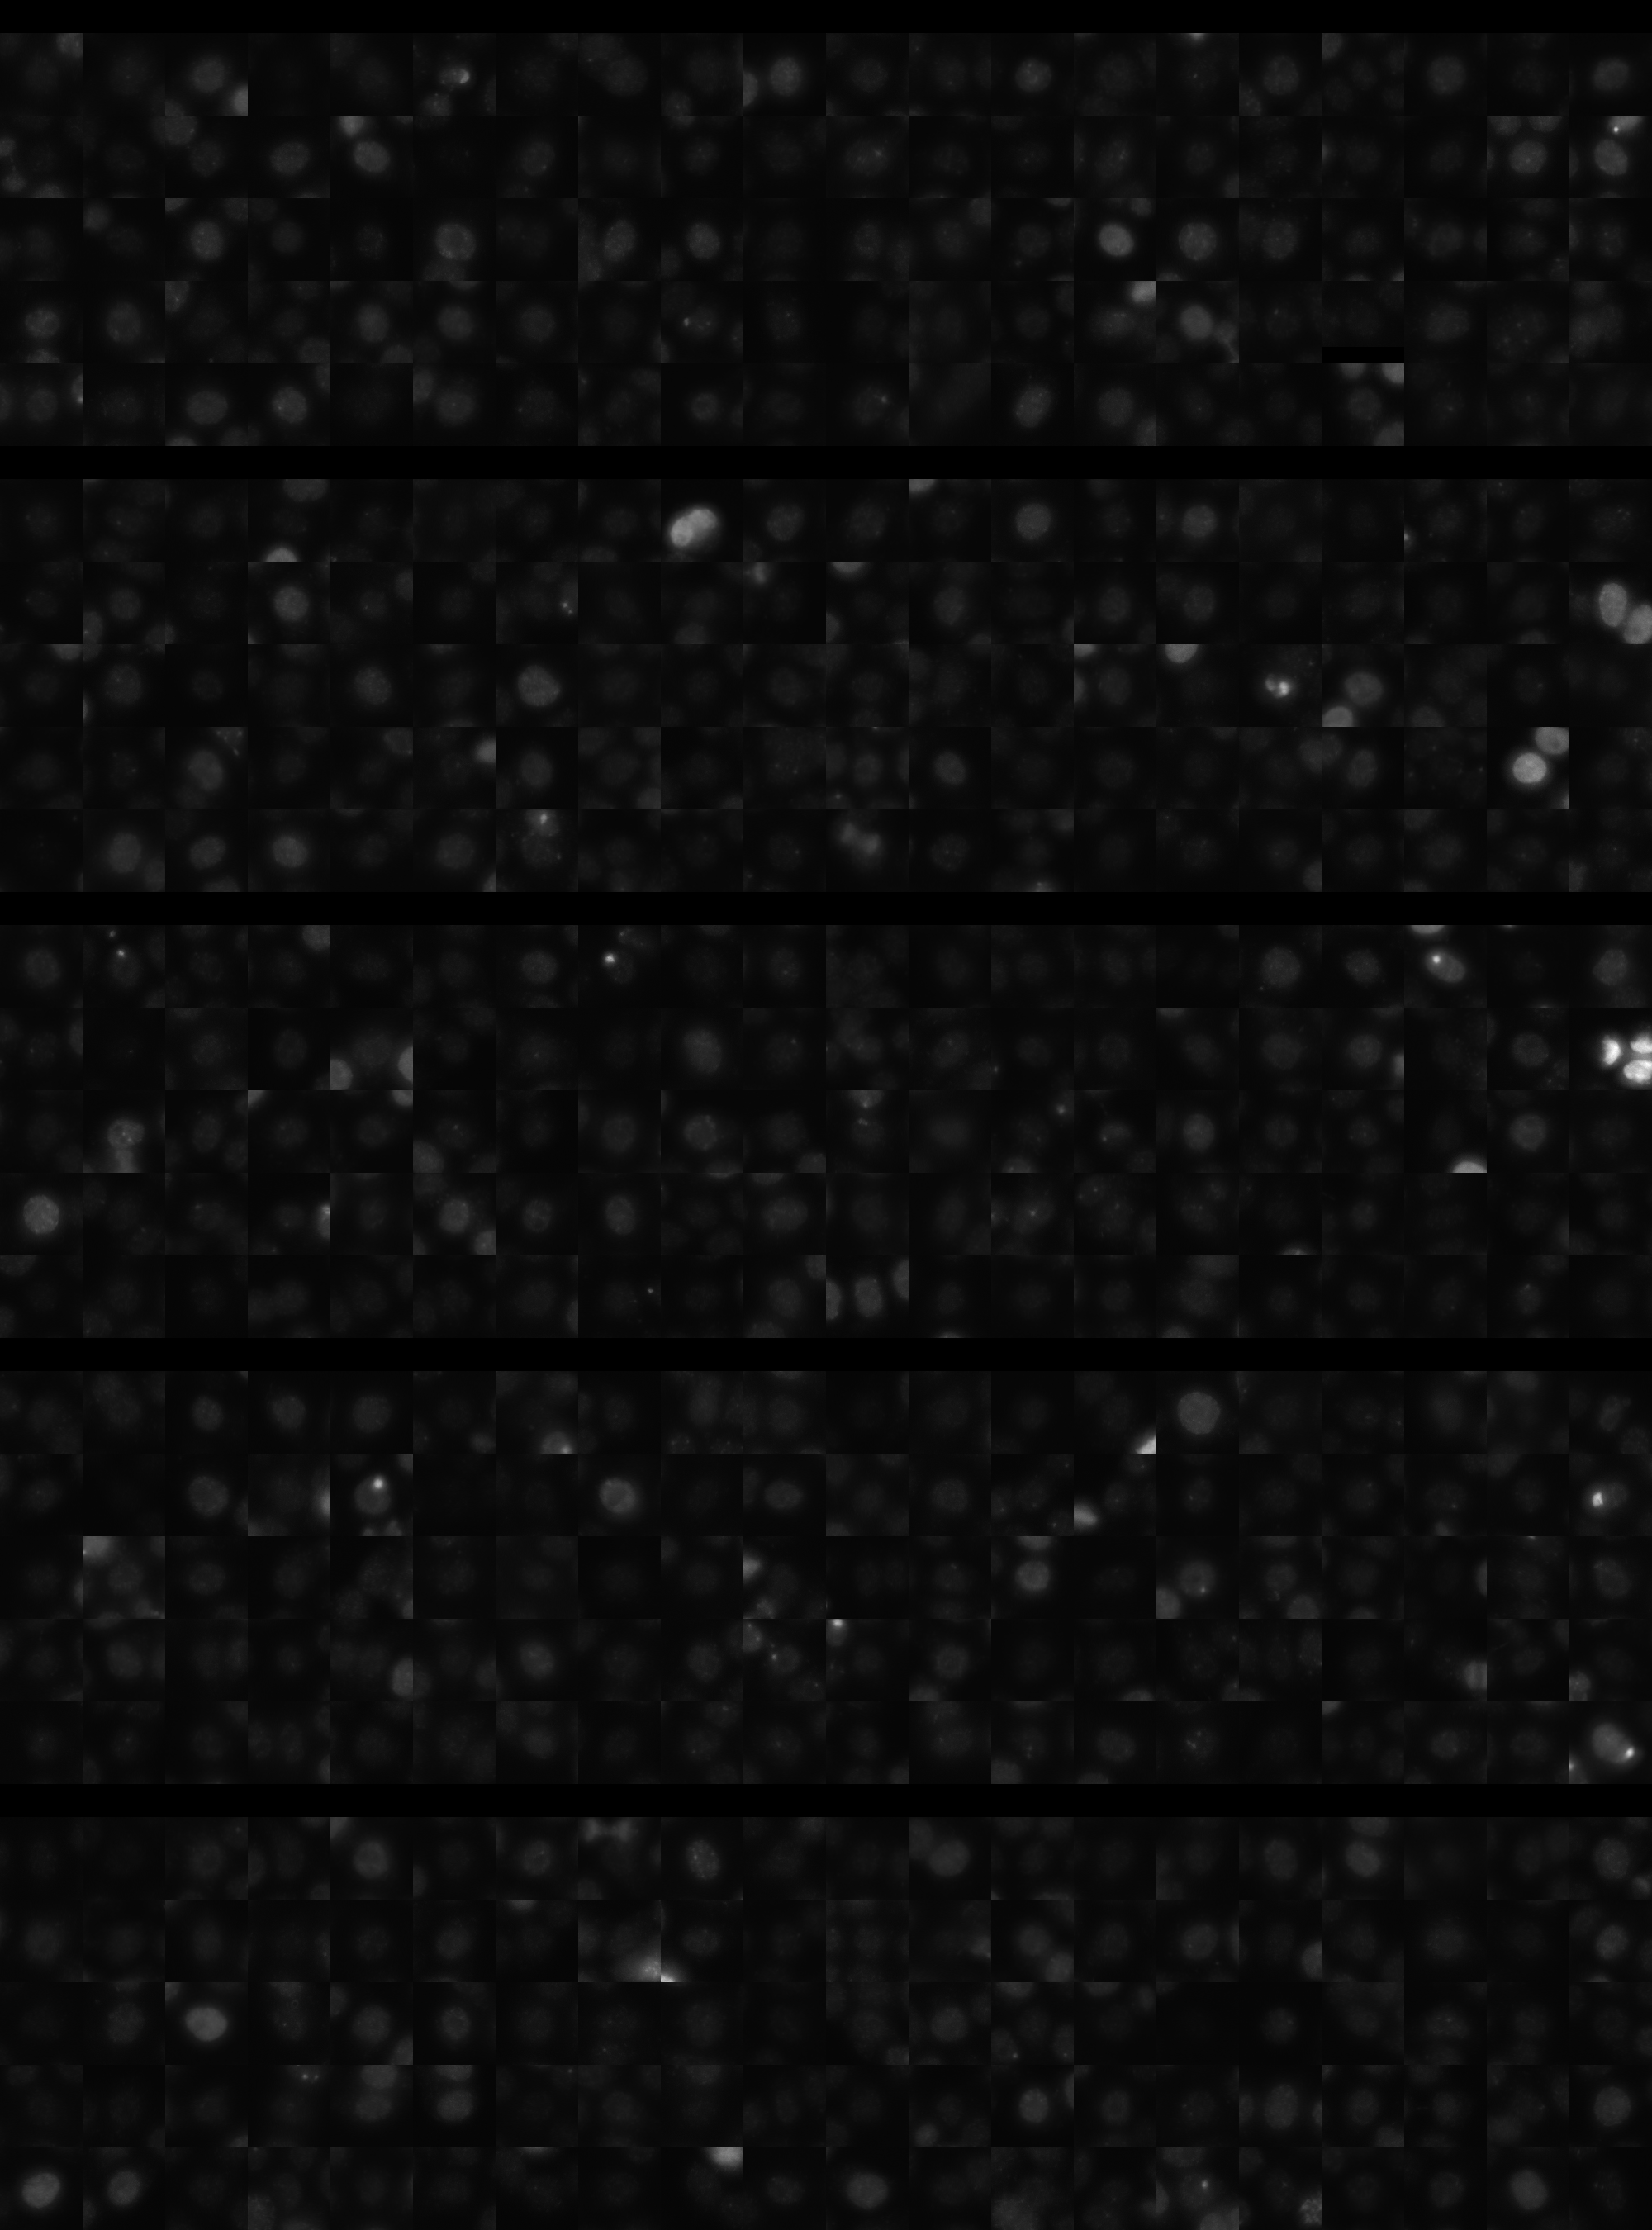
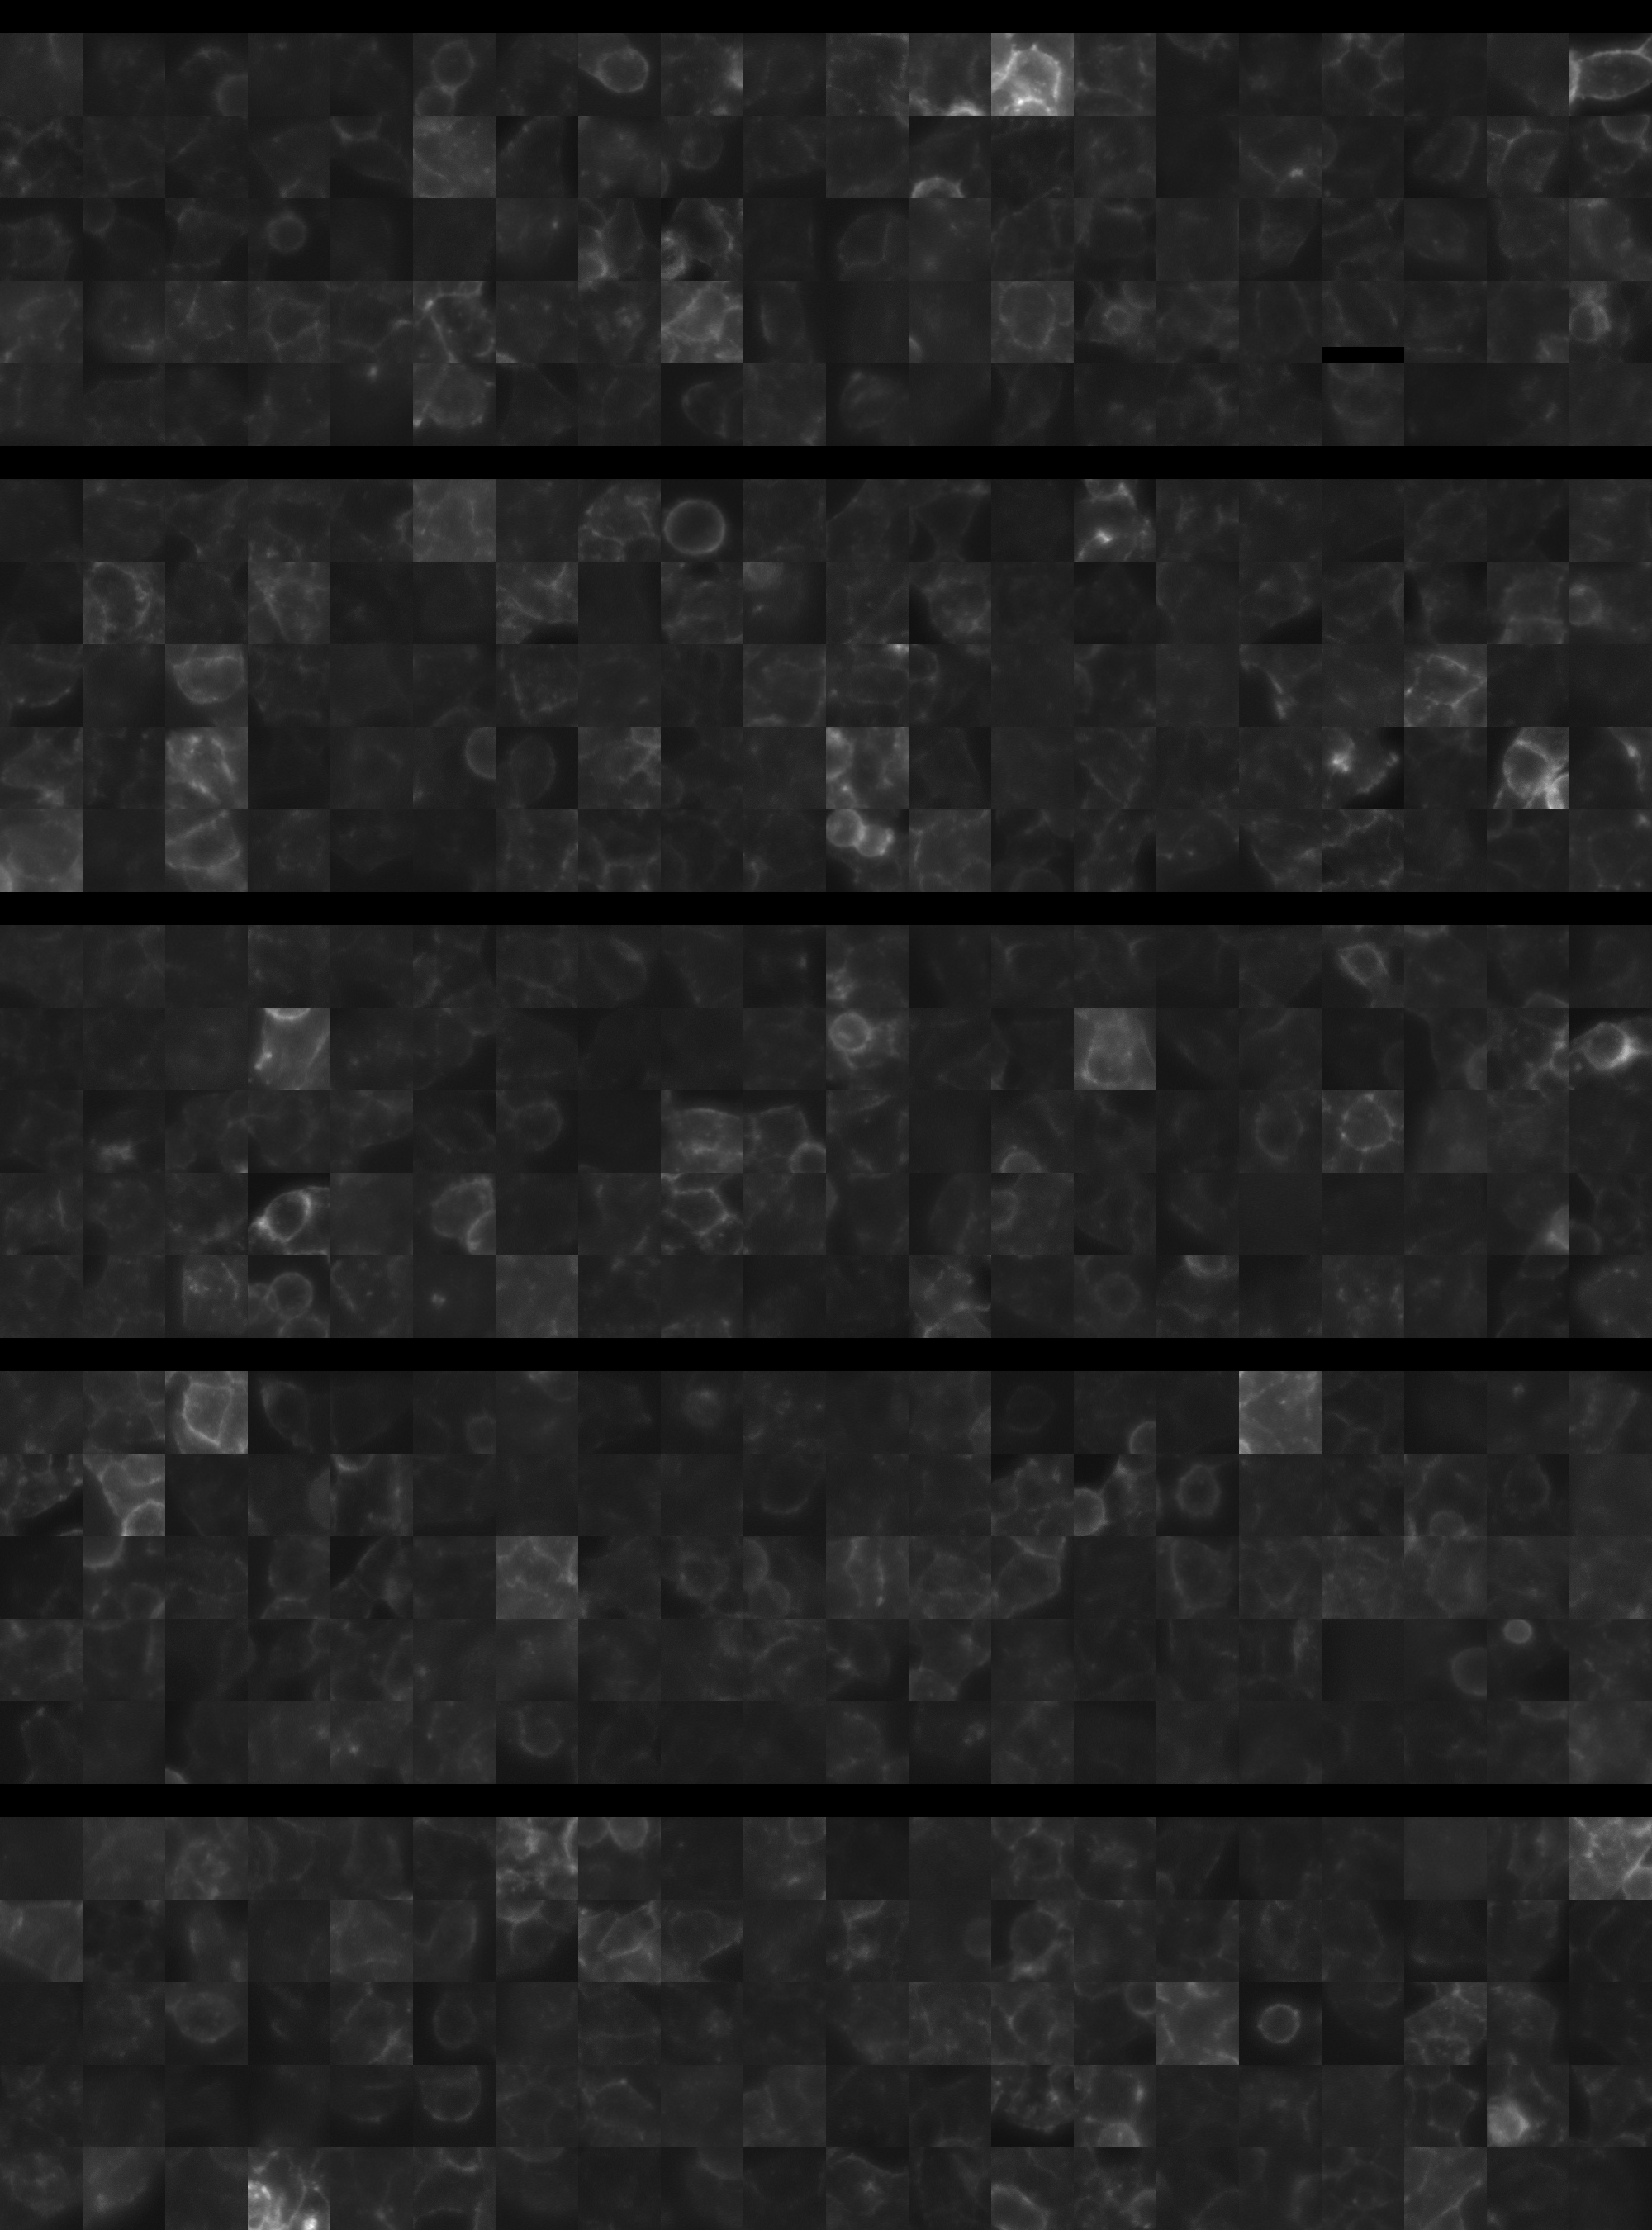
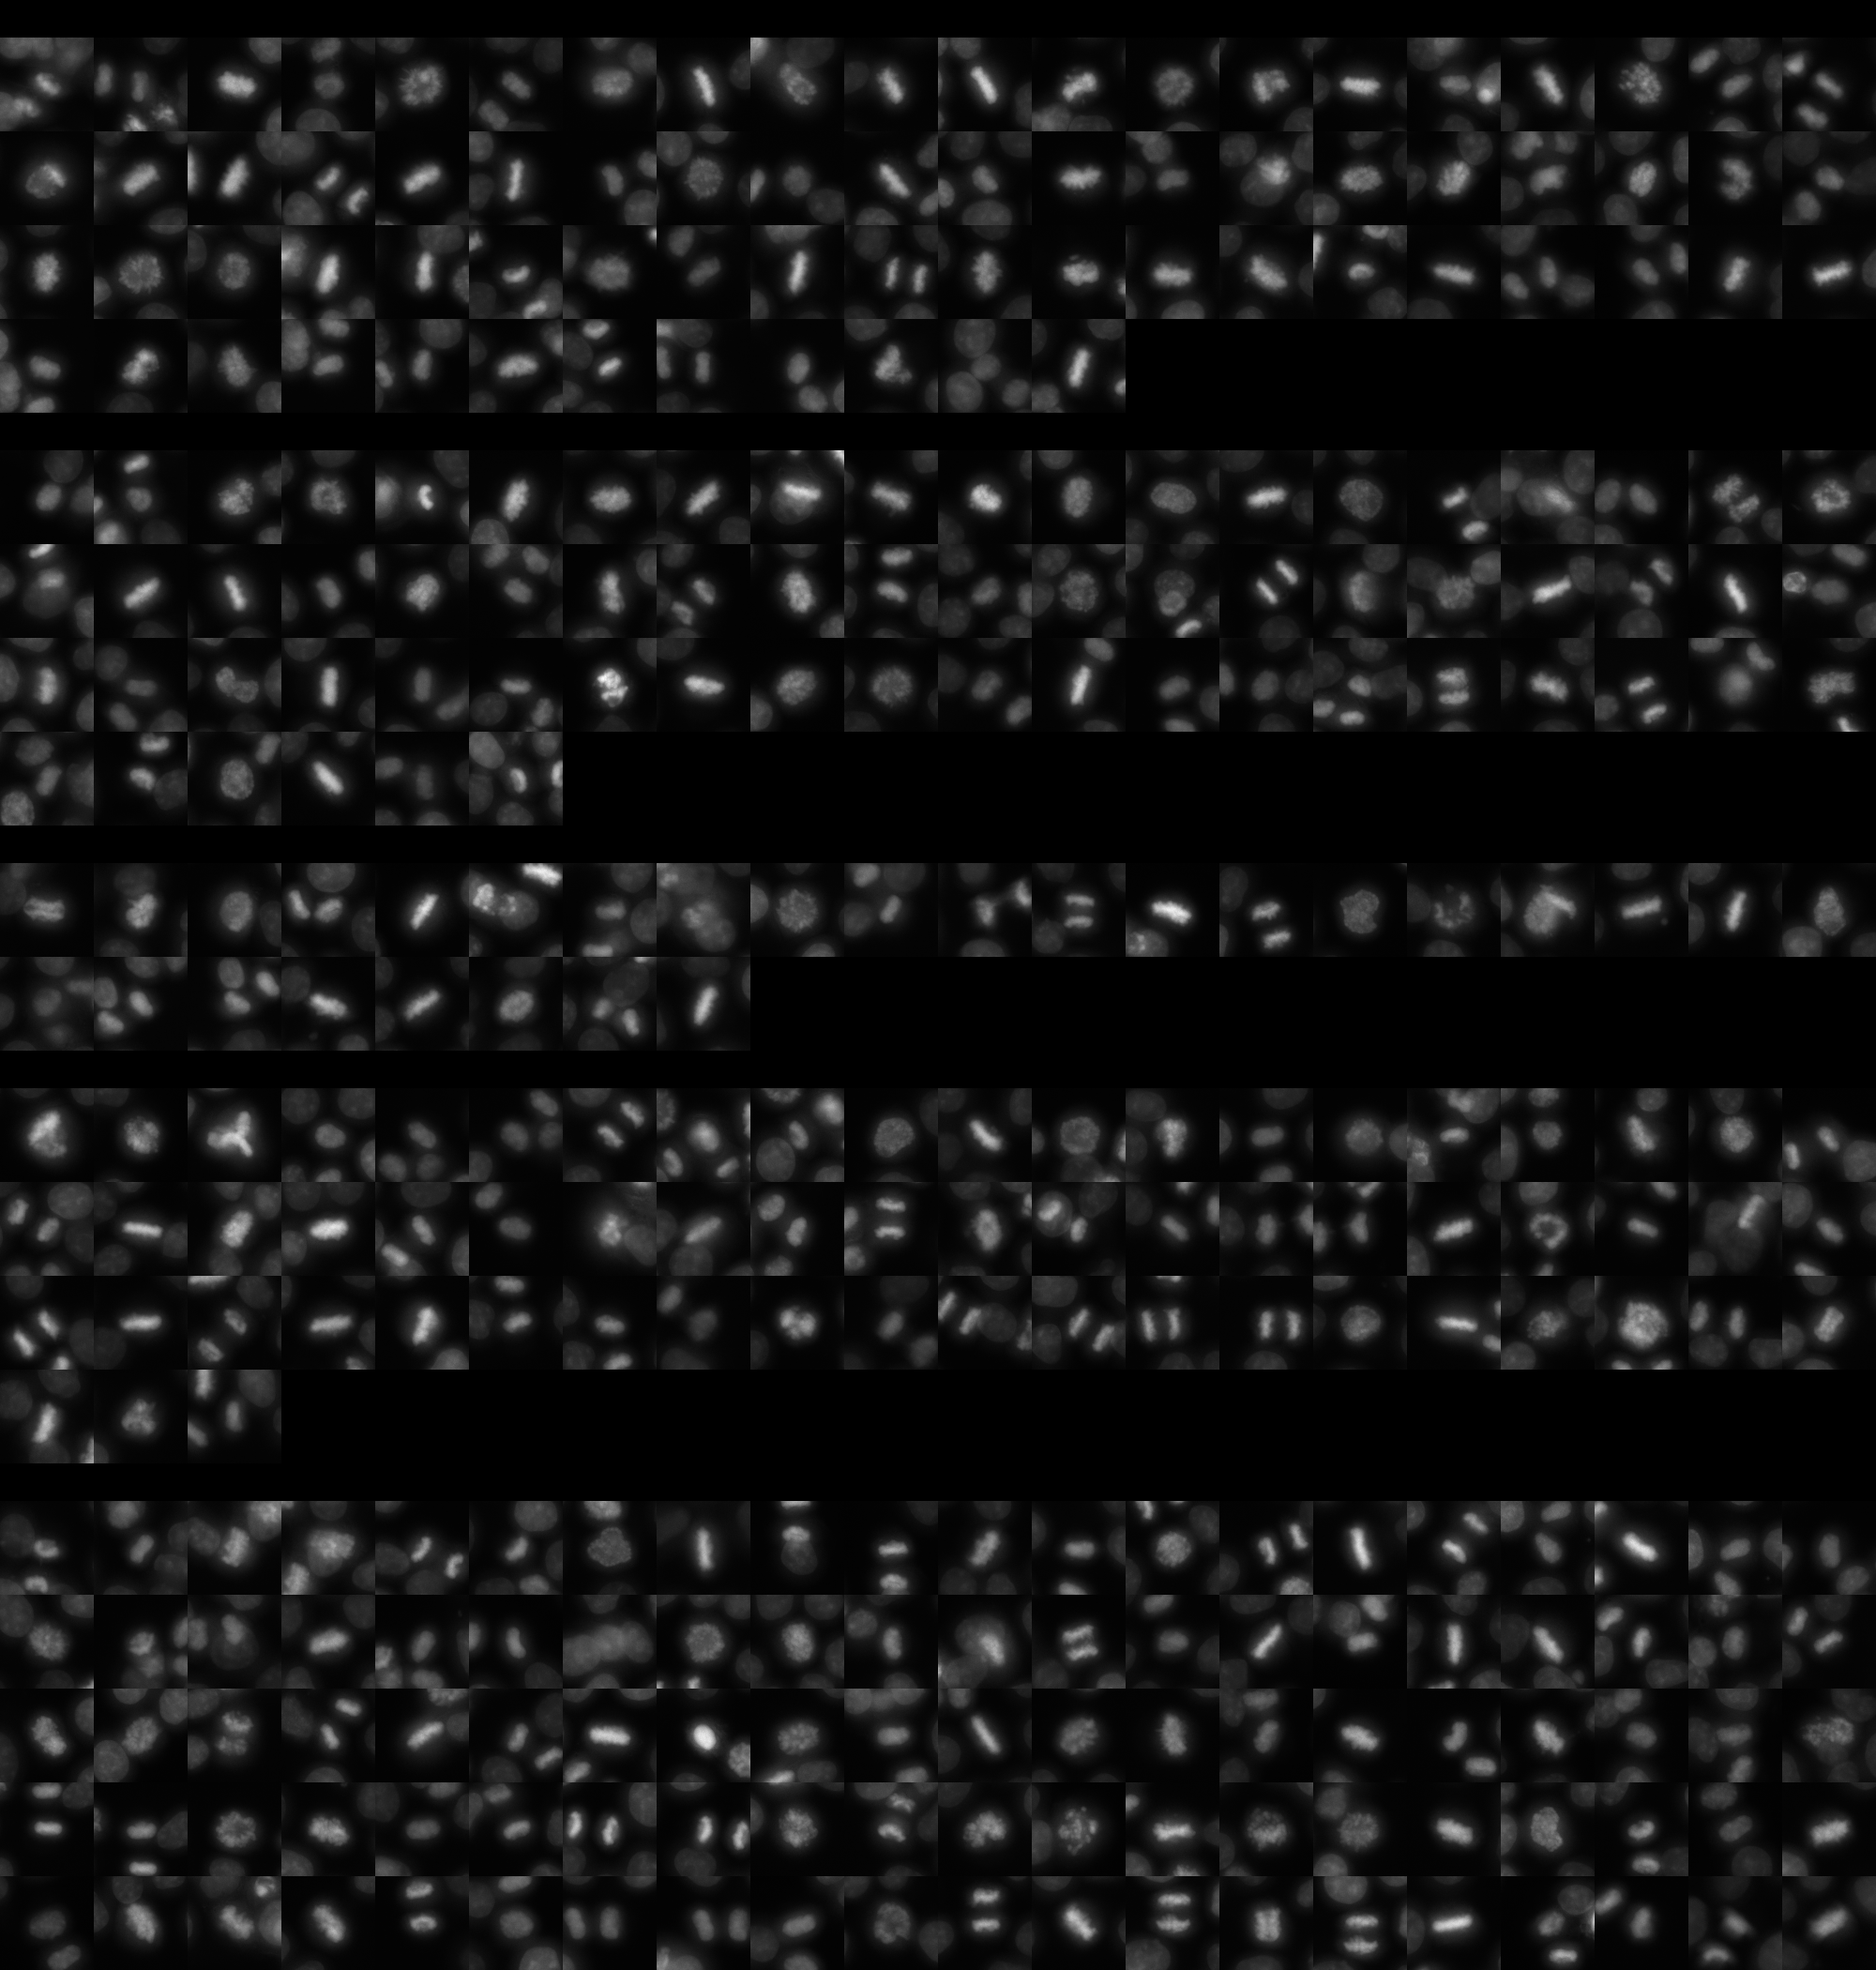
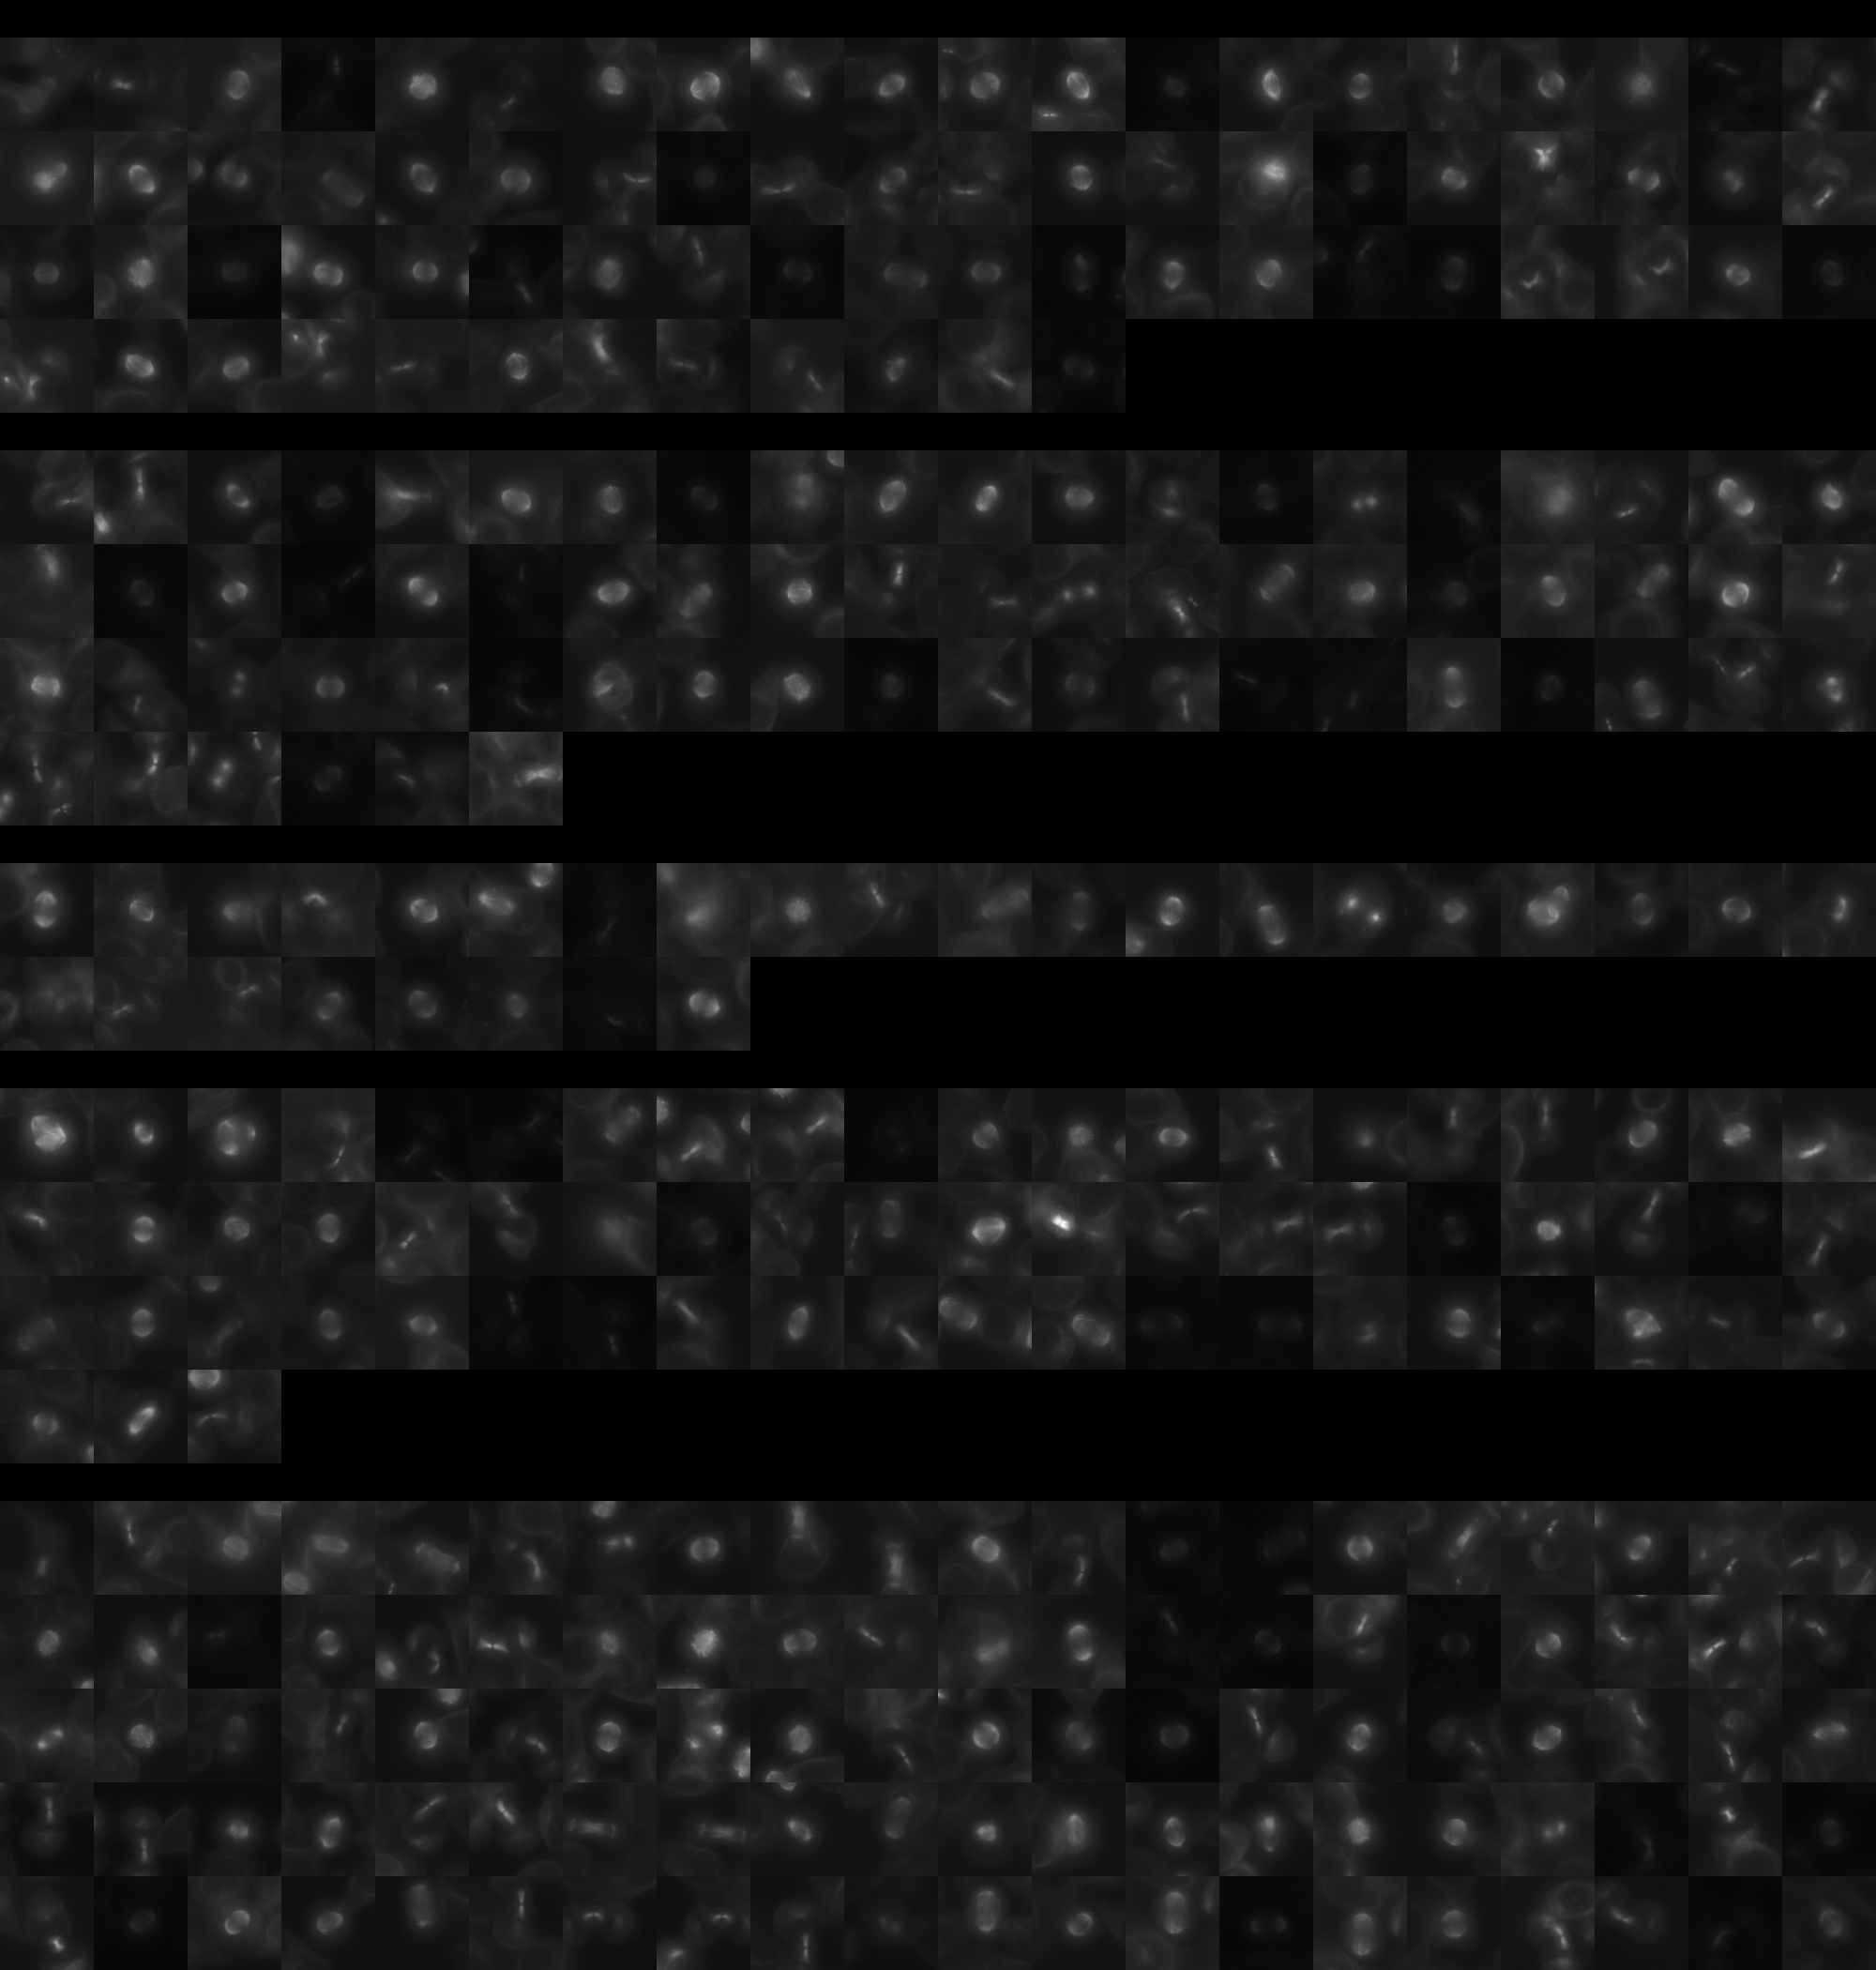
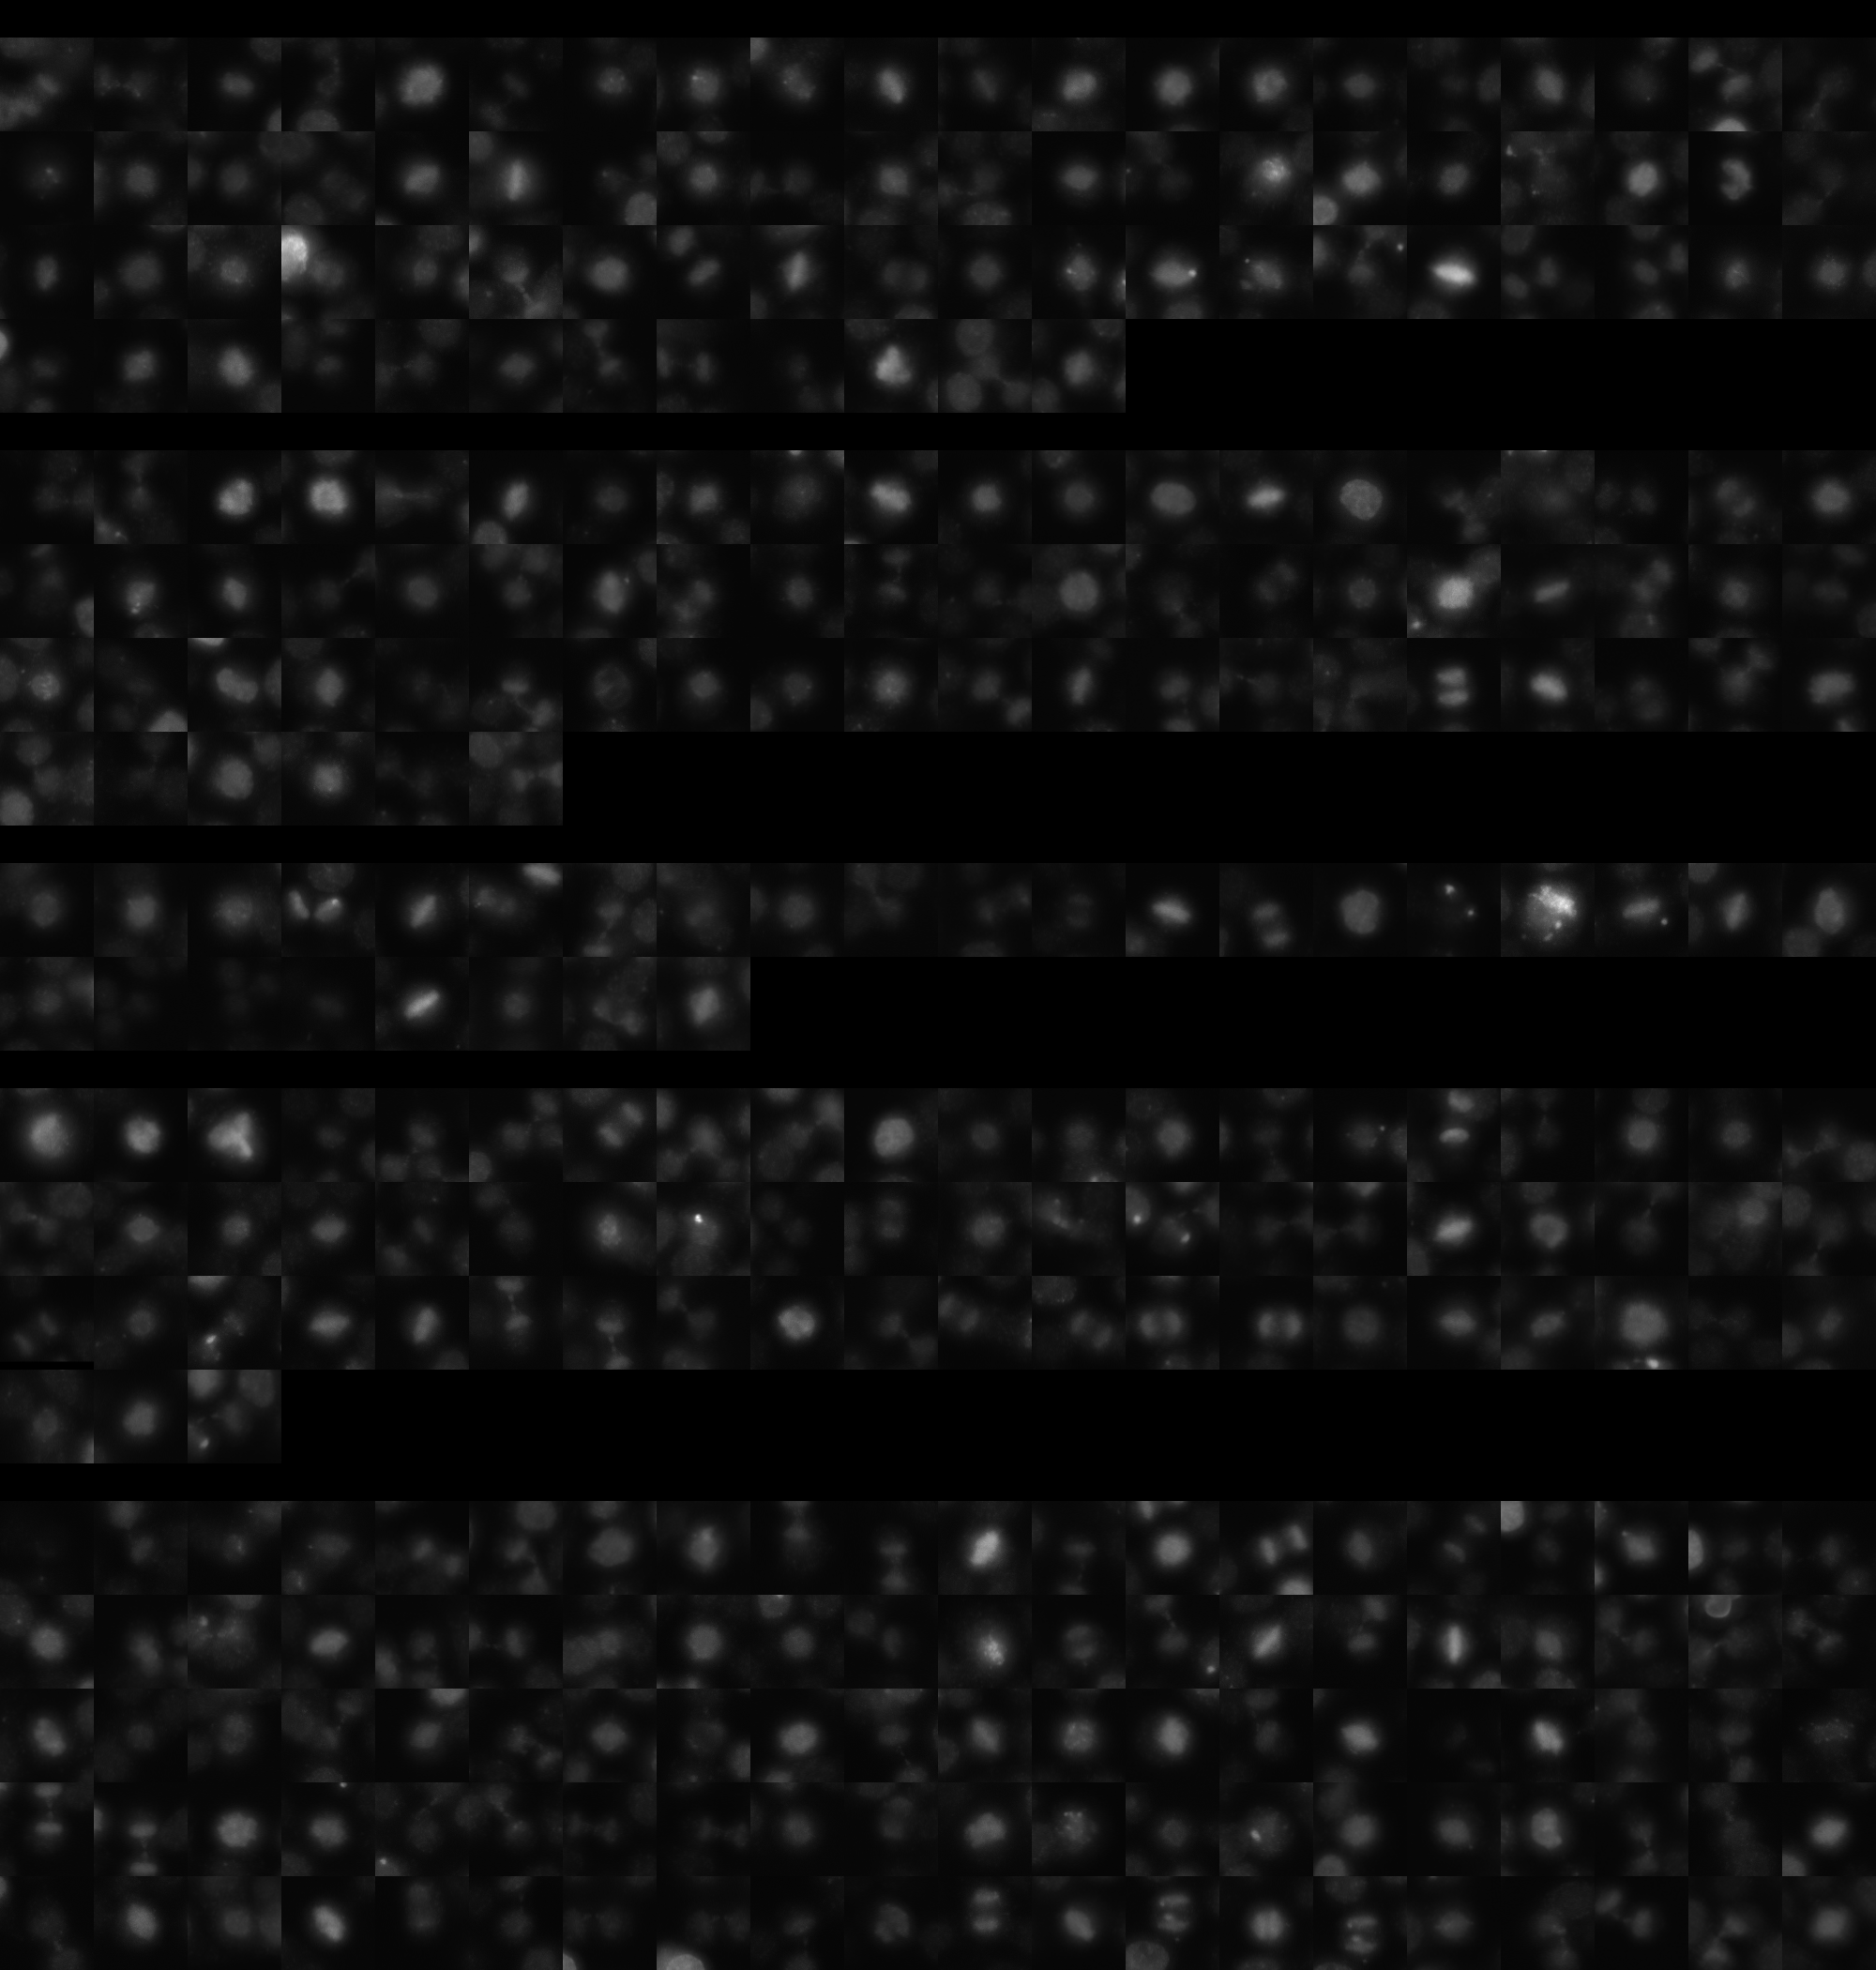
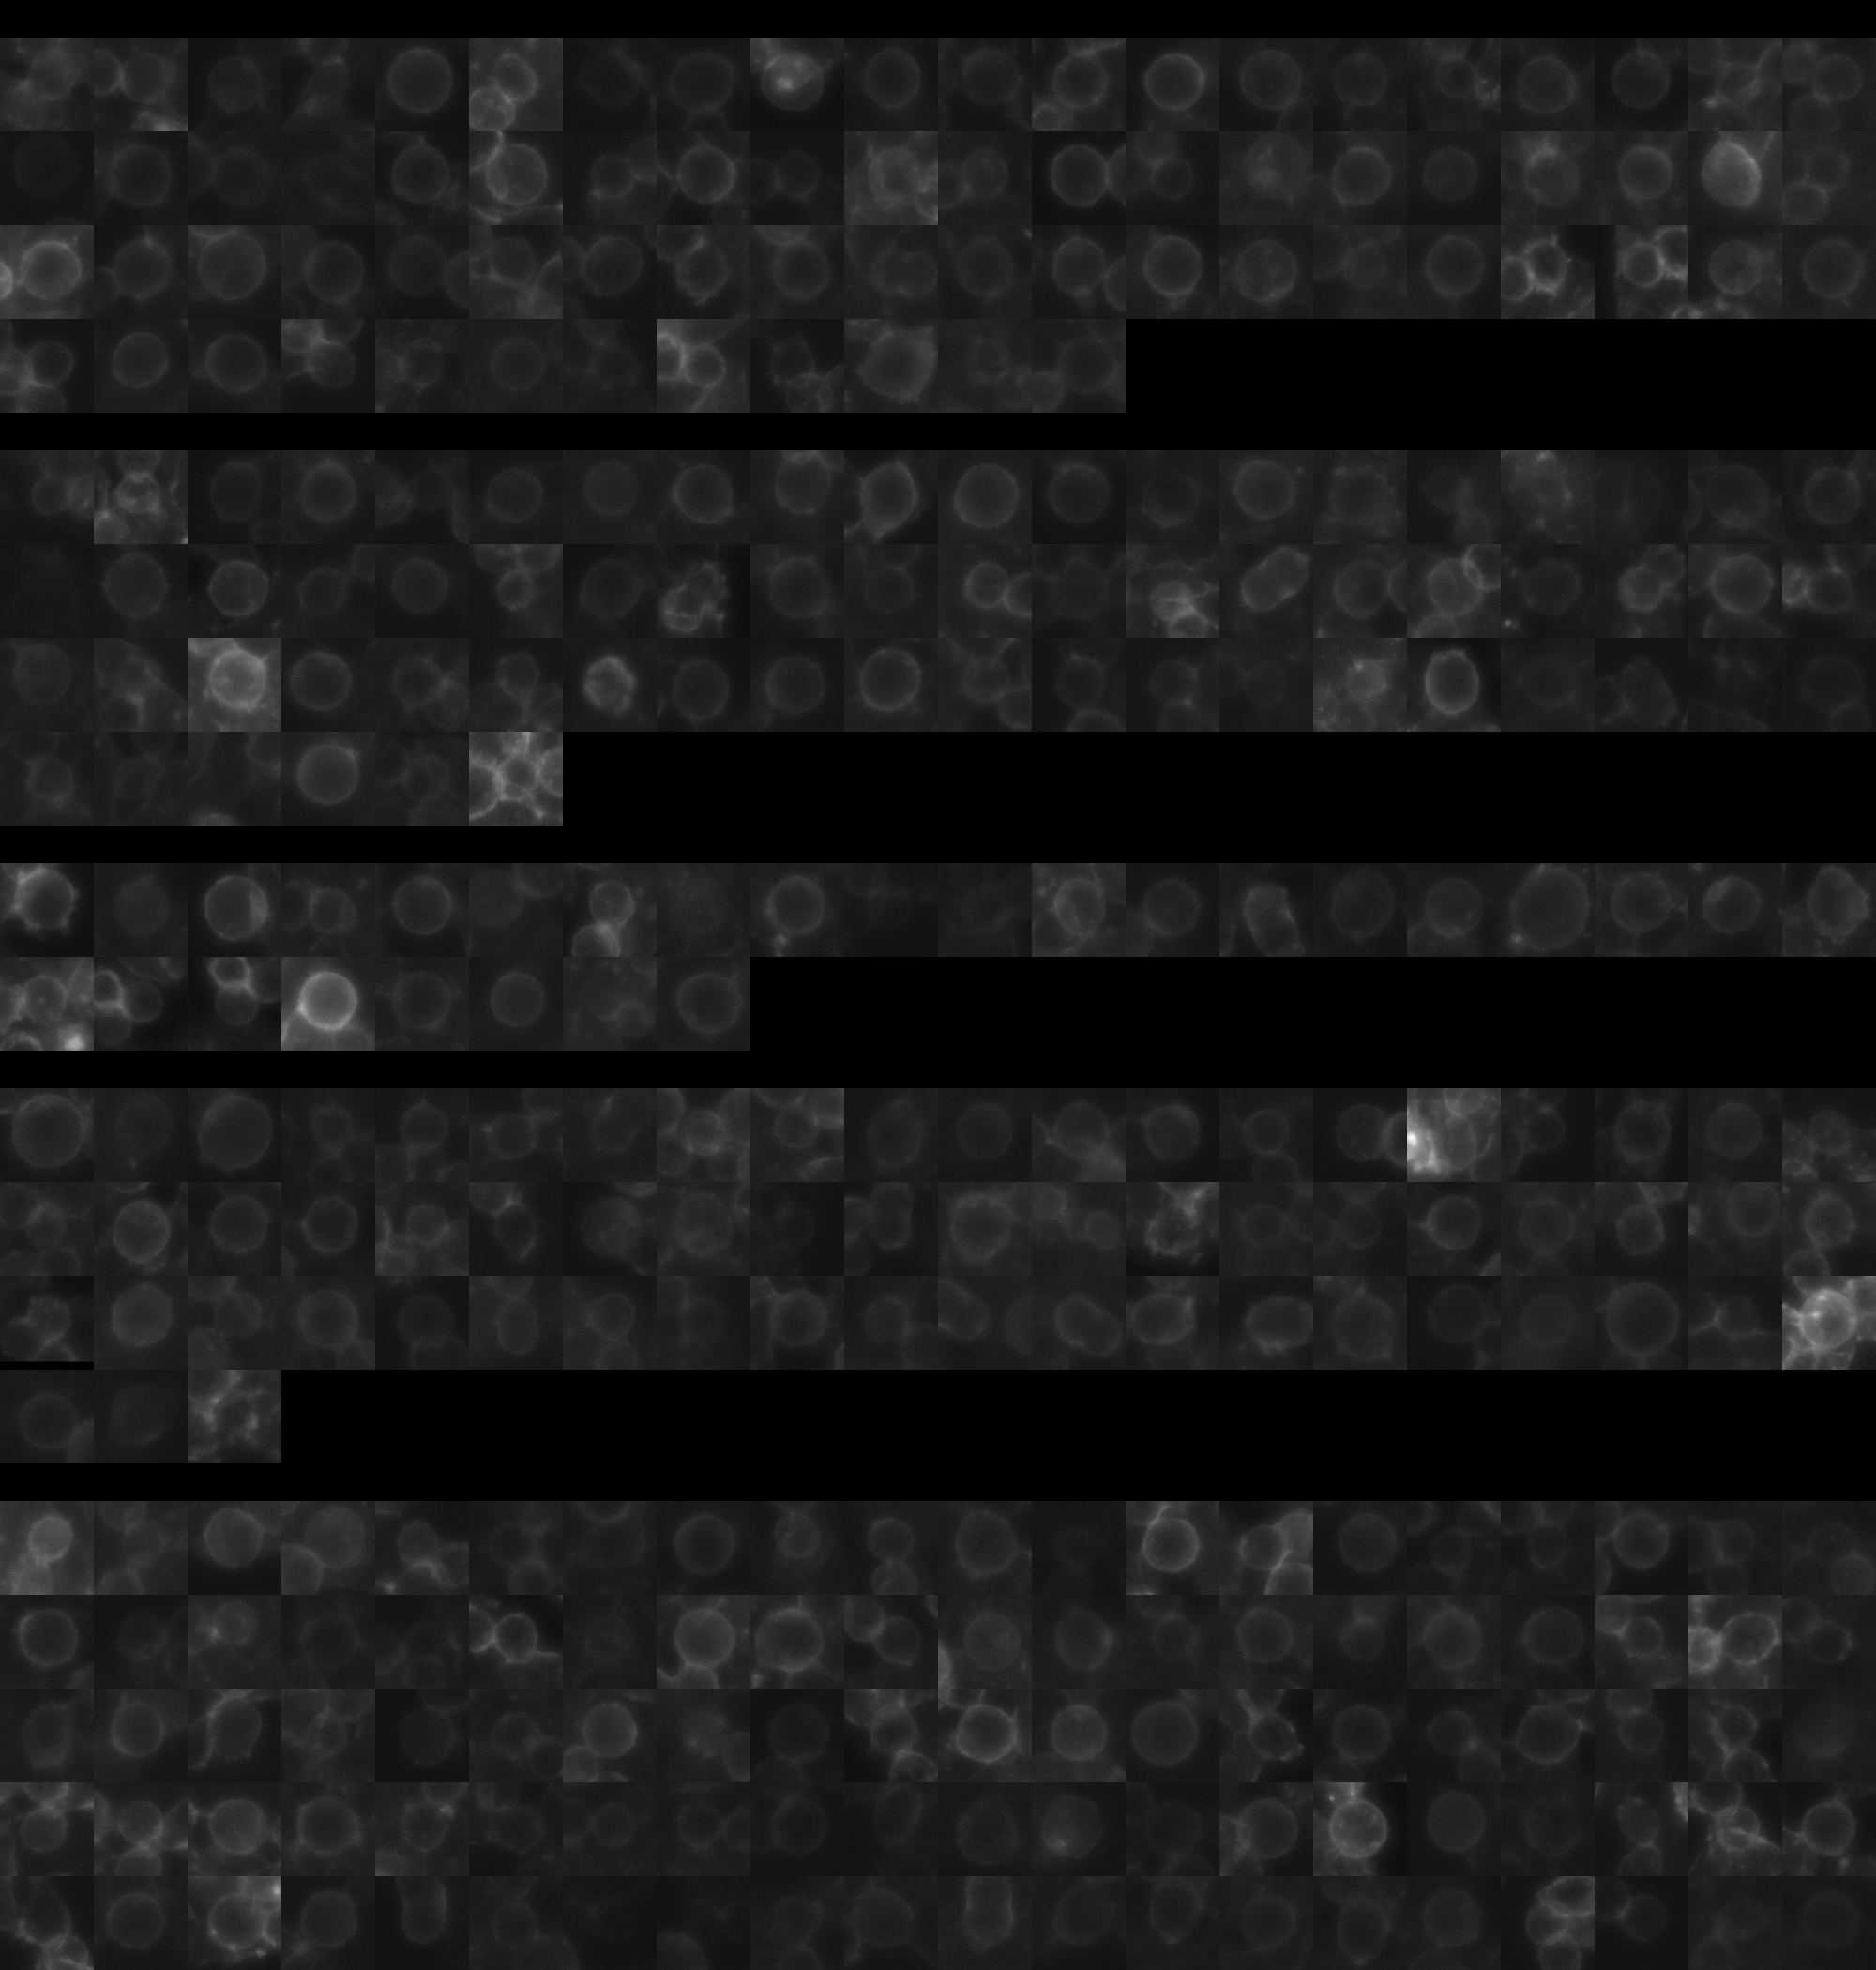
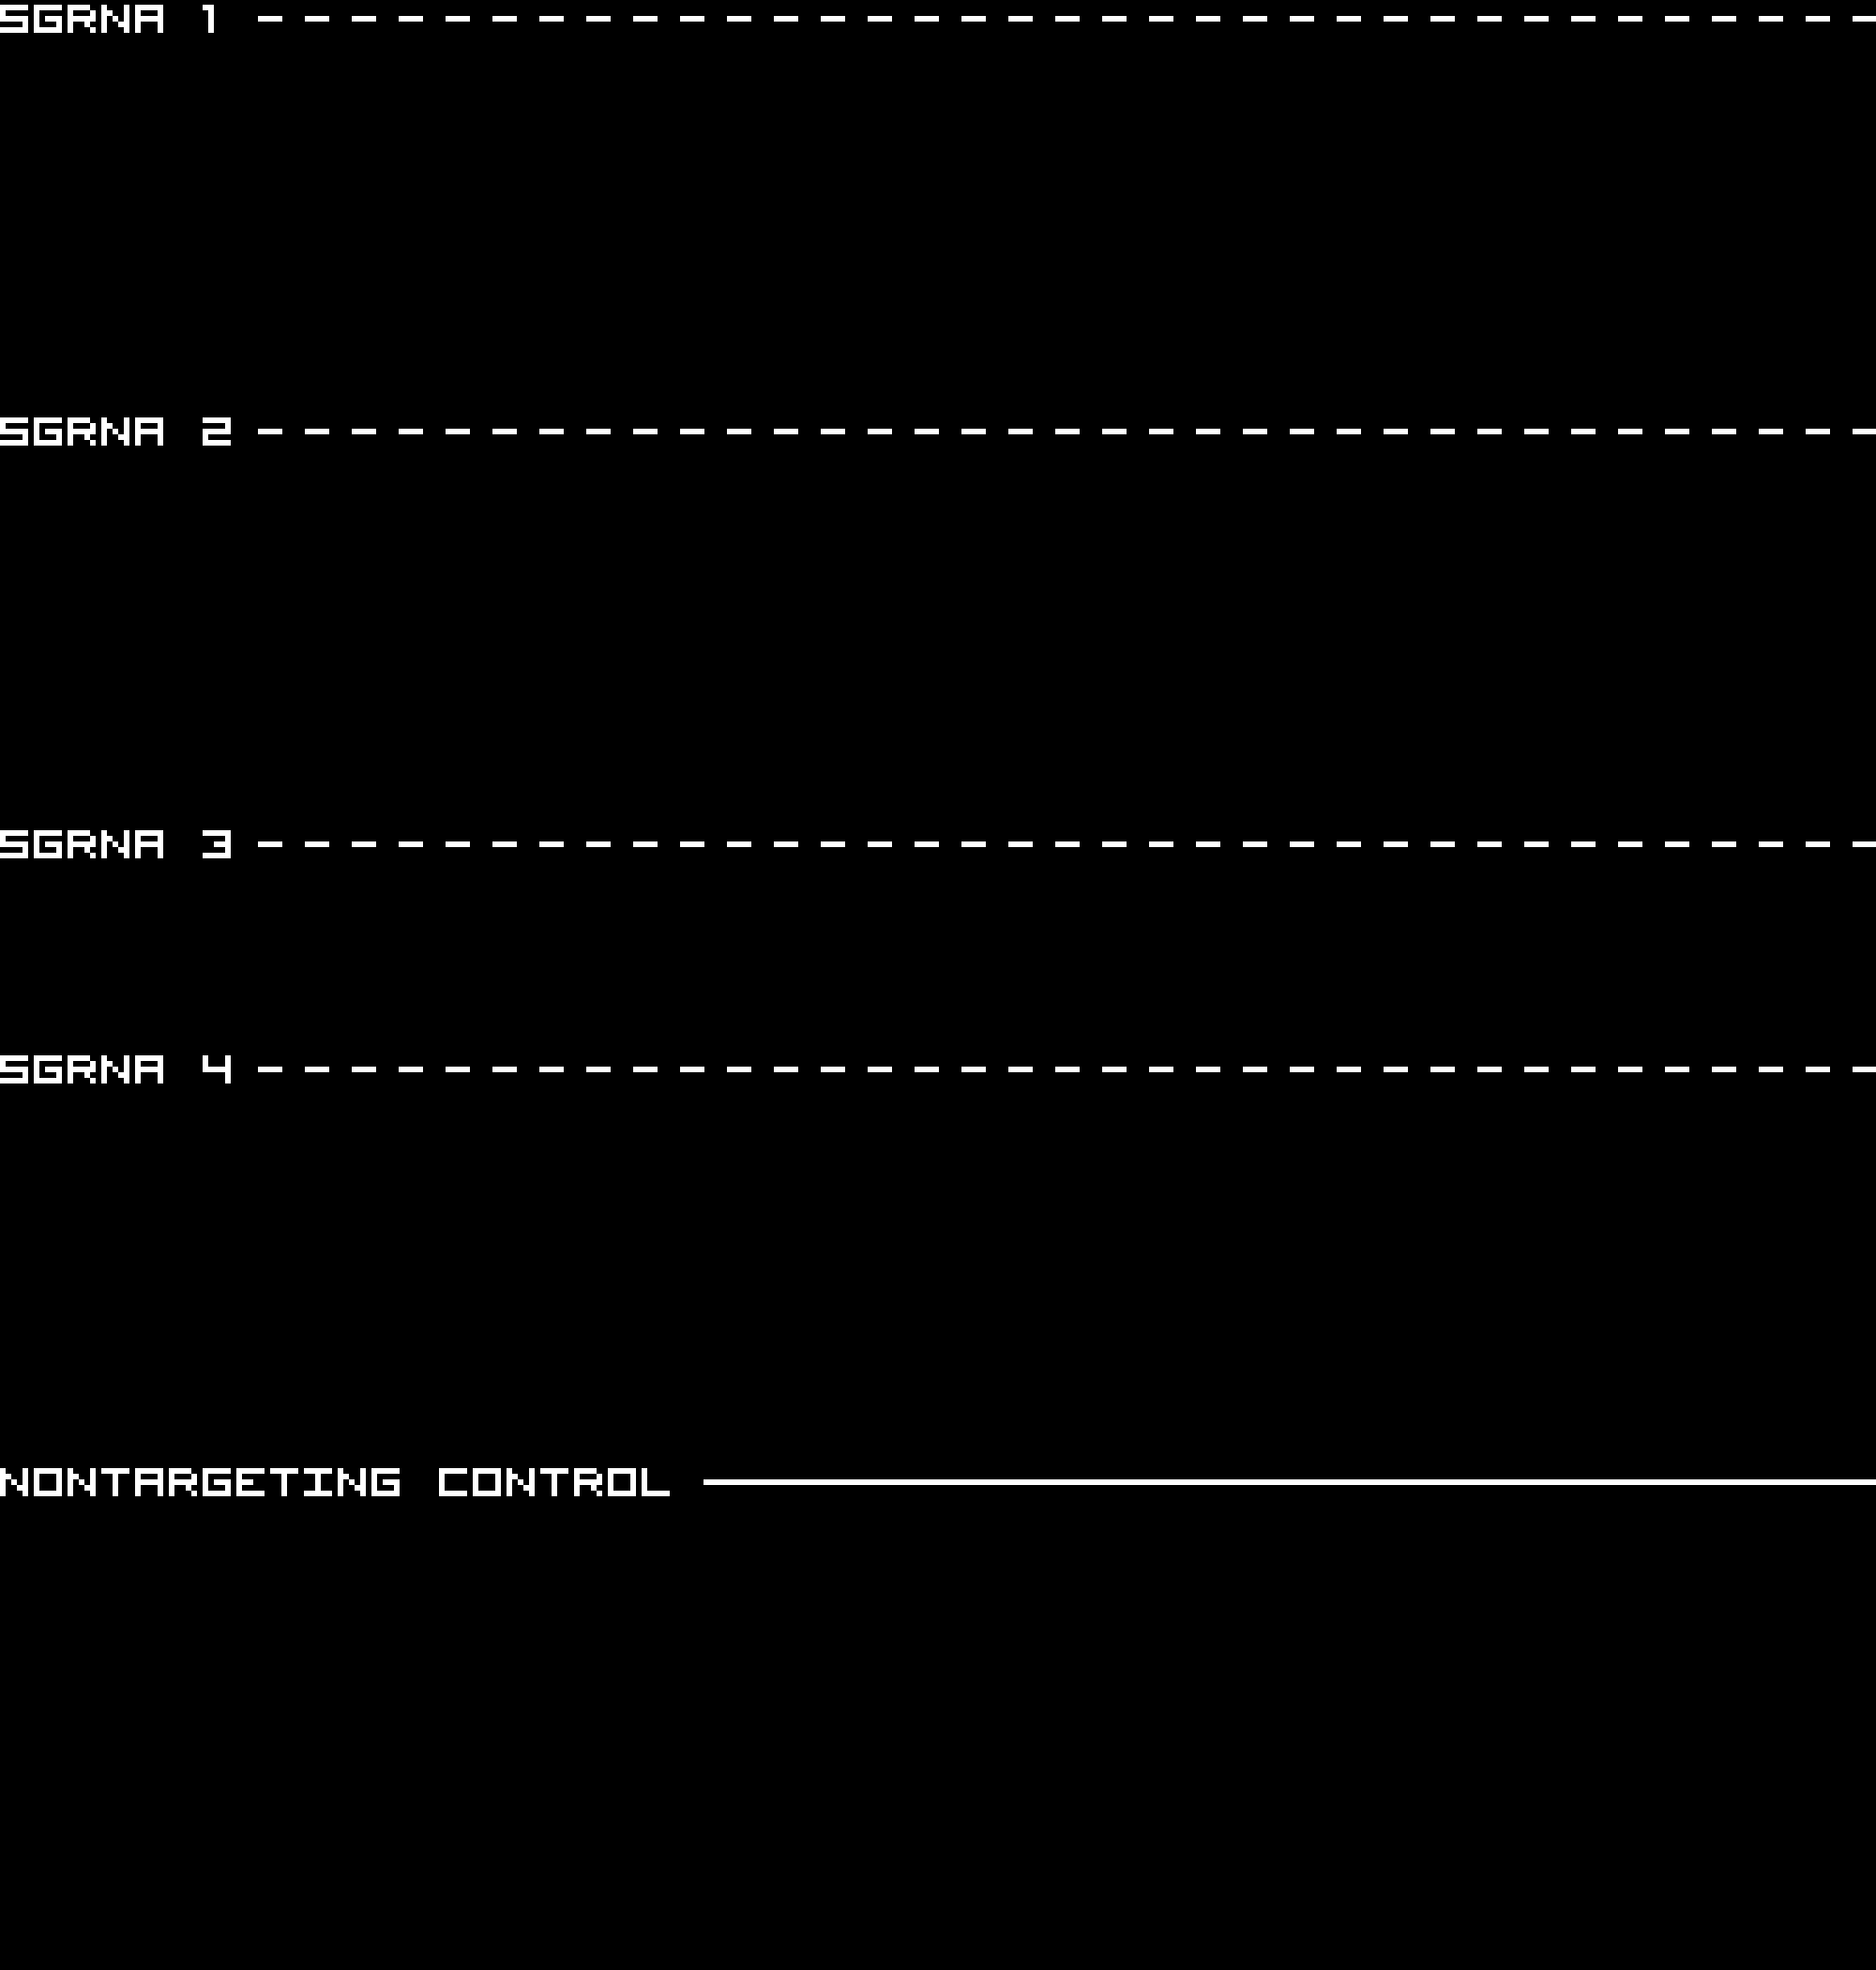
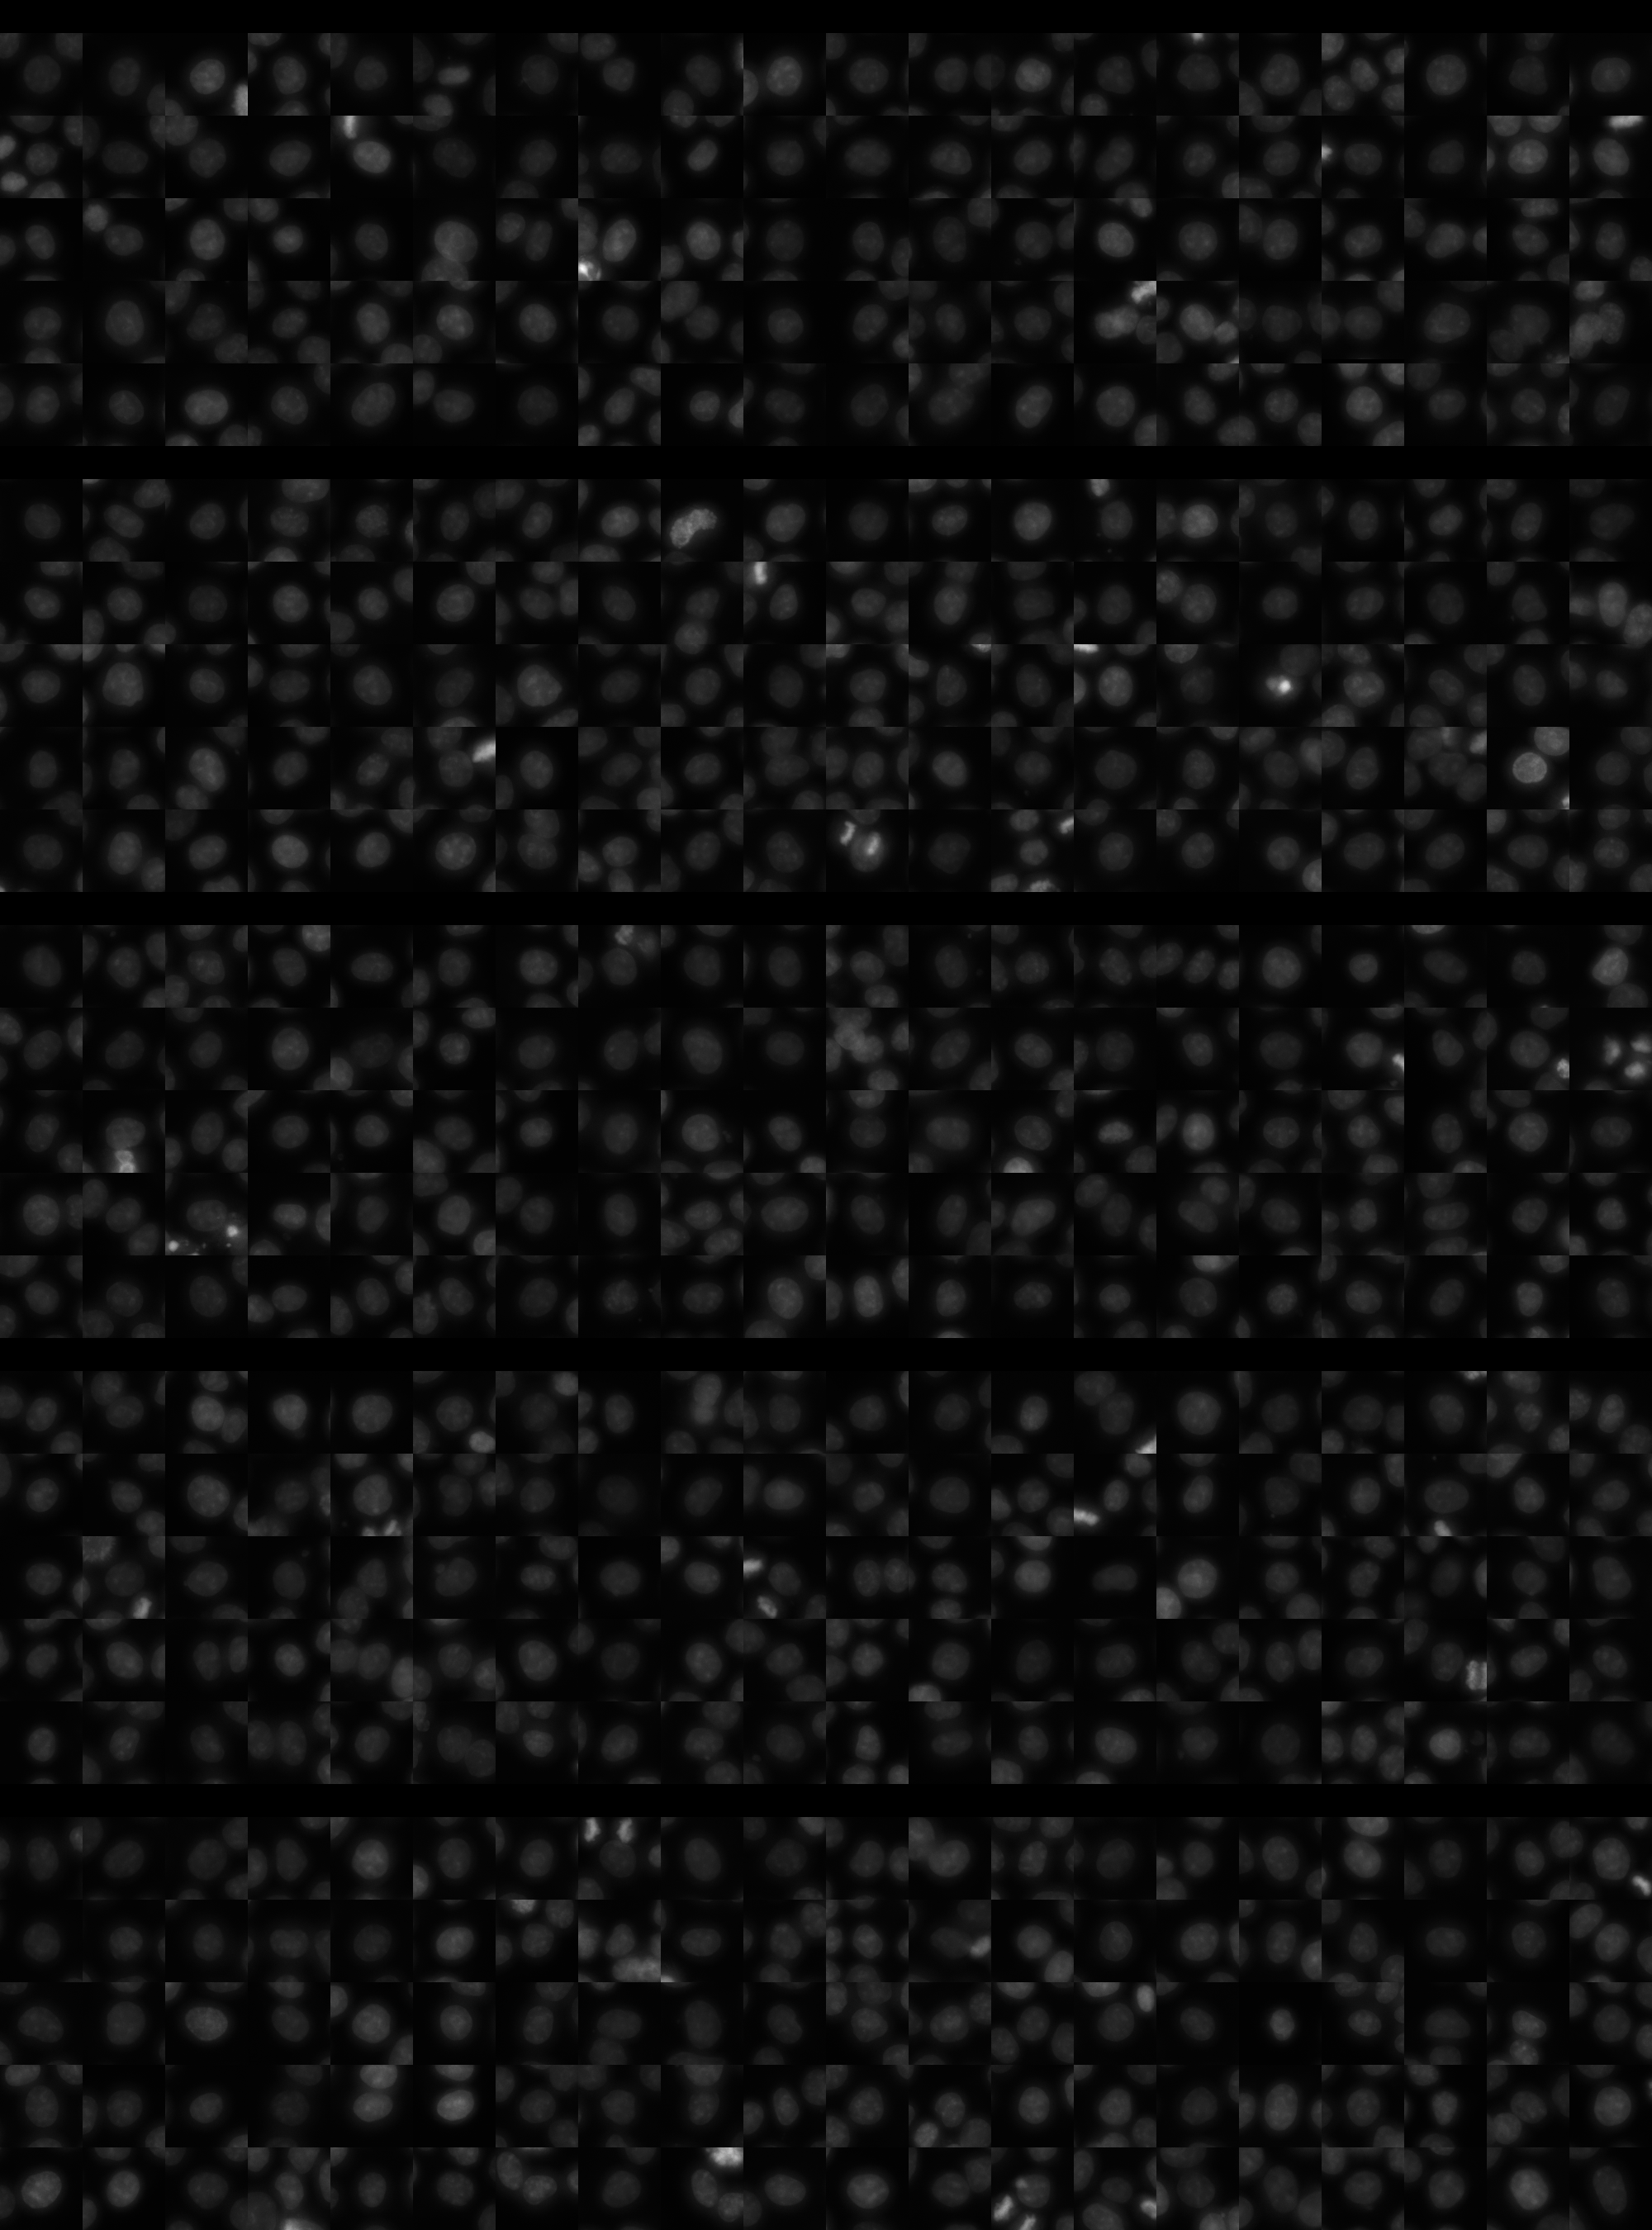
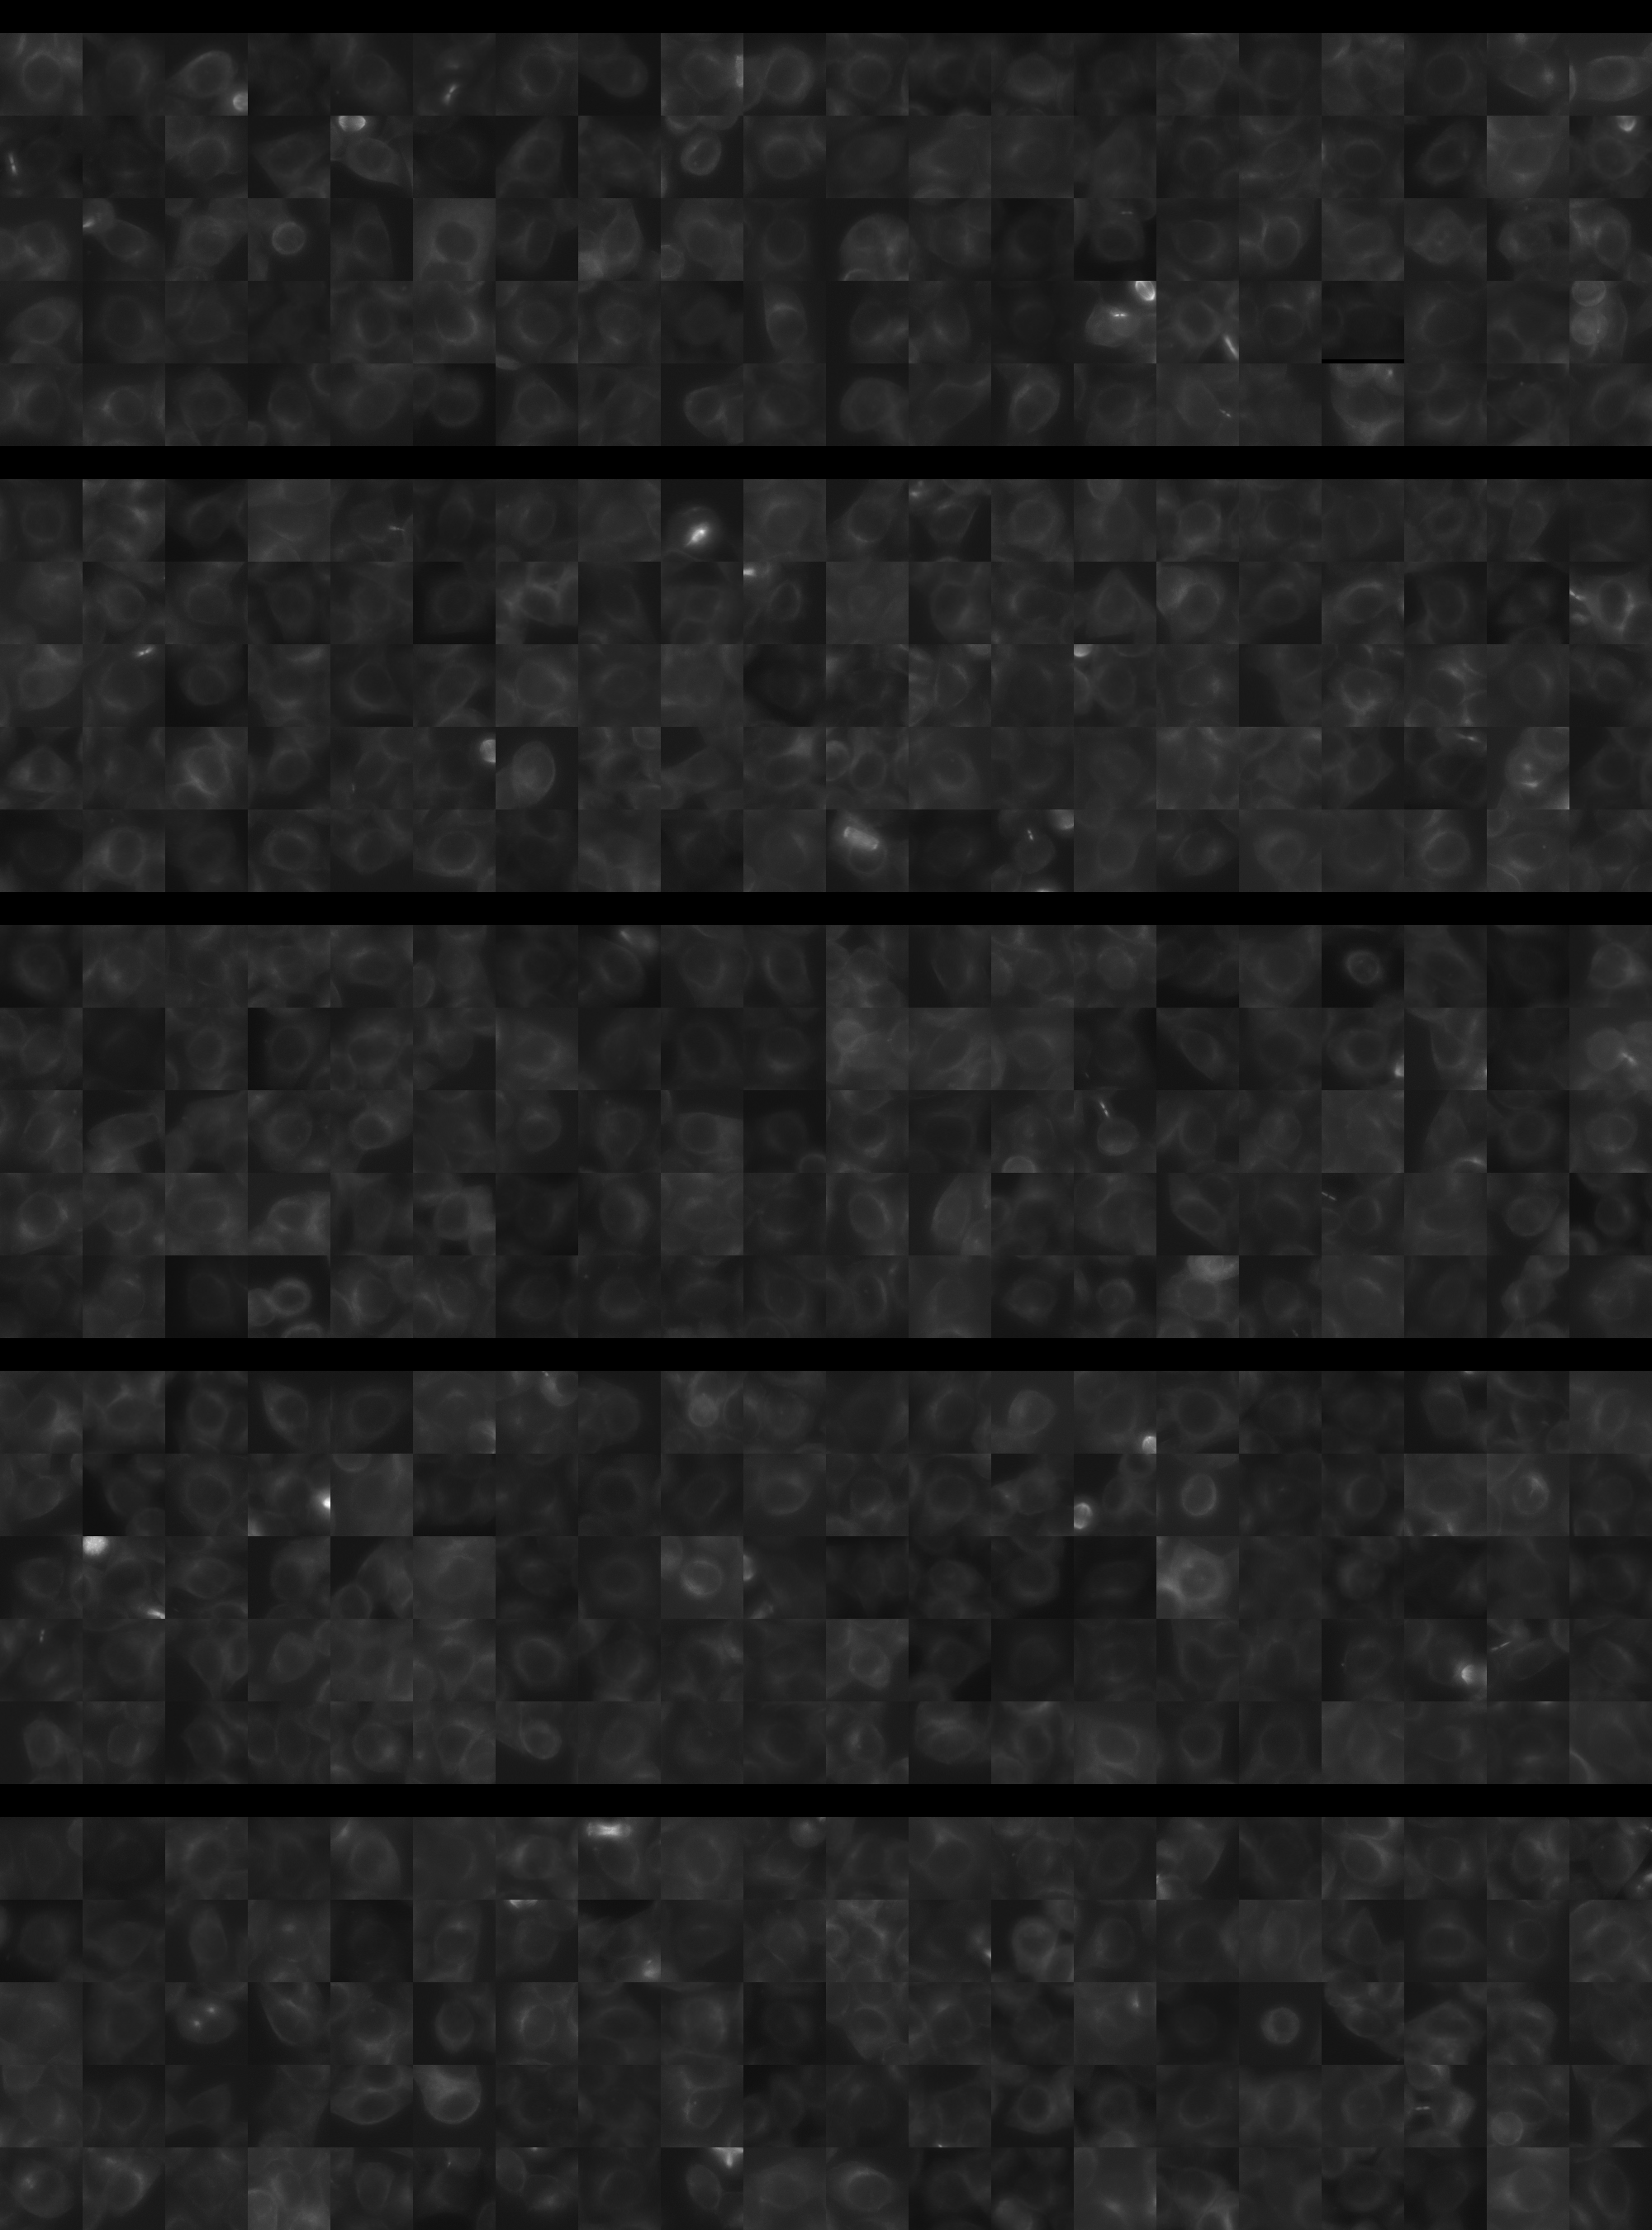
Each montage below shows randomly selected individual cell images for the same target gene separated by sgRNA, along with an example montage of cells expressing a non-targeting negative control sgRNA at the bottom. sgRNA labels in the montages correspond to the numbered sgRNA sequences in the gene info table above. The DNA (blue) and tubulin (green) channels are displayed by default, with gH2AX (grayscale) and actin (yellow) available using the check boxes. Channel brightness, contrast, and opacity are adjustable by clicking the arrow next to the channel name. When only one channel is selected, the display defaults to grayscale. Click the “Zoom” checkbox above the channel controls to enable image zooming (via scrolling) and panning (via click-and-drag).

The cell boxes displayed for this gene are square, 30.36 μm per side for the interphase montage and 30.36 μm per side for the mitotic montage.
Features

Interphase Score Rank FDR q-value
Nucleus DNA Integrated -1.302e-02 3745 of 5322 0.830
Nucleus DNA Mean 0.091 540 of 5322 0.014
Nucleus gH2AX Mean 0.159 900 of 5322 2.456e-04
Nucleus DNA - gH2AX Correlation -3.496e-02 1874 of 5322 0.183
Nucleus Shape Area -5.803e-02 4557 of 5322 0.125
Nucleus Shape Eccentricity -3.664e-02 4625 of 5322 0.342
Nucleus Shape Form Factor 0.001 614 of 5322 0.880
Nucleus Shape Solidity -9.344e-03 912 of 5322 0.802
Cell DNA Mass Displacement -5.688e-03 4634 of 5322 0.889
Cell Tubulin Mean 0.114 398 of 5322 0.002
Cell Tubulin Mass Displacement 0.046 705 of 5322 0.225
Cell Actin Mean 0.002 2931 of 5322 0.946
Cell Tubulin - Actin Correlation -2.071e-02 4504 of 5322 0.652
Cell DNA - Tubulin Correlation -6.174e-02 5046 of 5322 0.052
Cell Shape Area -3.490e-02 4117 of 5322 0.397
Cell Shape Eccentricity -4.710e-02 5165 of 5322 0.389
Mitotic Score Rank FDR q-value
Nucleus DNA Integrated 0.152 1784 of 5322 0.906
Nucleus DNA Mean -1.193e-01 4482 of 5322 1.000
Nucleus DNA Mass Displacement 0.016 3276 of 5322 0.999
Nucleus DNA Mean Frac 3 0.109 1453 of 5322 1.000
Nucleus gH2AX Mean 0.018 2696 of 5322 1.000
Nucleus gH2AX Mean Frac 0 -2.647e-01 5091 of 5322 1.000
Nucleus Tubulin Mean Frac 0 -1.288e-01 4878 of 5322 0.999
Nucleus Tubulin Mean Edge -6.275e-02 3948 of 5322 0.999
Nucleus Tubulin Std Edge -9.316e-02 3808 of 5322 0.999
Nucleus Shape Area 0.210 1390 of 5322 0.852
Nucleus Shape Eccentricity -1.782e-01 4365 of 5322 1.000
Nucleus Shape Form Factor -2.673e-01 4633 of 5322 0.898
Cell Tubulin Mean 0.036 3007 of 5322 0.997
Cell Tubulin Mean Frac 3 0.105 697 of 5322 0.999
Cell Actin Mean -1.057e-01 4475 of 5322 0.997
Cell Shape Area 0.046 3340 of 5322 0.998
( Reset Zoom )
Brightness
Contrast
Opacity
Brightness
Contrast
Opacity
Brightness
Contrast
Opacity
Brightness
Contrast
Opacity
Brightness
Contrast
Opacity

( Reset Zoom )
Brightness
Contrast
Opacity
Brightness
Contrast
Opacity
Brightness
Contrast
Opacity
Brightness
Contrast
Opacity
Brightness
Contrast
Opacity

MIT Central Accessability