TUFM

Gene symbol: TUFM
Gene: 7284
Uniprot Function: Promotes the GTP-dependent binding of aminoacyl-tRNA to the A-site of ribosomes during protein biosynthesis. Plays also a role in the regulation of autophagy and innate immunity. Recruits ATG5-ATG12 and NLRX1 at mitochondria and serves as a checkpoint of the RIG-I/DDX58-MAVS pathway. In turn, inhibits RLR-mediated type I interferon while promoting autophagy.
Mitotic Index 0.026
Interphase Cluster: #89 (25 genes)
Mitotic Cluster: #116 (23 genes)
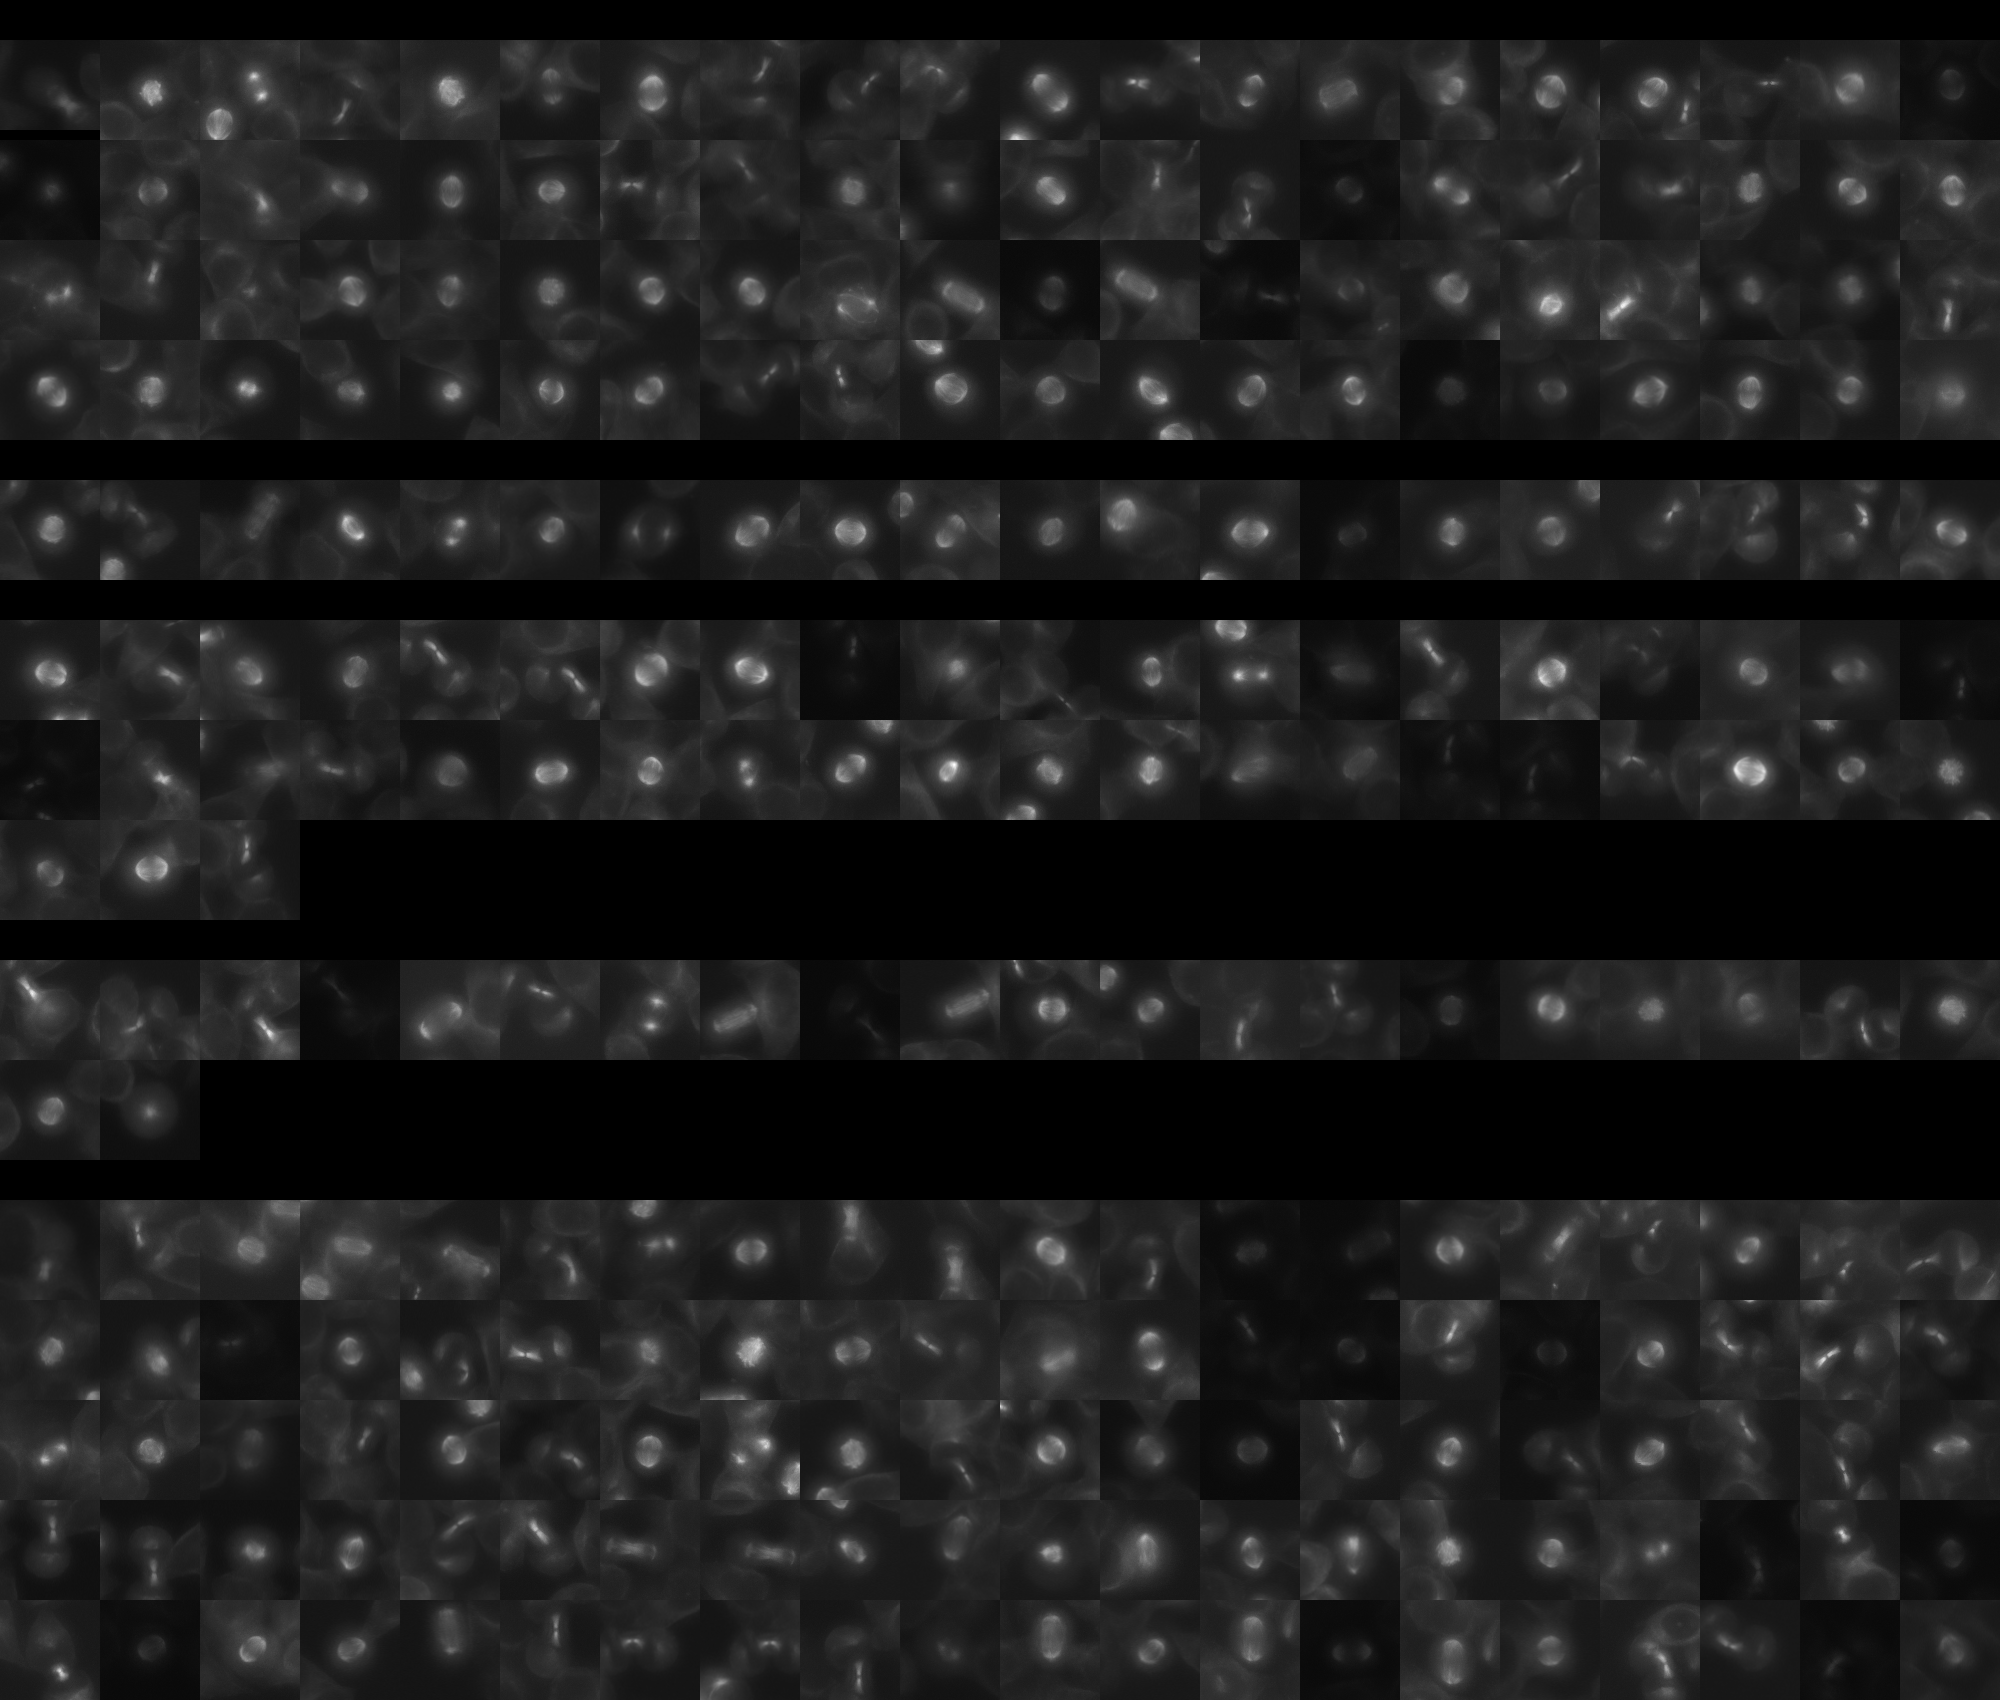
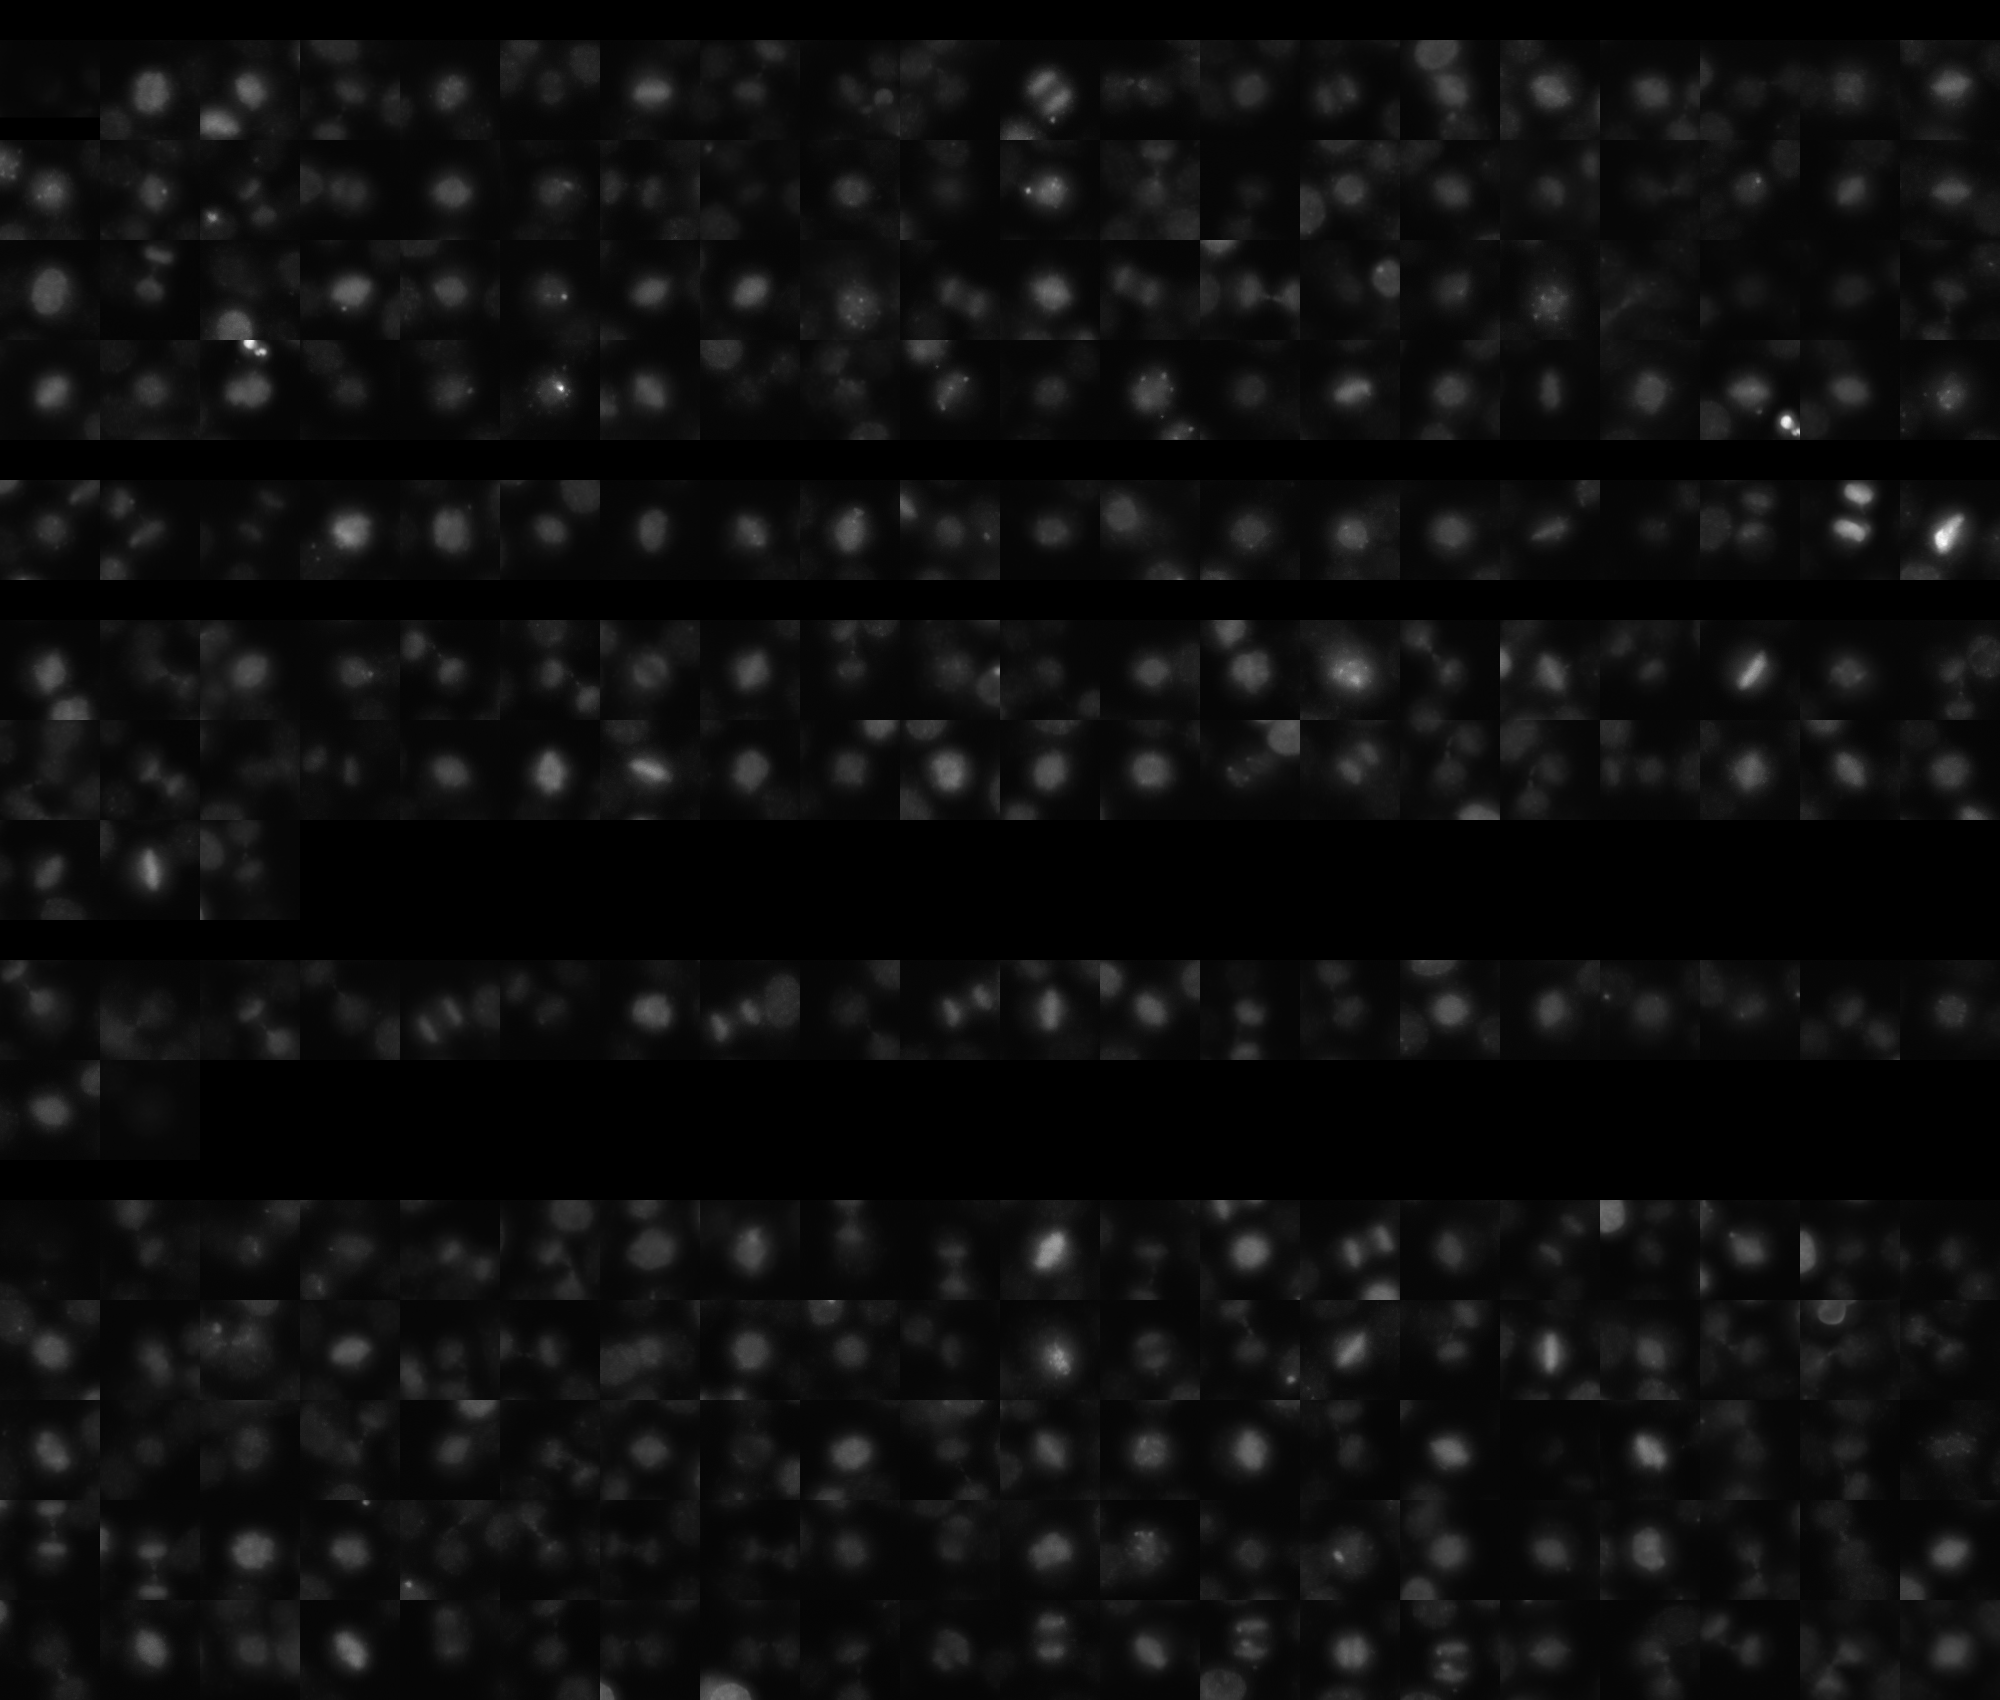
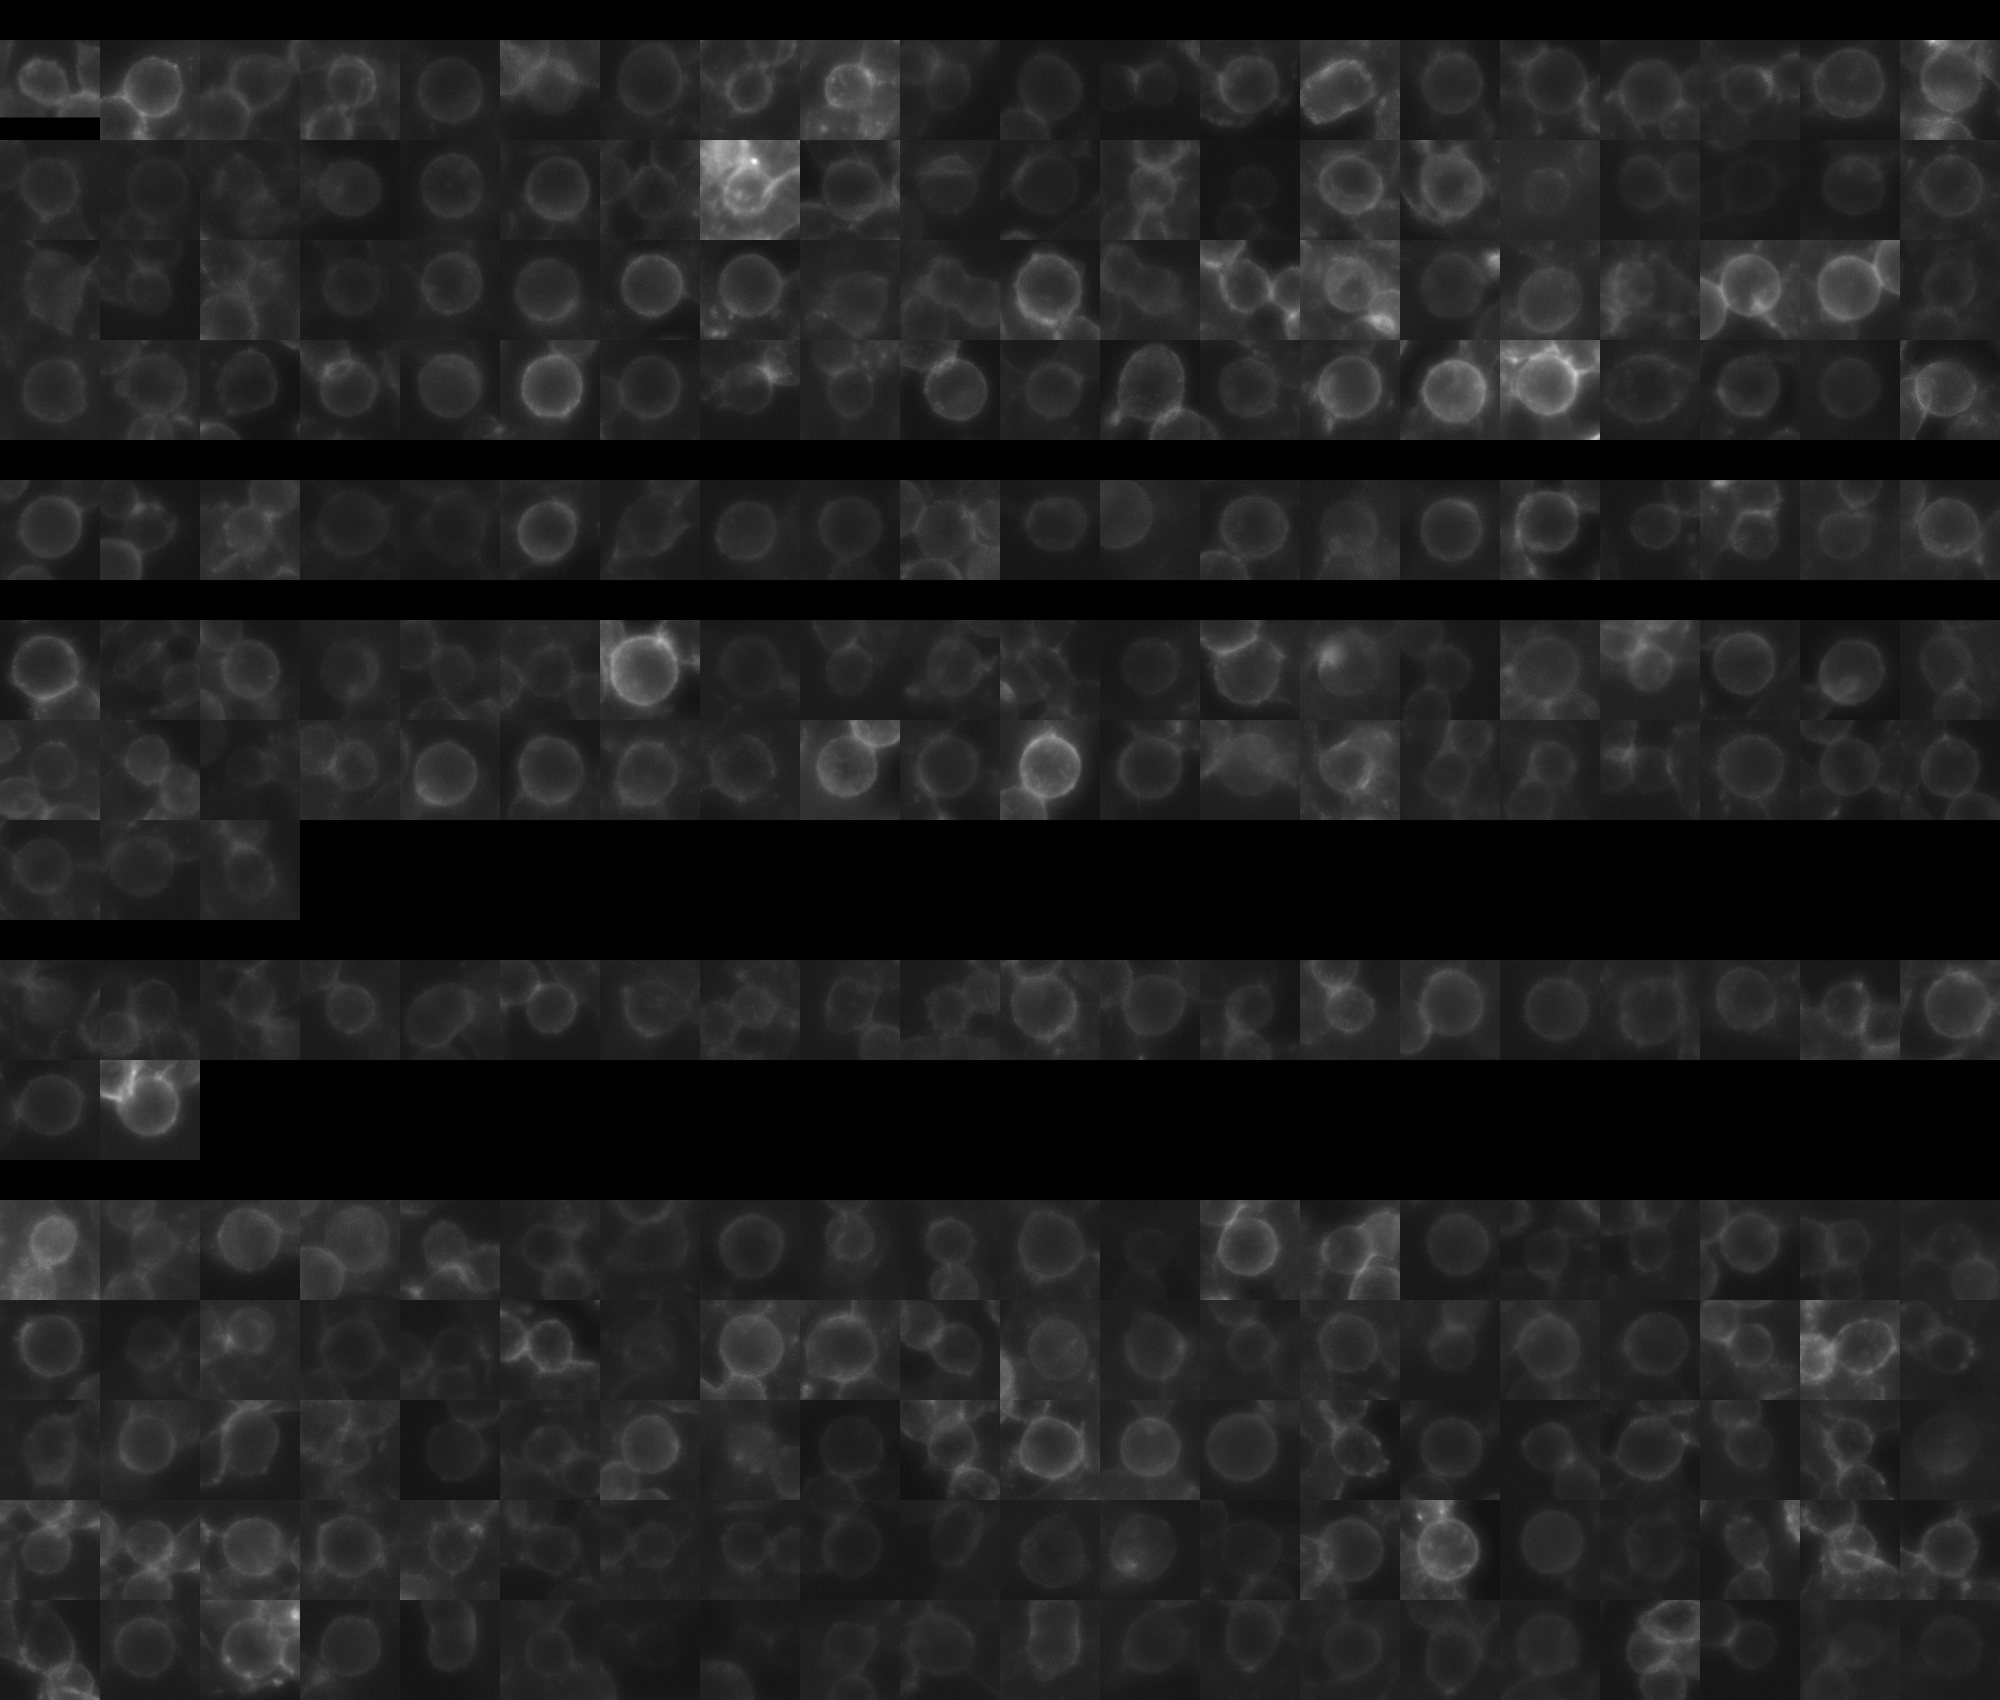
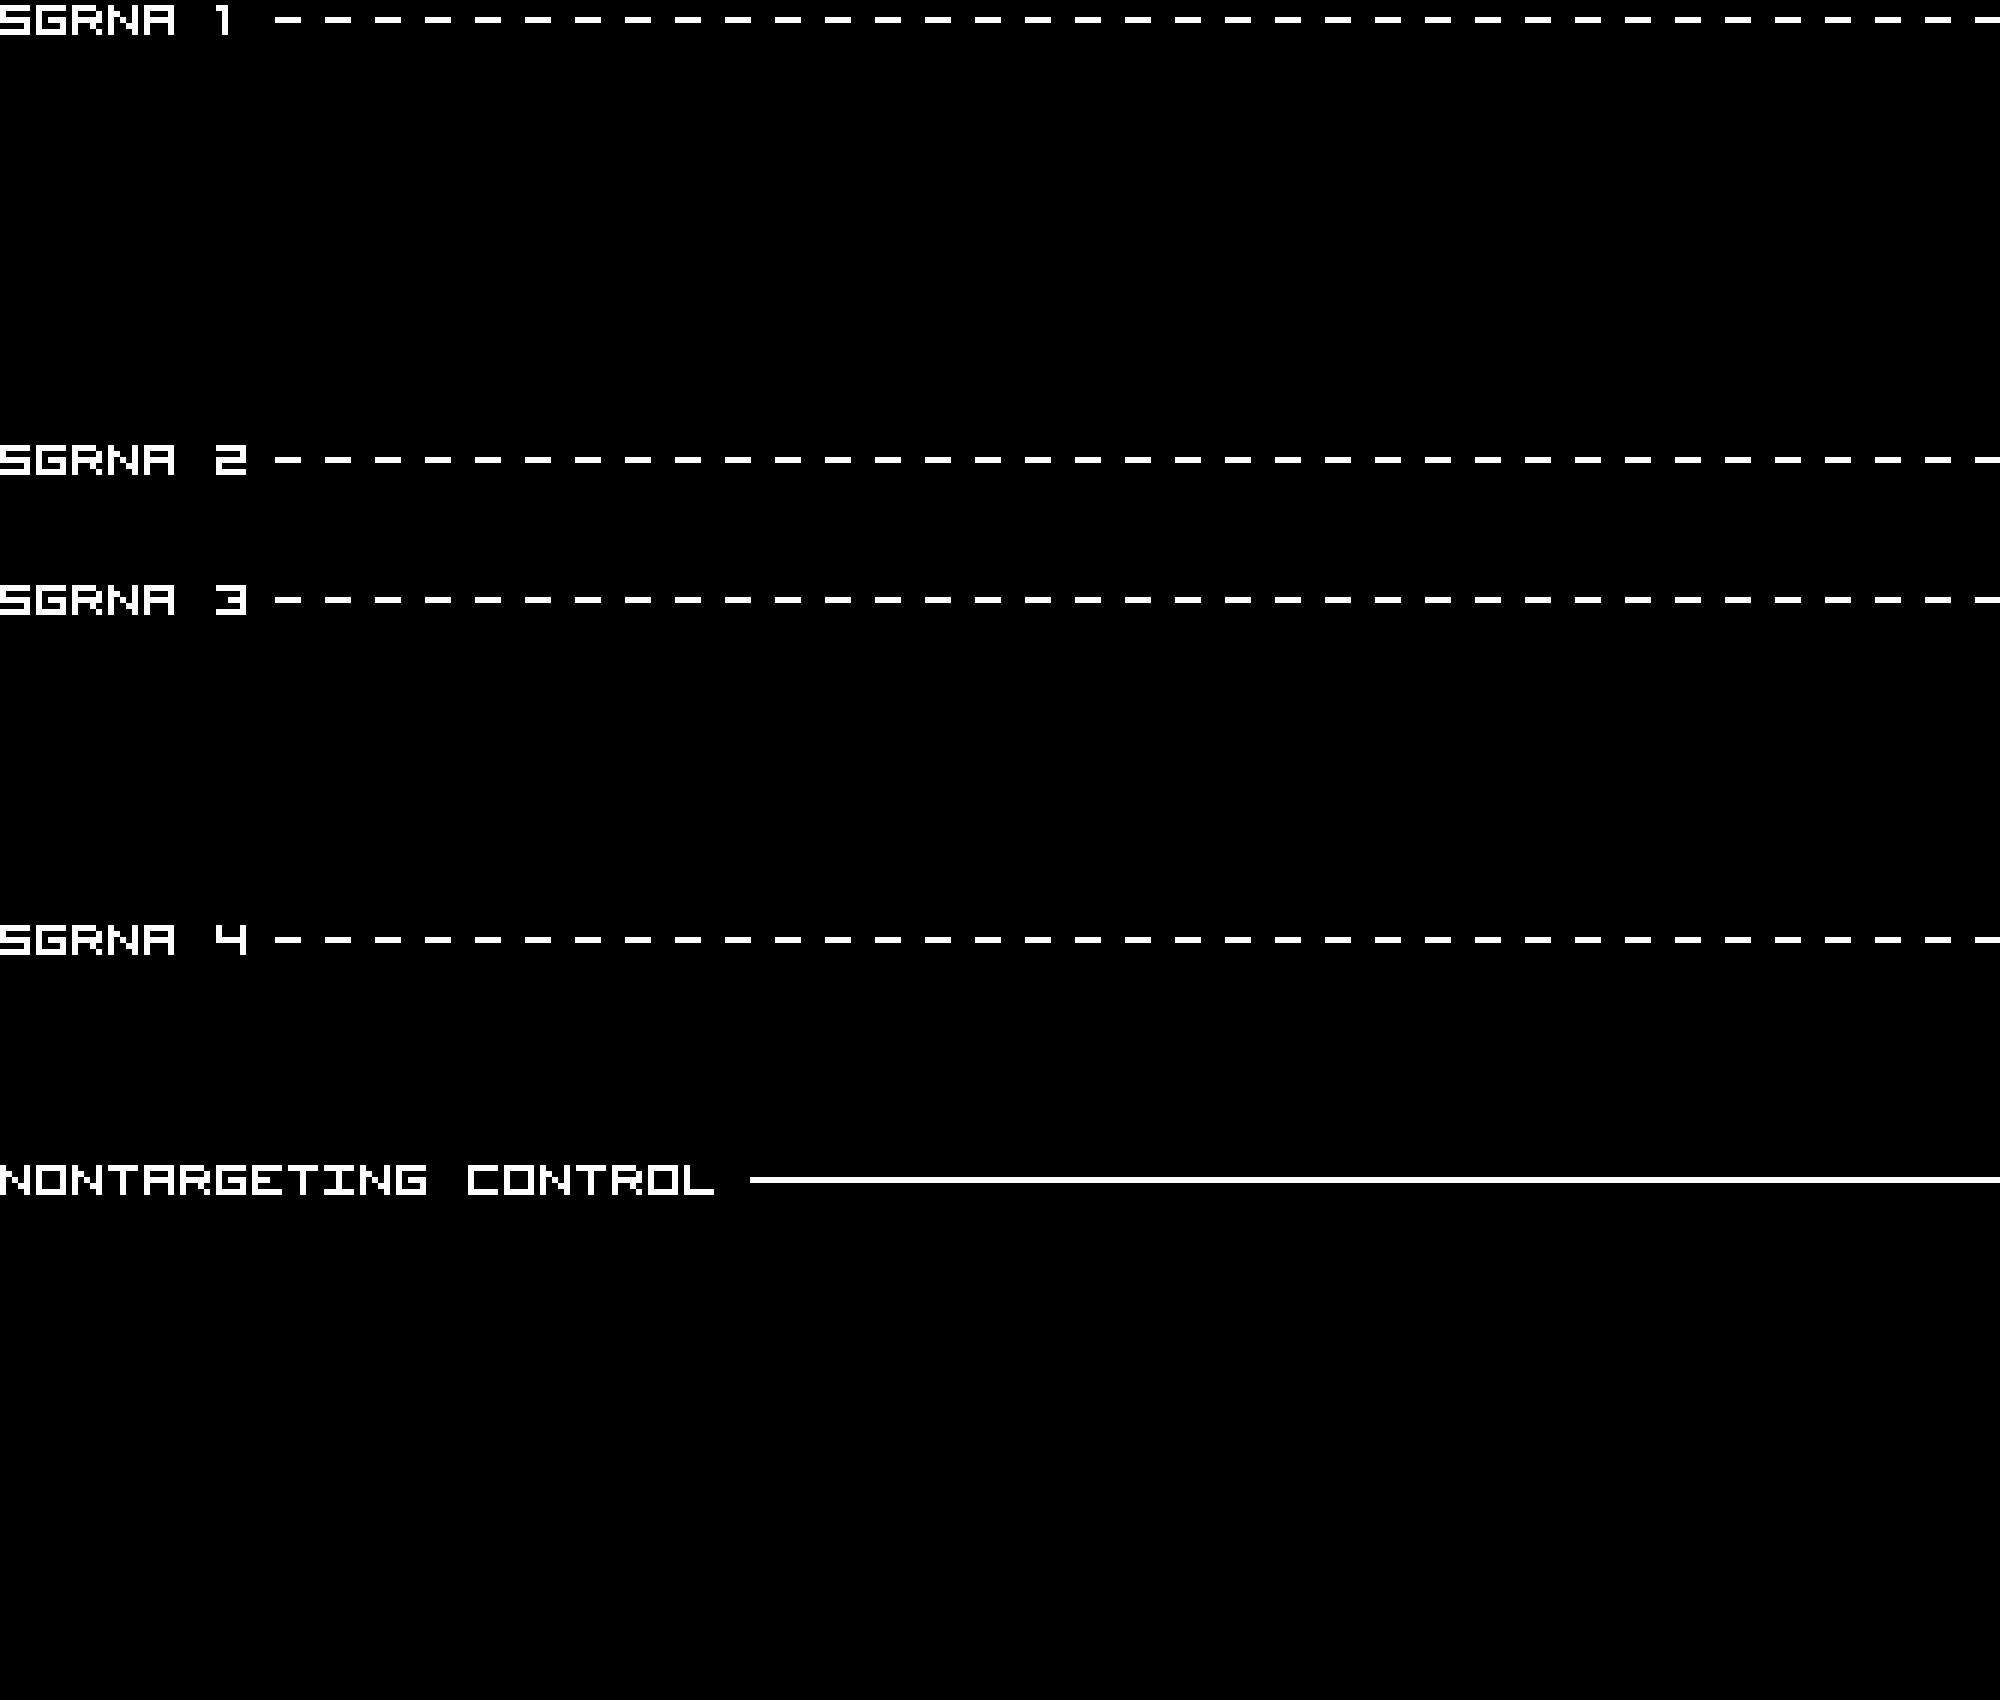
sgRNA 1: AGCAGAGCCTACGATGACTG (interphase cells: 2746, mitotic cells: 80)
sgRNA 2: GGGCGCGAGTATGACCACAA (interphase cells: 1028, mitotic cells: 20)
sgRNA 3: GTGACAGGTACACTAGAGCG (interphase cells: 1622, mitotic cells: 43)
sgRNA 4: TCGGGGTATCACCATCAATG (interphase cells: 787, mitotic cells: 22)

Interphase Cluster

Mitotic Cluster

Overview

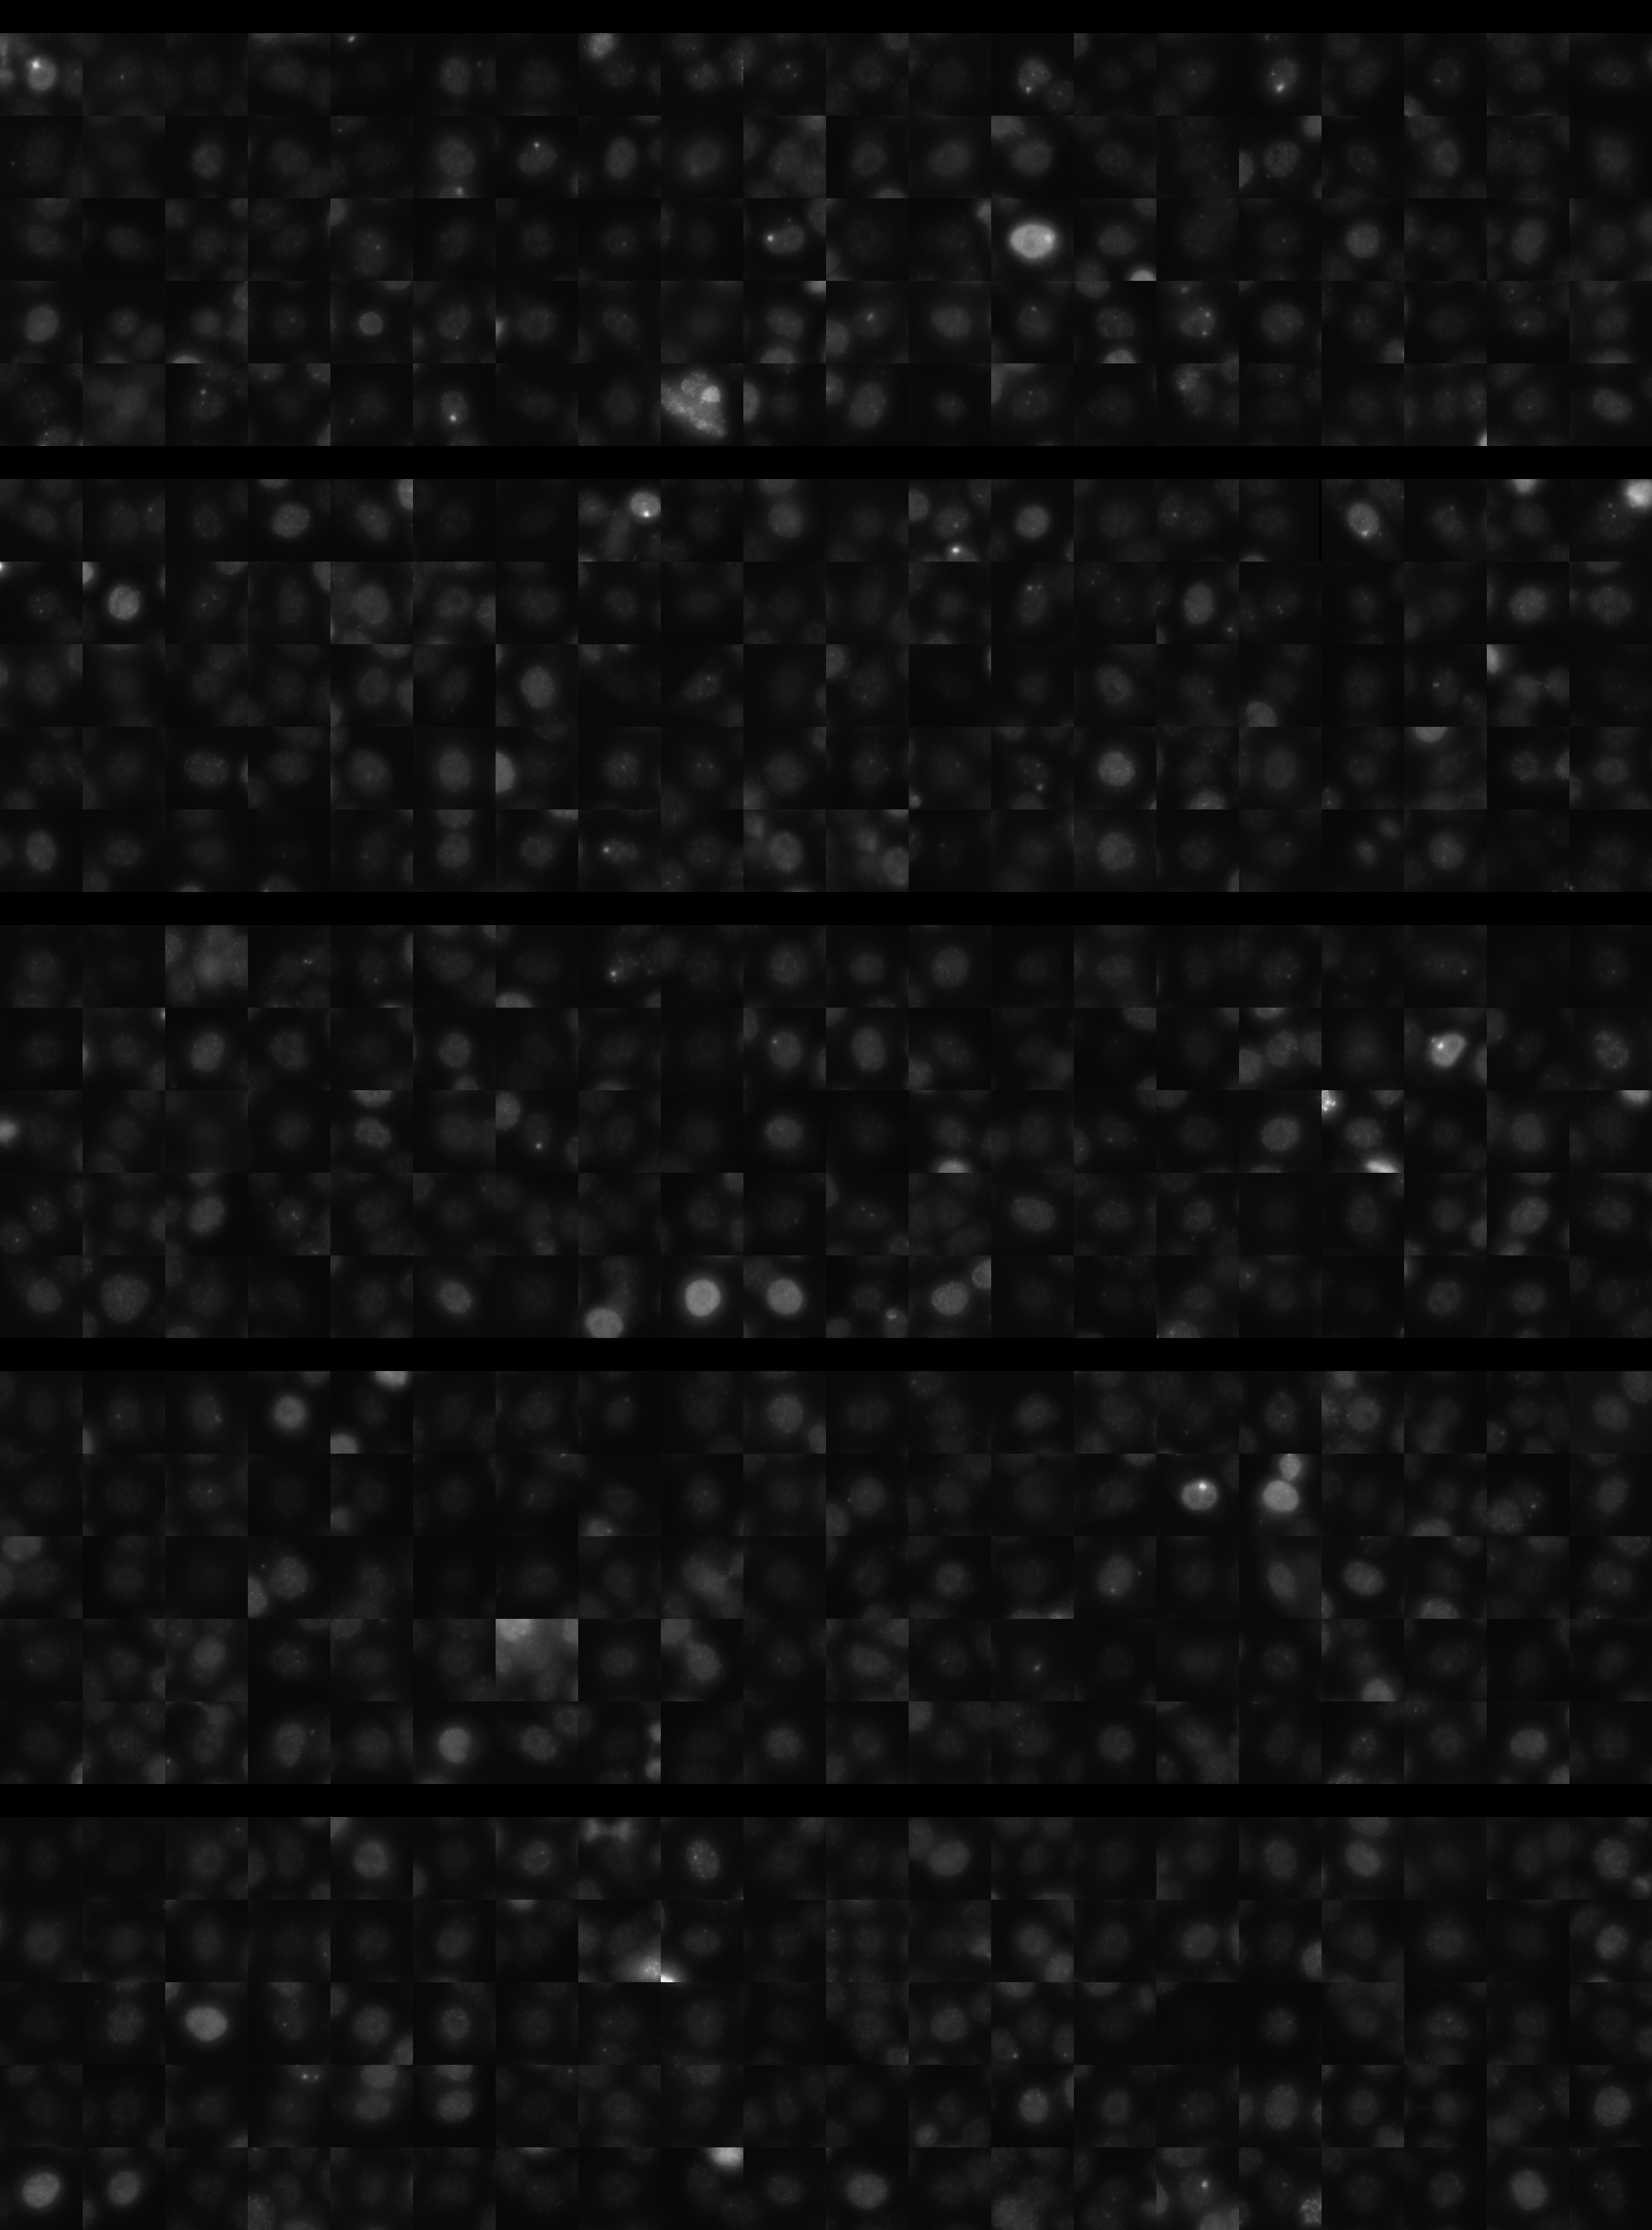
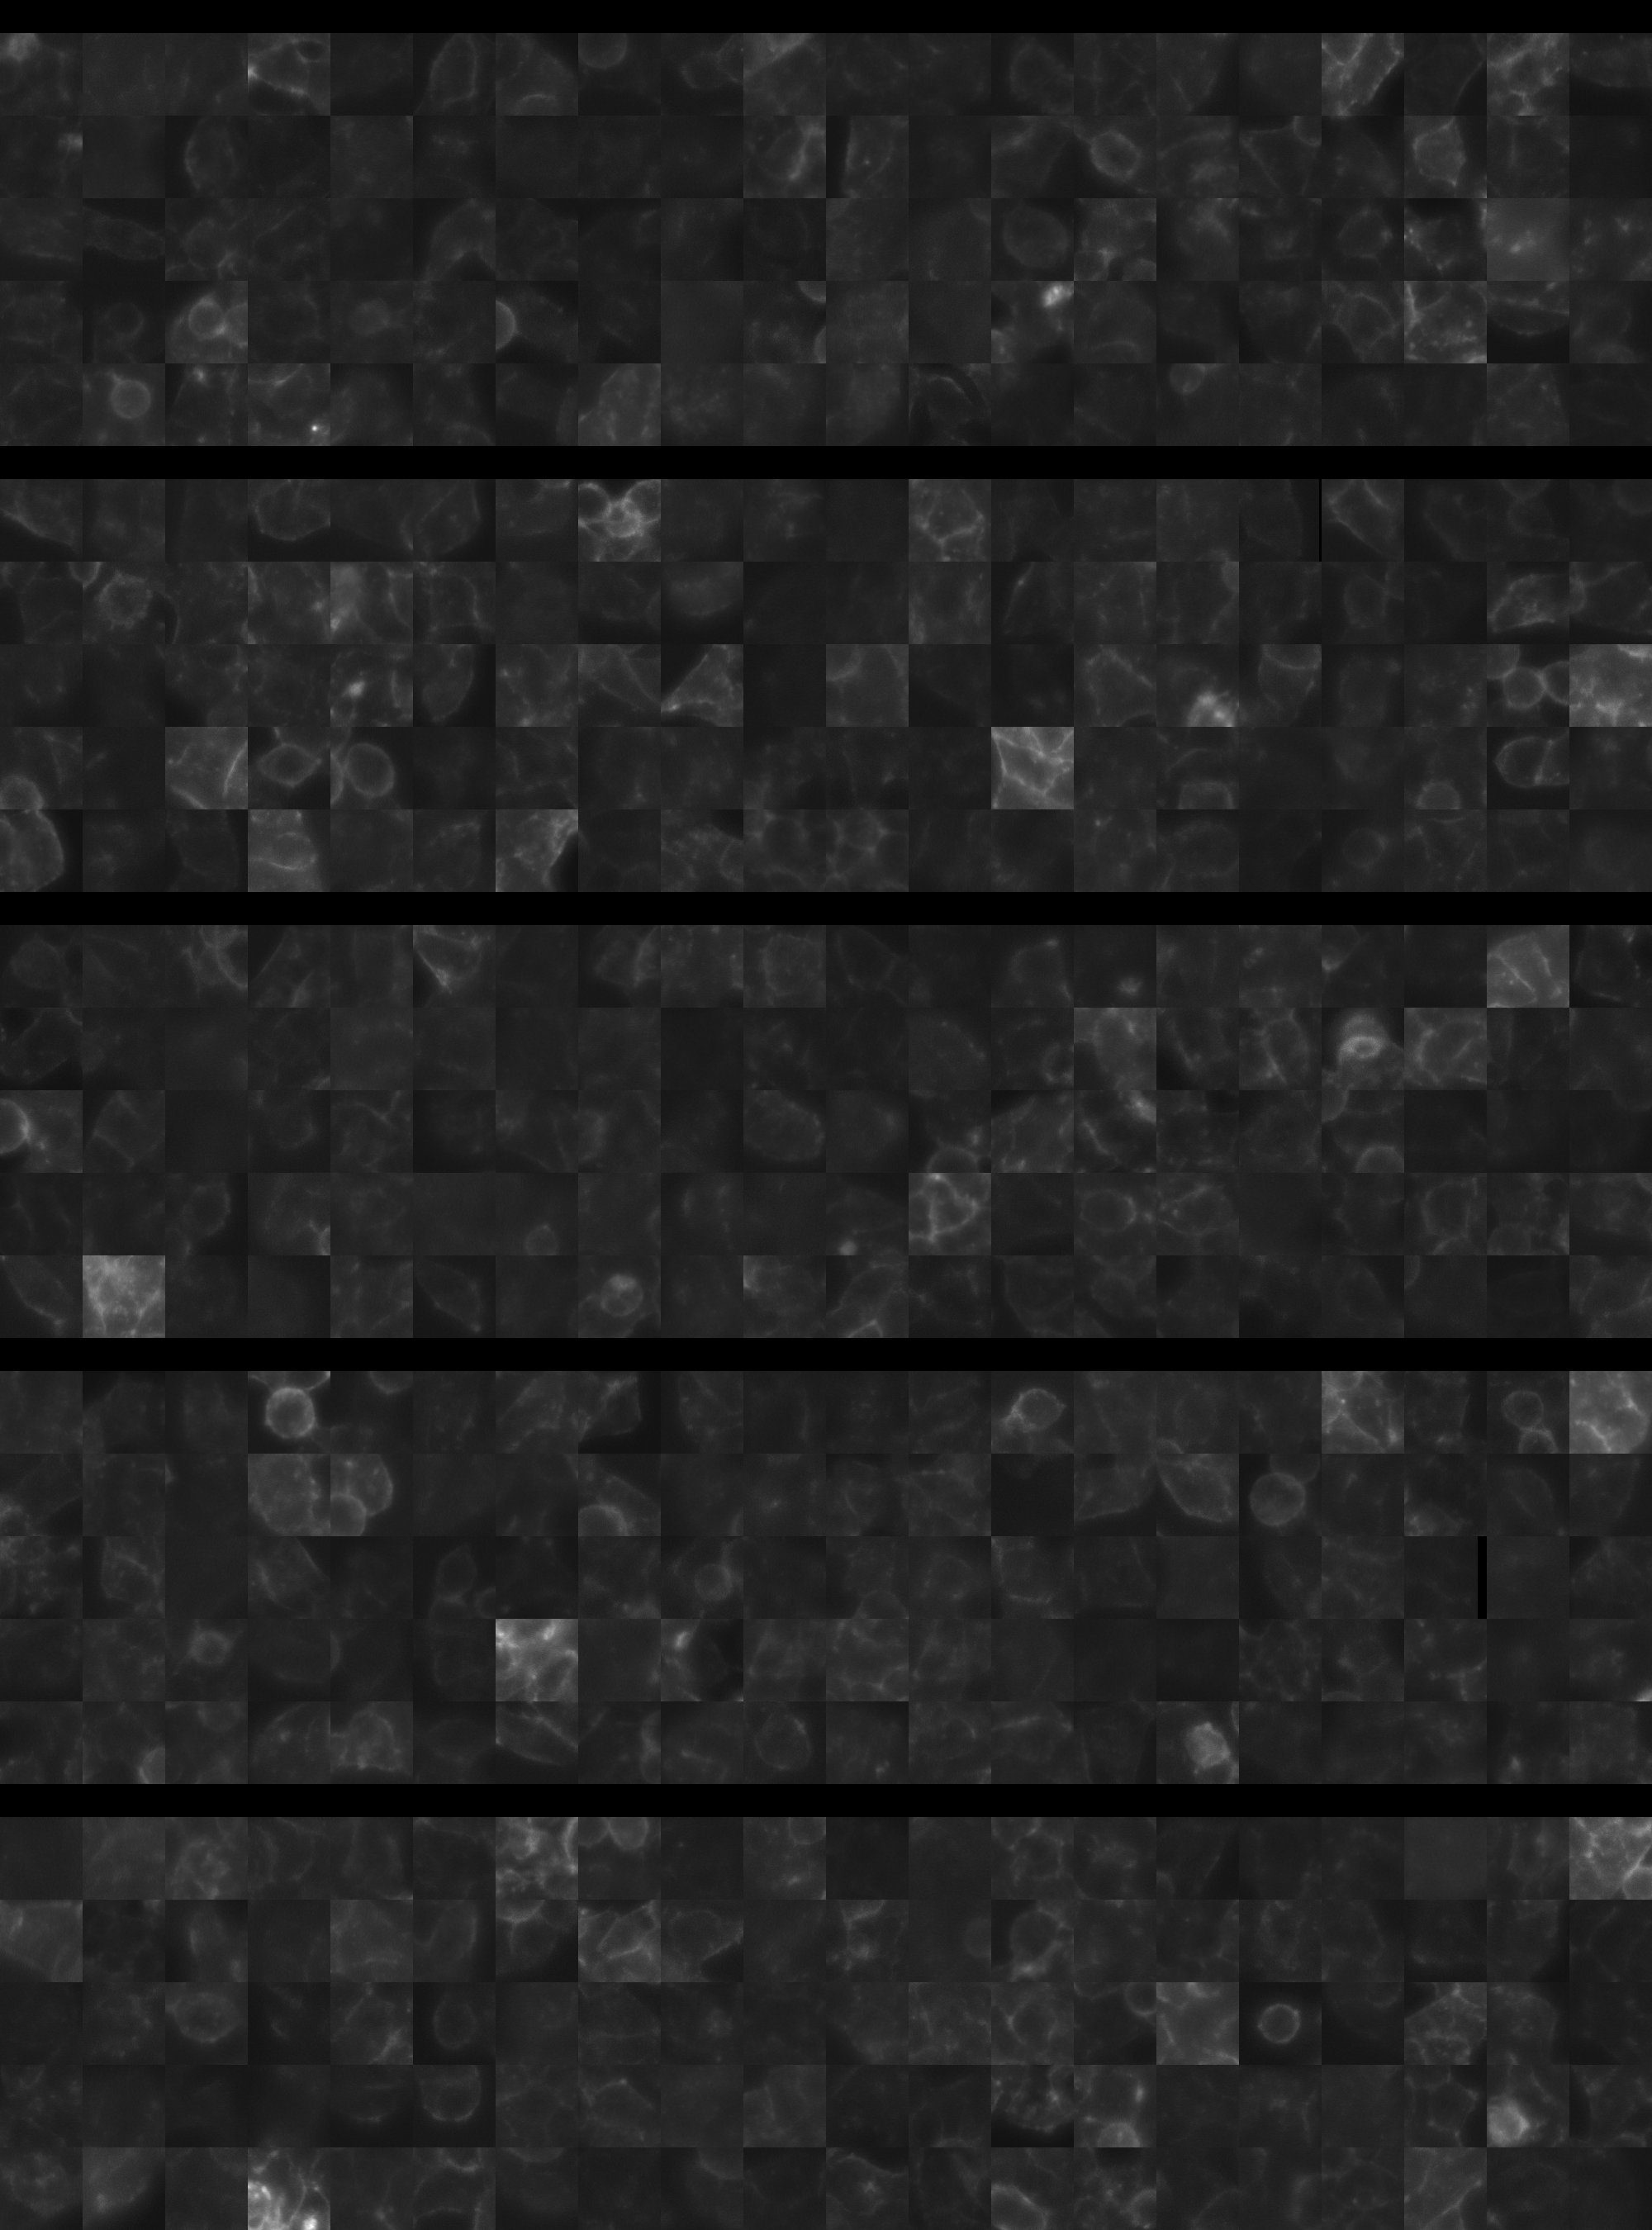
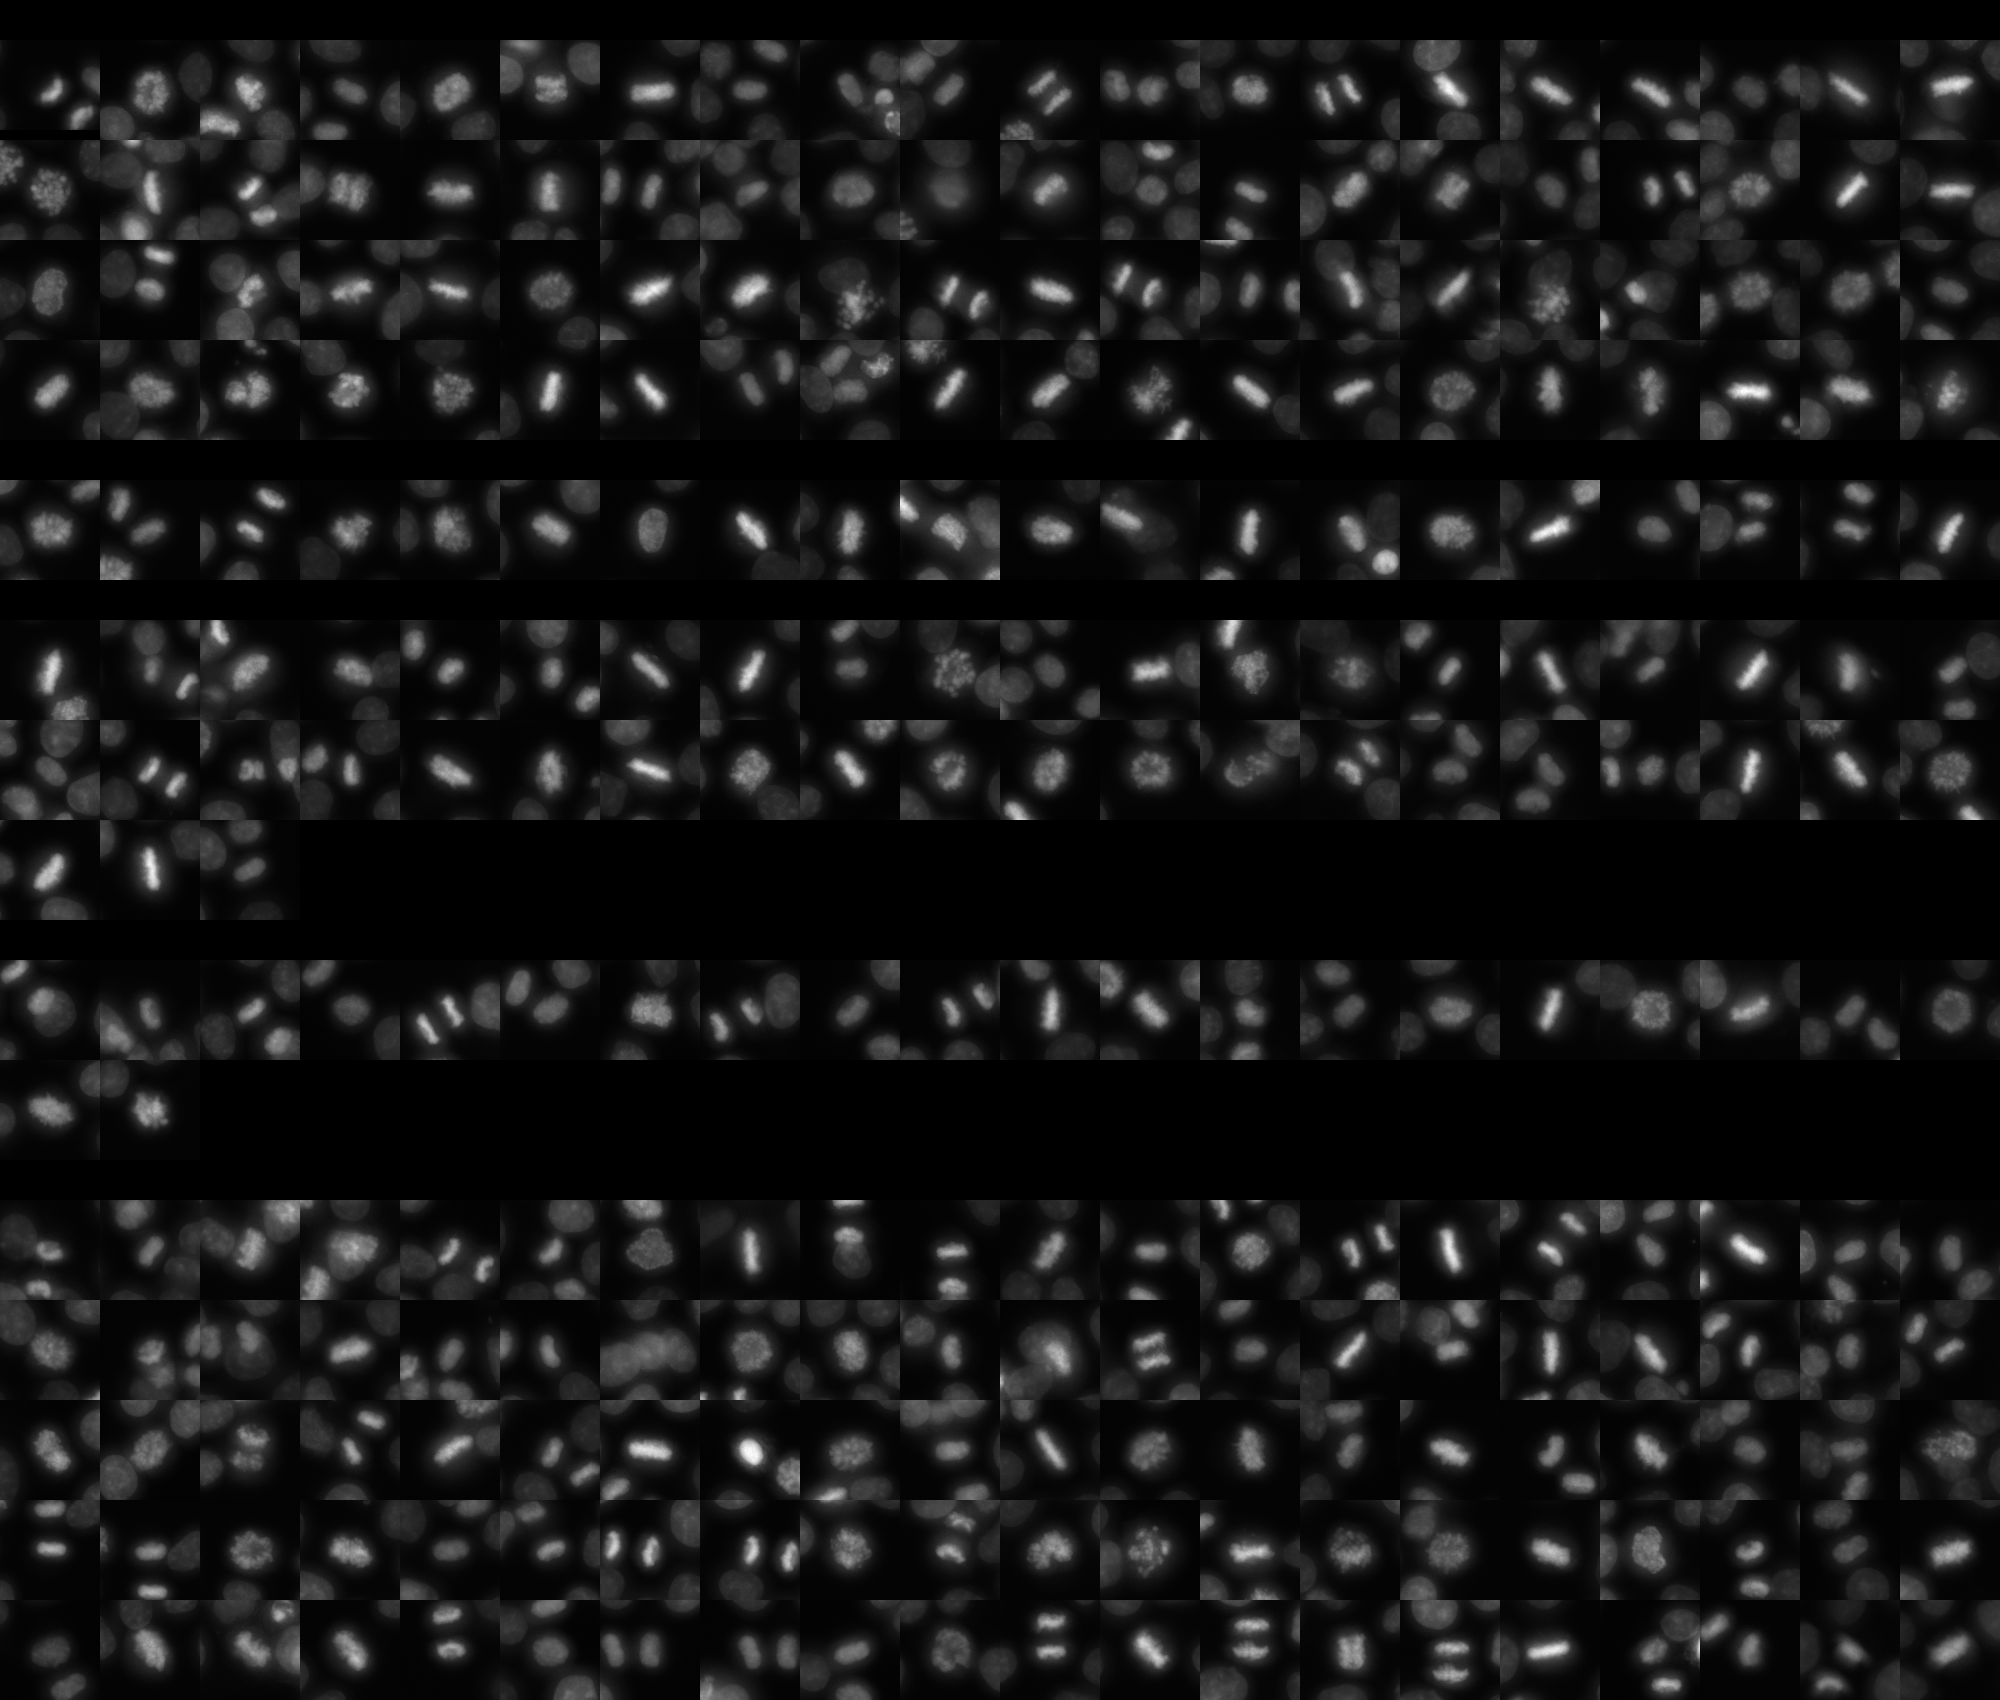
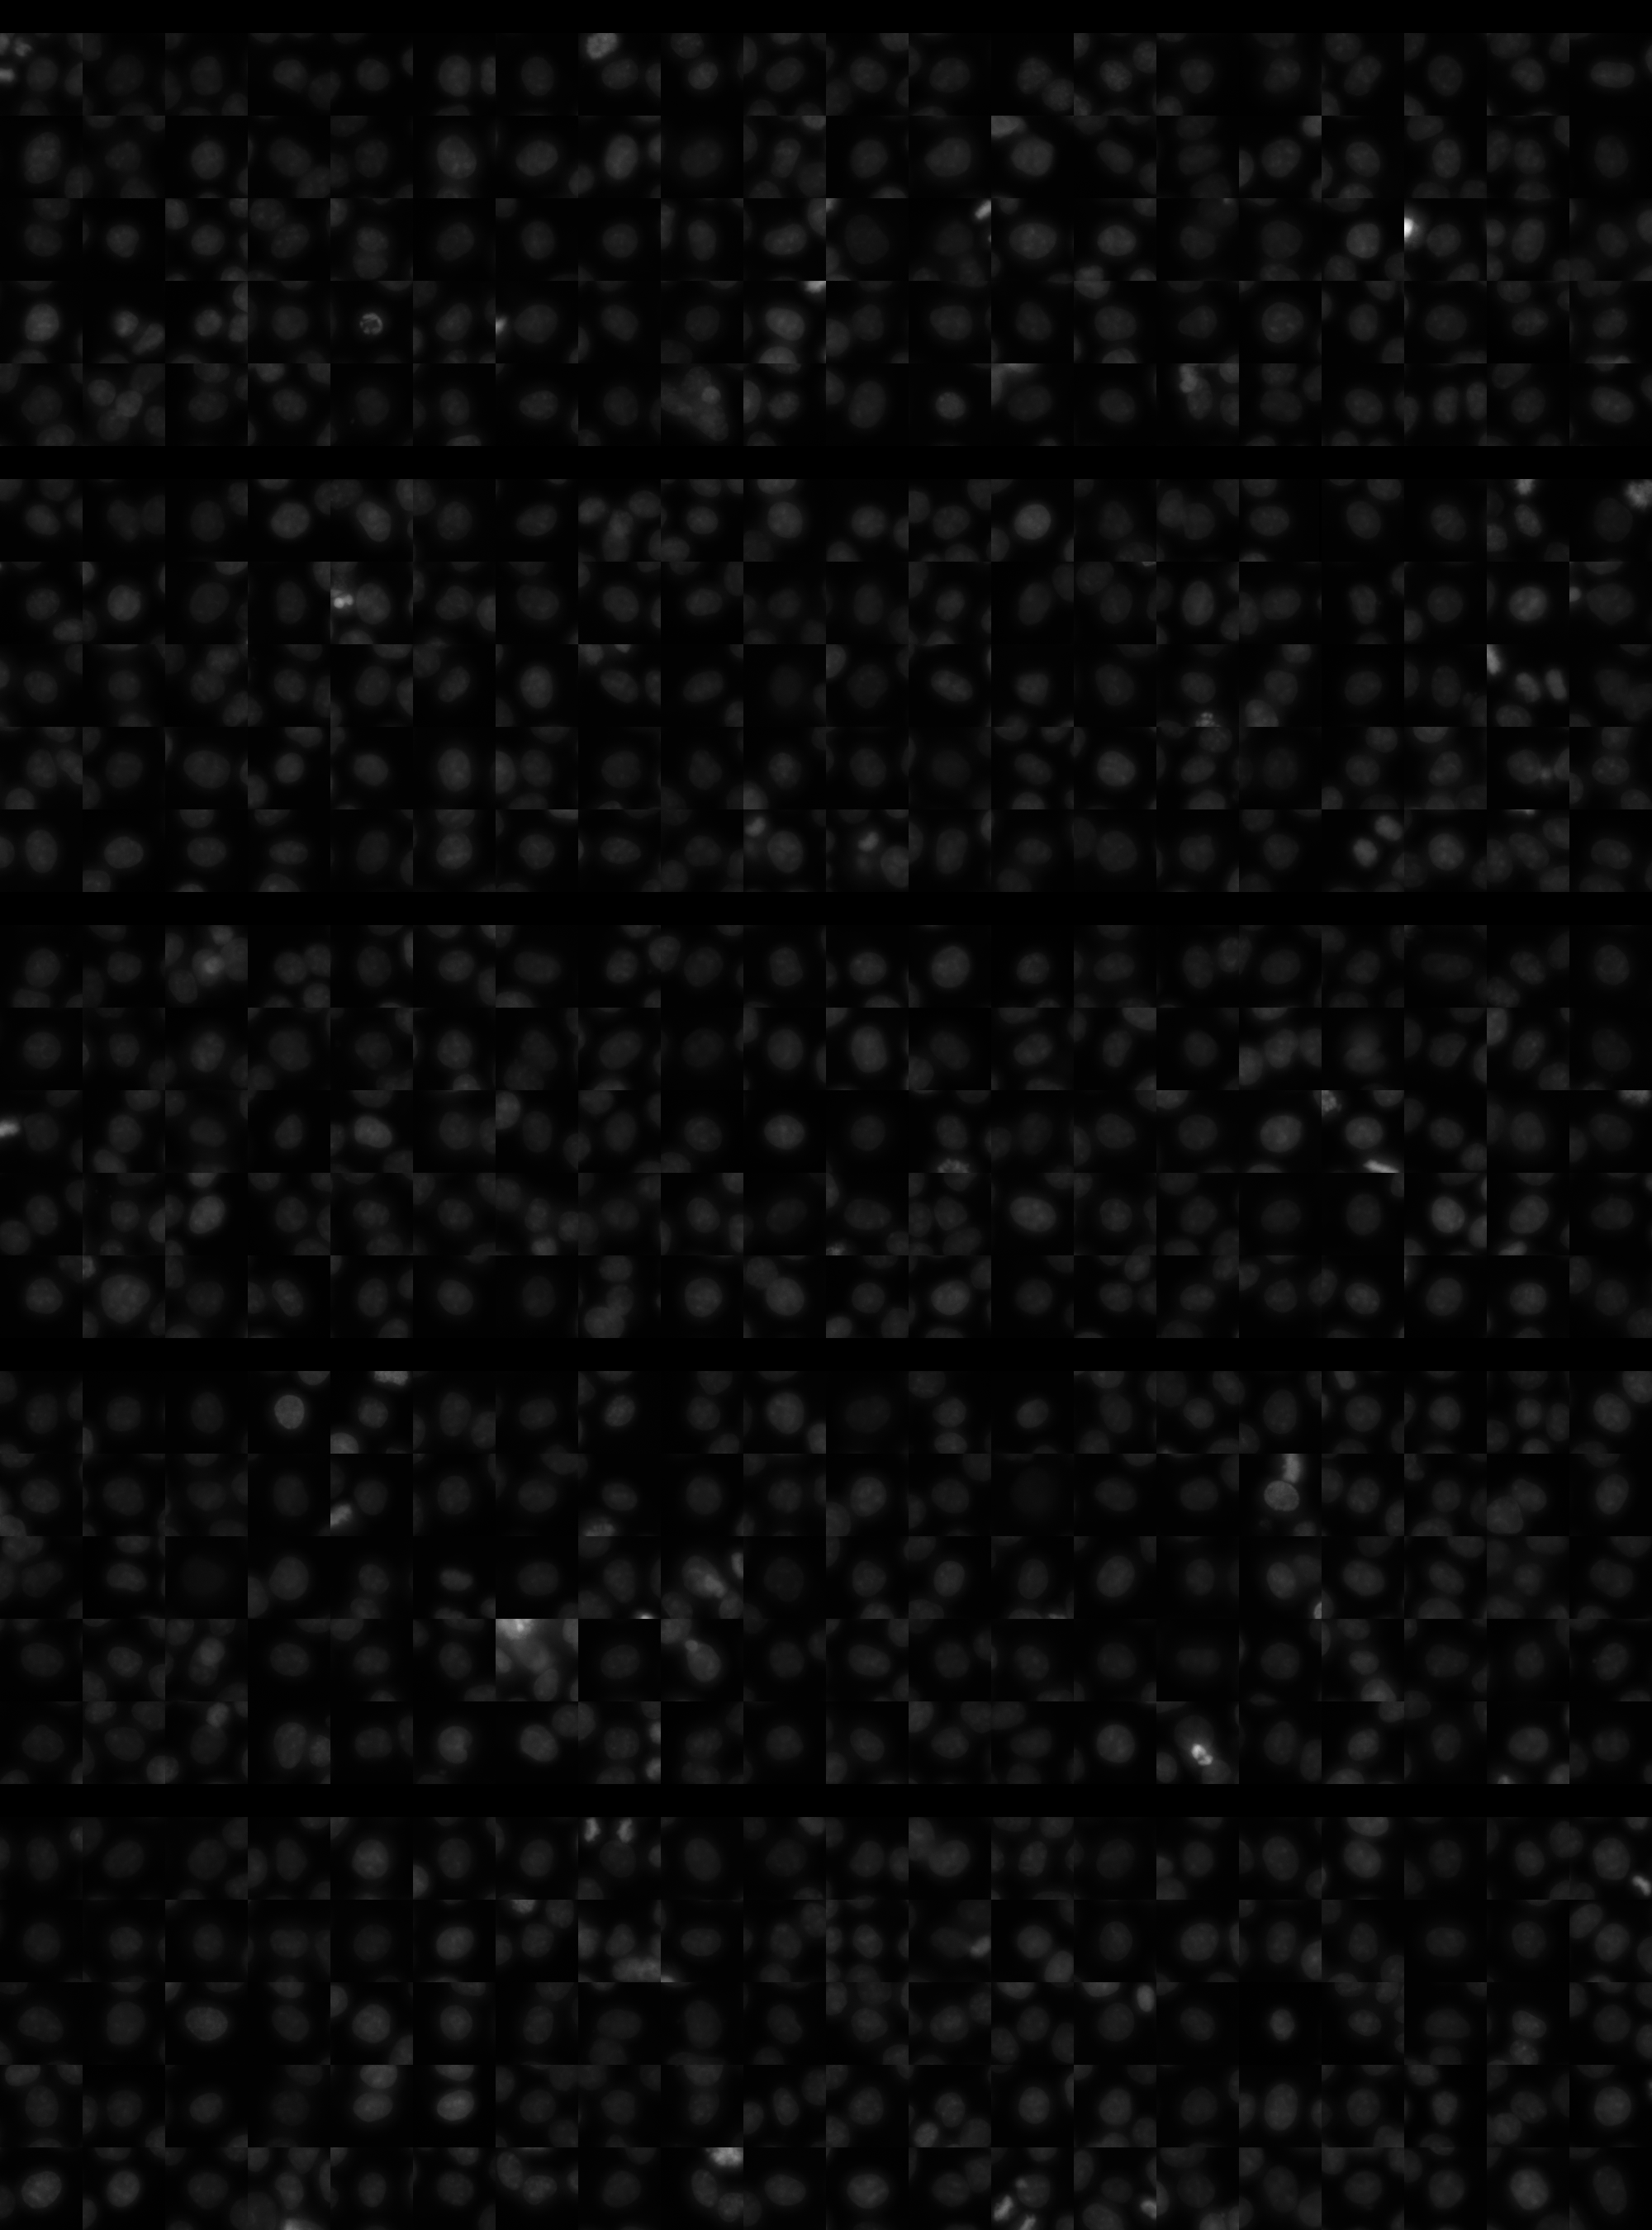
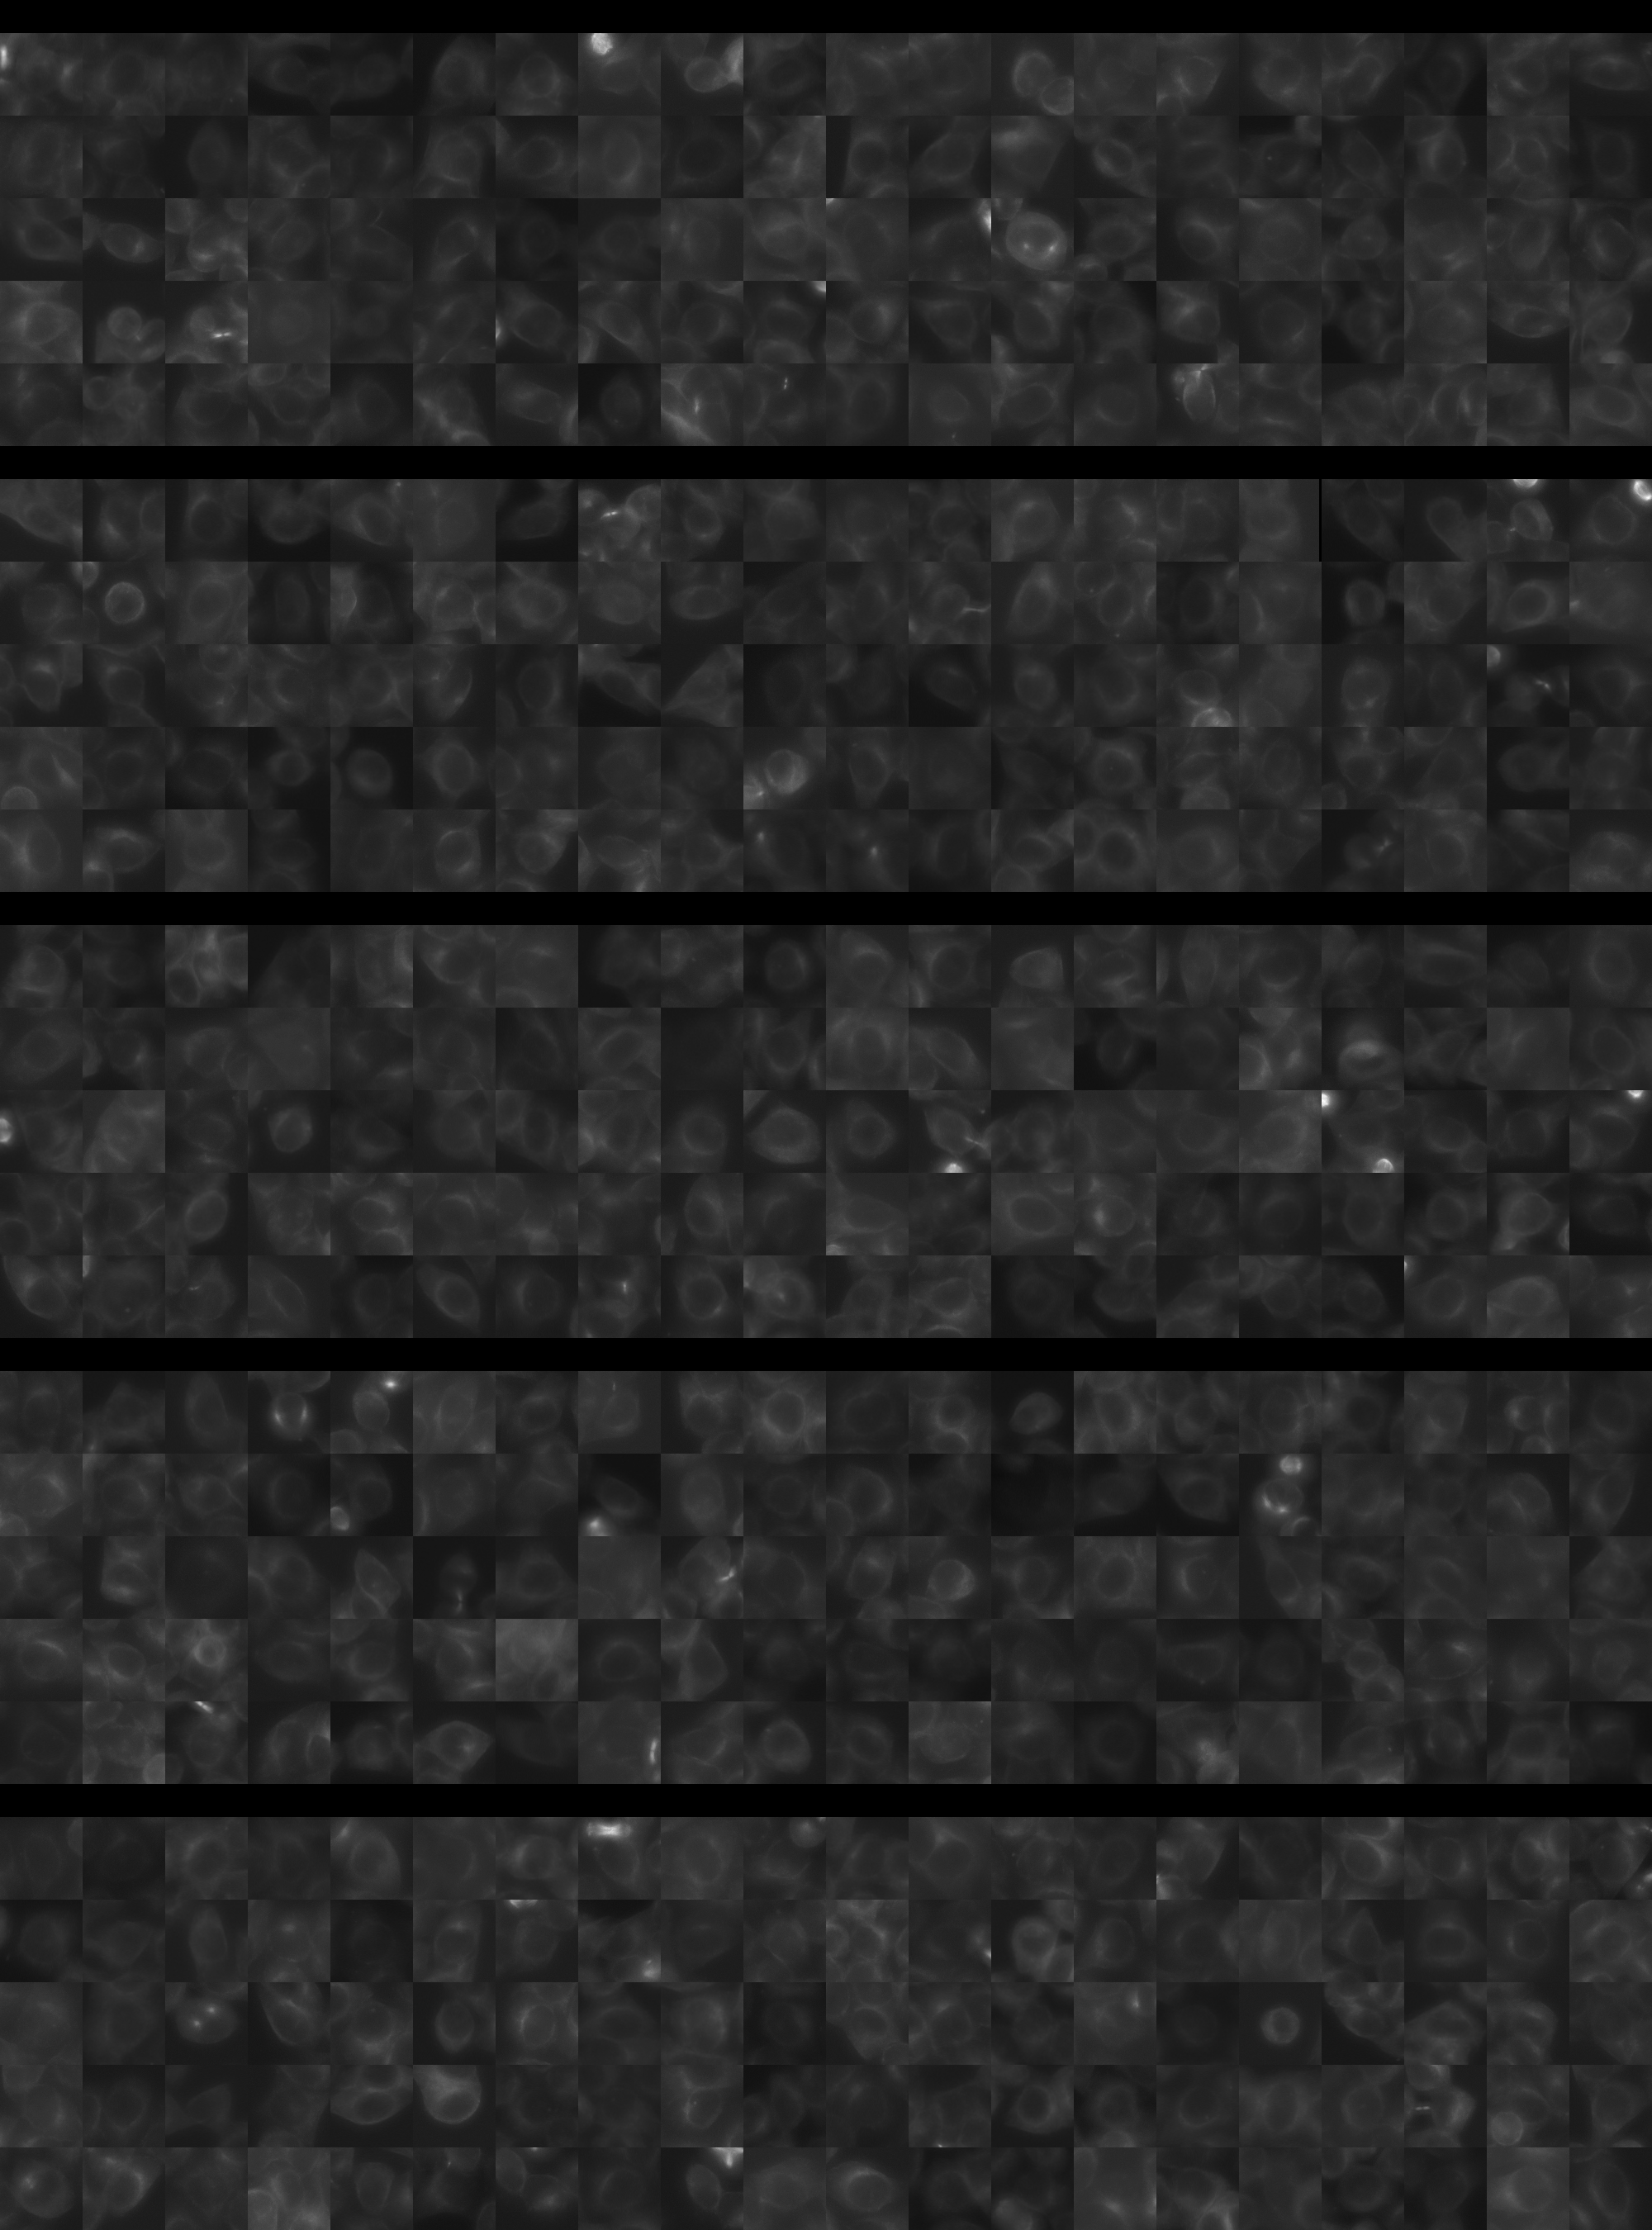
Each montage below shows randomly selected individual cell images for the same target gene separated by sgRNA, along with an example montage of cells expressing a non-targeting negative control sgRNA at the bottom. sgRNA labels in the montages correspond to the numbered sgRNA sequences in the gene info table above. The DNA (blue) and tubulin (green) channels are displayed by default, with gH2AX (grayscale) and actin (yellow) available using the check boxes. Channel brightness, contrast, and opacity are adjustable by clicking the arrow next to the channel name. When only one channel is selected, the display defaults to grayscale. Click the “Zoom” checkbox above the channel controls to enable image zooming (via scrolling) and panning (via click-and-drag).

The cell boxes displayed for this gene are square, 30.36 μm per side for the interphase montage and 30.36 μm per side for the mitotic montage.
Features

Interphase Score Rank FDR q-value
Nucleus DNA Integrated -7.779e-03 3505 of 5322 0.907
Nucleus DNA Mean -7.279e-02 4156 of 5322 0.083
Nucleus gH2AX Mean 0.057 3277 of 5322 0.139
Nucleus DNA - gH2AX Correlation -2.064e-02 1417 of 5322 0.477
Nucleus Shape Area 0.046 1767 of 5322 0.470
Nucleus Shape Eccentricity 0.062 640 of 5322 0.097
Nucleus Shape Form Factor -4.870e-02 2618 of 5322 0.227
Nucleus Shape Solidity -4.357e-02 2410 of 5322 0.216
Cell DNA Mass Displacement 0.029 2349 of 5322 0.659
Cell Tubulin Mean -1.787e-02 3462 of 5322 0.795
Cell Tubulin Mass Displacement 0.025 1532 of 5322 0.682
Cell Actin Mean 0.041 1783 of 5322 0.430
Cell Tubulin - Actin Correlation -1.307e-02 4232 of 5322 0.815
Cell DNA - Tubulin Correlation -1.210e-02 4241 of 5322 0.796
Cell Shape Area 0.048 1604 of 5322 0.515
Cell Shape Eccentricity -5.565e-03 4087 of 5322 0.979
Mitotic Score Rank FDR q-value
Nucleus DNA Integrated 0.074 2855 of 5322 0.973
Nucleus DNA Mean -8.958e-02 4176 of 5322 1.000
Nucleus DNA Mass Displacement 0.002 3495 of 5322 0.999
Nucleus DNA Mean Frac 3 -6.042e-03 3222 of 5322 1.000
Nucleus gH2AX Mean 0.103 1575 of 5322 1.000
Nucleus gH2AX Mean Frac 0 0.221 261 of 5322 1.000
Nucleus Tubulin Mean Frac 0 -3.917e-02 4043 of 5322 0.999
Nucleus Tubulin Mean Edge 0.070 2260 of 5322 0.999
Nucleus Tubulin Std Edge 0.020 2289 of 5322 0.999
Nucleus Shape Area 0.068 3080 of 5322 0.990
Nucleus Shape Eccentricity 0.110 775 of 5322 1.000
Nucleus Shape Form Factor -1.936e-02 1652 of 5322 0.998
Cell Tubulin Mean 0.060 2639 of 5322 0.997
Cell Tubulin Mean Frac 3 -6.587e-02 2529 of 5322 0.999
Cell Actin Mean -1.017e-01 4437 of 5322 0.997
Cell Shape Area 0.066 3070 of 5322 0.998
( Reset Zoom )
Brightness
Contrast
Opacity
Brightness
Contrast
Opacity
Brightness
Contrast
Opacity
Brightness
Contrast
Opacity
Brightness
Contrast
Opacity

( Reset Zoom )
Brightness
Contrast
Opacity
Brightness
Contrast
Opacity
Brightness
Contrast
Opacity
Brightness
Contrast
Opacity
Brightness
Contrast
Opacity

MIT Central Accessability