TTC1

Gene symbol: TTC1
Gene: 7265
Uniprot Function:
Mitotic Index 0.0223
Interphase Cluster: #89 (25 genes)
Mitotic Cluster: #93 (24 genes)
sgRNA 1: AGAGAGCACTAGACTAAAGG (interphase cells: 2259, mitotic cells: 50)
sgRNA 2: CTGCAGTGCCTCATTTGAGG (interphase cells: 1438, mitotic cells: 28)
sgRNA 3: TGATGAGGCCCATCTCCAGG (interphase cells: 1577, mitotic cells: 34)
sgRNA 4: TTCCCAGAGTAAGCTGCTCA (interphase cells: 1302, mitotic cells: 38)

Interphase Cluster

Mitotic Cluster

Overview

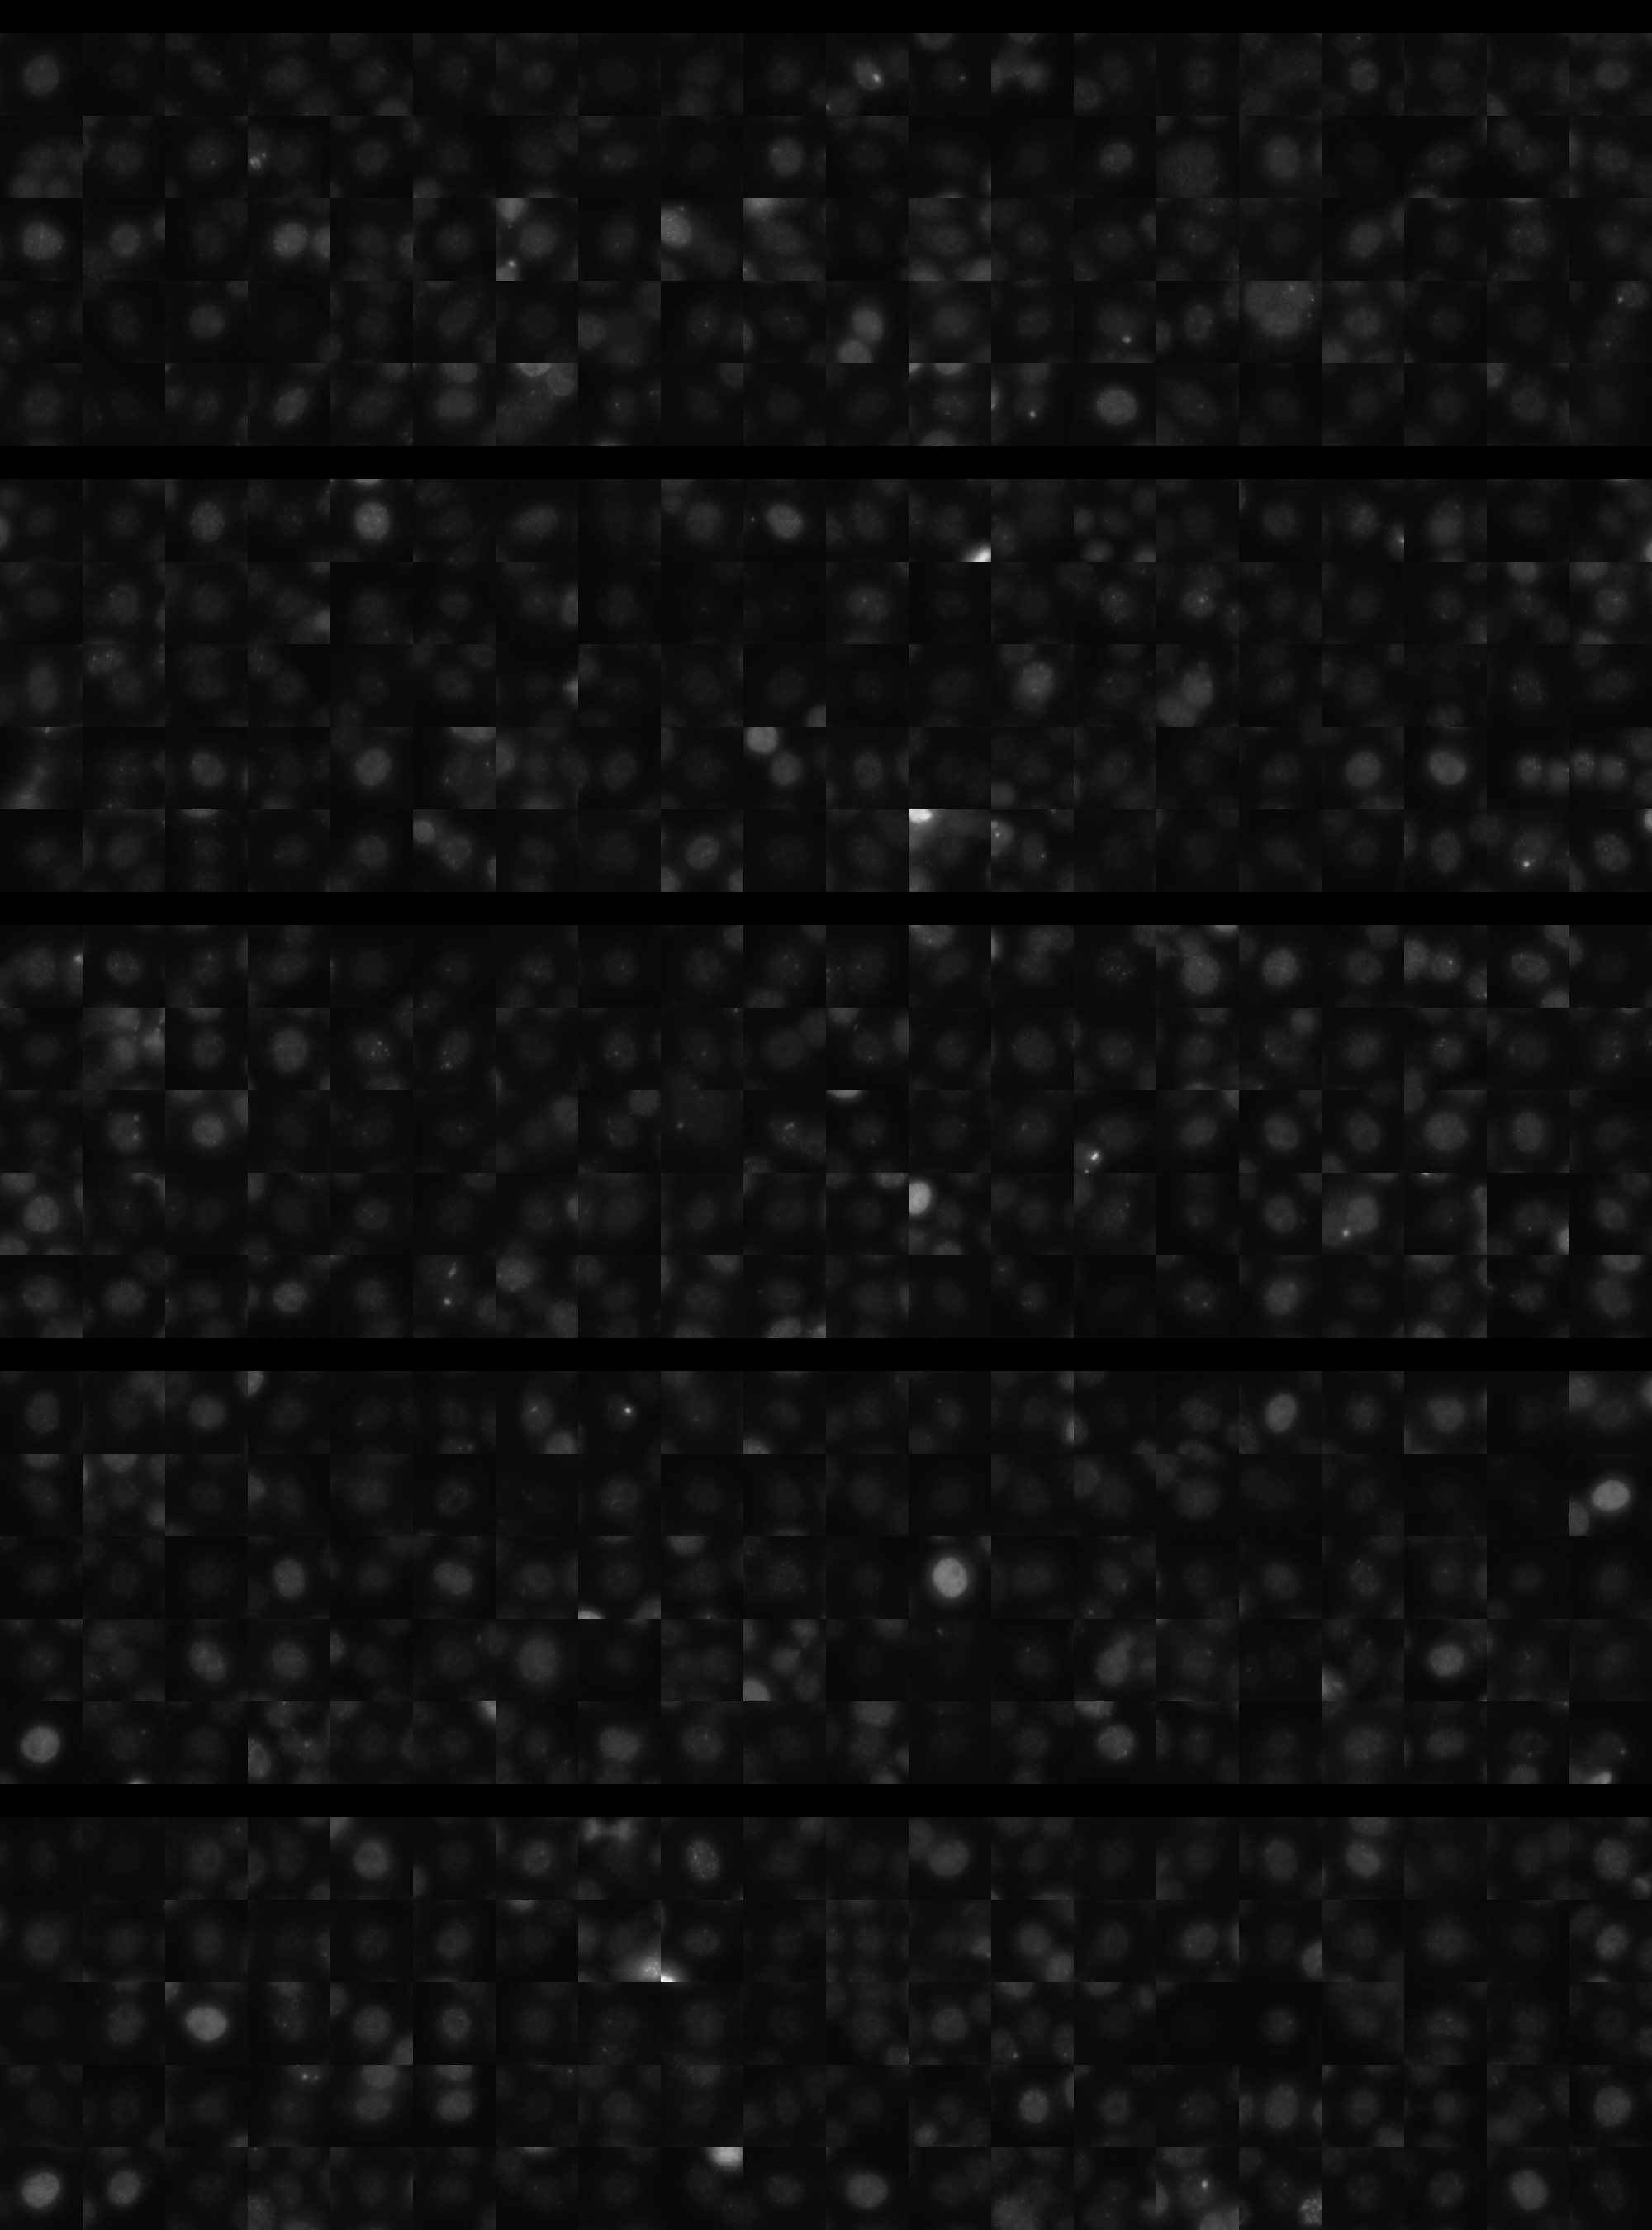
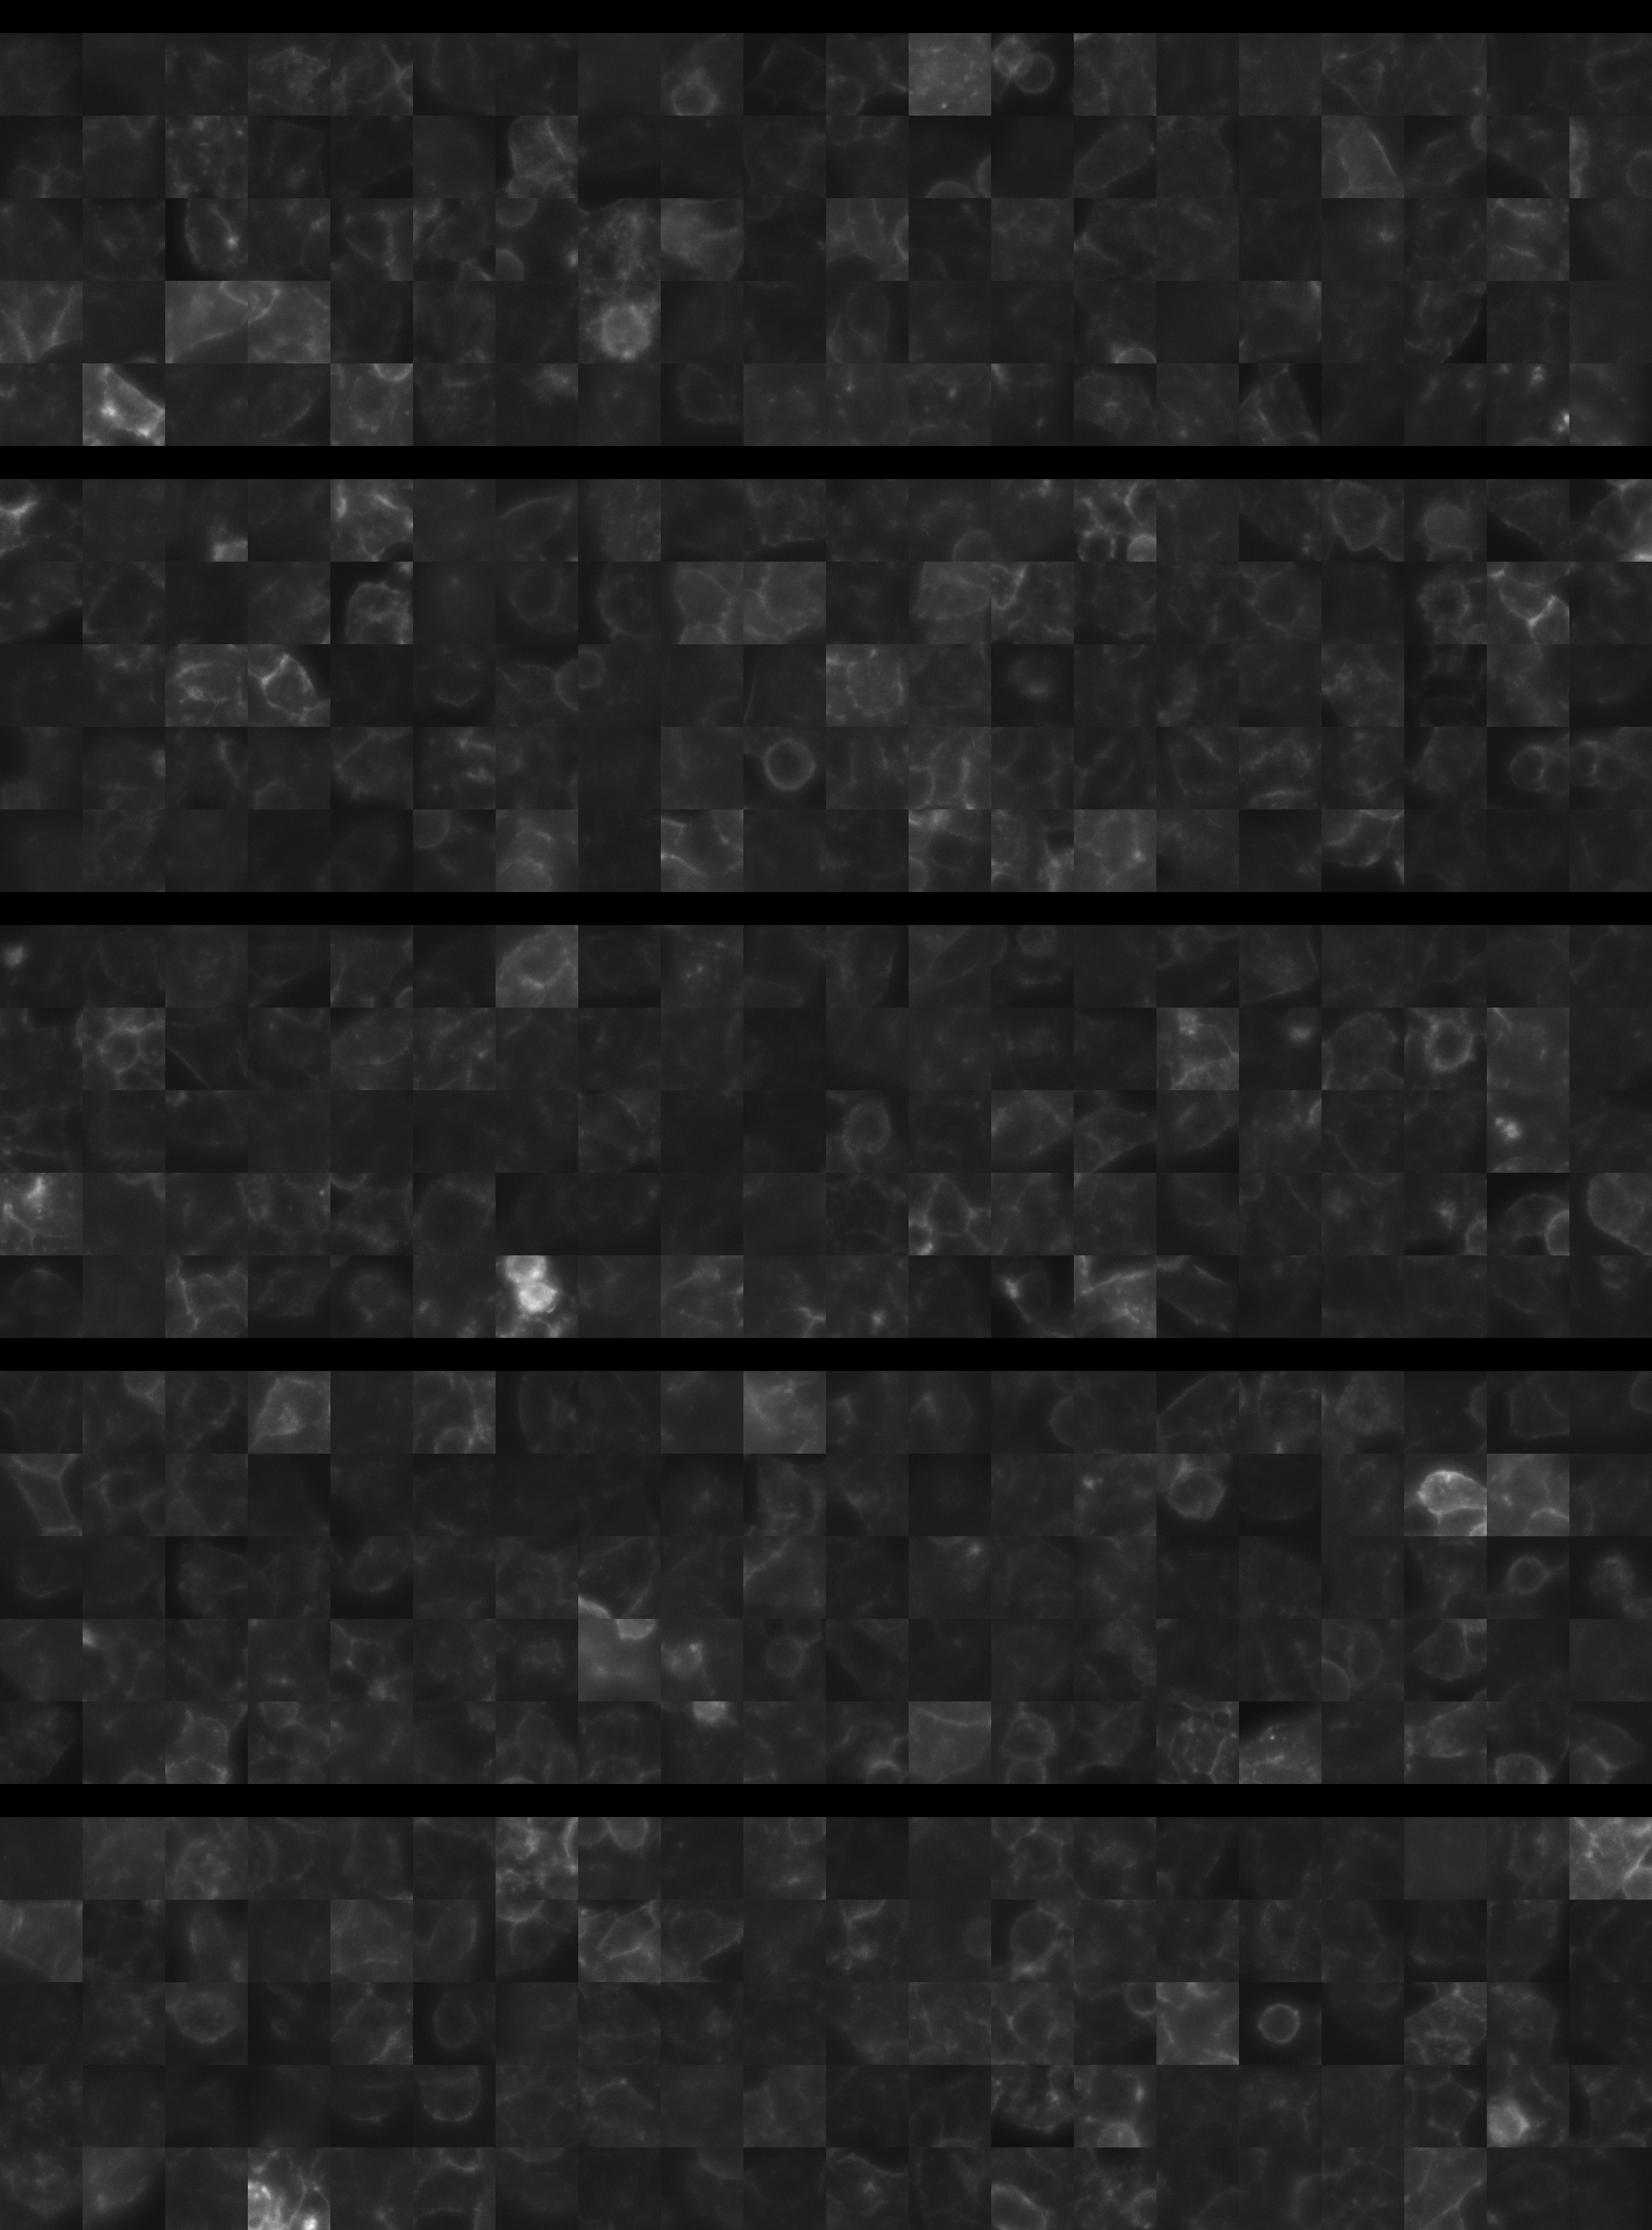
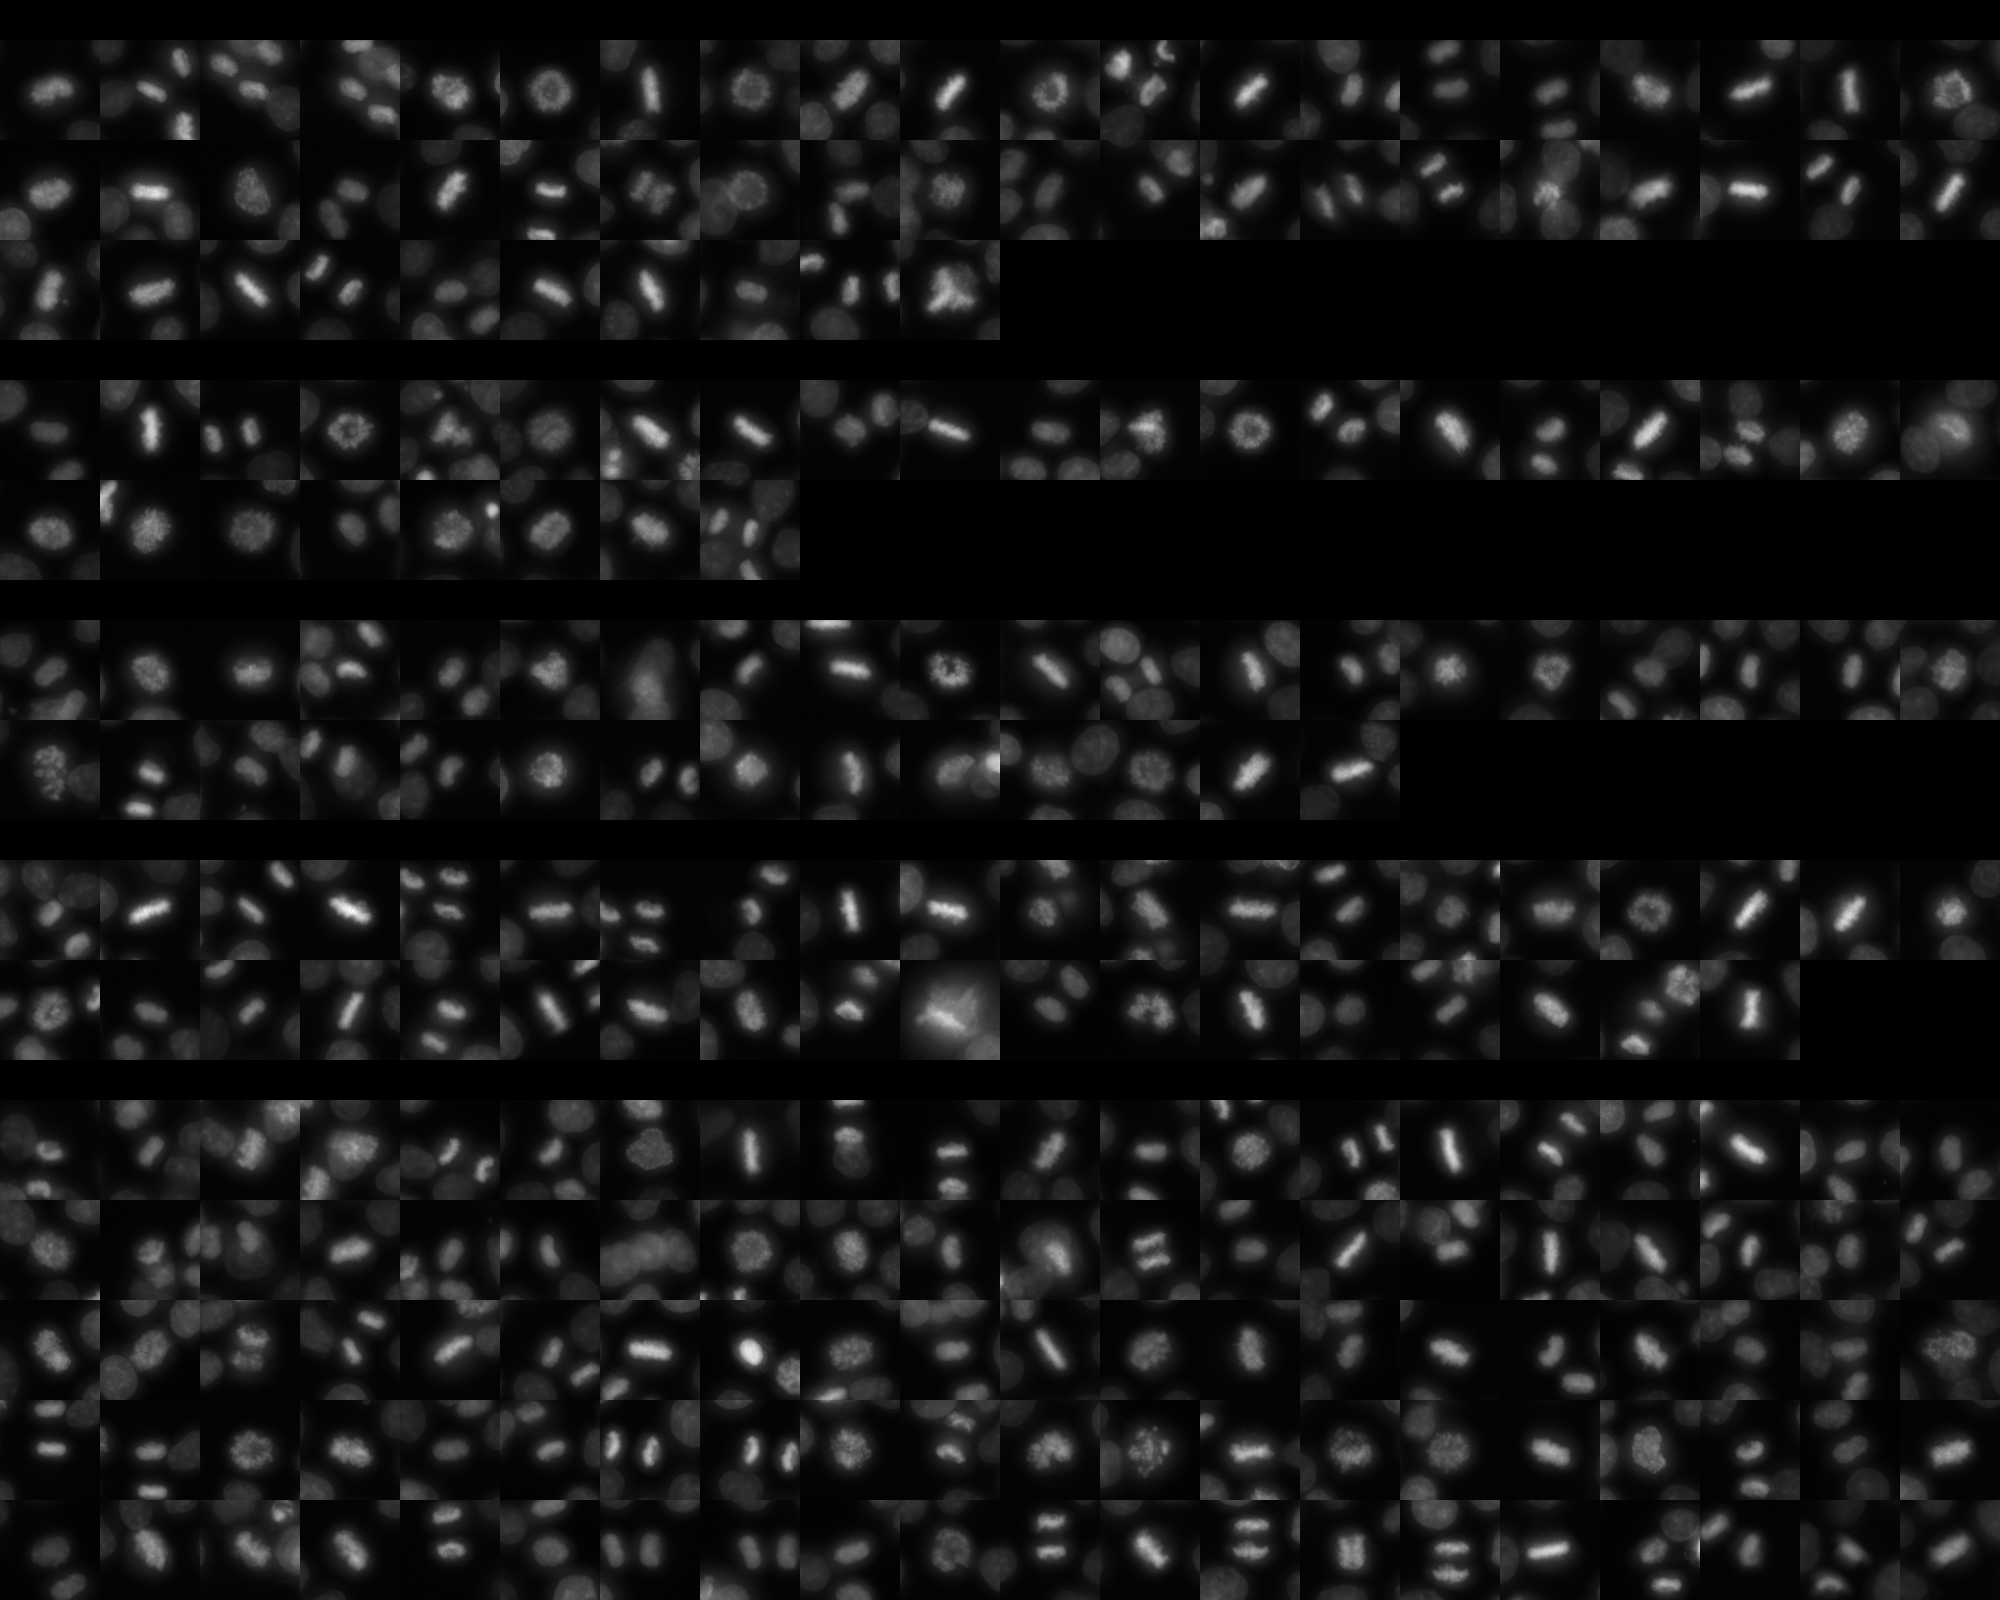
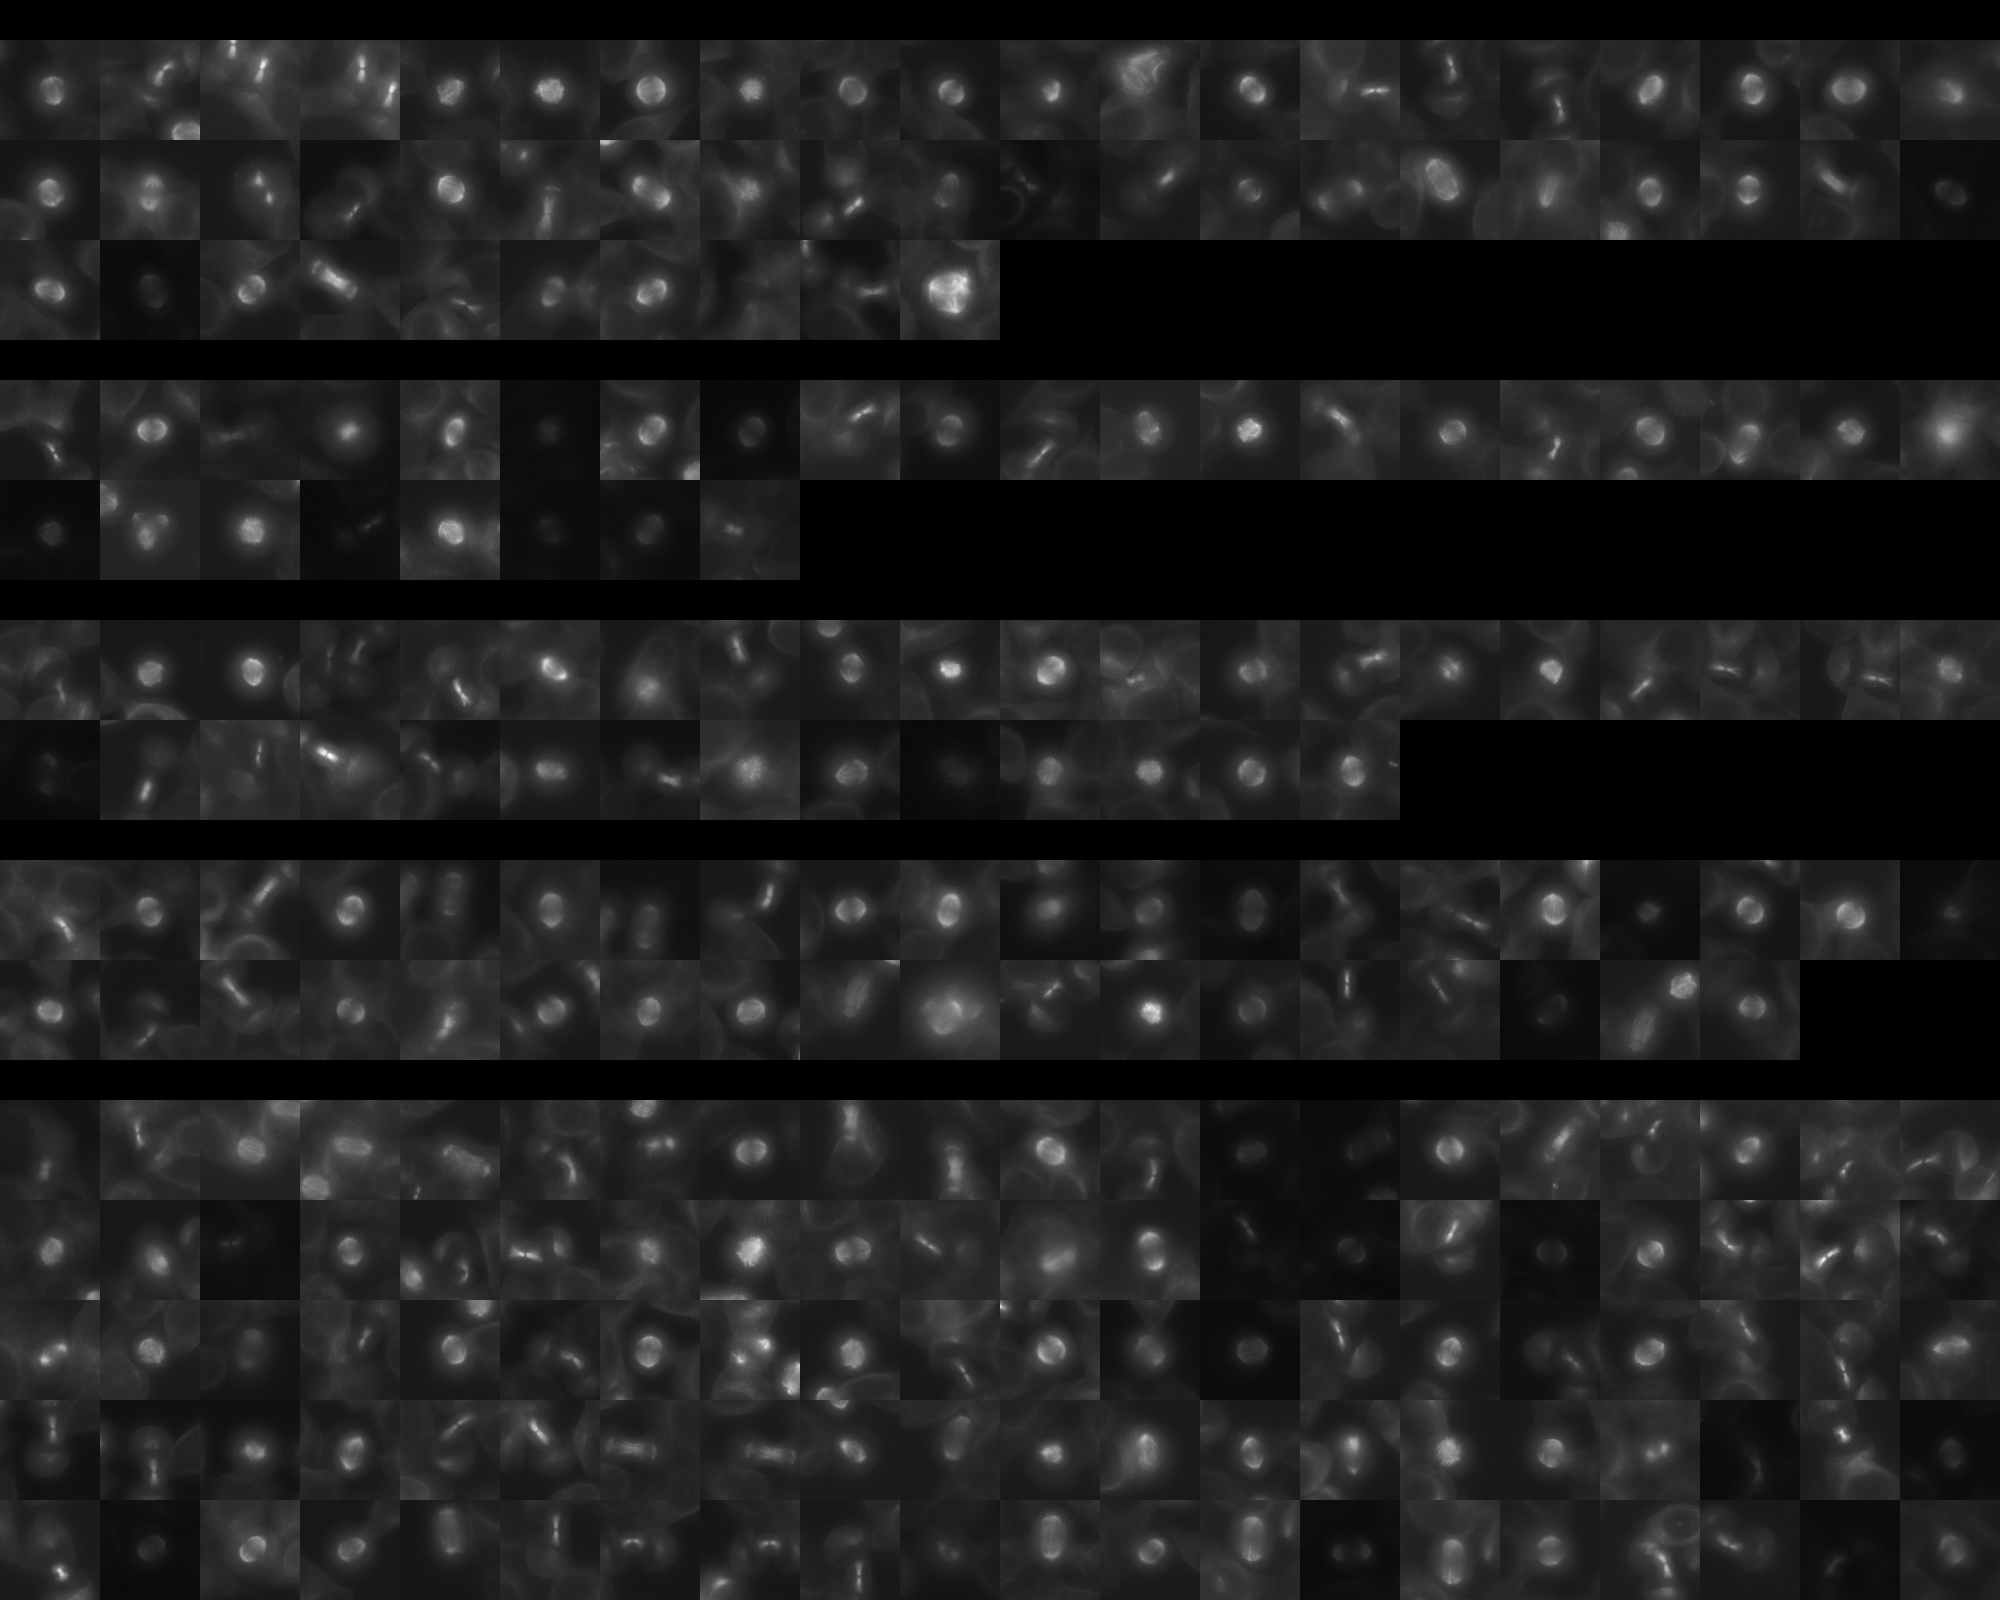
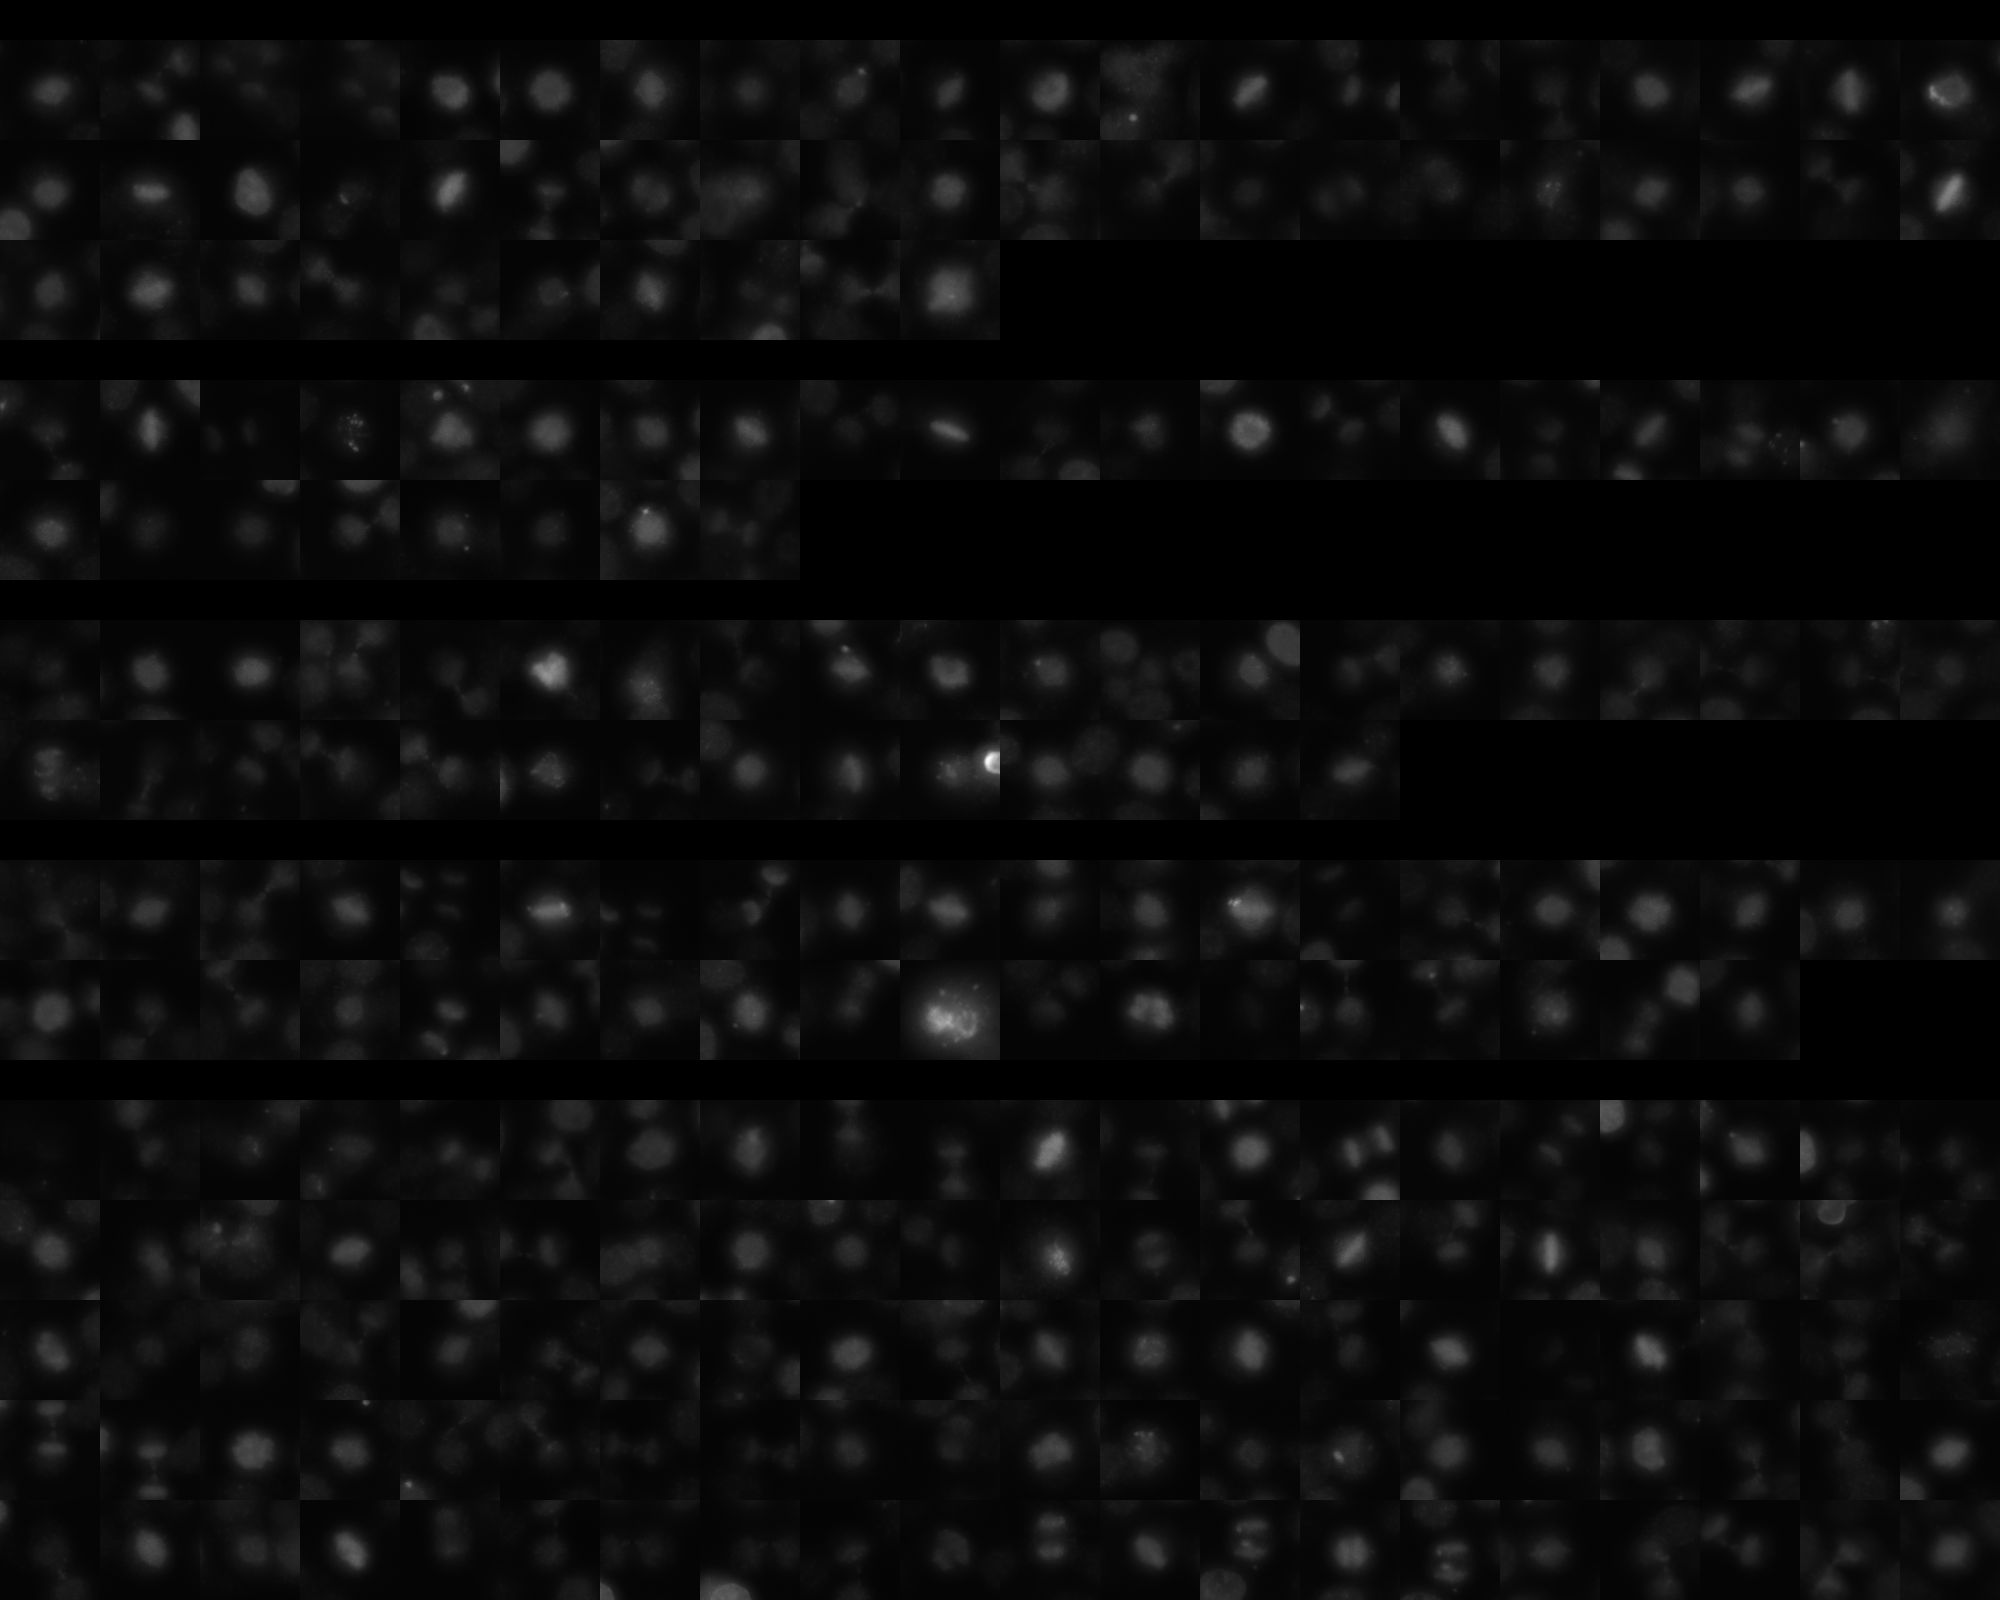
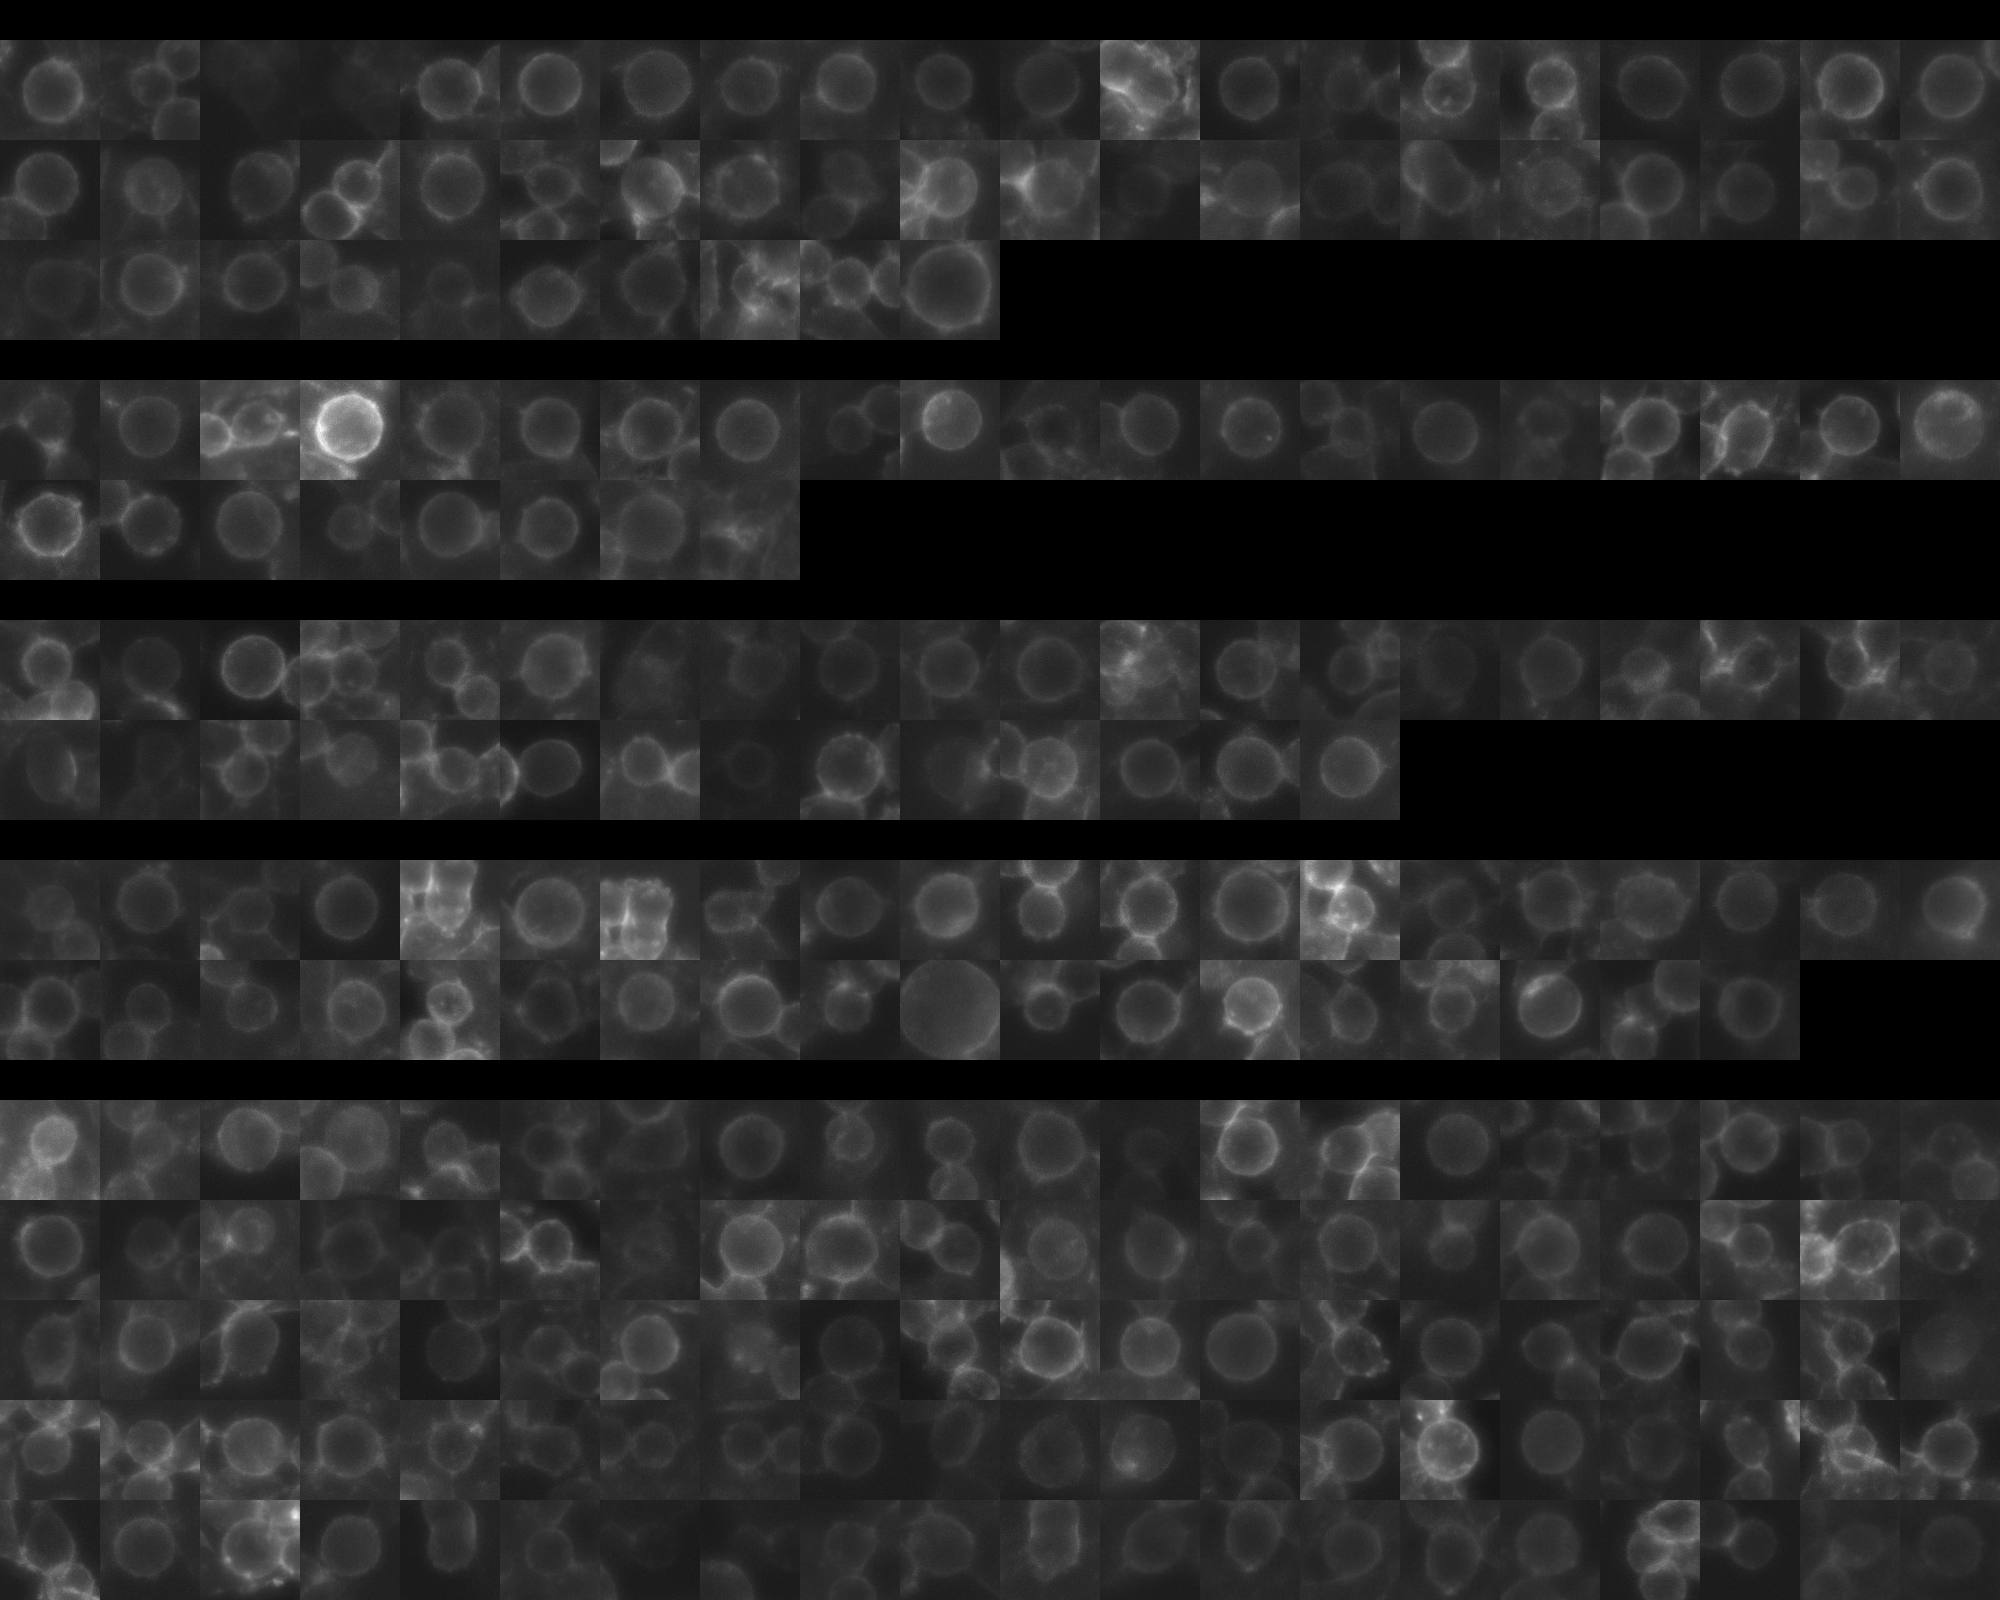
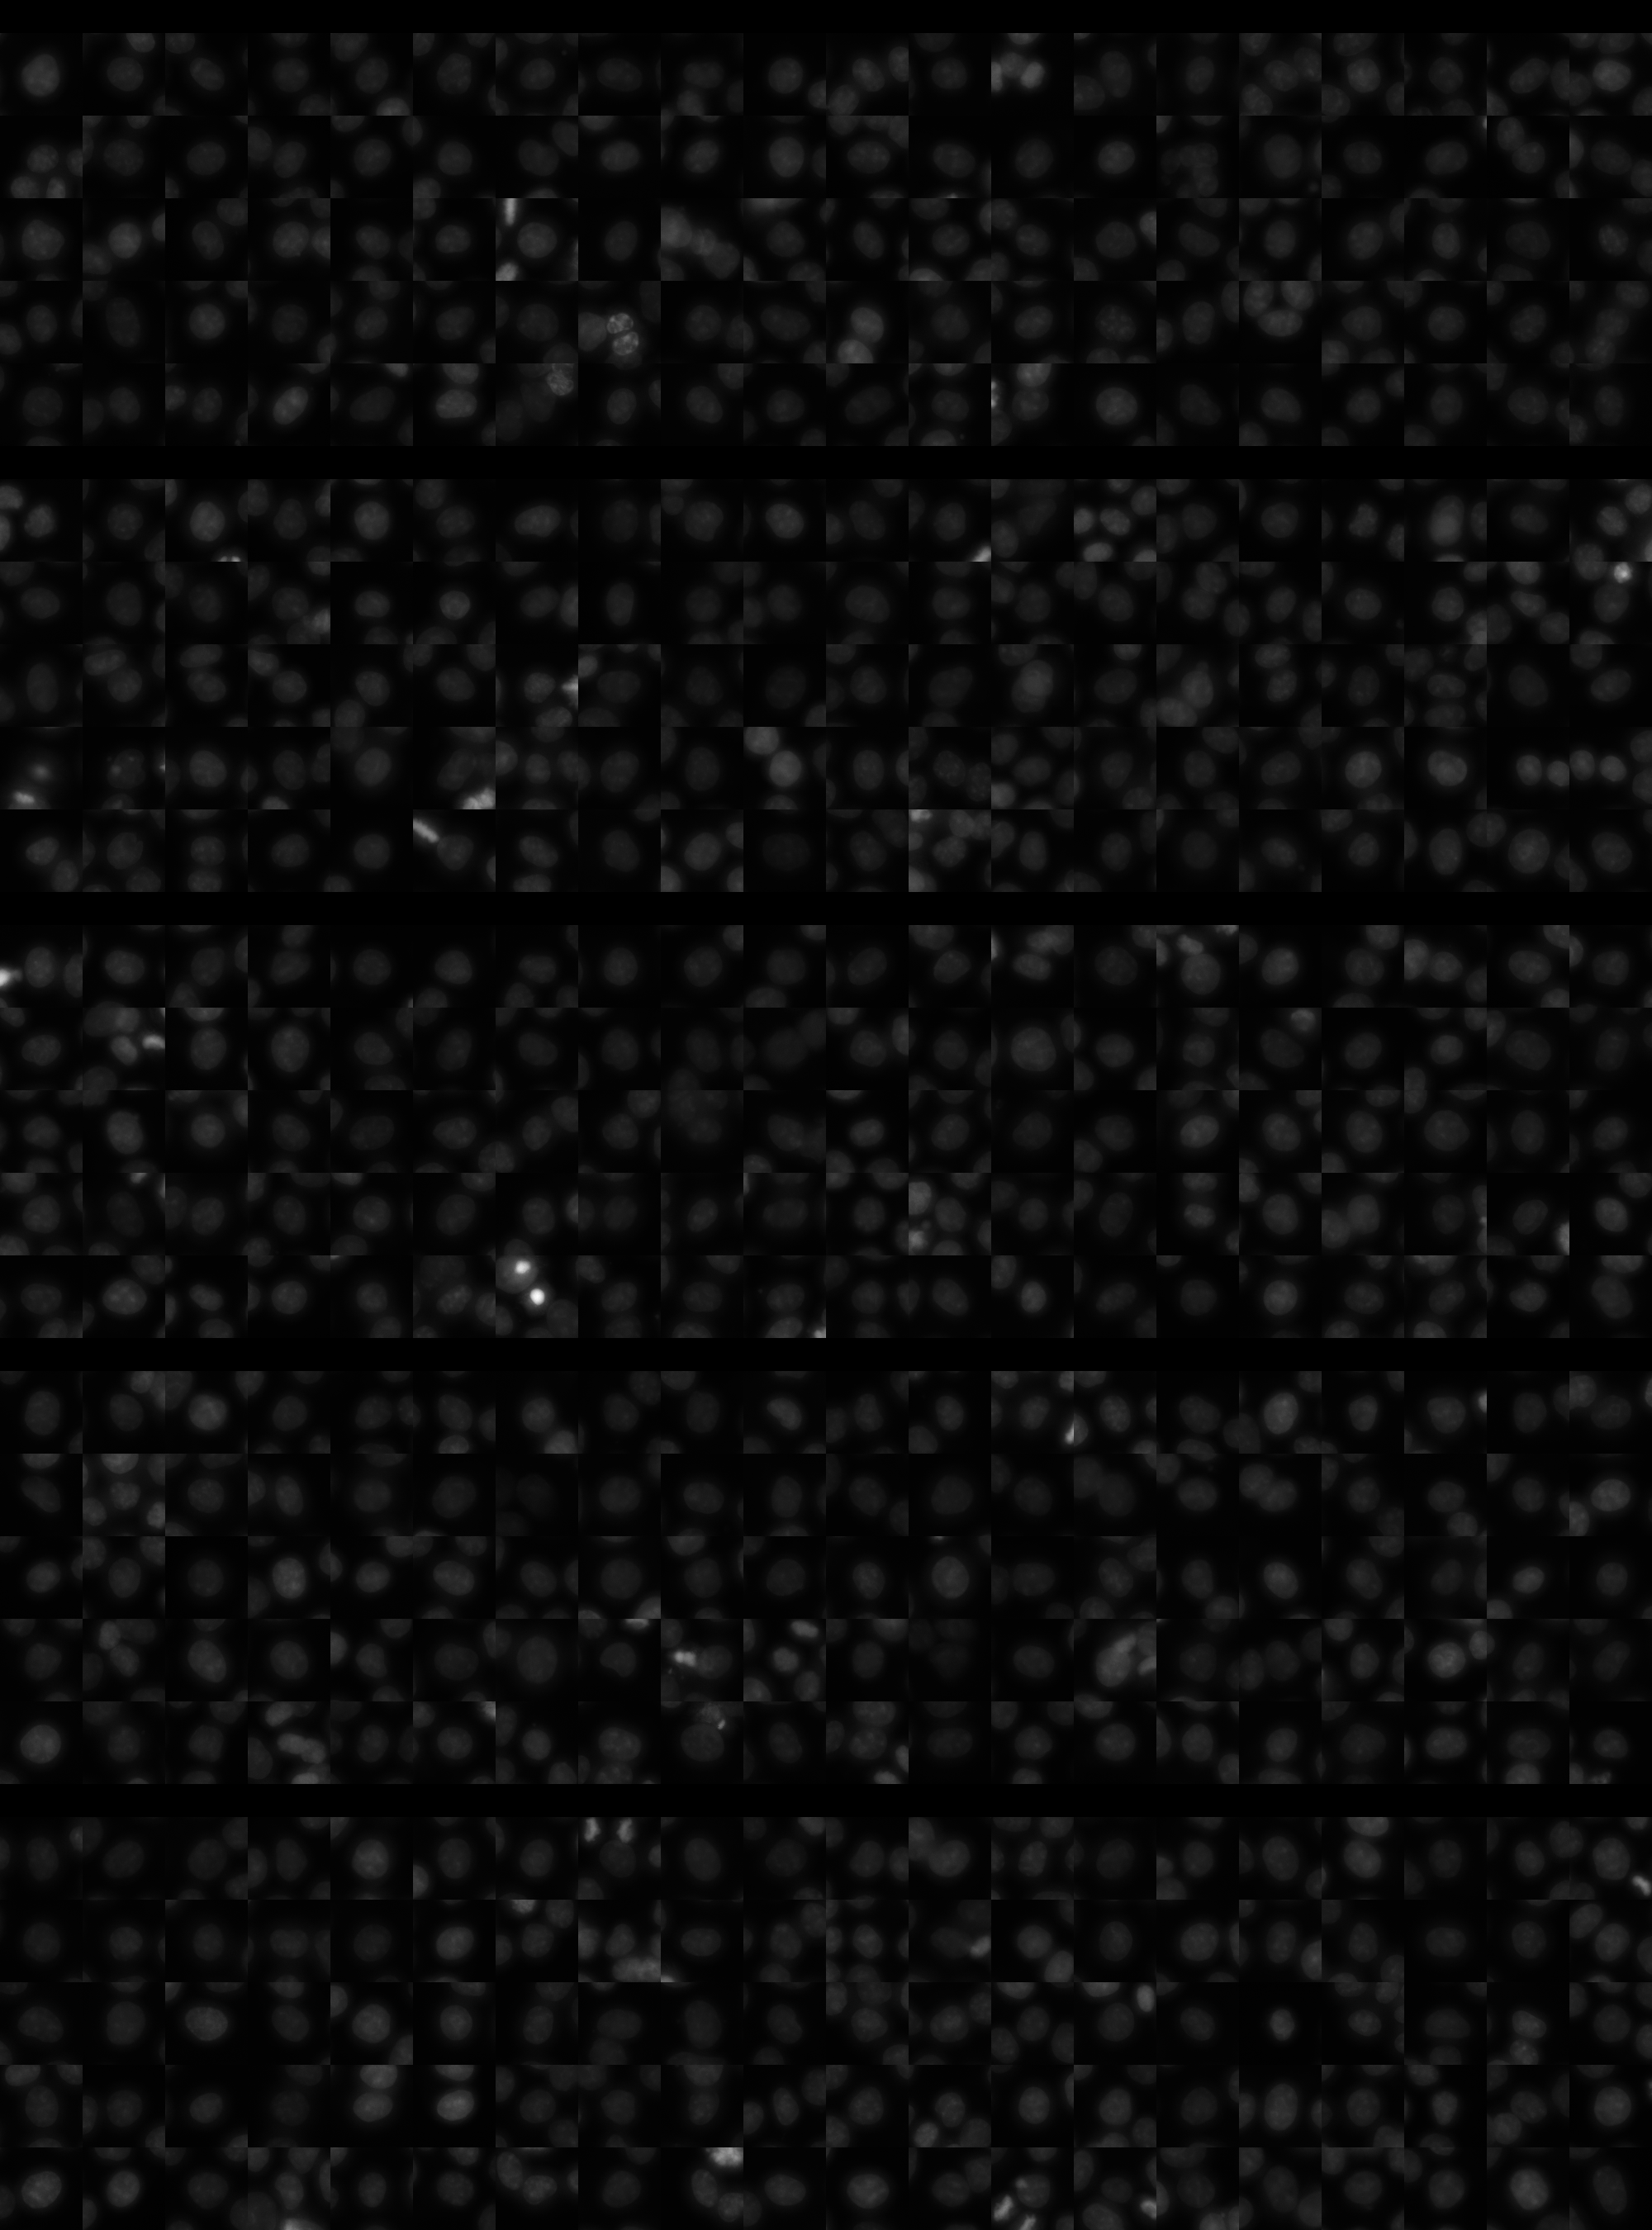
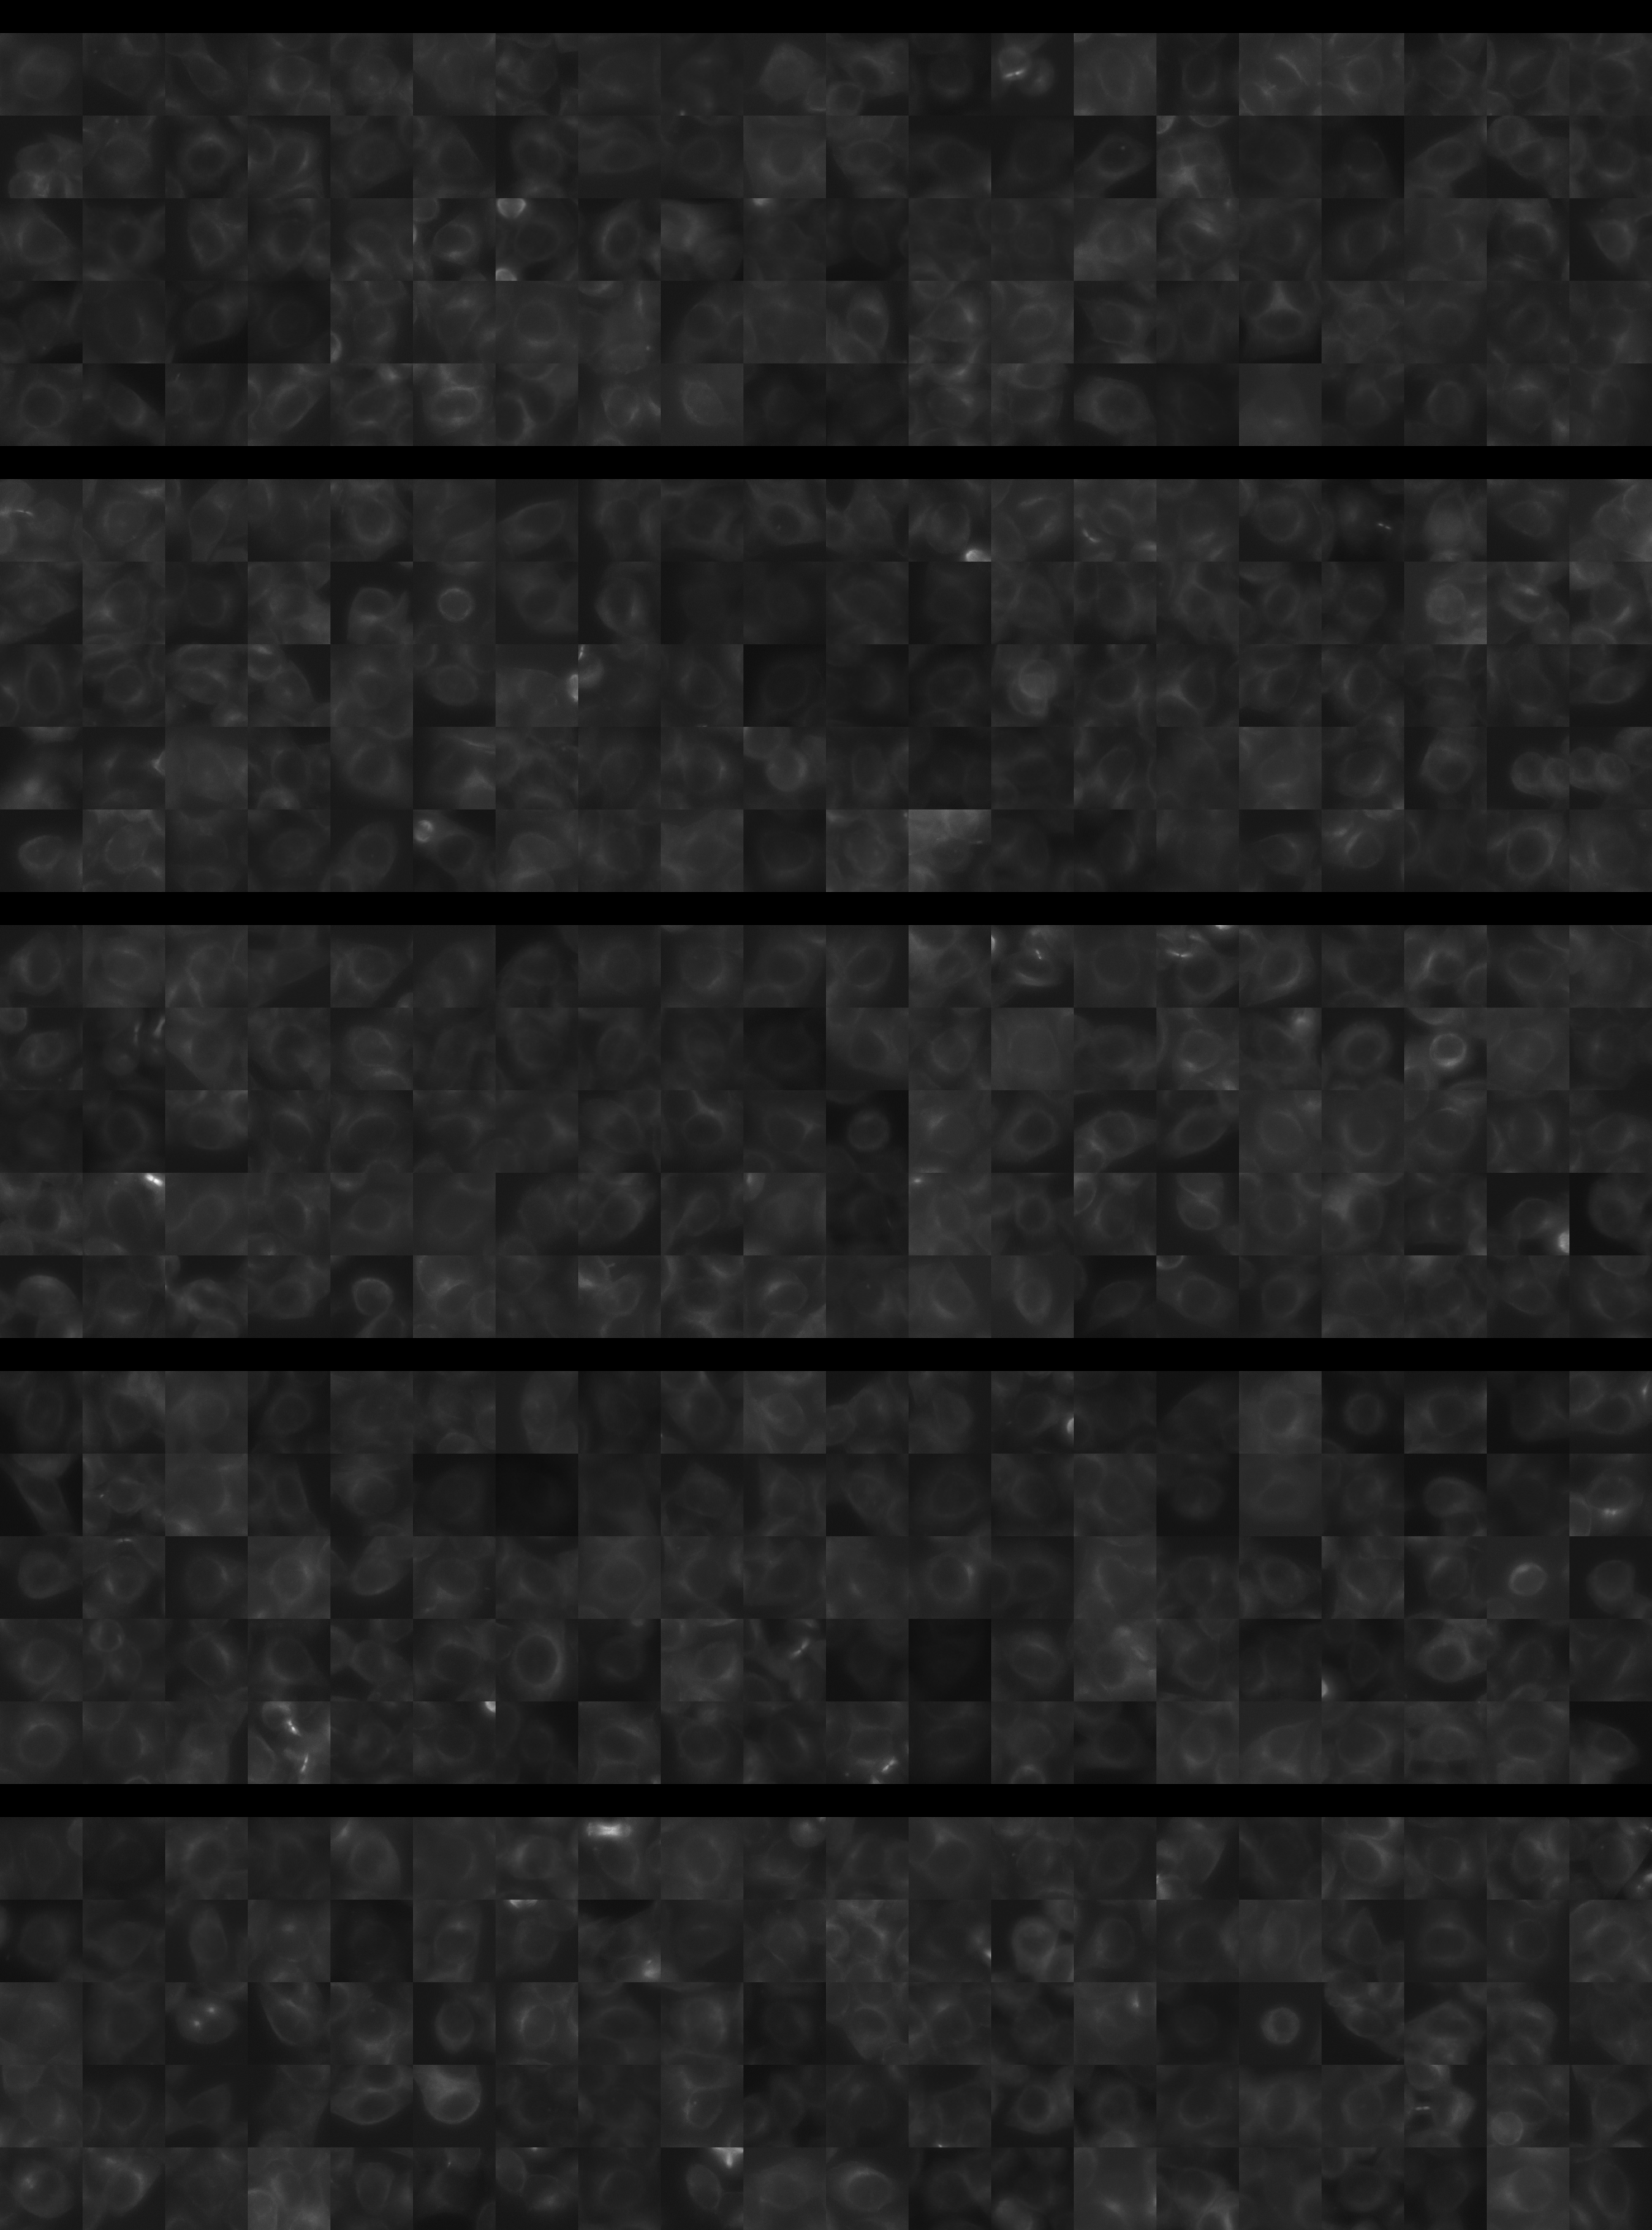
Each montage below shows randomly selected individual cell images for the same target gene separated by sgRNA, along with an example montage of cells expressing a non-targeting negative control sgRNA at the bottom. sgRNA labels in the montages correspond to the numbered sgRNA sequences in the gene info table above. The DNA (blue) and tubulin (green) channels are displayed by default, with gH2AX (grayscale) and actin (yellow) available using the check boxes. Channel brightness, contrast, and opacity are adjustable by clicking the arrow next to the channel name. When only one channel is selected, the display defaults to grayscale. Click the “Zoom” checkbox above the channel controls to enable image zooming (via scrolling) and panning (via click-and-drag).

The cell boxes displayed for this gene are square, 30.36 μm per side for the interphase montage and 30.36 μm per side for the mitotic montage.
Features

Interphase Score Rank FDR q-value
Nucleus DNA Integrated -3.708e-02 4601 of 5322 0.474
Nucleus DNA Mean -7.455e-02 4183 of 5322 0.065
Nucleus gH2AX Mean 0.061 3163 of 5322 0.105
Nucleus DNA - gH2AX Correlation -7.735e-02 3348 of 5322 0.006
Nucleus Shape Area 0.035 2114 of 5322 0.614
Nucleus Shape Eccentricity 0.053 866 of 5322 0.141
Nucleus Shape Form Factor -5.014e-02 2687 of 5322 0.192
Nucleus Shape Solidity -3.450e-02 1961 of 5322 0.307
Cell DNA Mass Displacement 0.013 3589 of 5322 0.877
Cell Tubulin Mean 6.450e-04 2751 of 5322 0.953
Cell Tubulin Mass Displacement 0.034 1075 of 5322 0.484
Cell Actin Mean -6.243e-03 3207 of 5322 0.948
Cell Tubulin - Actin Correlation -6.182e-03 3959 of 5322 0.922
Cell DNA - Tubulin Correlation -1.080e-03 3871 of 5322 0.976
Cell Shape Area 0.054 1400 of 5322 0.414
Cell Shape Eccentricity 0.014 2621 of 5322 0.887
Mitotic Score Rank FDR q-value
Nucleus DNA Integrated 0.128 2088 of 5322 0.957
Nucleus DNA Mean 0.125 1173 of 5322 1.000
Nucleus DNA Mass Displacement 0.176 961 of 5322 0.999
Nucleus DNA Mean Frac 3 -1.442e-01 4770 of 5322 1.000
Nucleus gH2AX Mean 0.069 1981 of 5322 1.000
Nucleus gH2AX Mean Frac 0 0.067 1328 of 5322 1.000
Nucleus Tubulin Mean Frac 0 0.123 1638 of 5322 0.999
Nucleus Tubulin Mean Edge 0.044 2590 of 5322 0.999
Nucleus Tubulin Std Edge -2.172e-02 2862 of 5322 0.999
Nucleus Shape Area 0.116 2433 of 5322 0.989
Nucleus Shape Eccentricity -6.801e-02 3141 of 5322 1.000
Nucleus Shape Form Factor -1.338e-03 1395 of 5322 0.998
Cell Tubulin Mean 0.084 2280 of 5322 0.997
Cell Tubulin Mean Frac 3 -1.048e-01 2989 of 5322 0.999
Cell Actin Mean 0.089 2043 of 5322 0.997
Cell Shape Area 0.069 3035 of 5322 0.998
( Reset Zoom )
Brightness
Contrast
Opacity
Brightness
Contrast
Opacity
Brightness
Contrast
Opacity
Brightness
Contrast
Opacity
Brightness
Contrast
Opacity

( Reset Zoom )
Brightness
Contrast
Opacity
Brightness
Contrast
Opacity
Brightness
Contrast
Opacity
Brightness
Contrast
Opacity
Brightness
Contrast
Opacity

MIT Central Accessability