TRMU

Gene symbol: TRMU
Gene: 55687
Uniprot Function: Catalyzes the 2-thiolation of uridine at the wobble position (U34) of mitochondrial tRNA(Lys), tRNA(Glu) and tRNA(Gln). Required for the formation of 5-taurinomethyl-2-thiouridine (tm5s2U) of mitochondrial tRNA(Lys), tRNA(Glu), and tRNA(Gln) at the wobble position. ATP is required to activate the C2 atom of the wobble base.
Mitotic Index 0.0308
Interphase Cluster: #89 (25 genes)
Mitotic Cluster: #13 (43 genes)
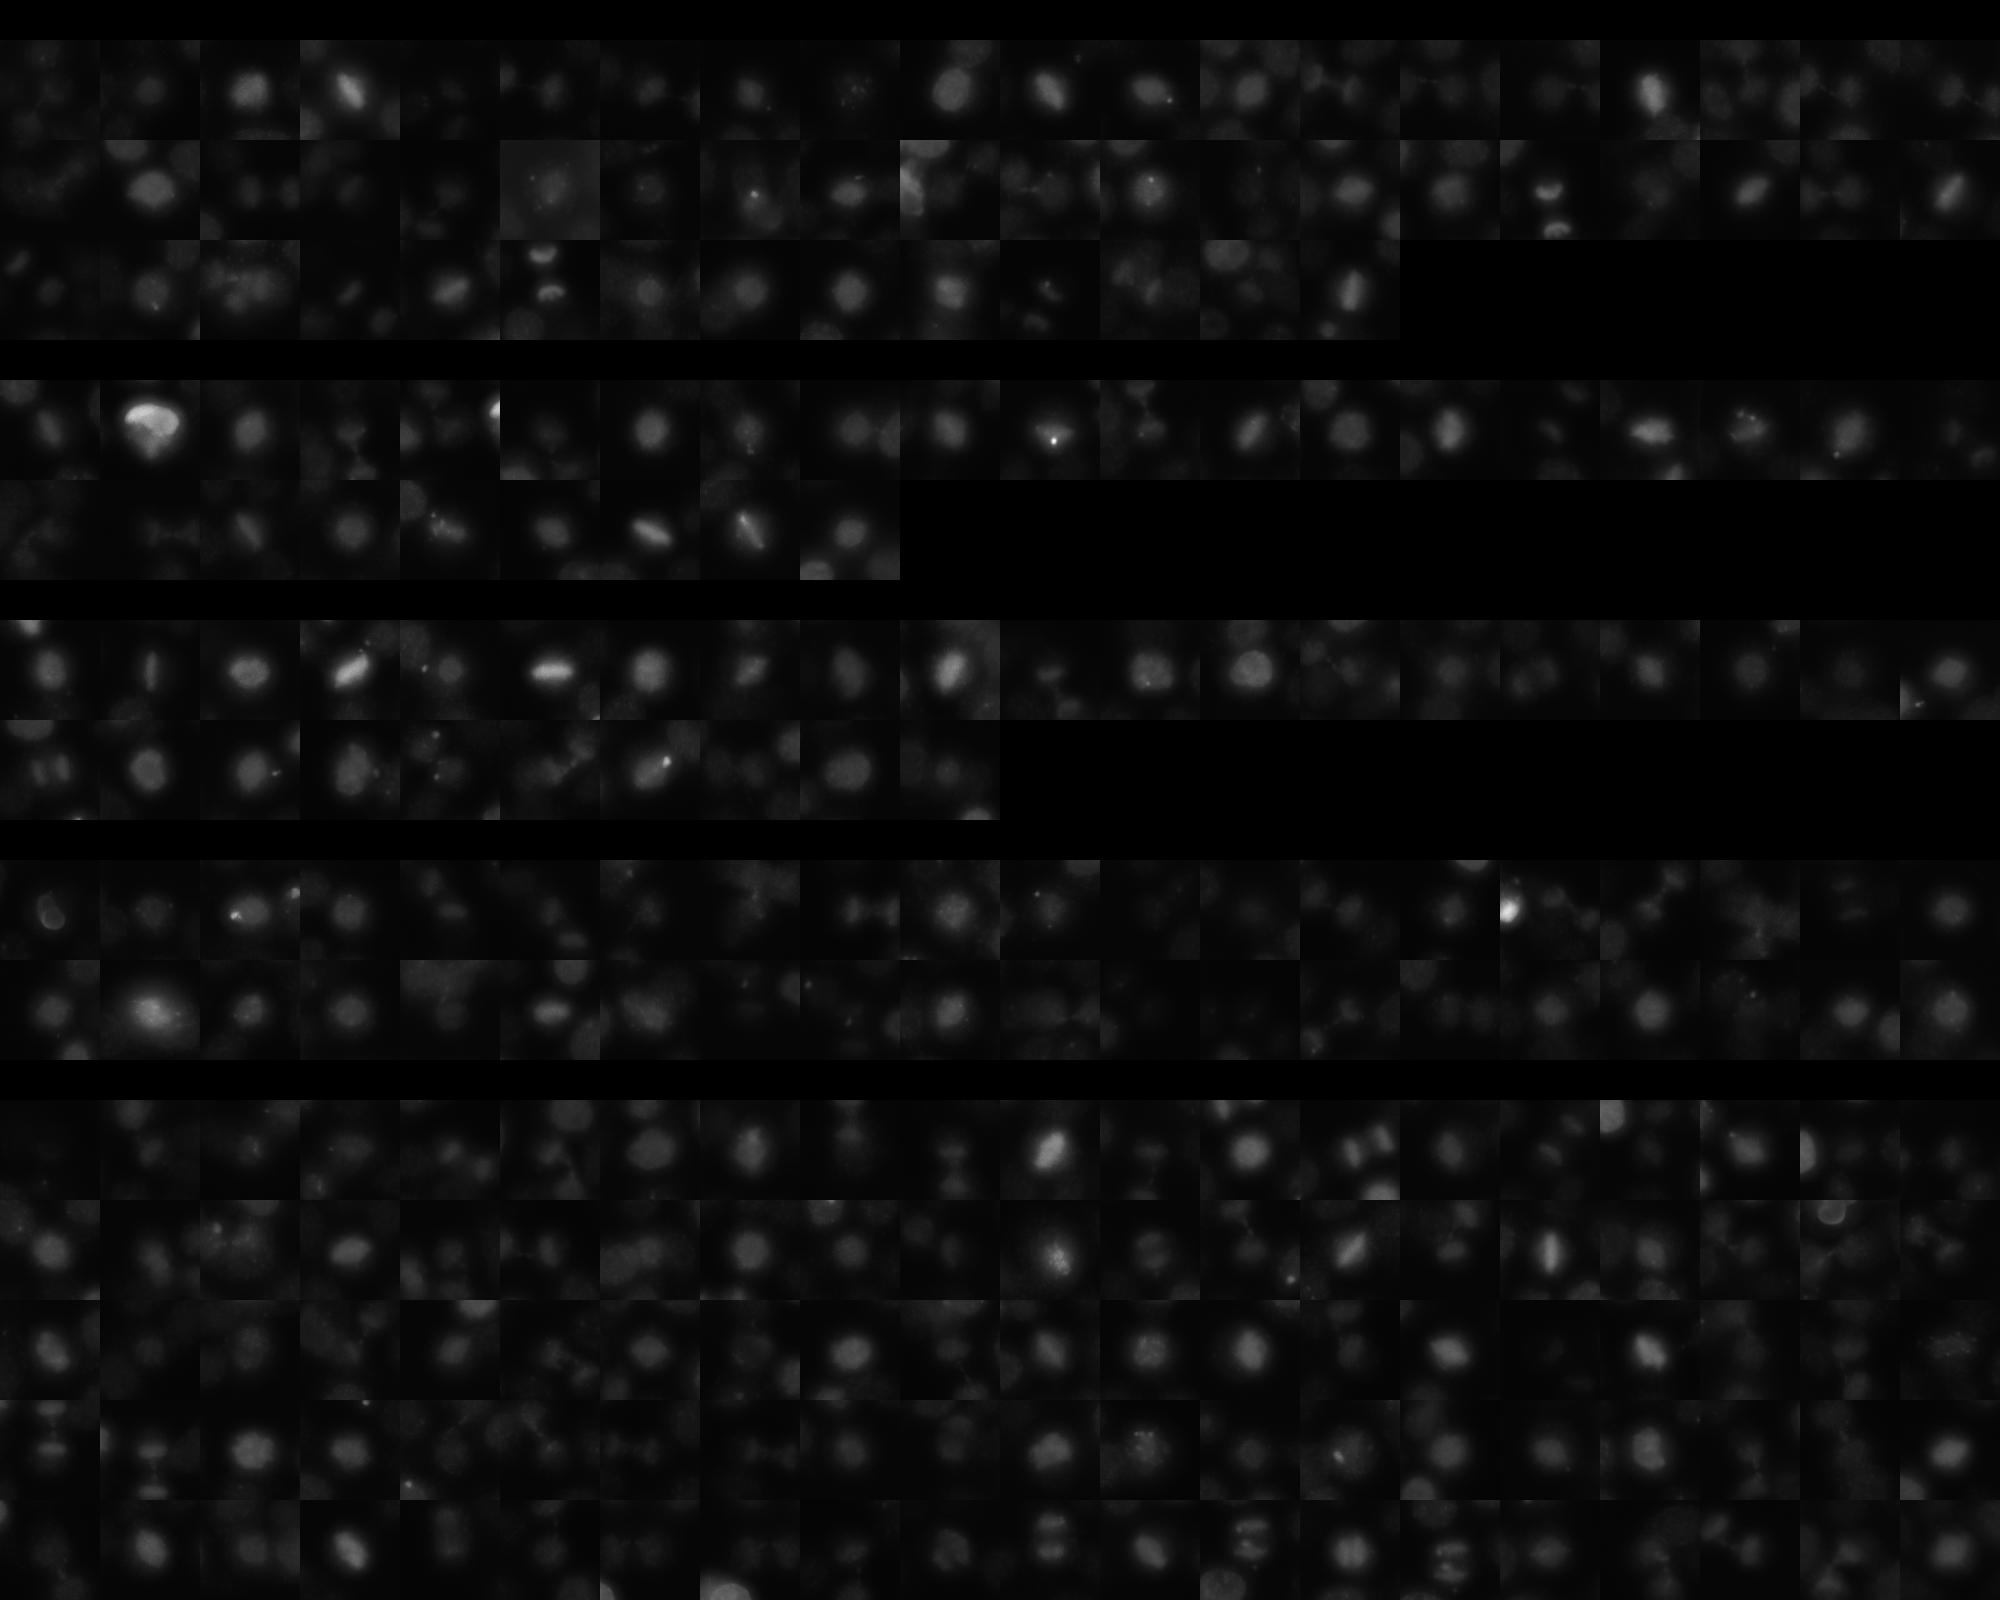
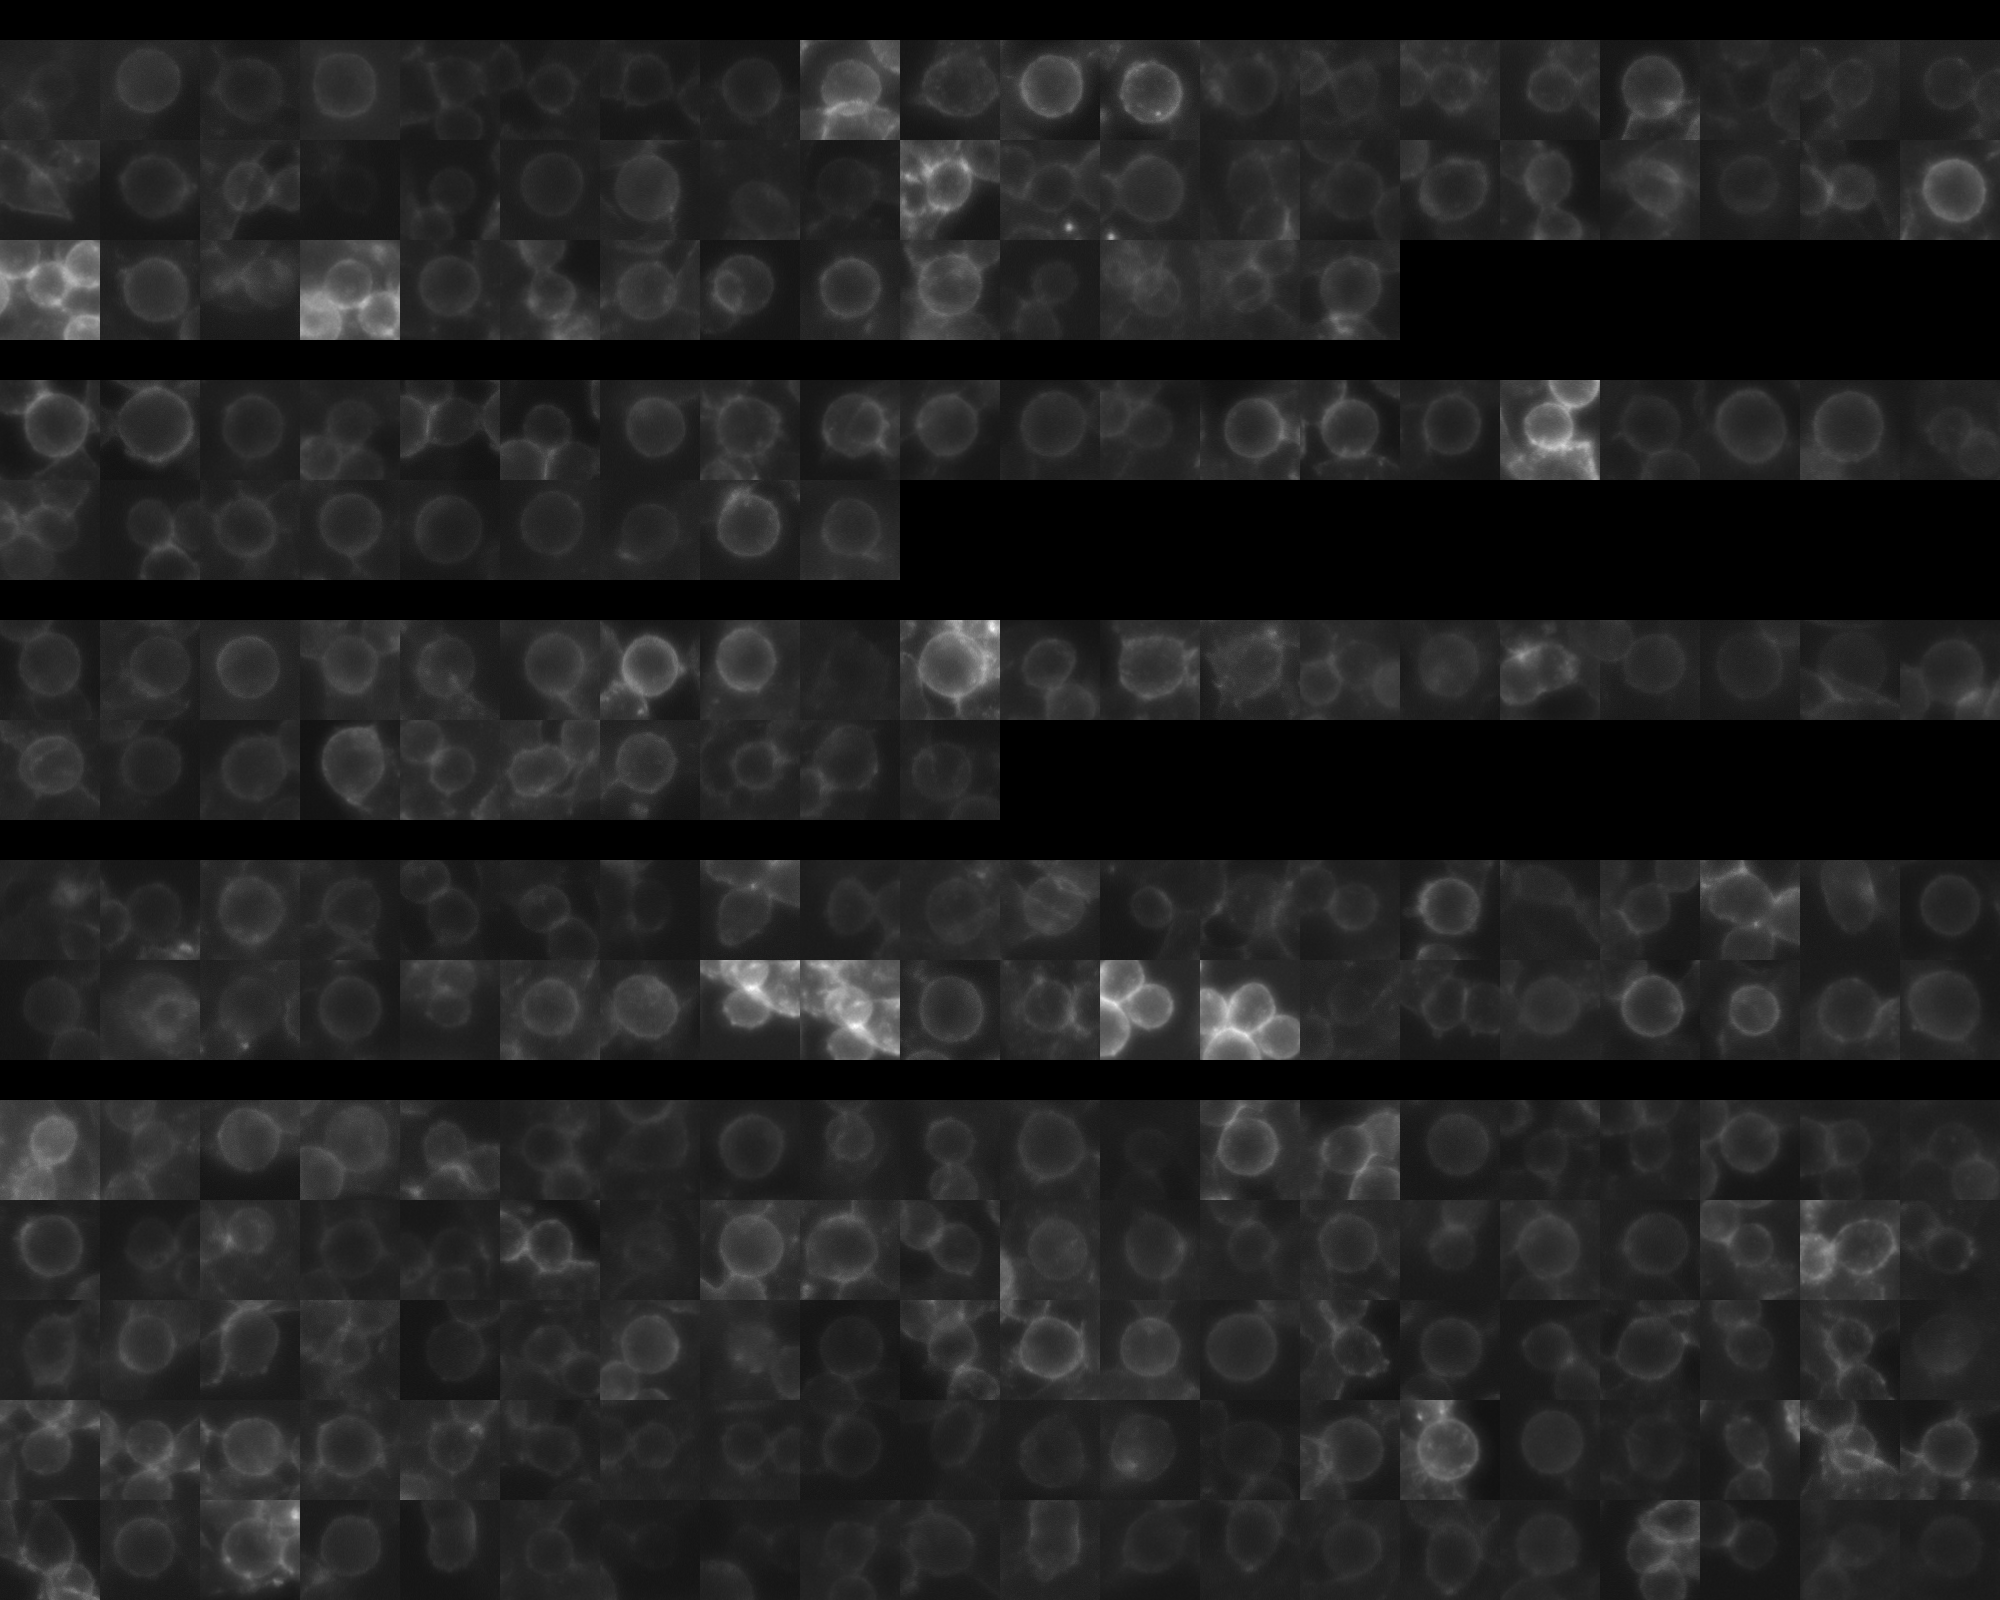
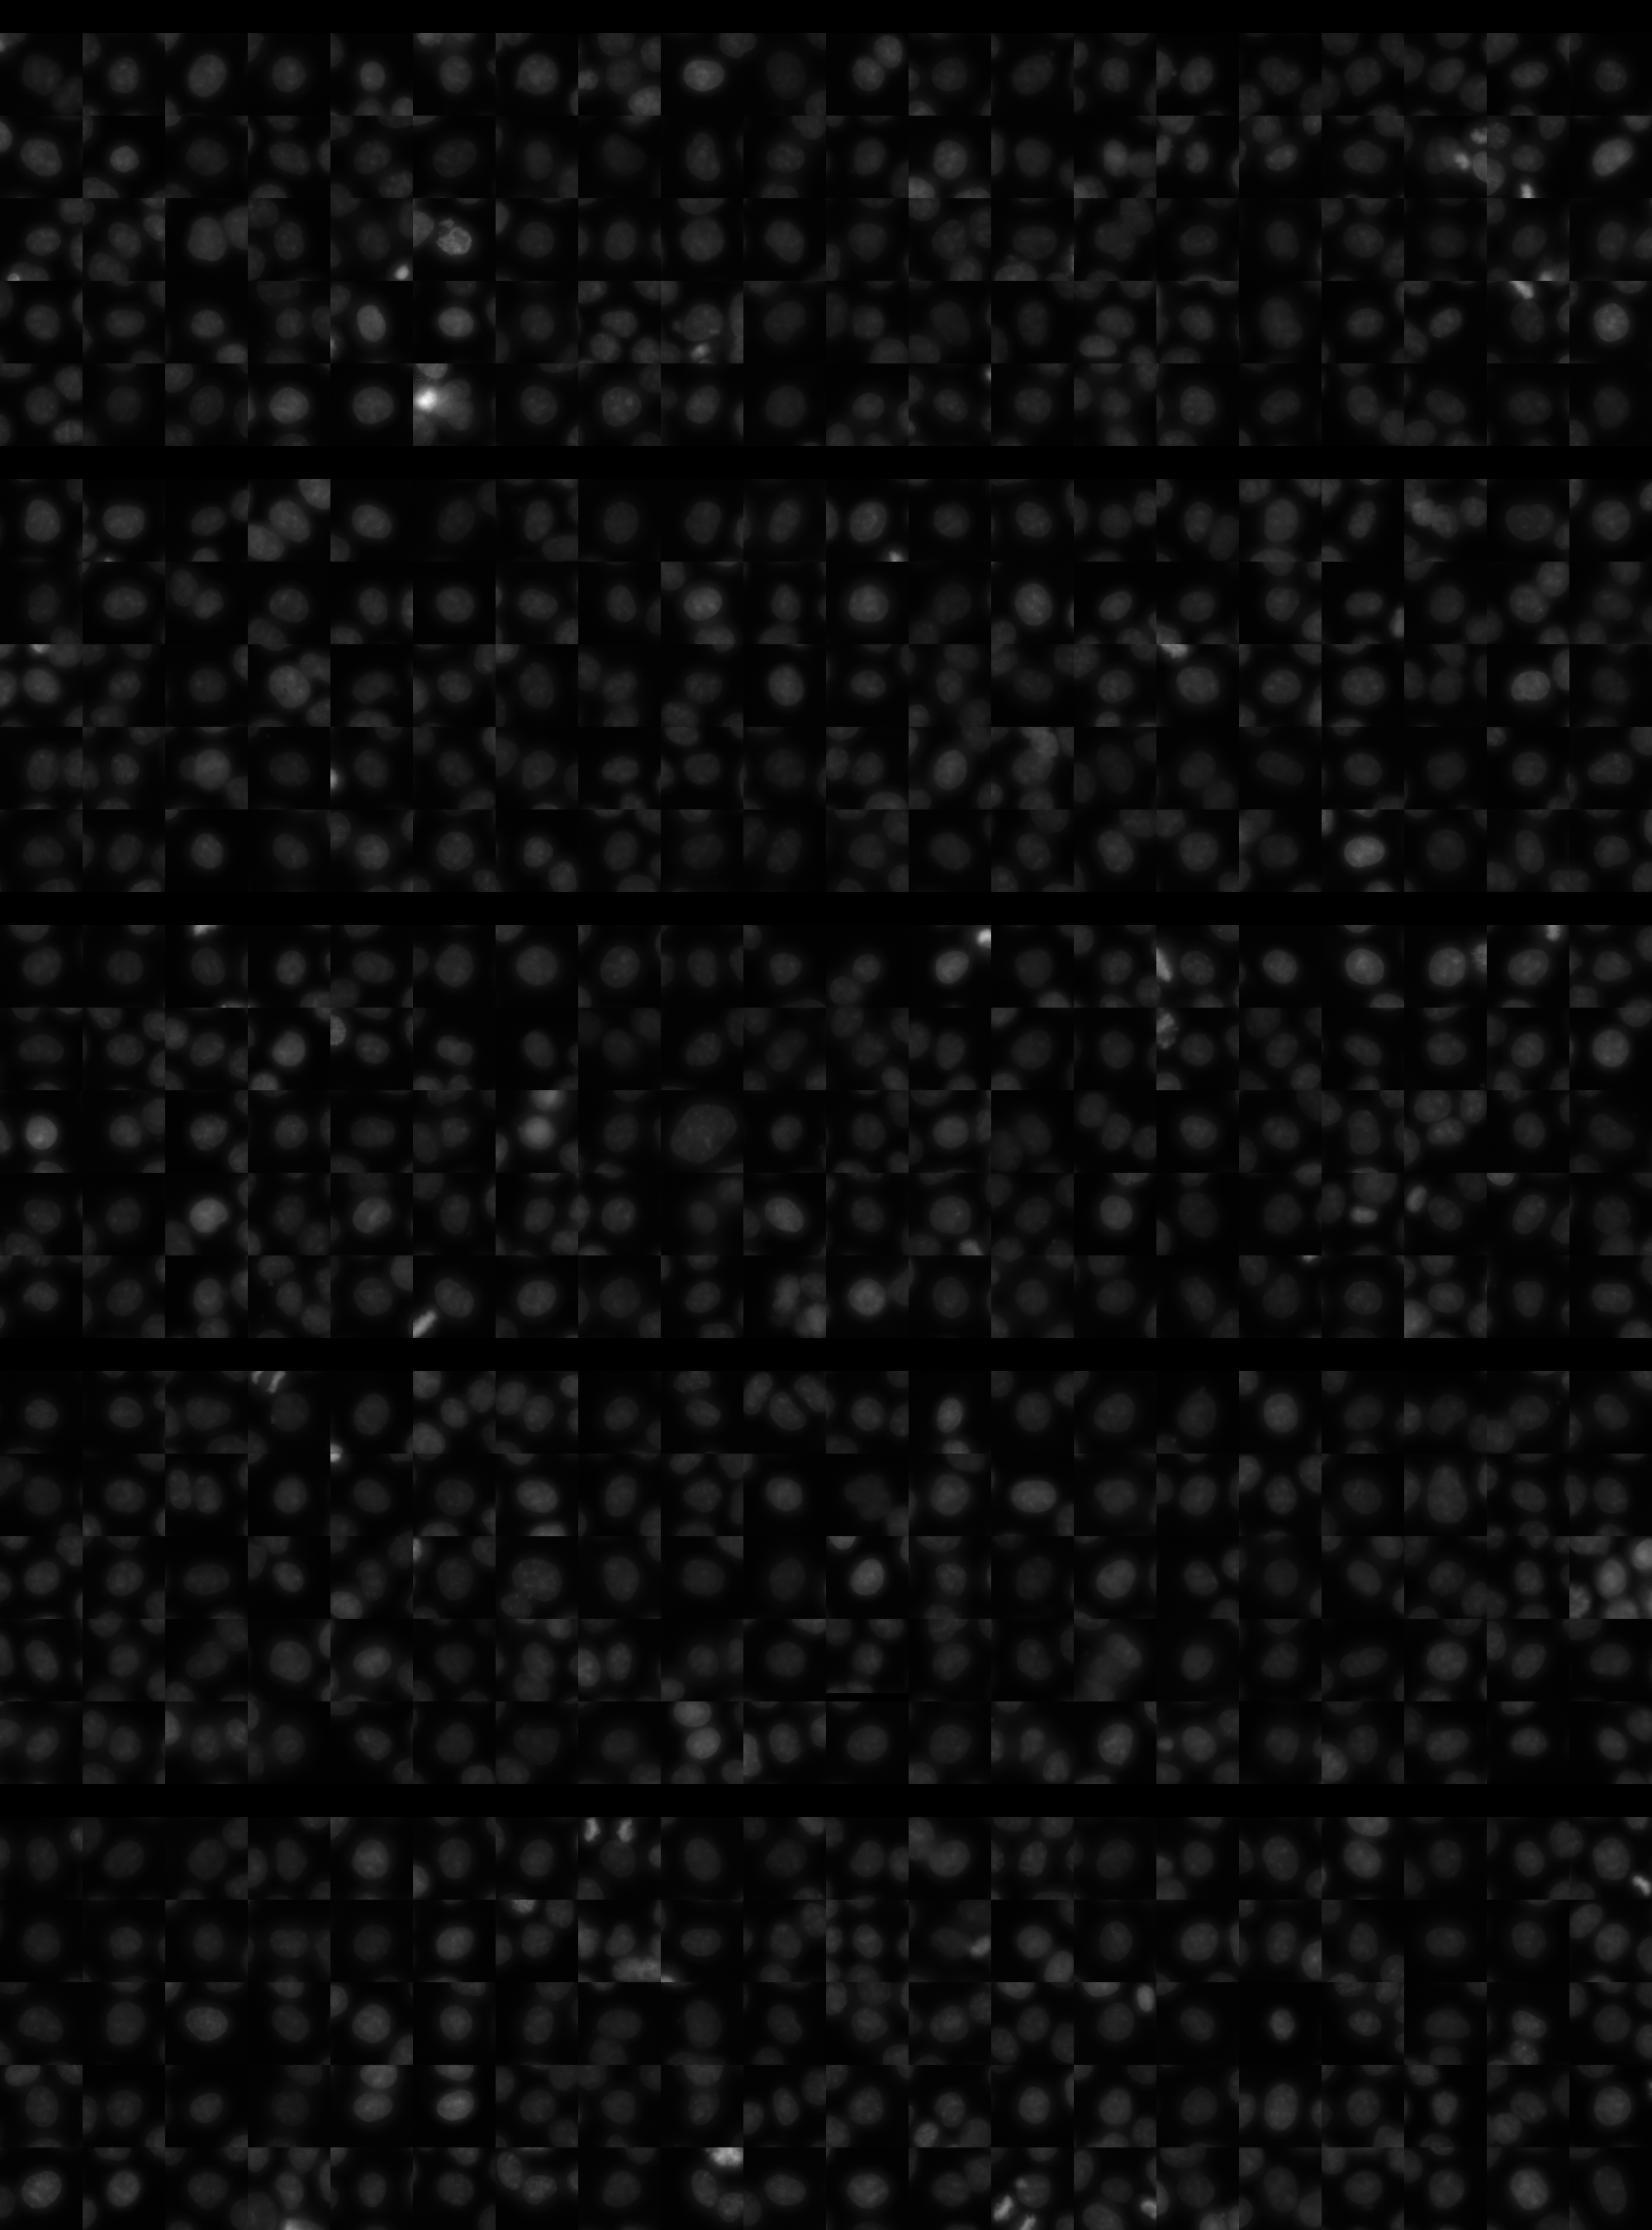
sgRNA 1: AAGCACGTTAAGAAGCCCGA (interphase cells: 1692, mitotic cells: 54)
sgRNA 2: GAGGAGAACCATCTTCCCTC (interphase cells: 1124, mitotic cells: 29)
sgRNA 3: GCTGTGCGTGCCCTTGCCAC (interphase cells: 1028, mitotic cells: 30)
sgRNA 4: TTGGGCCAGAGAGCAAACAT (interphase cells: 977, mitotic cells: 40)

Interphase Cluster

Mitotic Cluster

Overview

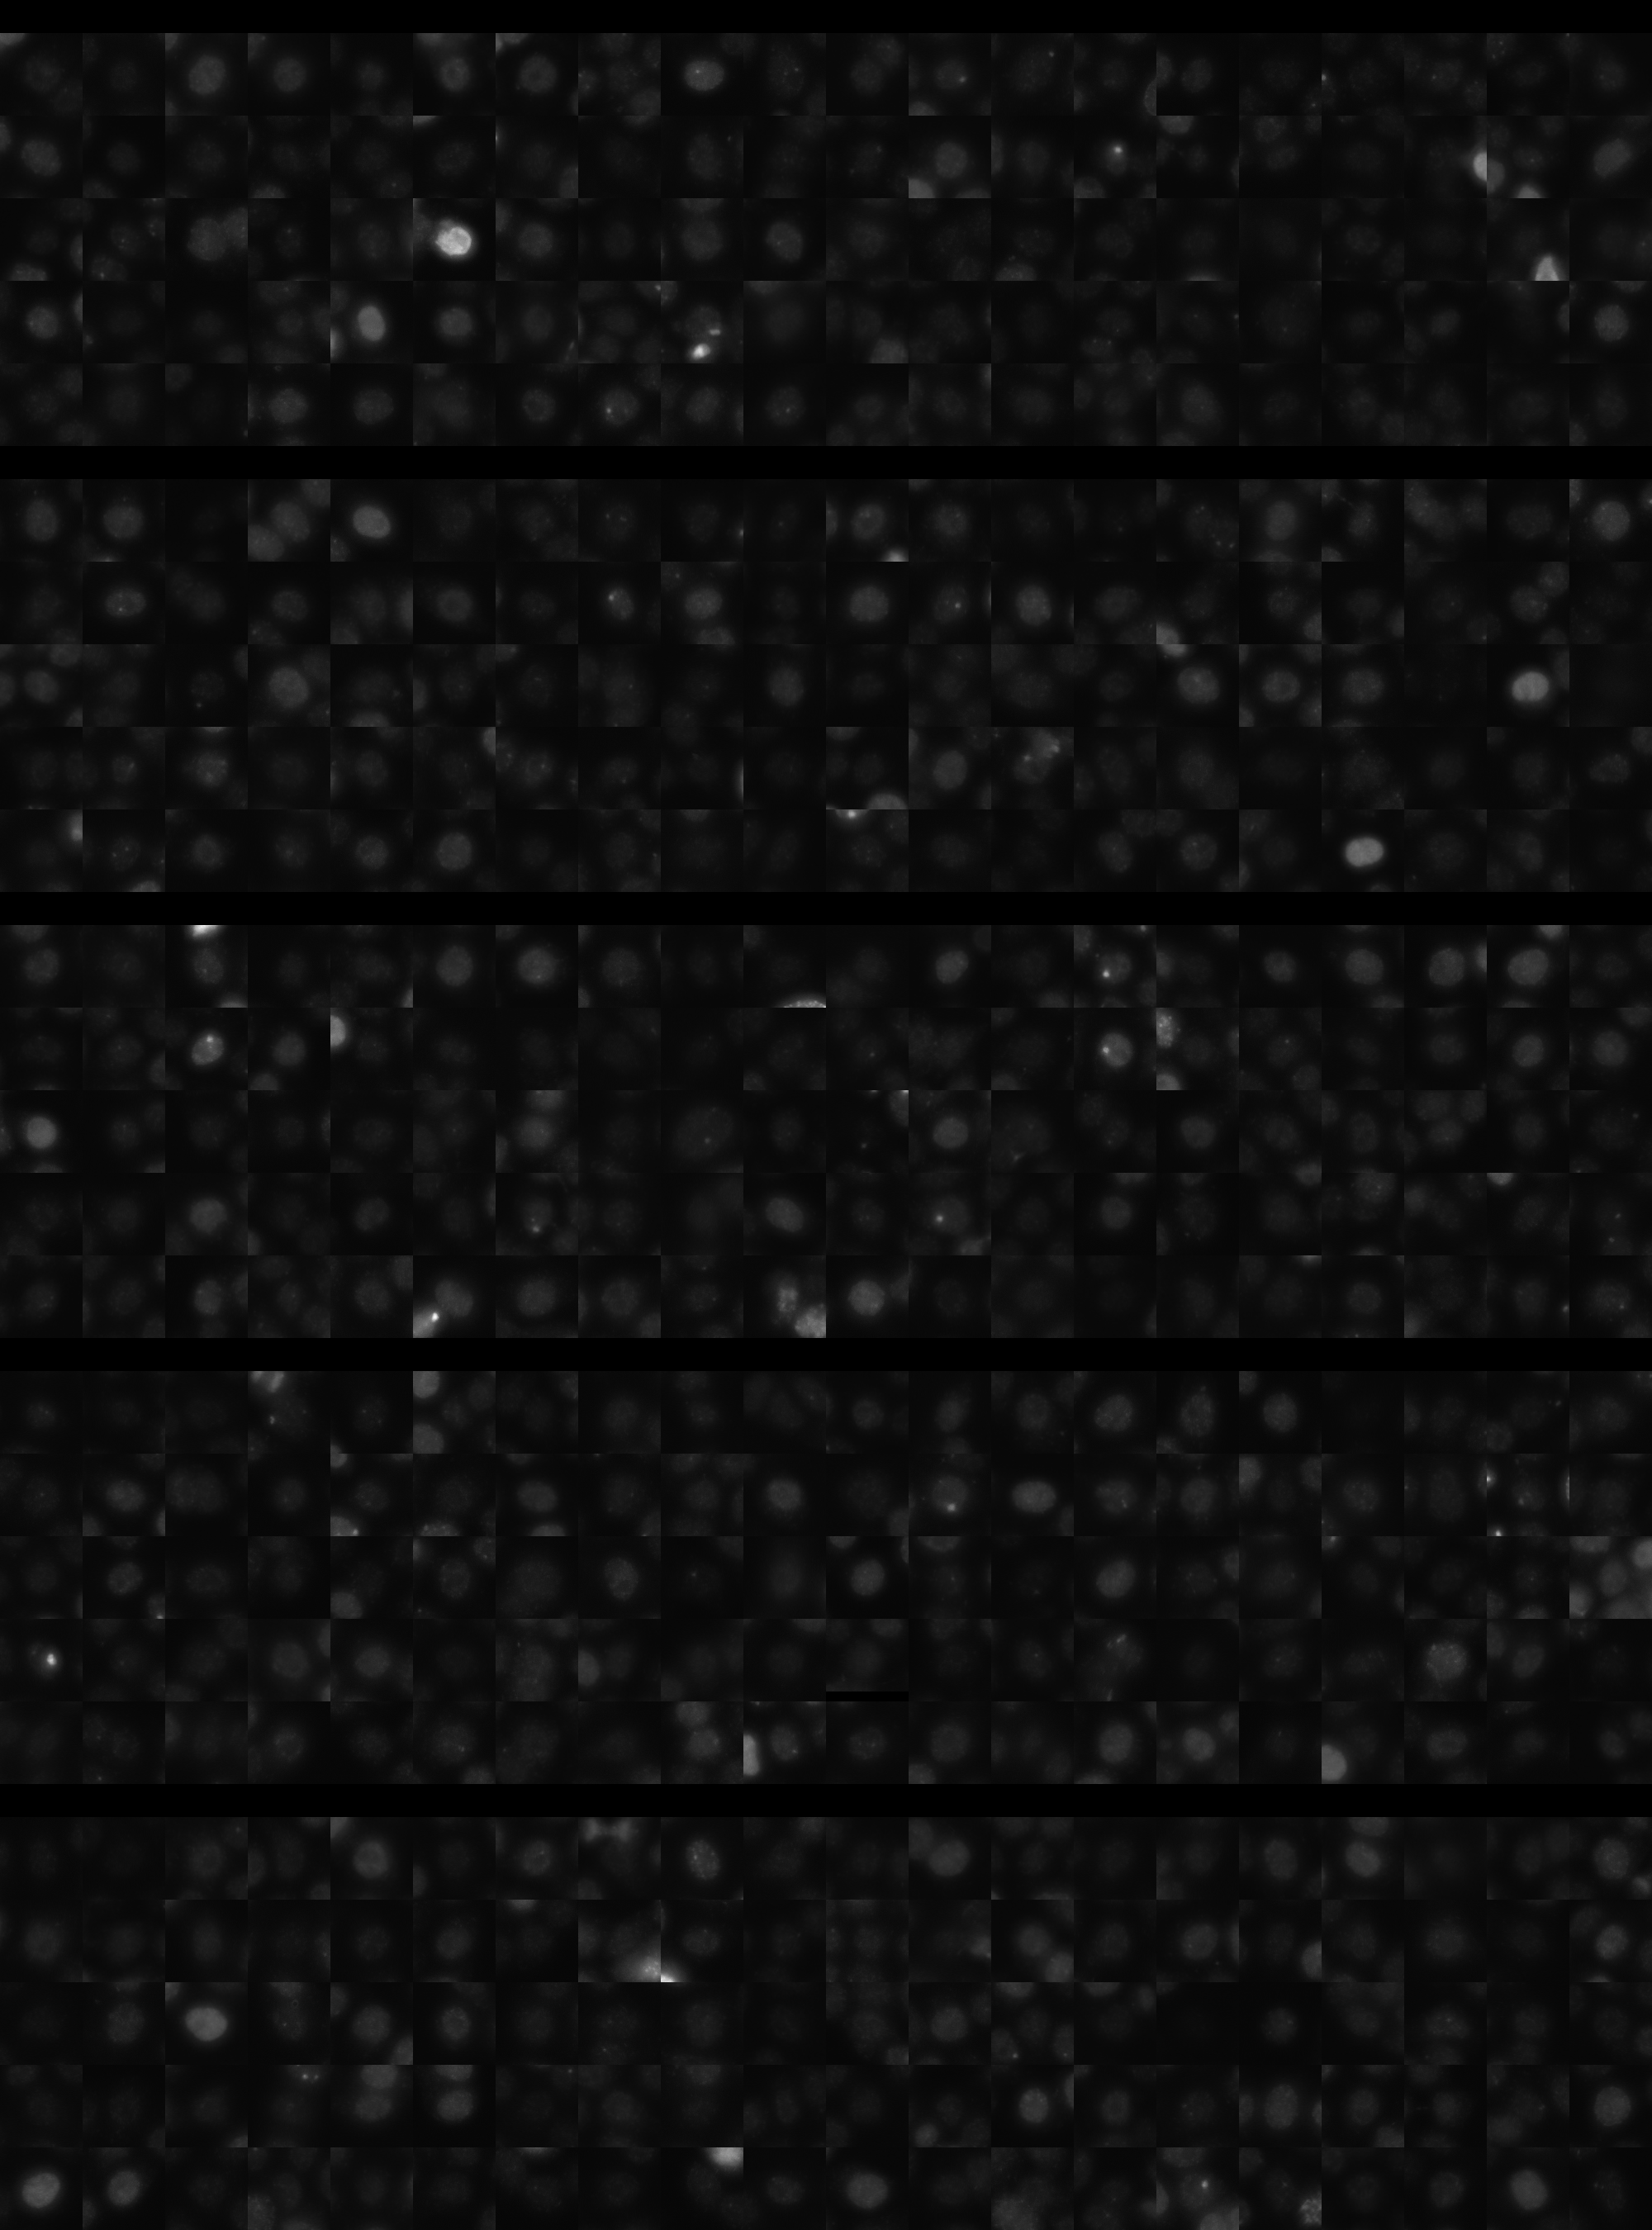
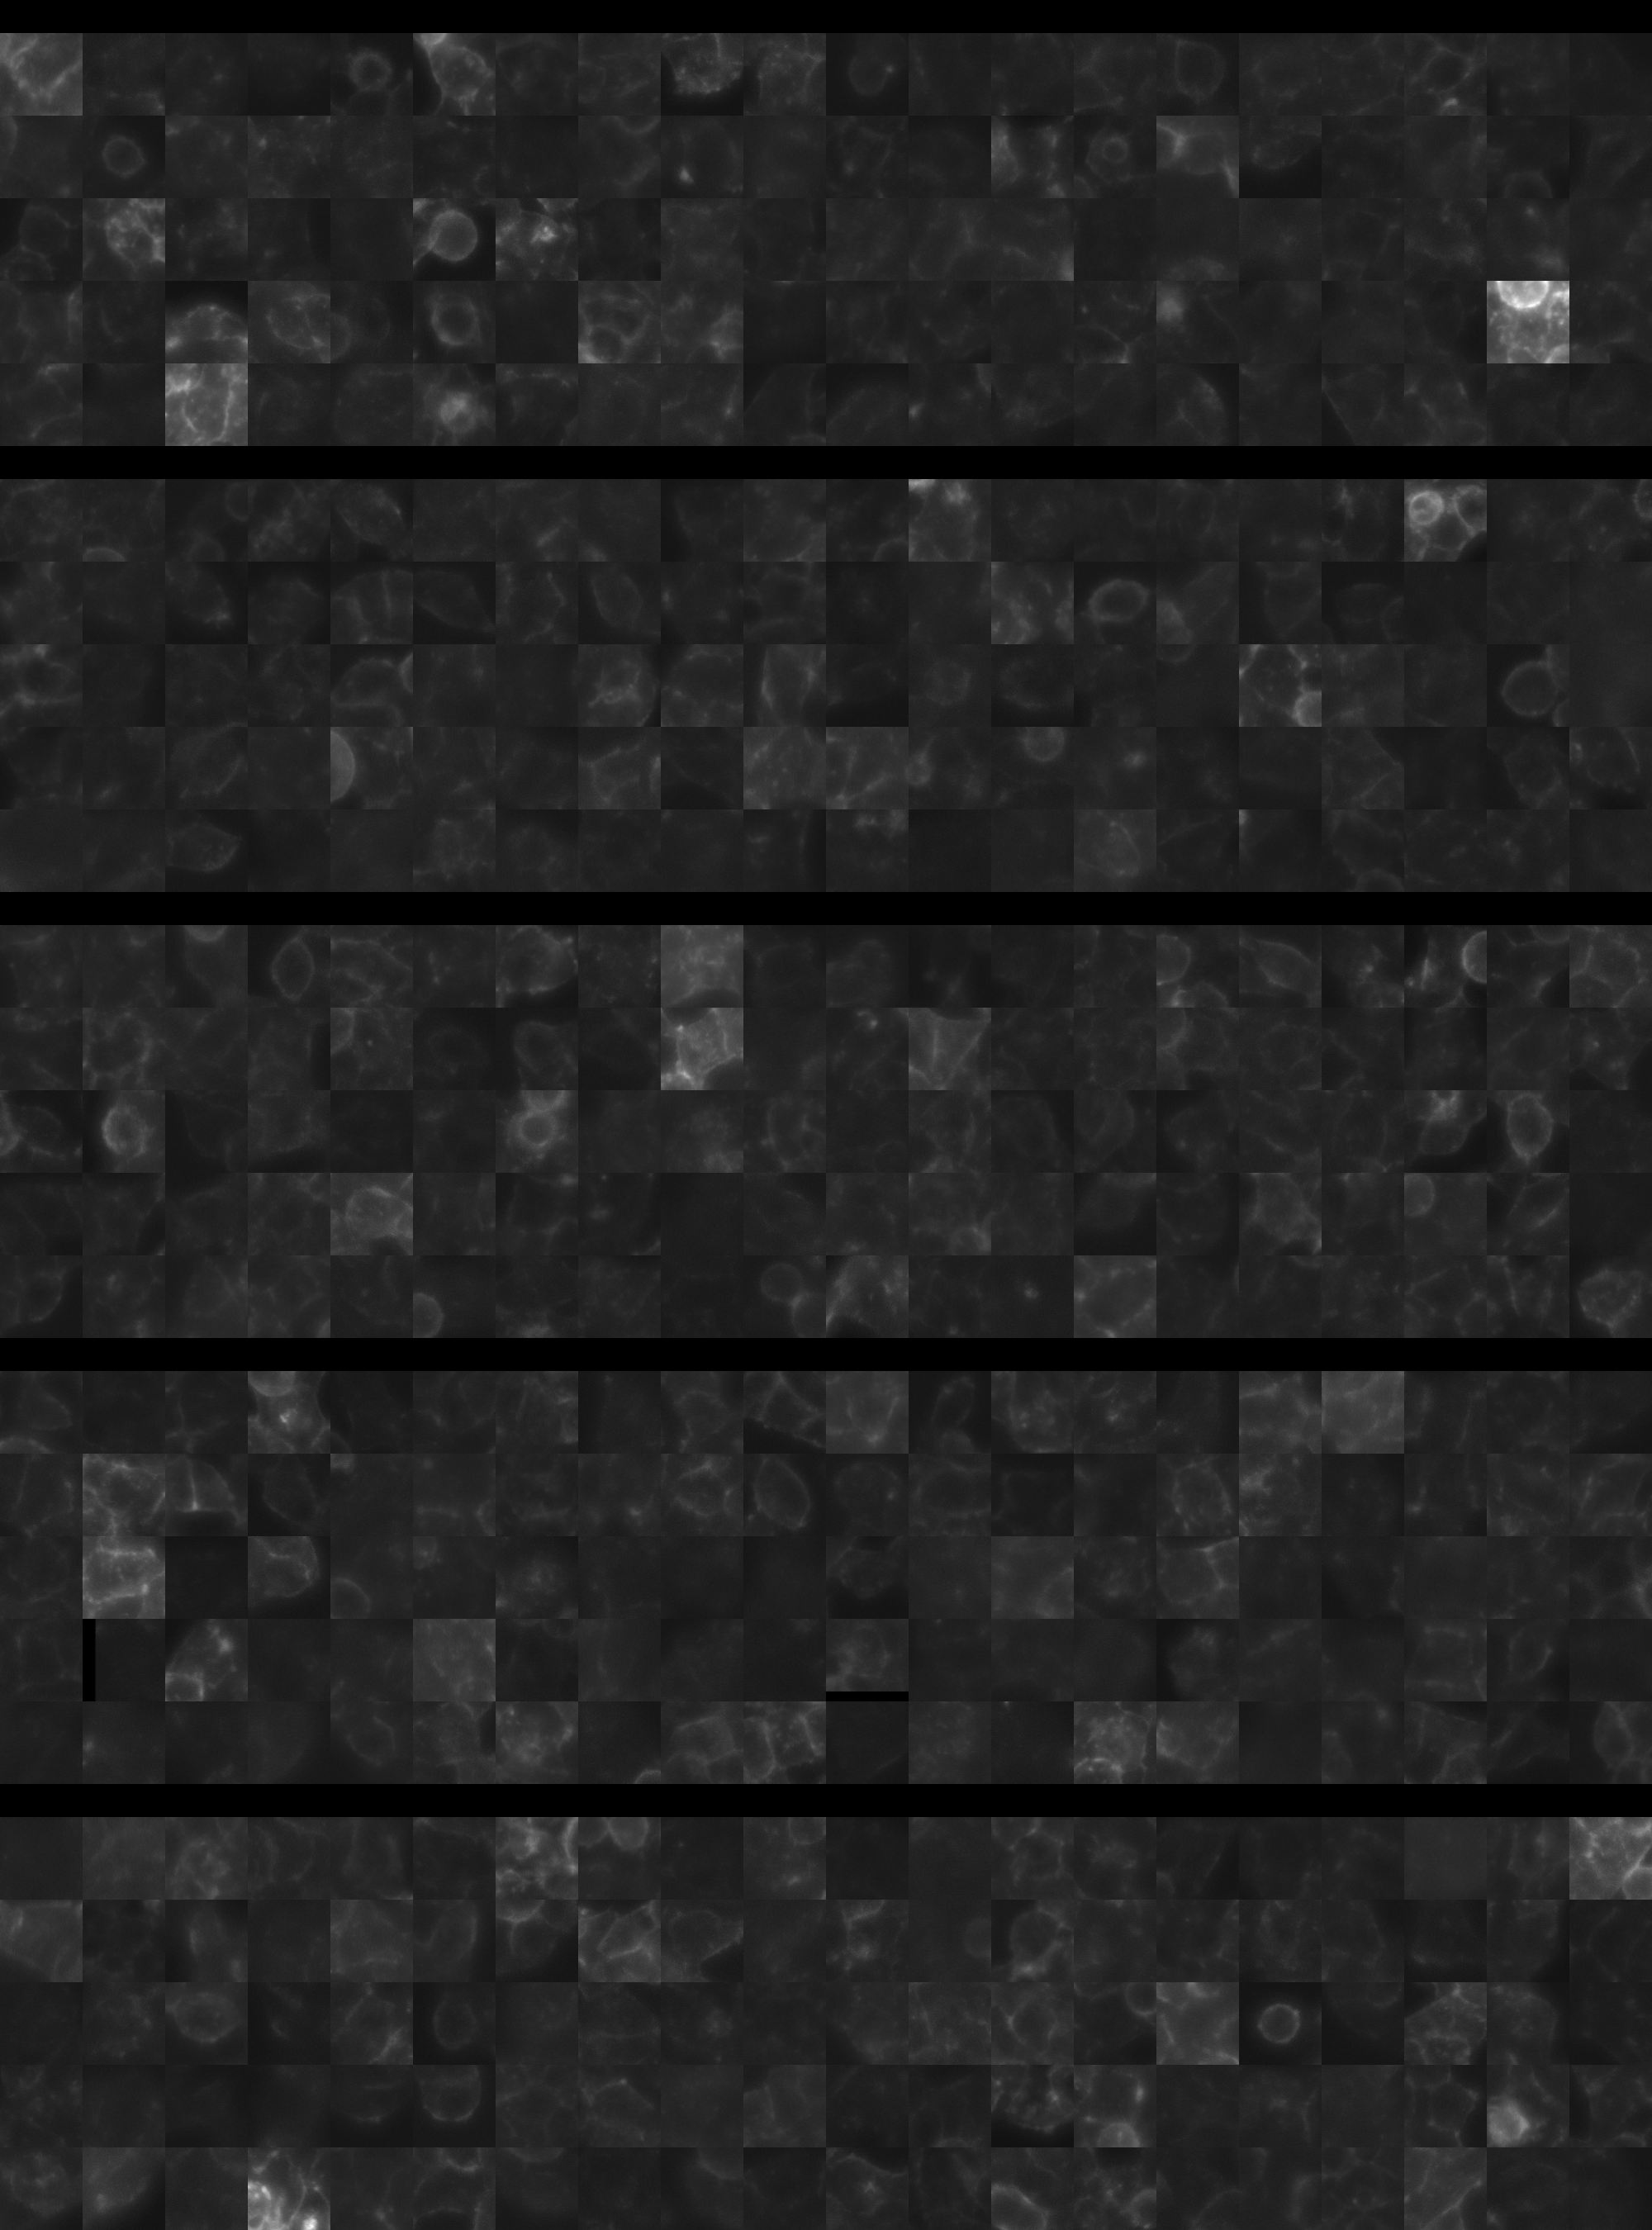
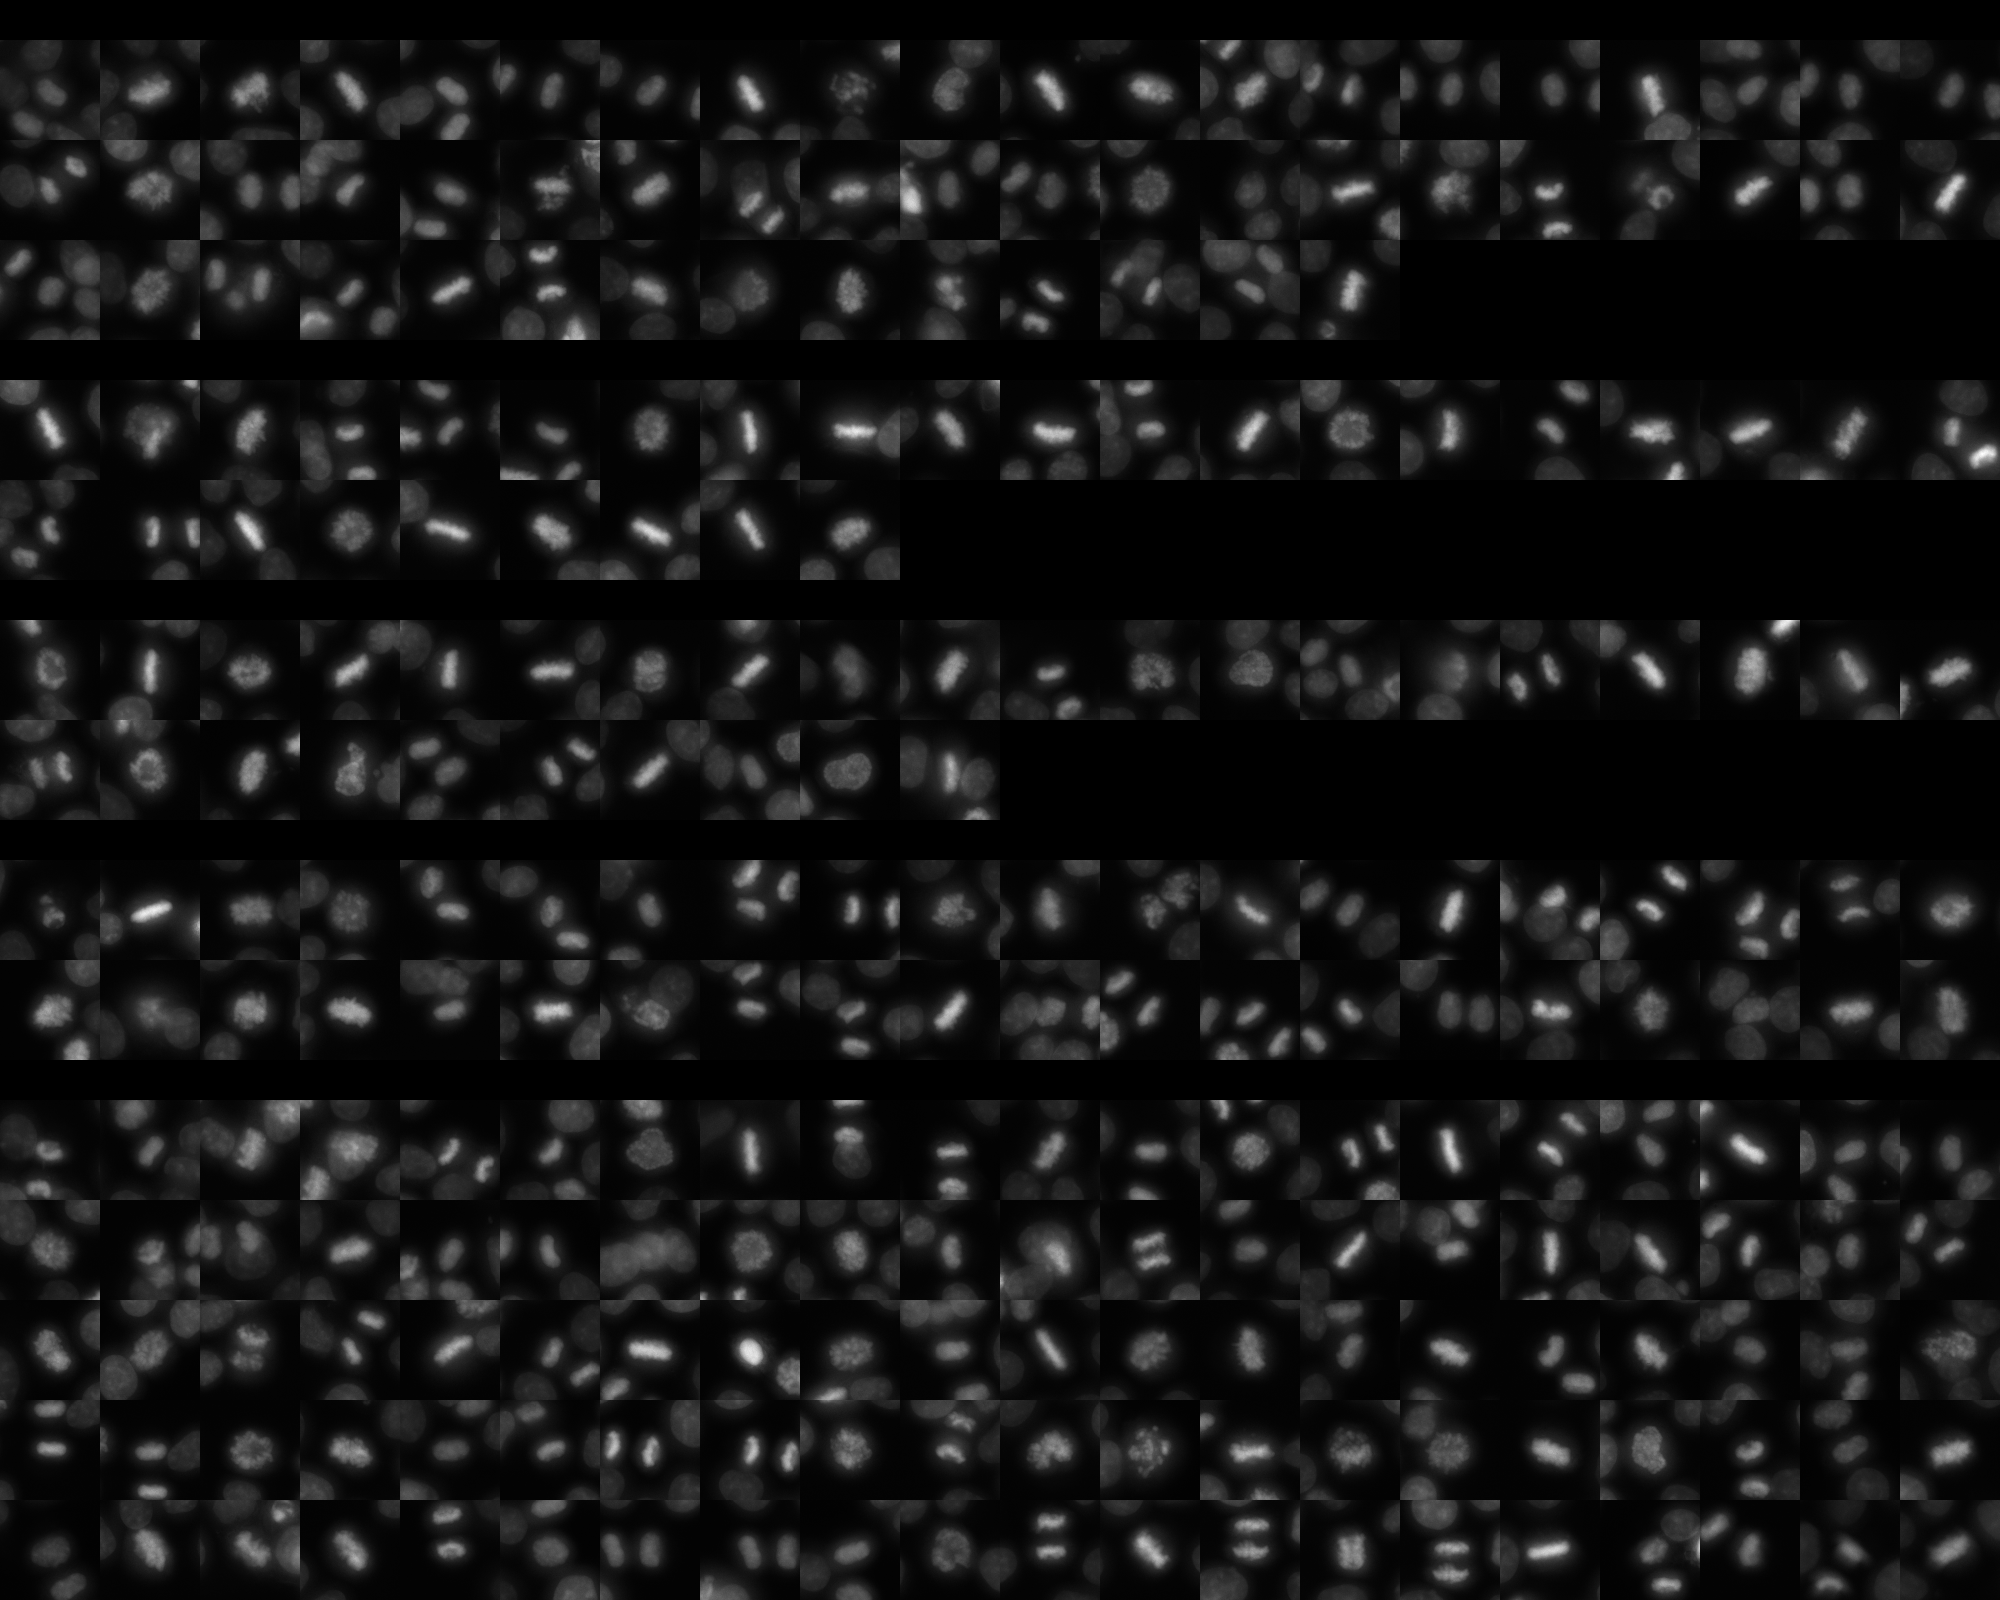
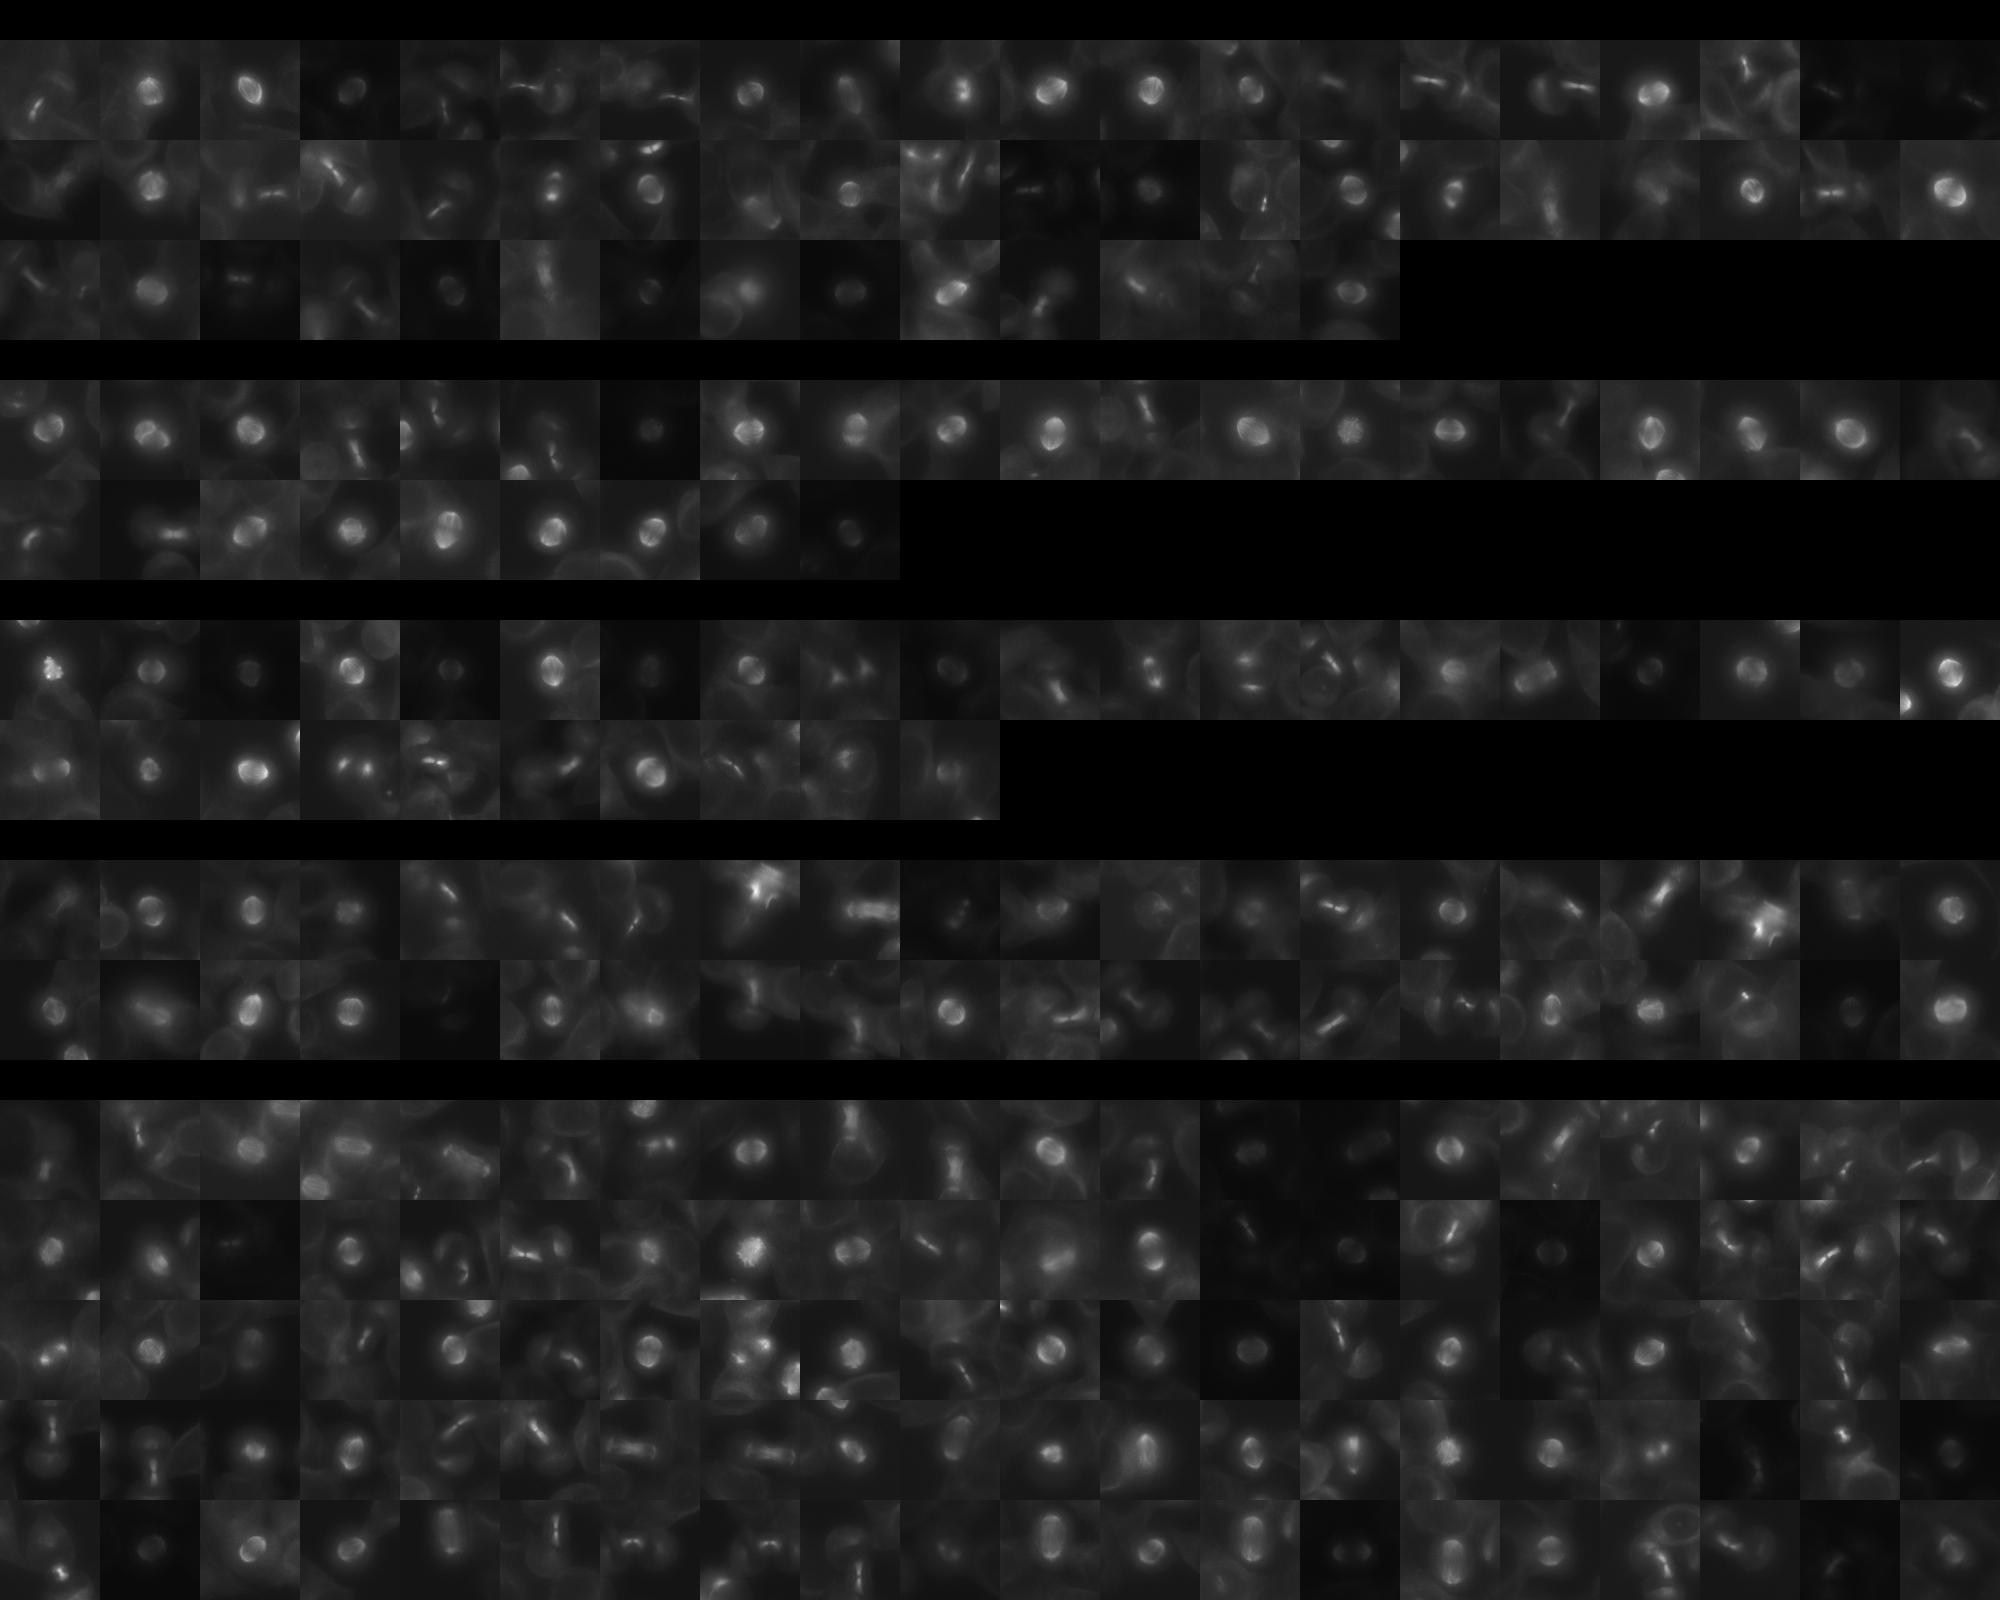
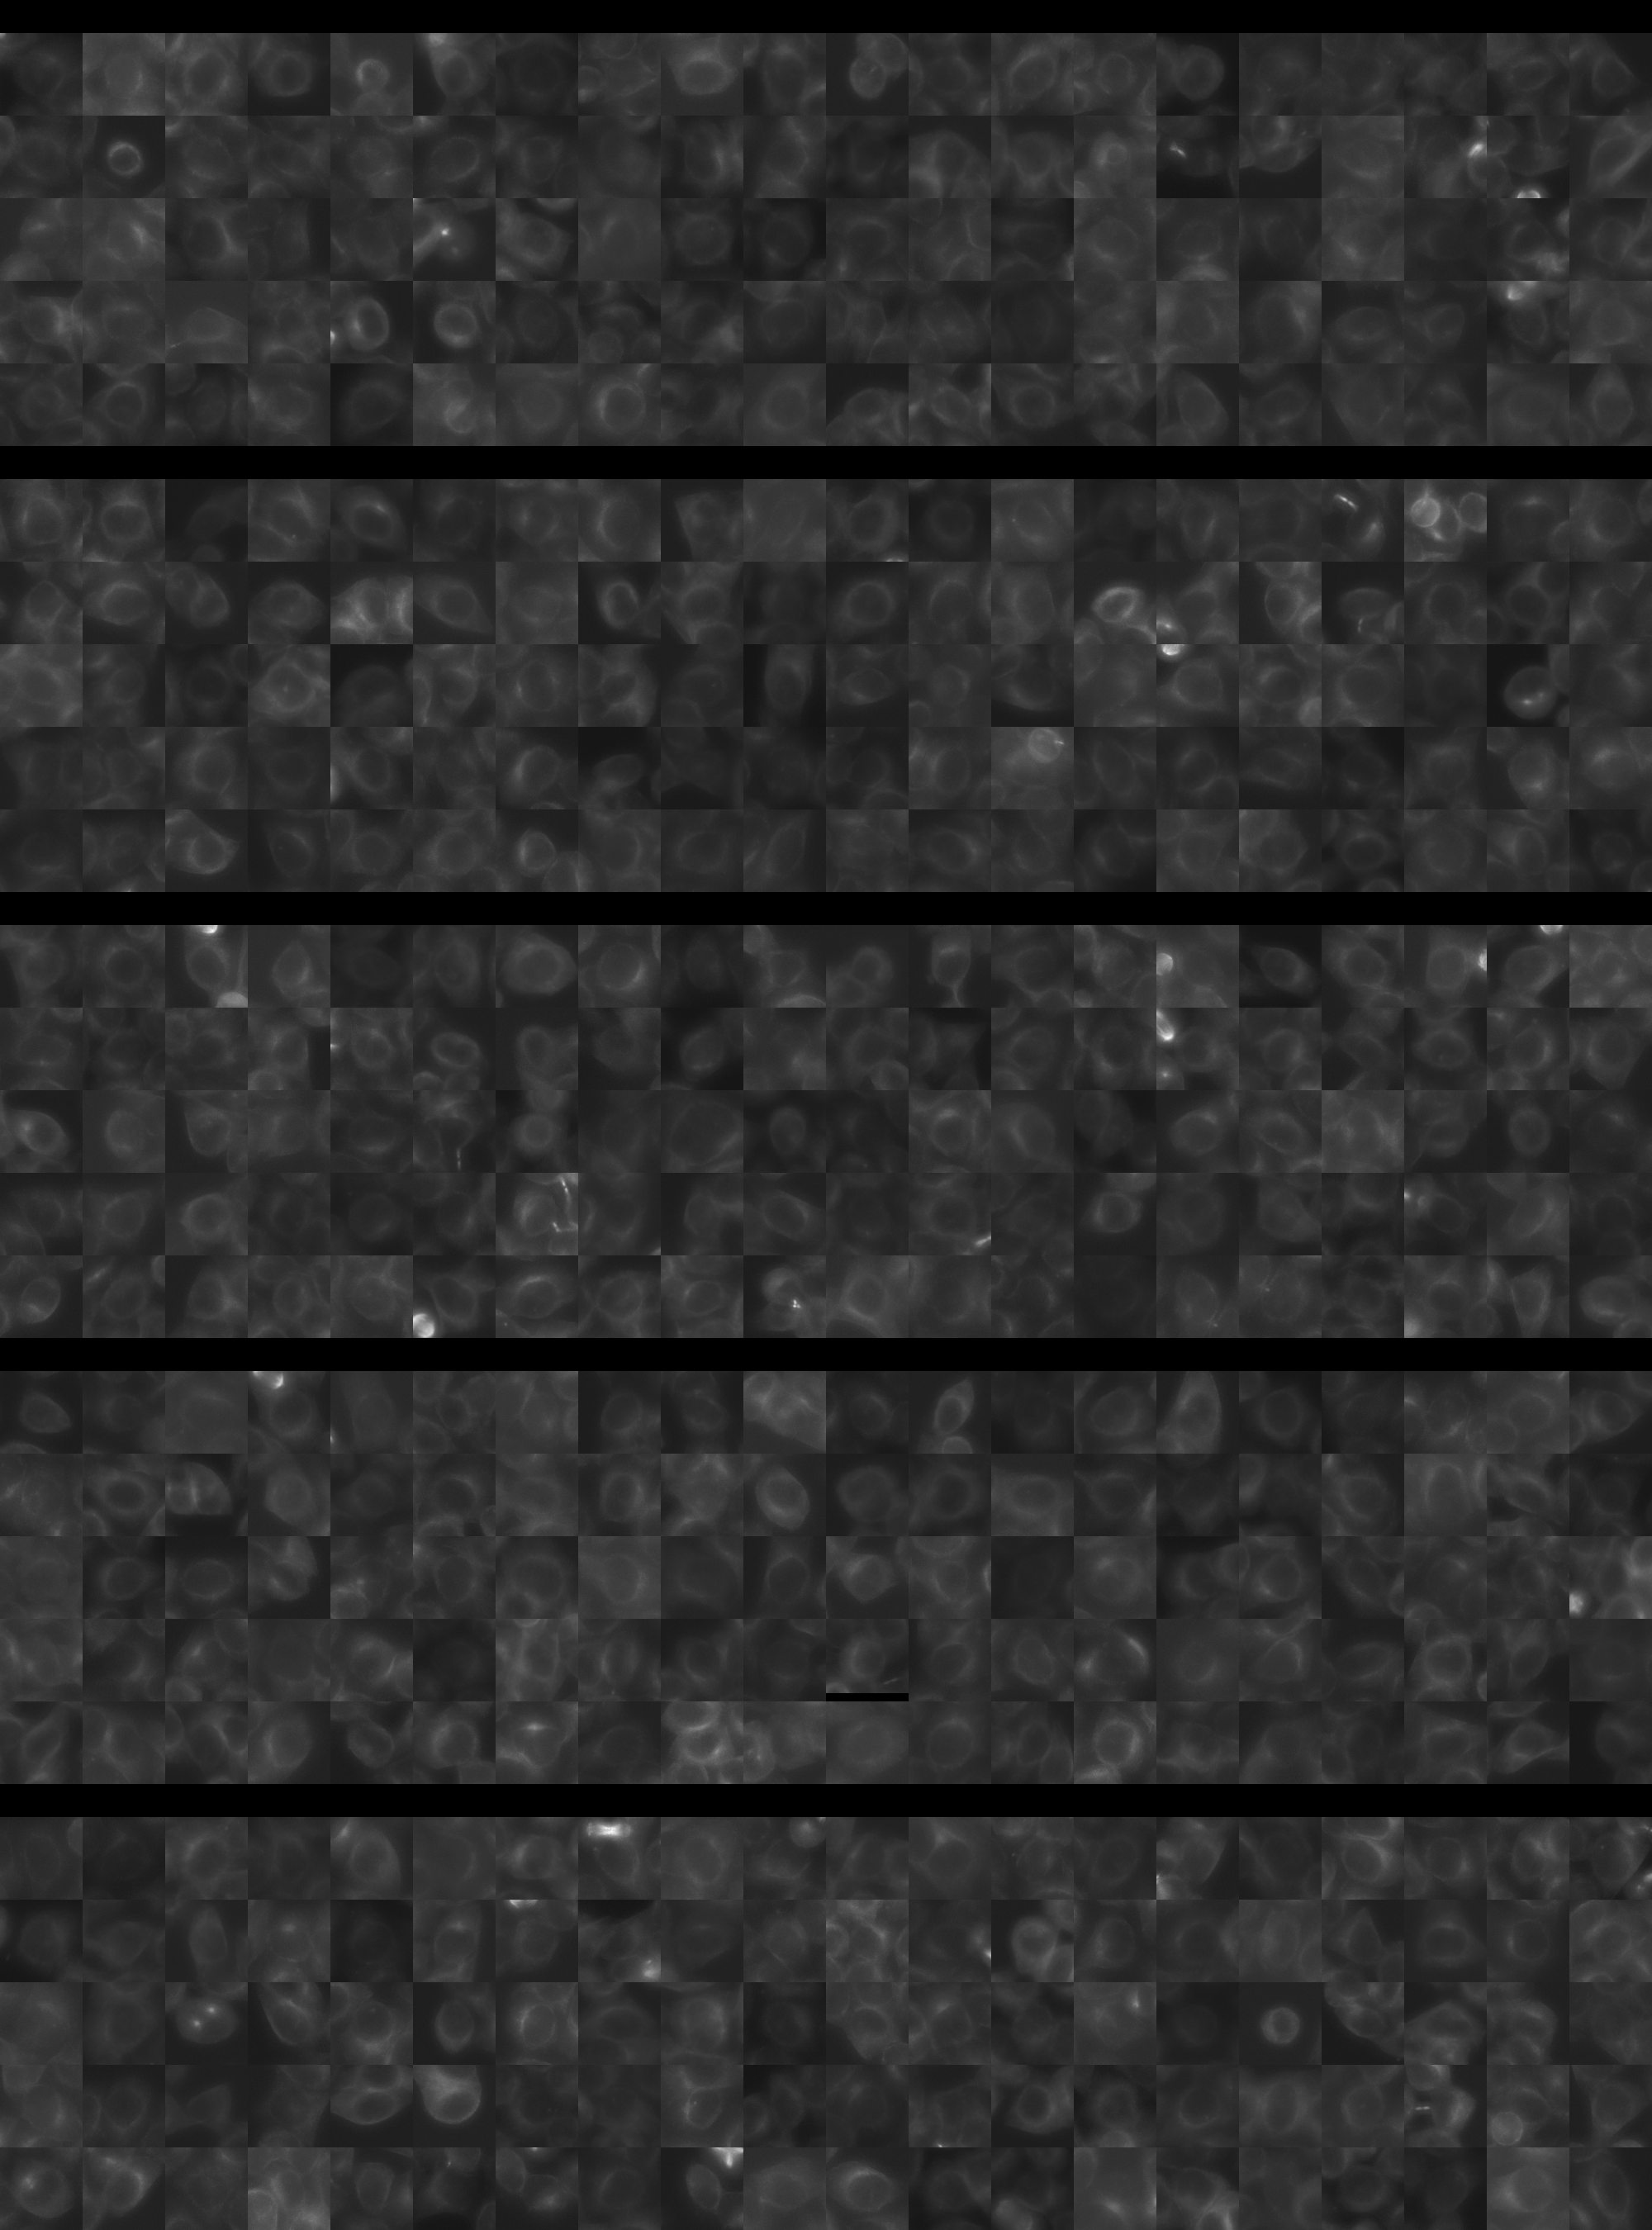
Each montage below shows randomly selected individual cell images for the same target gene separated by sgRNA, along with an example montage of cells expressing a non-targeting negative control sgRNA at the bottom. sgRNA labels in the montages correspond to the numbered sgRNA sequences in the gene info table above. The DNA (blue) and tubulin (green) channels are displayed by default, with gH2AX (grayscale) and actin (yellow) available using the check boxes. Channel brightness, contrast, and opacity are adjustable by clicking the arrow next to the channel name. When only one channel is selected, the display defaults to grayscale. Click the “Zoom” checkbox above the channel controls to enable image zooming (via scrolling) and panning (via click-and-drag).

The cell boxes displayed for this gene are square, 30.36 μm per side for the interphase montage and 30.36 μm per side for the mitotic montage.
Features

Interphase Score Rank FDR q-value
Nucleus DNA Integrated 0.045 1142 of 5322 0.517
Nucleus DNA Mean -3.518e-02 3157 of 5322 0.481
Nucleus gH2AX Mean 0.083 2442 of 5322 0.045
Nucleus DNA - gH2AX Correlation -4.344e-02 2169 of 5322 0.148
Nucleus Shape Area 0.036 2078 of 5322 0.626
Nucleus Shape Eccentricity 0.008 2900 of 5322 0.868
Nucleus Shape Form Factor -5.494e-02 2926 of 5322 0.183
Nucleus Shape Solidity -2.809e-02 1664 of 5322 0.464
Cell DNA Mass Displacement -1.993e-04 4374 of 5322 0.973
Cell Tubulin Mean -2.036e-02 3534 of 5322 0.767
Cell Tubulin Mass Displacement 0.058 488 of 5322 0.171
Cell Actin Mean -2.237e-02 3700 of 5322 0.741
Cell Tubulin - Actin Correlation 0.015 2924 of 5322 0.784
Cell DNA - Tubulin Correlation 0.022 2916 of 5322 0.632
Cell Shape Area 0.027 2261 of 5322 0.810
Cell Shape Eccentricity 0.035 1182 of 5322 0.633
Mitotic Score Rank FDR q-value
Nucleus DNA Integrated 0.096 2551 of 5322 0.965
Nucleus DNA Mean 0.017 2654 of 5322 1.000
Nucleus DNA Mass Displacement -6.628e-03 3619 of 5322 0.999
Nucleus DNA Mean Frac 3 -9.936e-03 3280 of 5322 1.000
Nucleus gH2AX Mean 0.450 106 of 5322 0.684
Nucleus gH2AX Mean Frac 0 -6.907e-02 3348 of 5322 1.000
Nucleus Tubulin Mean Frac 0 0.029 3044 of 5322 0.999
Nucleus Tubulin Mean Edge 0.139 1371 of 5322 0.999
Nucleus Tubulin Std Edge 0.098 1287 of 5322 0.999
Nucleus Shape Area 0.150 2011 of 5322 0.968
Nucleus Shape Eccentricity 0.200 233 of 5322 1.000
Nucleus Shape Form Factor 0.018 1164 of 5322 0.998
Cell Tubulin Mean 0.189 1066 of 5322 0.997
Cell Tubulin Mean Frac 3 -1.945e-01 4013 of 5322 0.999
Cell Actin Mean 0.173 1073 of 5322 0.997
Cell Shape Area 0.223 1181 of 5322 0.994
( Reset Zoom )
Brightness
Contrast
Opacity
Brightness
Contrast
Opacity
Brightness
Contrast
Opacity
Brightness
Contrast
Opacity
Brightness
Contrast
Opacity

( Reset Zoom )
Brightness
Contrast
Opacity
Brightness
Contrast
Opacity
Brightness
Contrast
Opacity
Brightness
Contrast
Opacity
Brightness
Contrast
Opacity

MIT Central Accessability