TNPO1

Gene symbol: TNPO1
Gene: 3842
Uniprot Function: Functions in nuclear protein import as nuclear transport receptor. Serves as receptor for nuclear localization signals (NLS) in cargo substrates (PubMed:24753571). Is thought to mediate docking of the importin/substrate complex to the nuclear pore complex (NPC) through binding to nucleoporin and the complex is subsequently translocated through the pore by an energy requiring, Ran-dependent mechanism. At the nucleoplasmic side of the NPC, Ran binds to the importin, the importin/substrate complex dissociates and importin is re-exported from the nucleus to the cytoplasm where GTP hydrolysis releases Ran. The directionality of nuclear import is thought to be conferred by an asymmetric distribution of the GTP- and GDP-bound forms of Ran between the cytoplasm and nucleus (By similarity). Involved in nuclear import of M9-containing proteins. In vitro, binds directly to the M9 region of the heterogeneous nuclear ribonucleoproteins (hnRNP), A1 and A2 and mediates their nuclear import. Appears also to be involved in hnRNP A1/A2 nuclear export. Mediates the nuclear import of ribosomal proteins RPL23A, RPS7 and RPL5. Binds to a beta-like import receptor binding (BIB) domain of RPL23A. In vitro, mediates nuclear import of H2A, H2B, H3 and H4 histones, and SRP19 (By similarity). Mediates nuclear import of ADAR/ADAR1 isoform 1 and isoform 5 in a RanGTP-dependent manner (PubMed:19124606, PubMed:24753571).
Mitotic Index 0.0197
Interphase Cluster: #221 (4 genes)
Mitotic Cluster: #115 (23 genes)
sgRNA 1: ATCACAACTATAGCCTCCAA (interphase cells: 1342, mitotic cells: 27)
sgRNA 2: CGAGCAACATCACAAGTGCT (interphase cells: 140, mitotic cells: 3)
sgRNA 3: GTCCTCGATCGGTGAAAACG (interphase cells: 1279, mitotic cells: 27)
sgRNA 4: TGACCACCCAGTGTGCATAG (interphase cells: 825, mitotic cells: 15)

Interphase Cluster

Mitotic Cluster

Overview

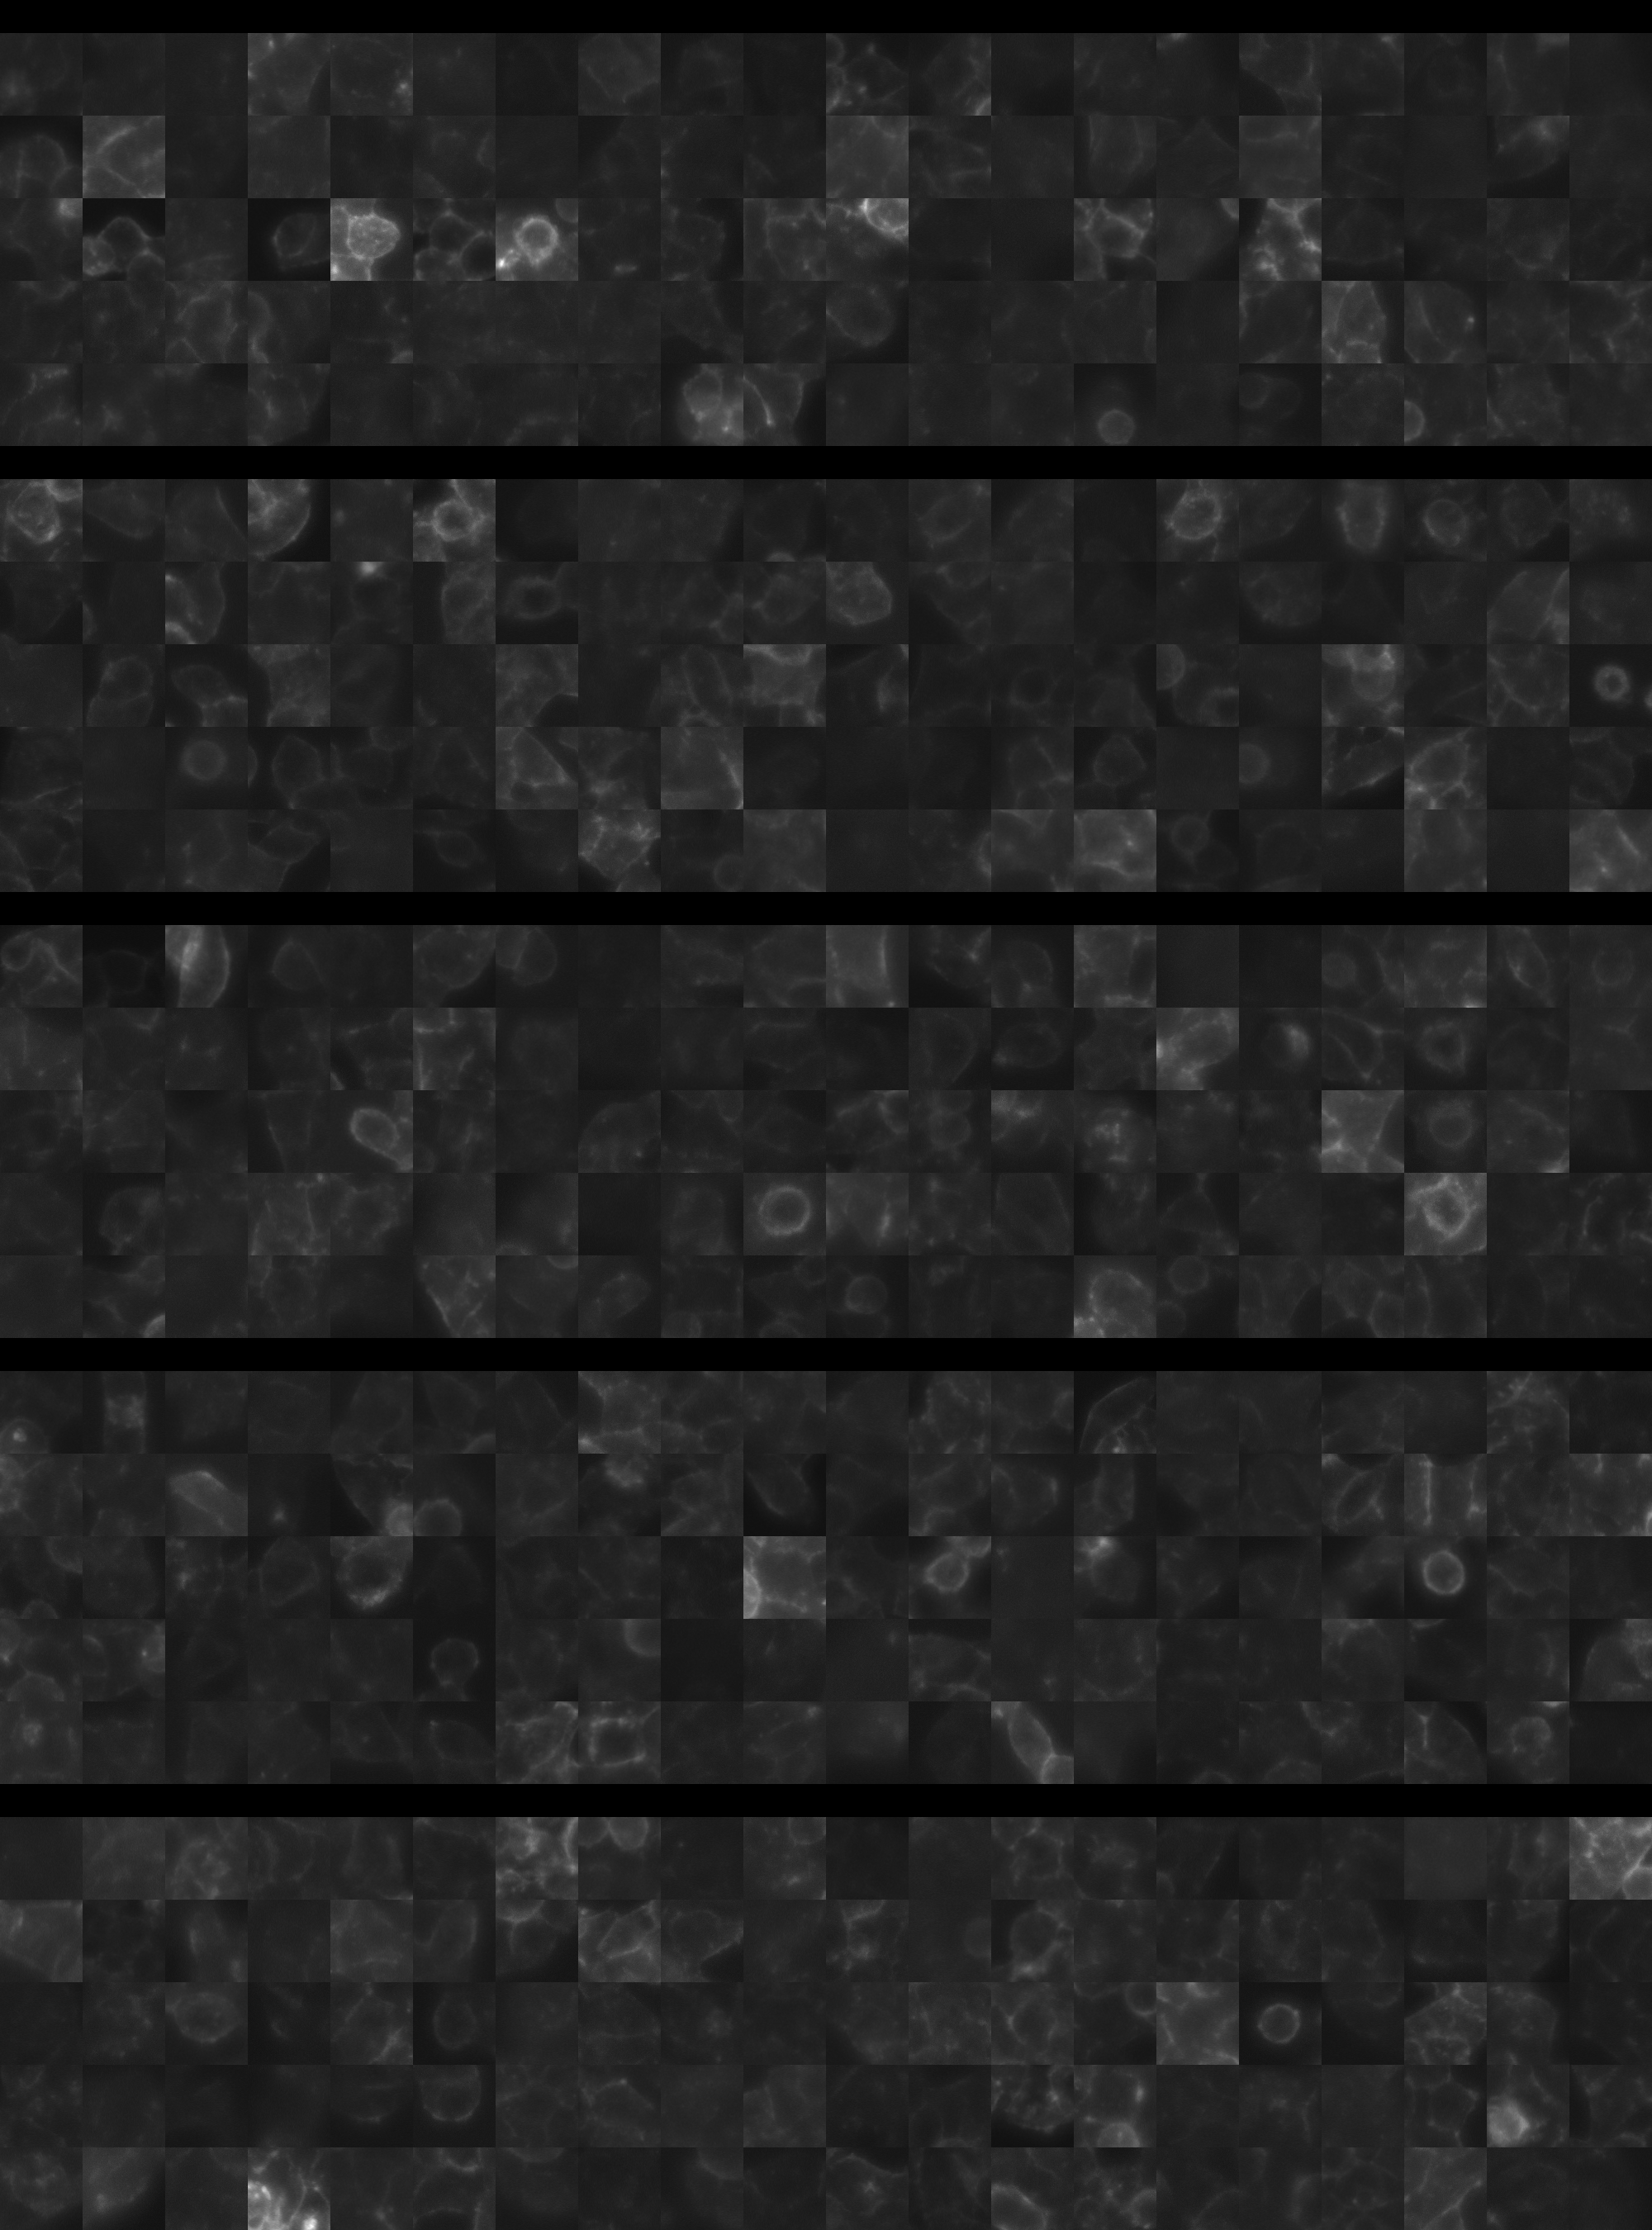
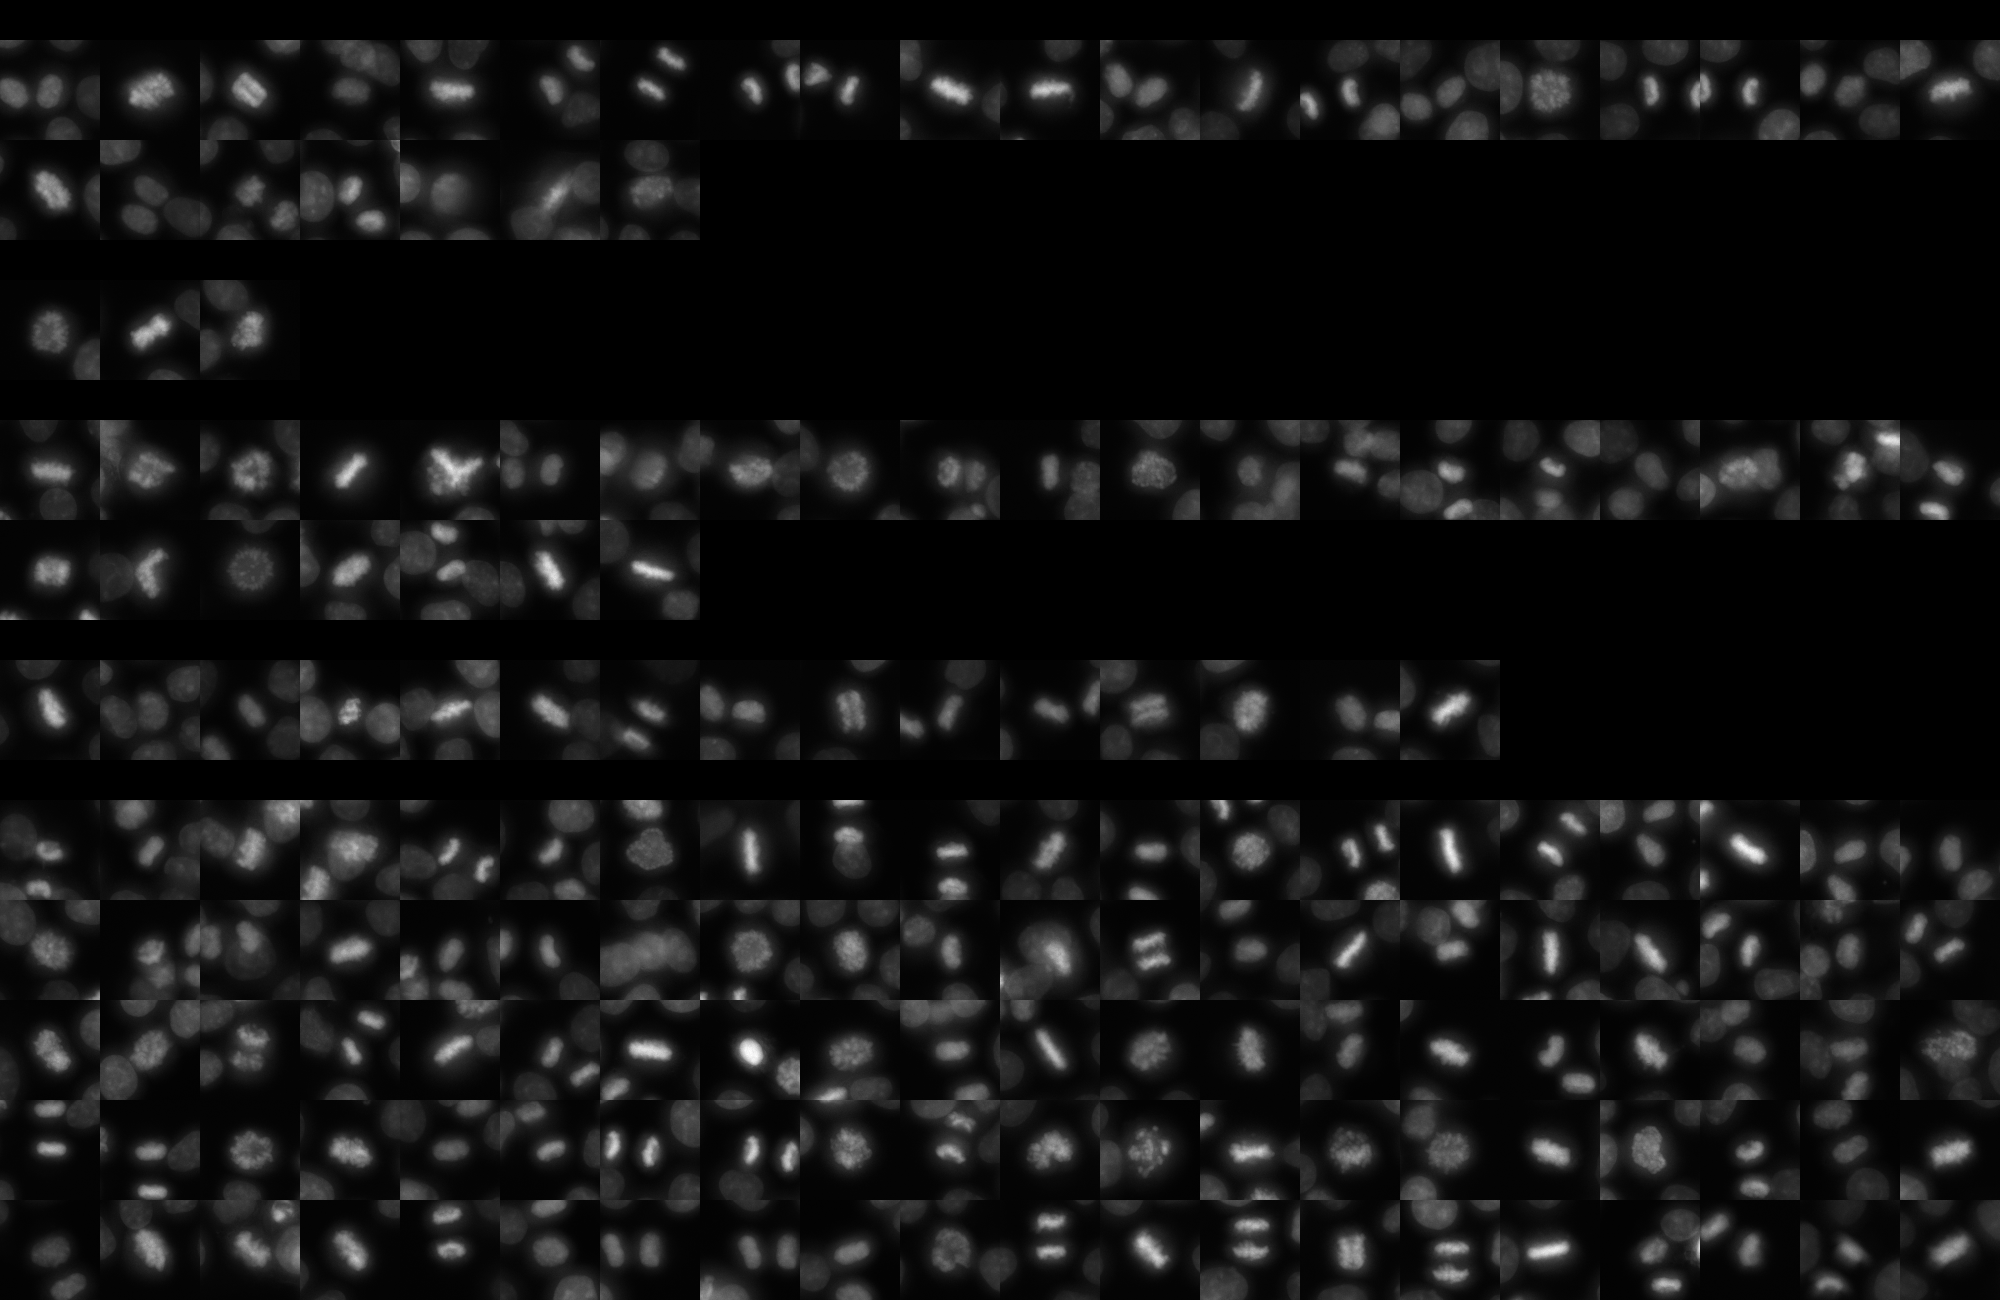
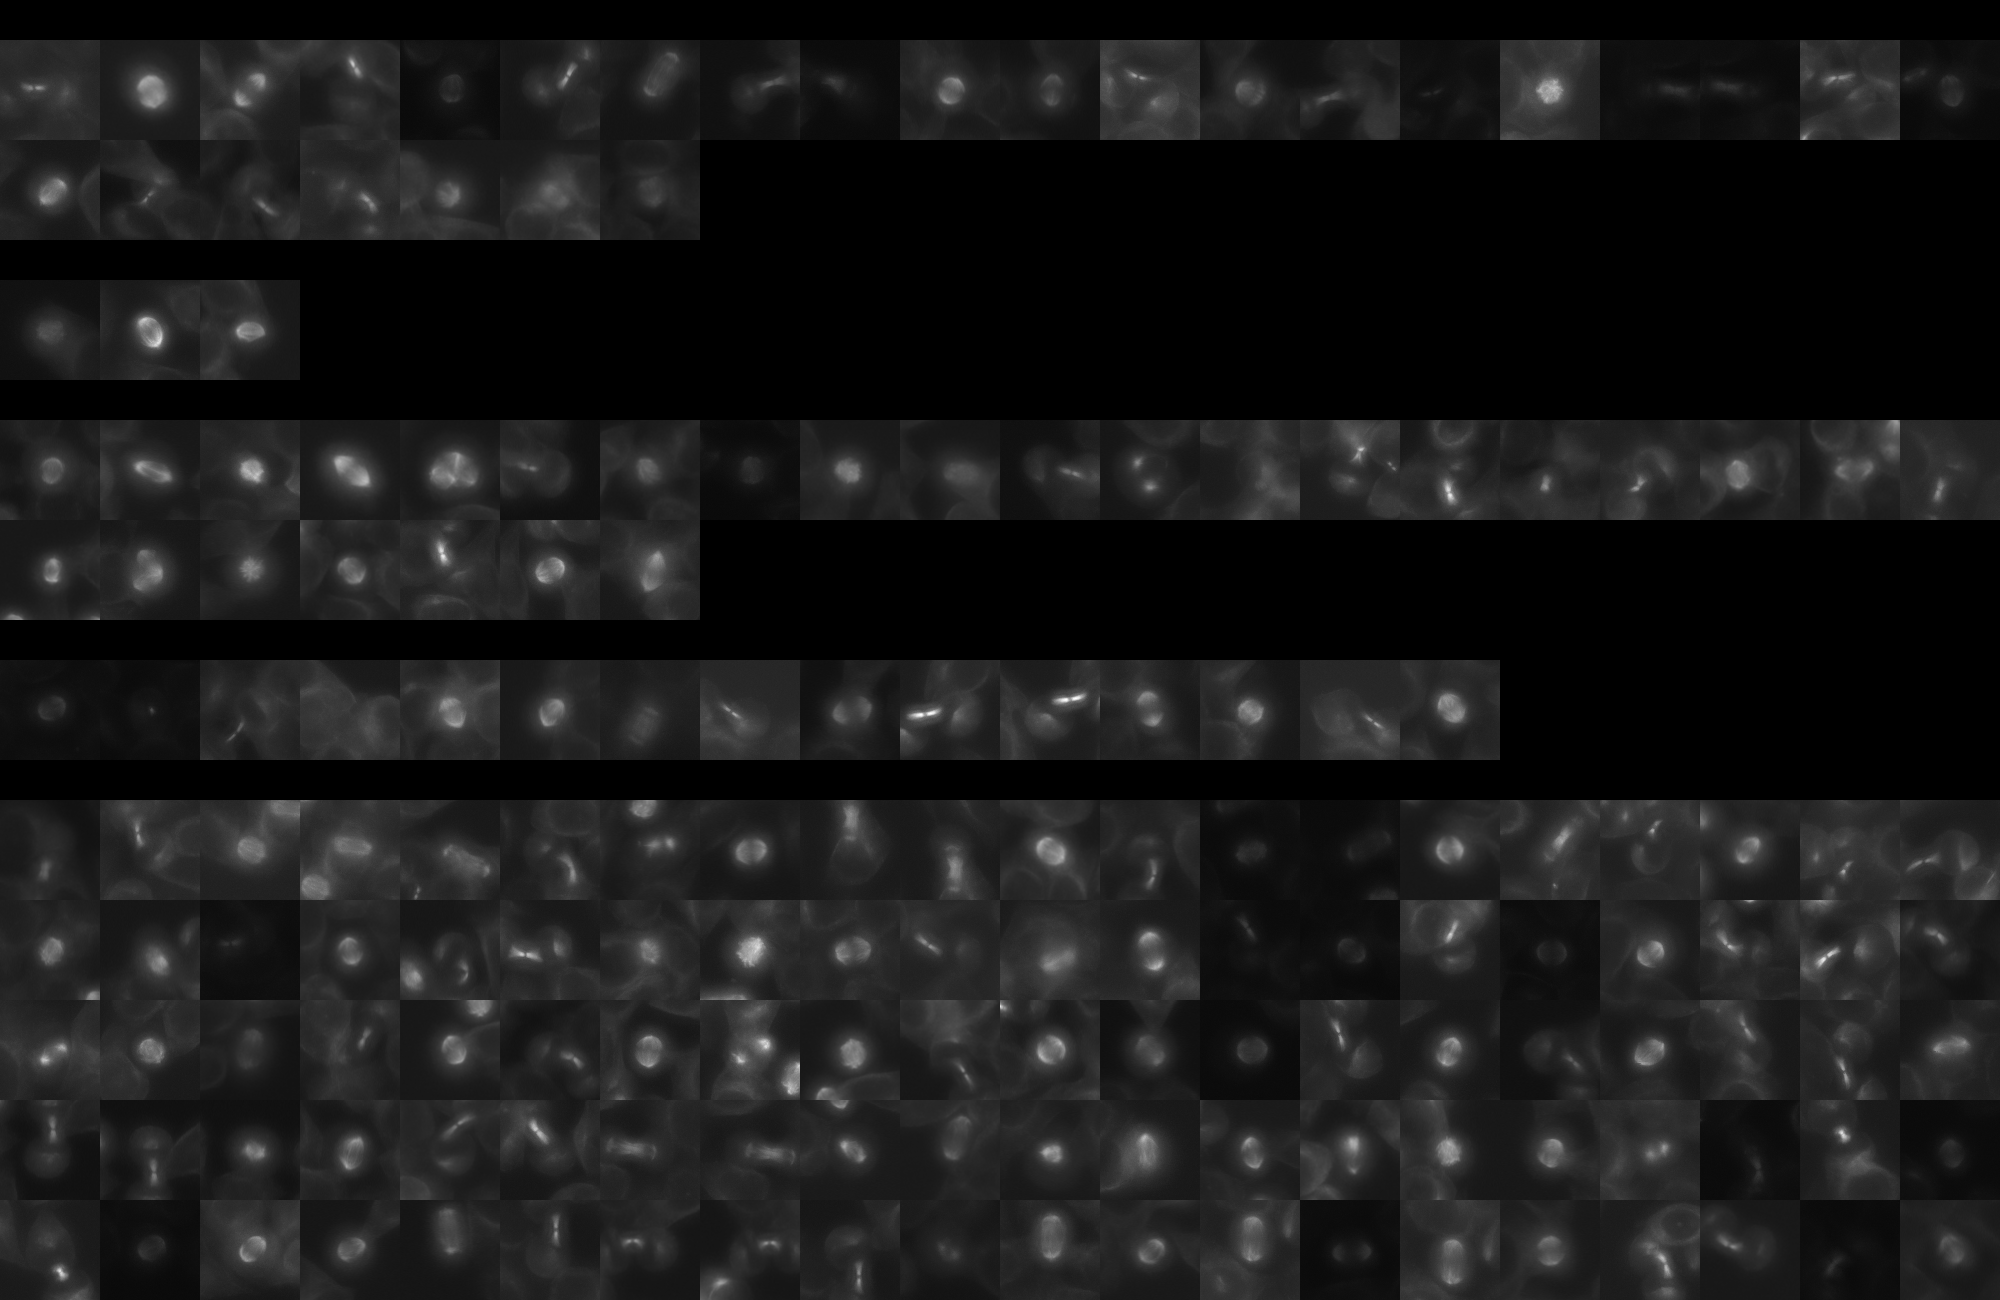
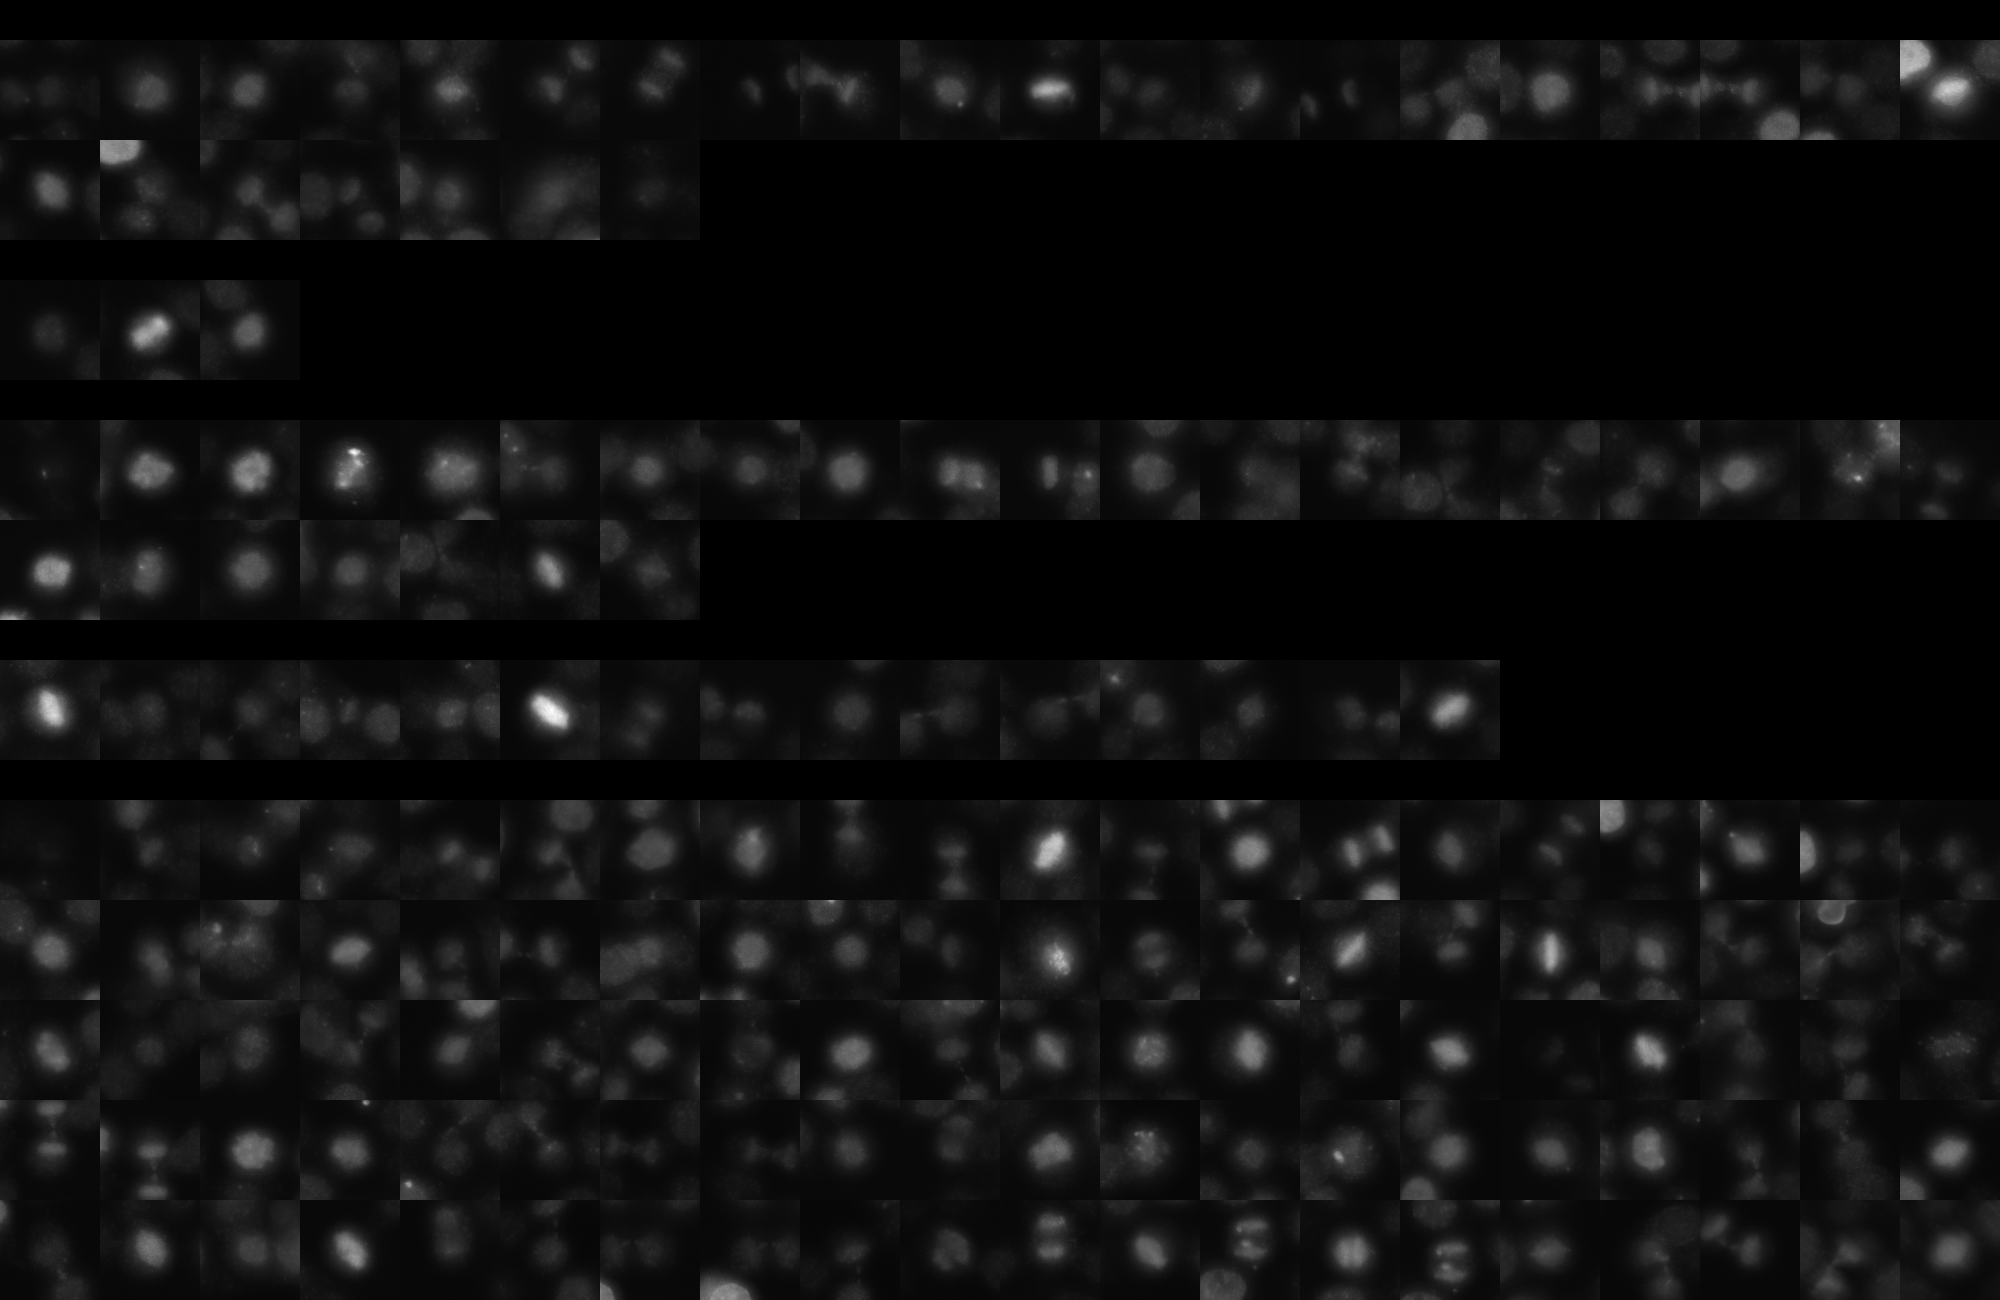
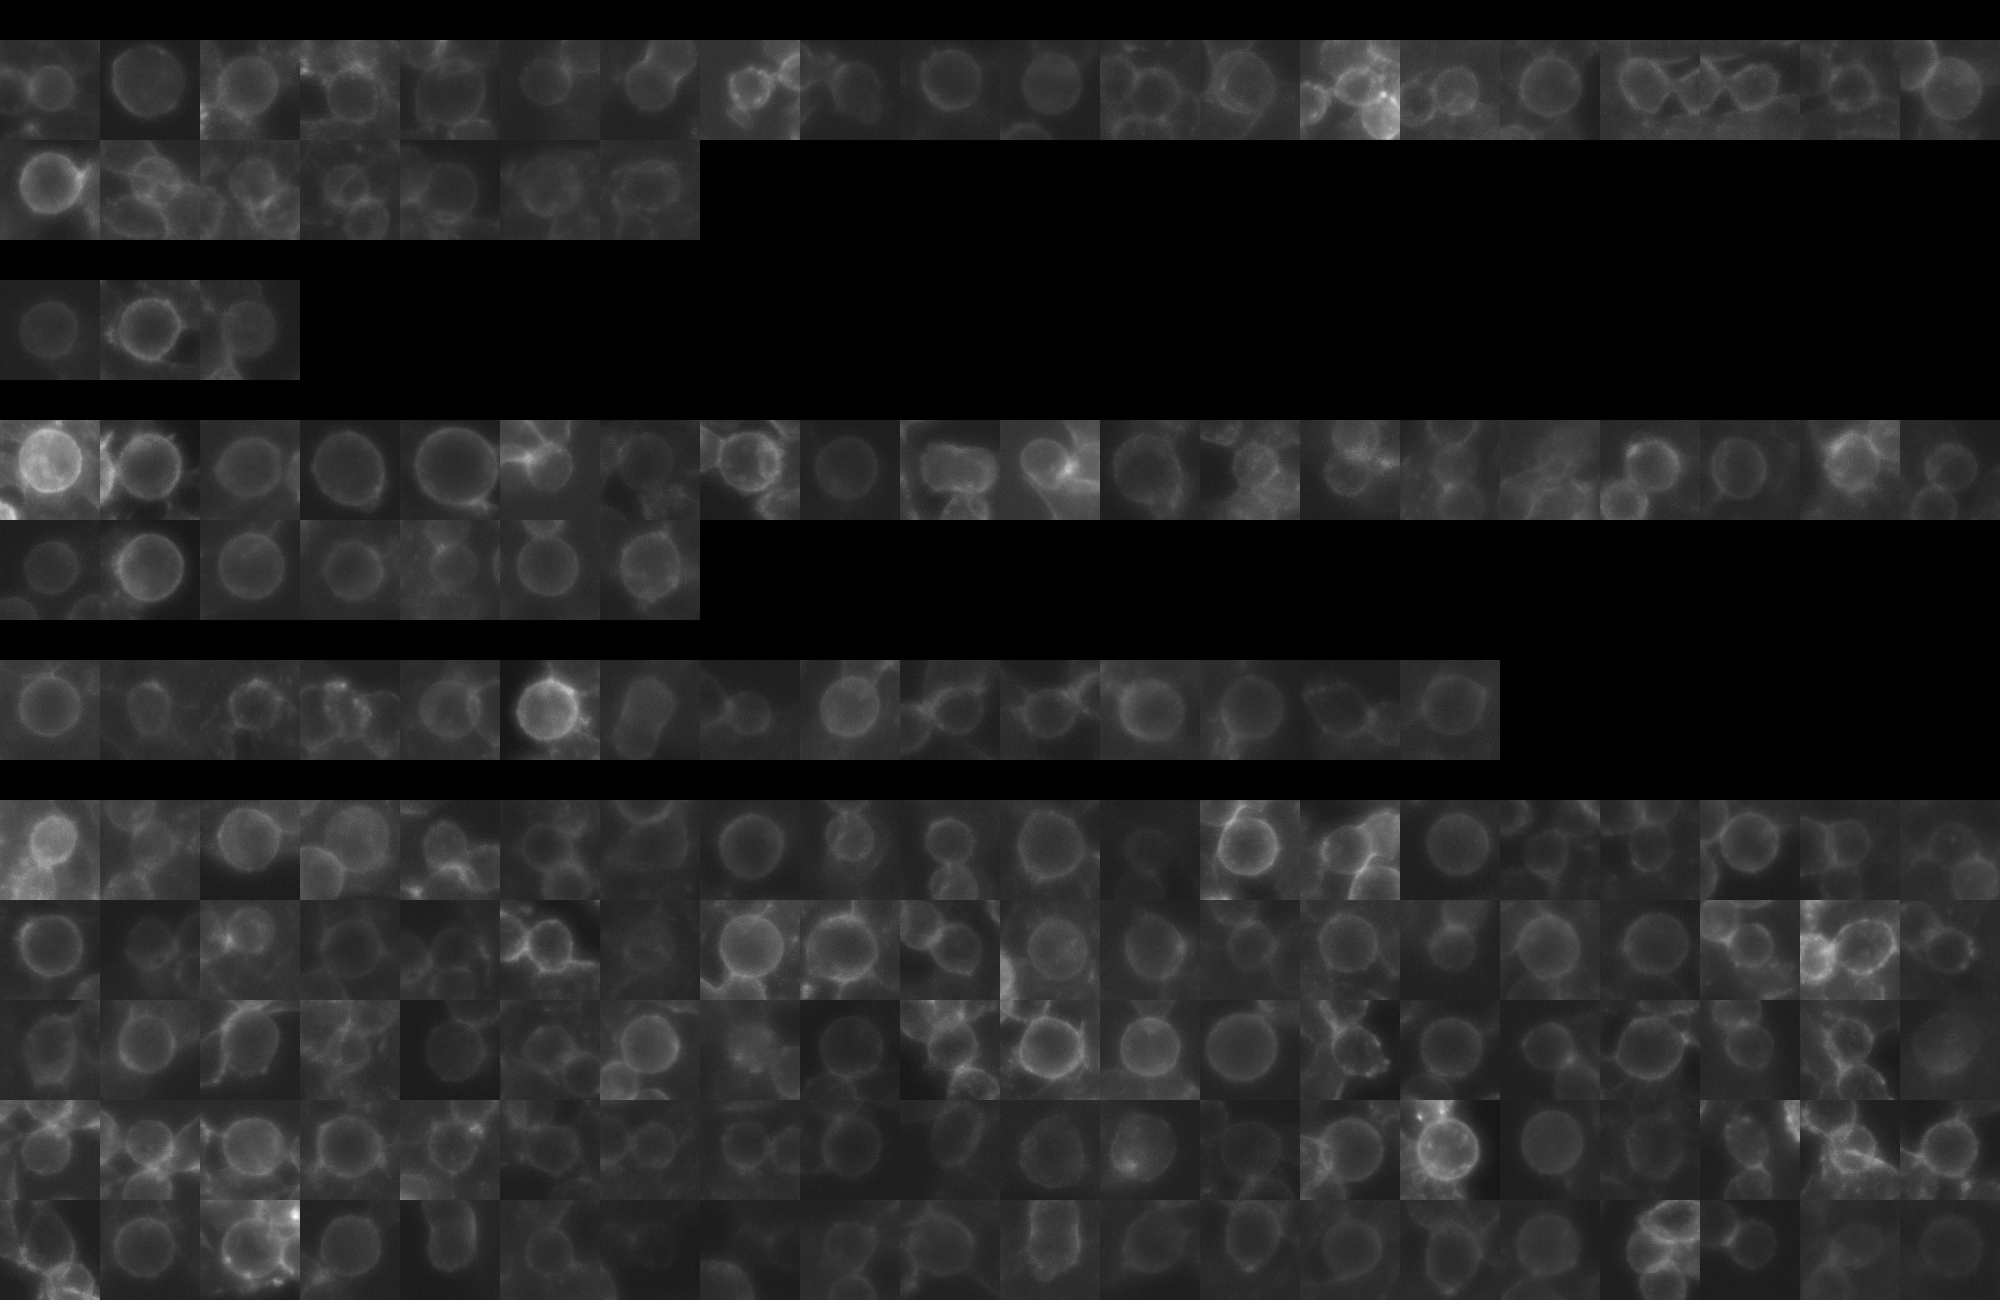
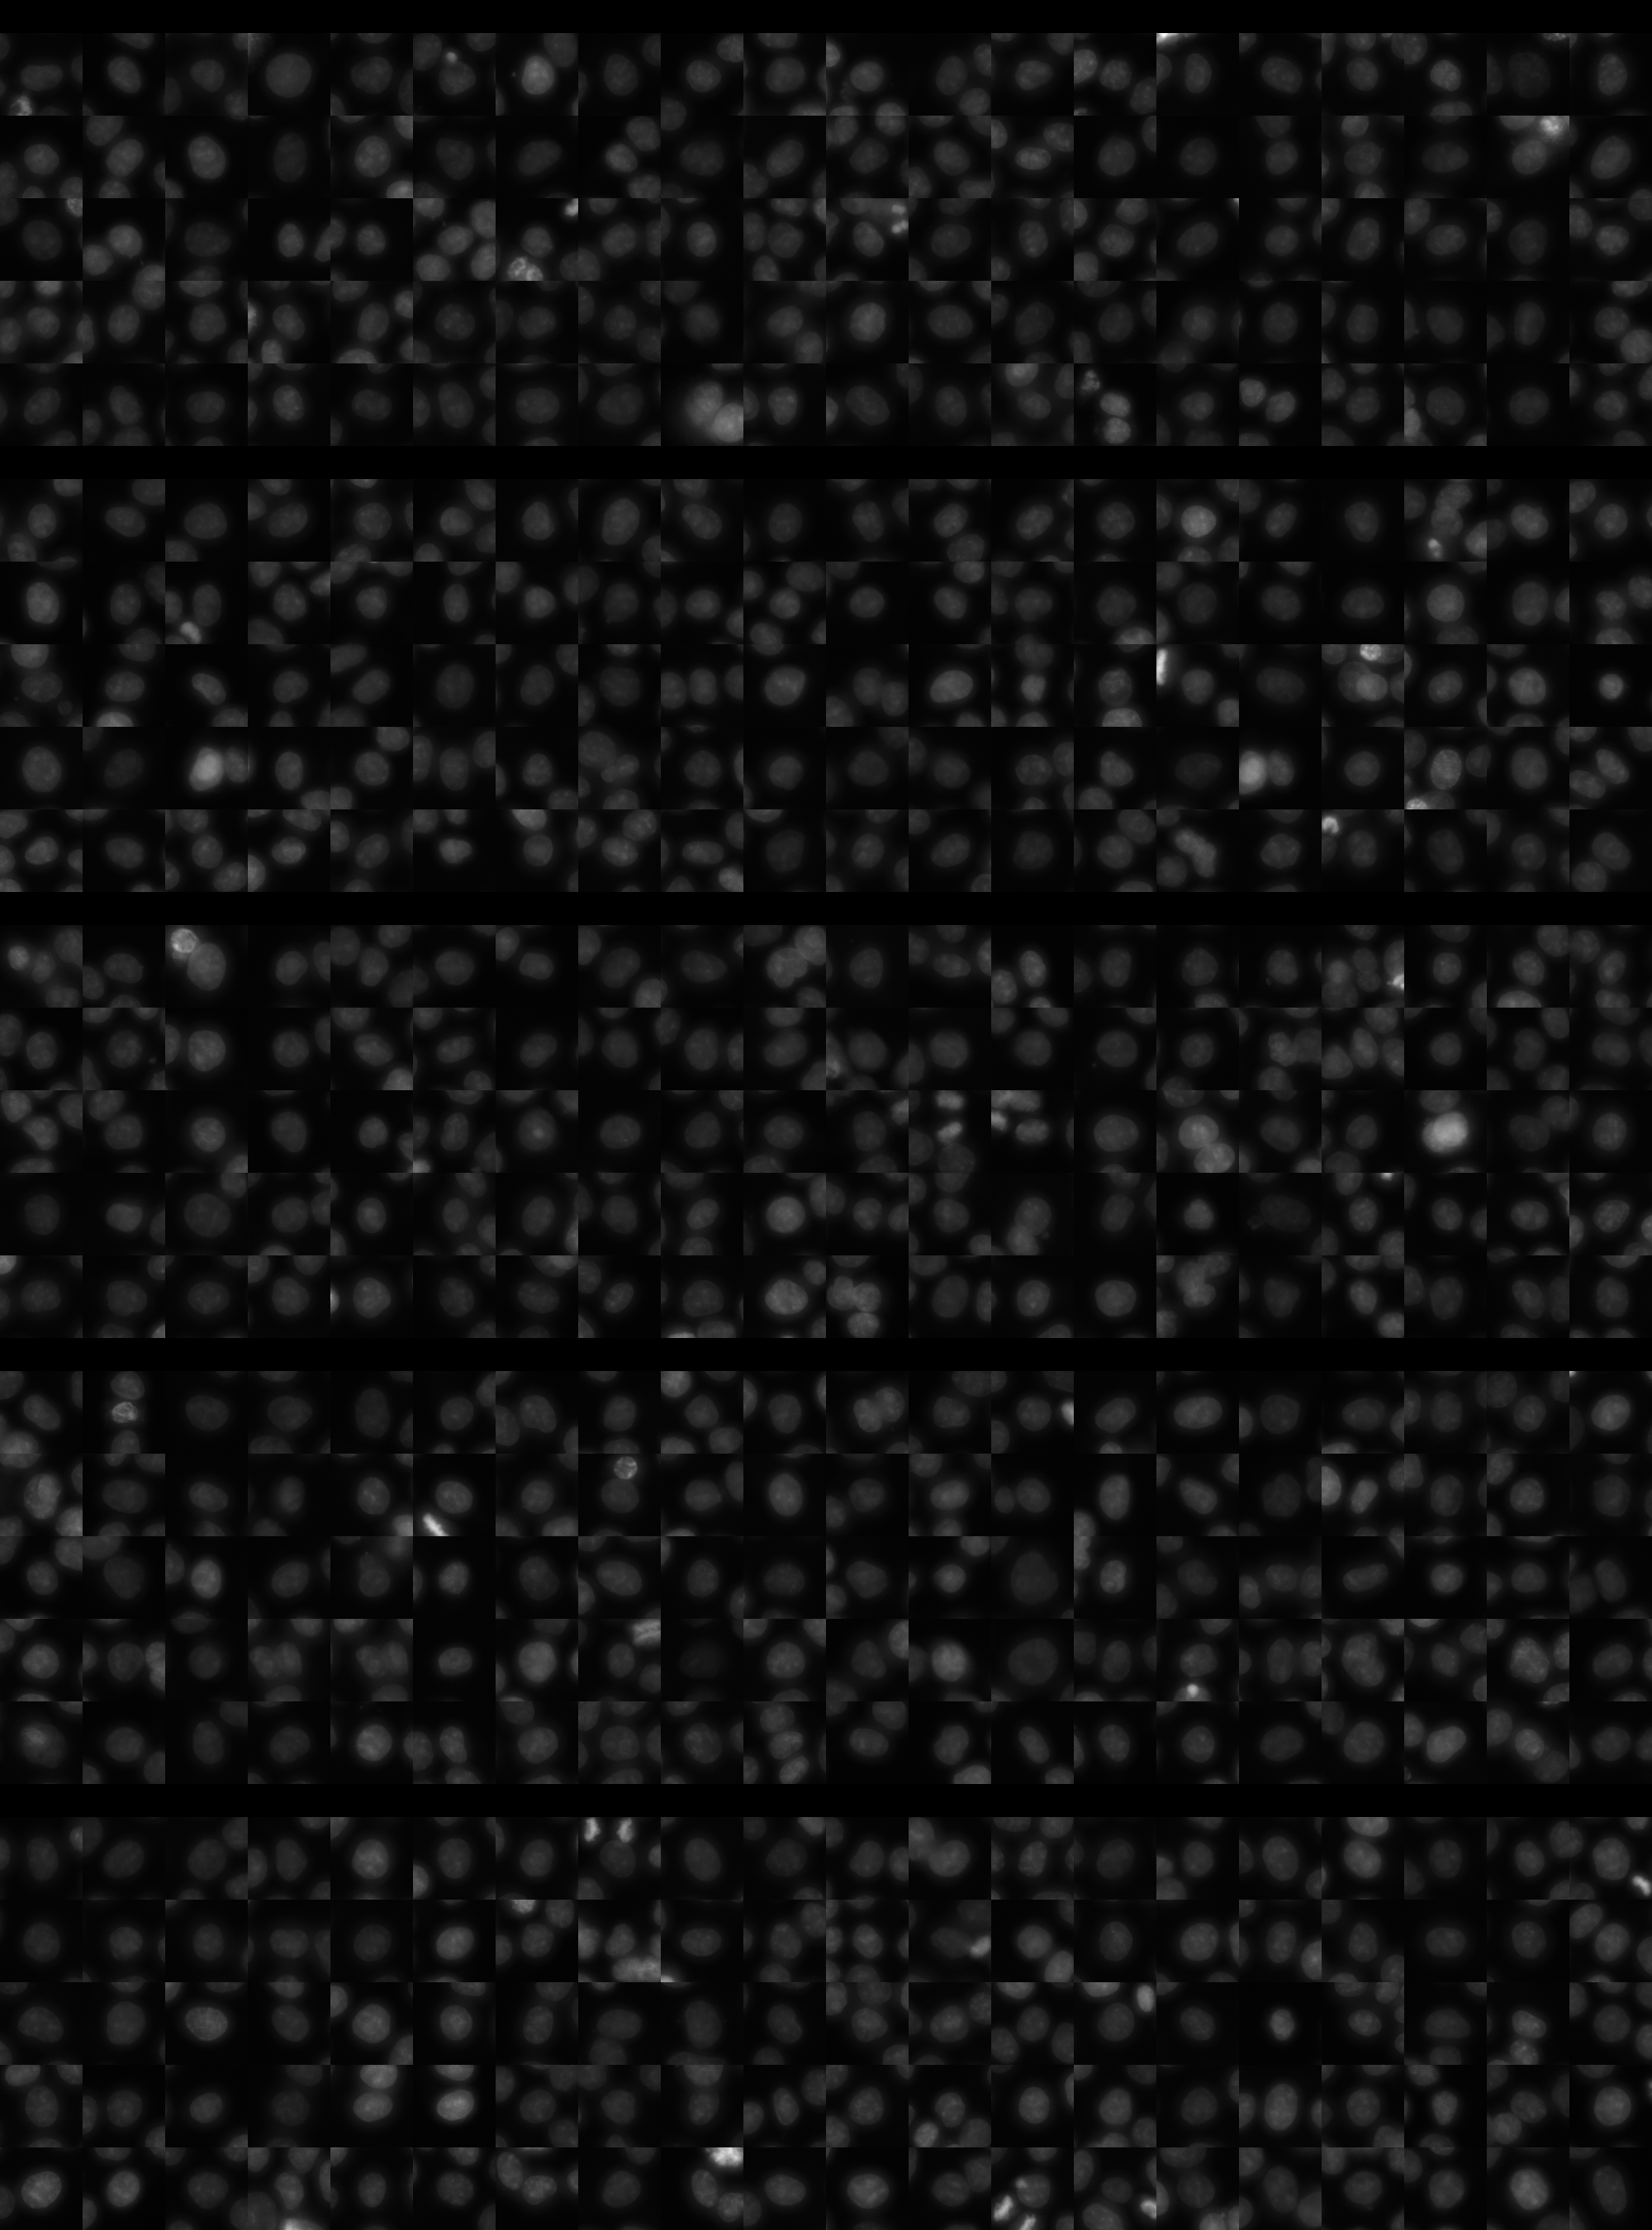
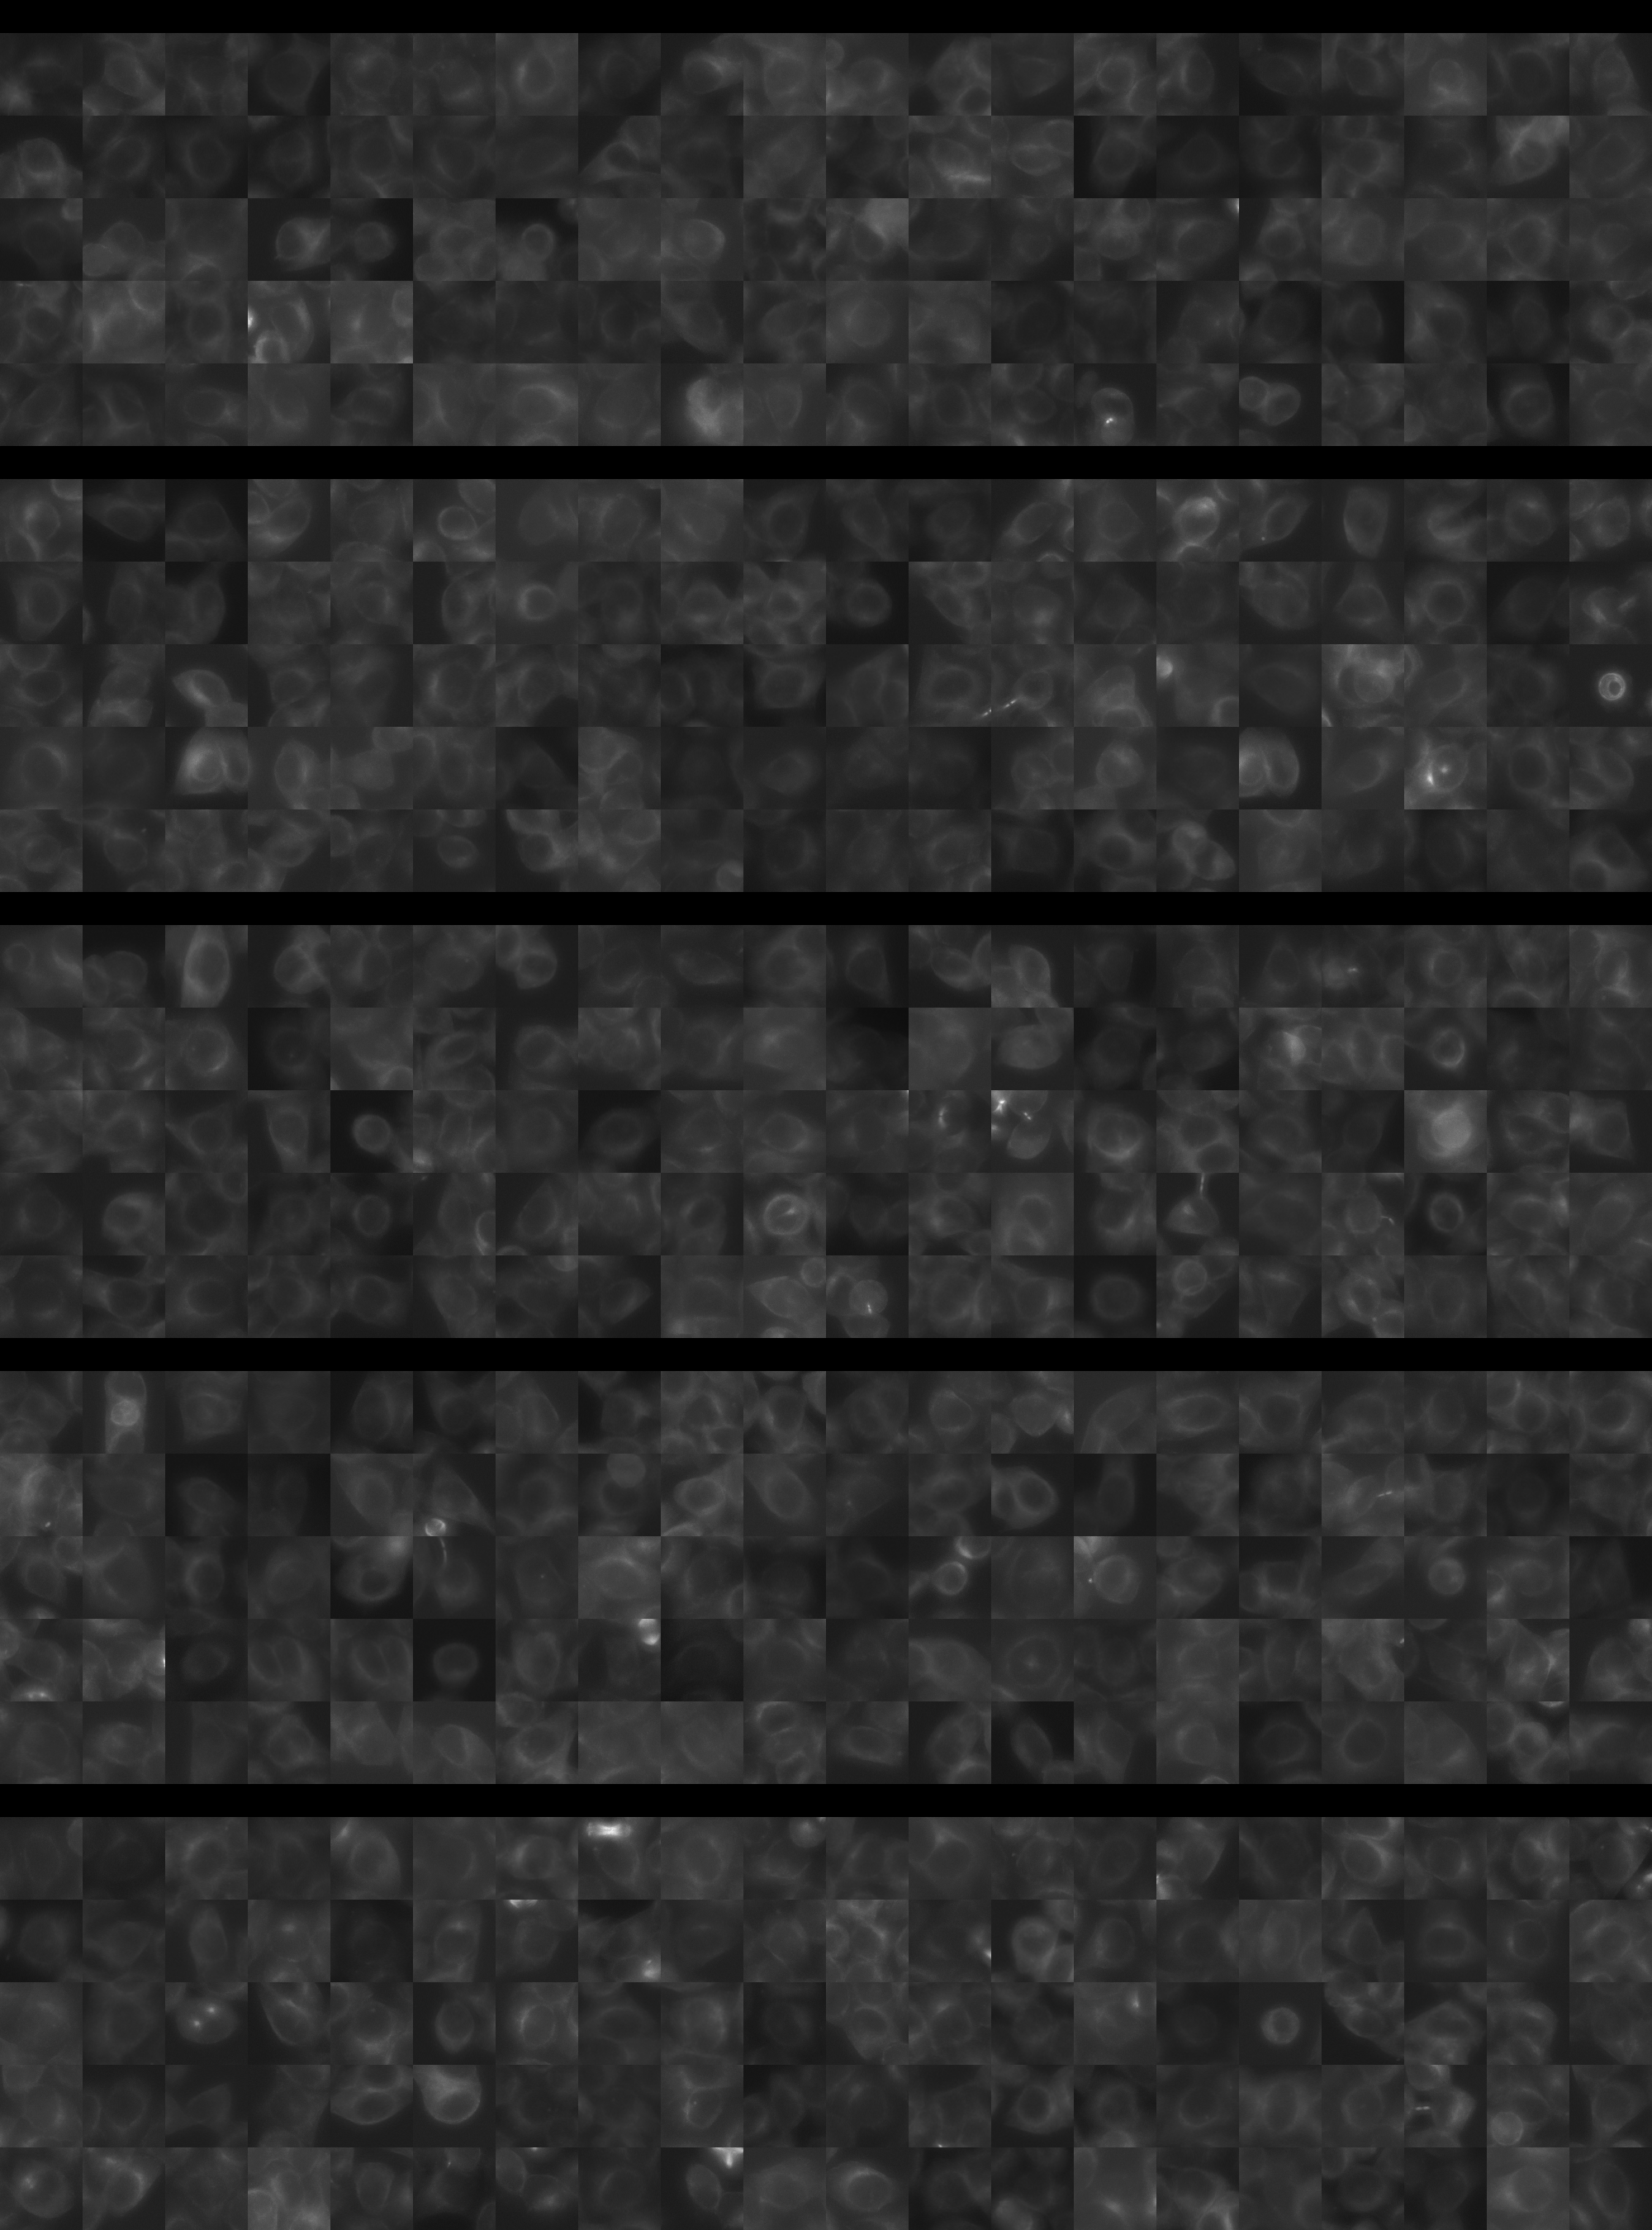
Each montage below shows randomly selected individual cell images for the same target gene separated by sgRNA, along with an example montage of cells expressing a non-targeting negative control sgRNA at the bottom. sgRNA labels in the montages correspond to the numbered sgRNA sequences in the gene info table above. The DNA (blue) and tubulin (green) channels are displayed by default, with gH2AX (grayscale) and actin (yellow) available using the check boxes. Channel brightness, contrast, and opacity are adjustable by clicking the arrow next to the channel name. When only one channel is selected, the display defaults to grayscale. Click the “Zoom” checkbox above the channel controls to enable image zooming (via scrolling) and panning (via click-and-drag).

The cell boxes displayed for this gene are square, 30.36 μm per side for the interphase montage and 30.36 μm per side for the mitotic montage.
Features

Interphase Score Rank FDR q-value
Nucleus DNA Integrated -5.636e-02 4965 of 5322 0.358
Nucleus DNA Mean -6.792e-02 4050 of 5322 0.197
Nucleus gH2AX Mean 0.032 3996 of 5322 0.507
Nucleus DNA - gH2AX Correlation -1.303e-01 4529 of 5322 4.964e-04
Nucleus Shape Area -9.147e-02 4803 of 5322 0.054
Nucleus Shape Eccentricity 0.054 840 of 5322 0.283
Nucleus Shape Form Factor -1.397e-01 4904 of 5322 0.002
Nucleus Shape Solidity -1.588e-01 4936 of 5322 1.903e-04
Cell DNA Mass Displacement -1.865e-02 5039 of 5322 0.789
Cell Tubulin Mean 0.074 731 of 5322 0.143
Cell Tubulin Mass Displacement 0.032 1188 of 5322 0.667
Cell Actin Mean -2.018e-01 5225 of 5322 1.723e-04
Cell Tubulin - Actin Correlation 0.115 462 of 5322 0.012
Cell DNA - Tubulin Correlation 0.014 3282 of 5322 0.837
Cell Shape Area -1.926e-01 5009 of 5322 1.651e-04
Cell Shape Eccentricity 0.018 2266 of 5322 0.890
Mitotic Score Rank FDR q-value
Nucleus DNA Integrated -2.470e-02 4218 of 5322 0.996
Nucleus DNA Mean -1.850e-01 4911 of 5322 1.000
Nucleus DNA Mass Displacement -2.063e-01 5193 of 5322 0.999
Nucleus DNA Mean Frac 3 0.016 2878 of 5322 1.000
Nucleus gH2AX Mean -9.146e-02 4151 of 5322 1.000
Nucleus gH2AX Mean Frac 0 -1.948e-01 4770 of 5322 1.000
Nucleus Tubulin Mean Frac 0 -1.713e-01 5060 of 5322 0.999
Nucleus Tubulin Mean Edge 0.273 400 of 5322 0.996
Nucleus Tubulin Std Edge 0.063 1696 of 5322 0.999
Nucleus Shape Area 0.153 1968 of 5322 0.989
Nucleus Shape Eccentricity -4.403e-01 5163 of 5322 1.000
Nucleus Shape Form Factor 0.007 1301 of 5322 0.998
Cell Tubulin Mean 0.228 770 of 5322 0.997
Cell Tubulin Mean Frac 3 -5.999e-02 2446 of 5322 0.999
Cell Actin Mean 0.340 253 of 5322 0.997
Cell Shape Area 0.159 1866 of 5322 0.998
( Reset Zoom )
Brightness
Contrast
Opacity
Brightness
Contrast
Opacity
Brightness
Contrast
Opacity
Brightness
Contrast
Opacity
Brightness
Contrast
Opacity

( Reset Zoom )
Brightness
Contrast
Opacity
Brightness
Contrast
Opacity
Brightness
Contrast
Opacity
Brightness
Contrast
Opacity
Brightness
Contrast
Opacity

MIT Central Accessability