THAP11

Due to sgRNA sequence design constraints two or more of the sgRNAs used to target this gene have multiple genomic target sites, potentially impacting the observed phenotype through increased DNA damage.
Gene symbol: THAP11
Gene: 57215
Uniprot Function: Transcriptional repressor that plays a central role for embryogenesis and the pluripotency of embryonic stem (ES) cells. Sequence-specific DNA-binding factor that represses gene expression in pluripotent ES cells by directly binding to key genetic loci and recruiting epigenetic modifiers (By similarity).
Mitotic Index 0.0335
Interphase Cluster: #104 (23 genes)
Mitotic Cluster: #143 (19 genes)
sgRNA 1: AGTAGCGCGCAGACCCGCTG (interphase cells: 1897, mitotic cells: 57)
sgRNA 2: CGCGTACCGTGTAGGTCTTG (interphase cells: 1610, mitotic cells: 69)
sgRNA 3: GCACTTCTACACGTTTCCAA (interphase cells: 1549, mitotic cells: 64)
sgRNA 4: GGAGAAGCACCCACTGACGC (interphase cells: 1751, mitotic cells: 46)

Interphase Cluster

Mitotic Cluster

Overview

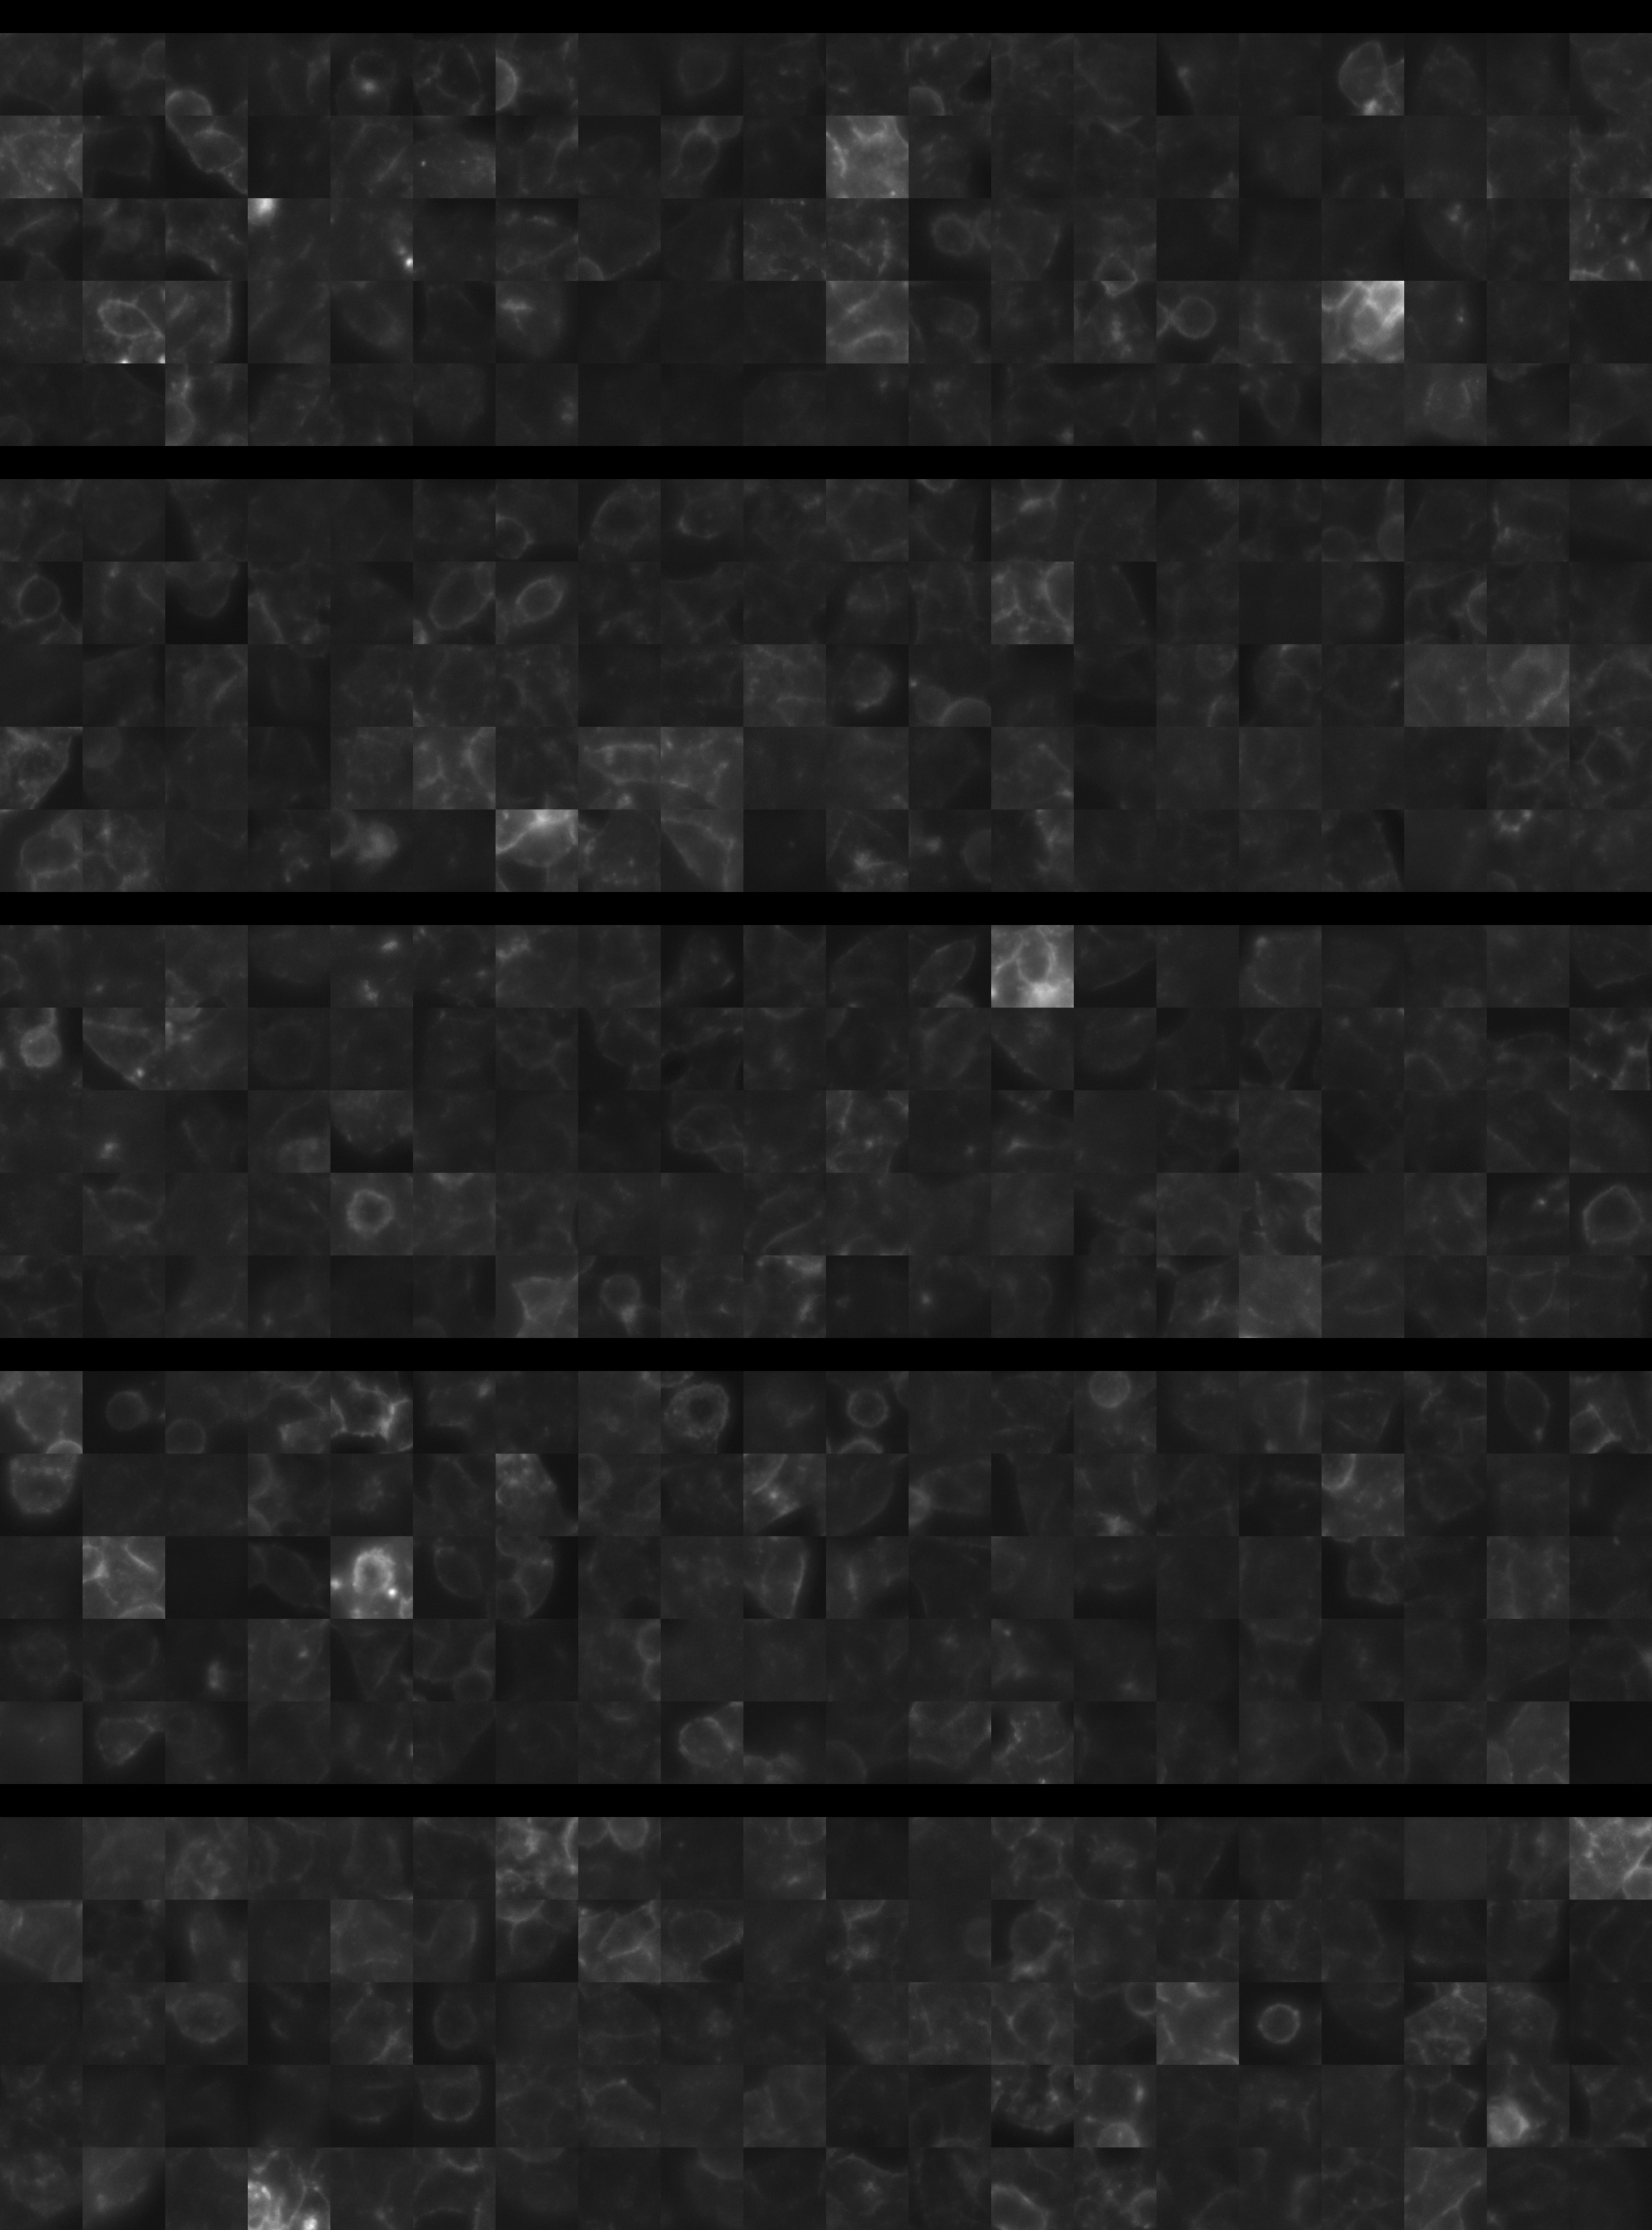
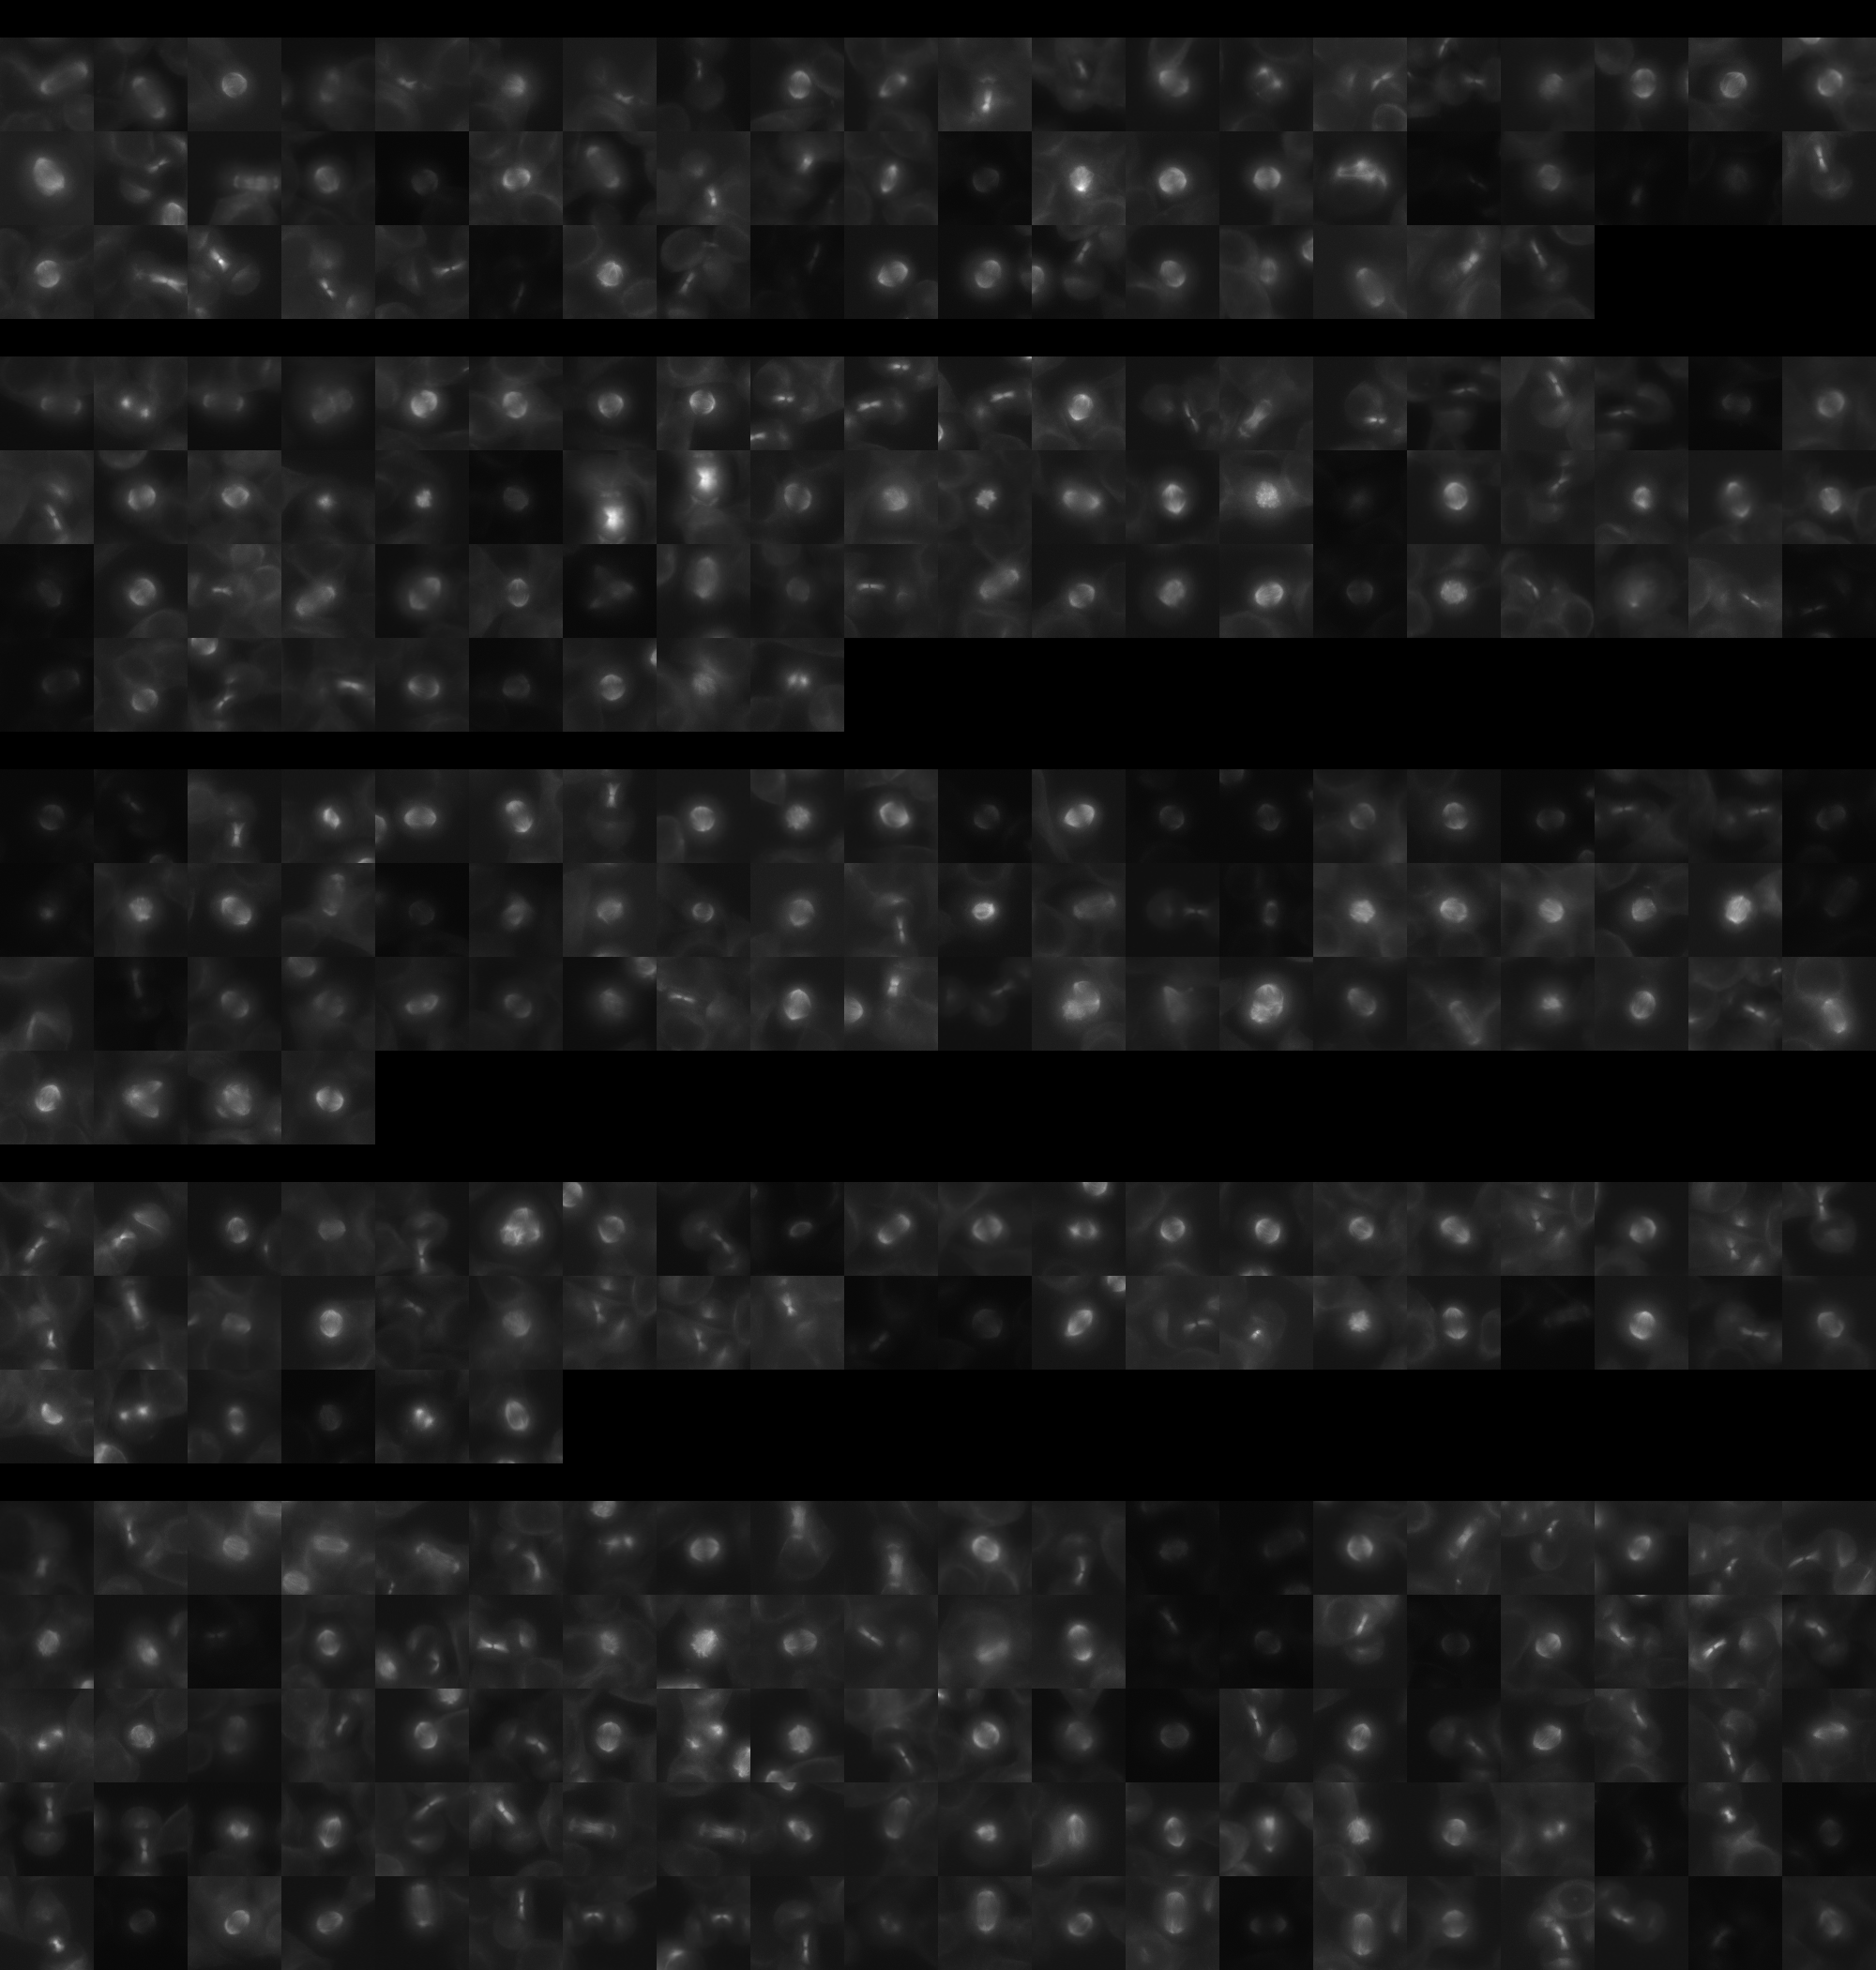
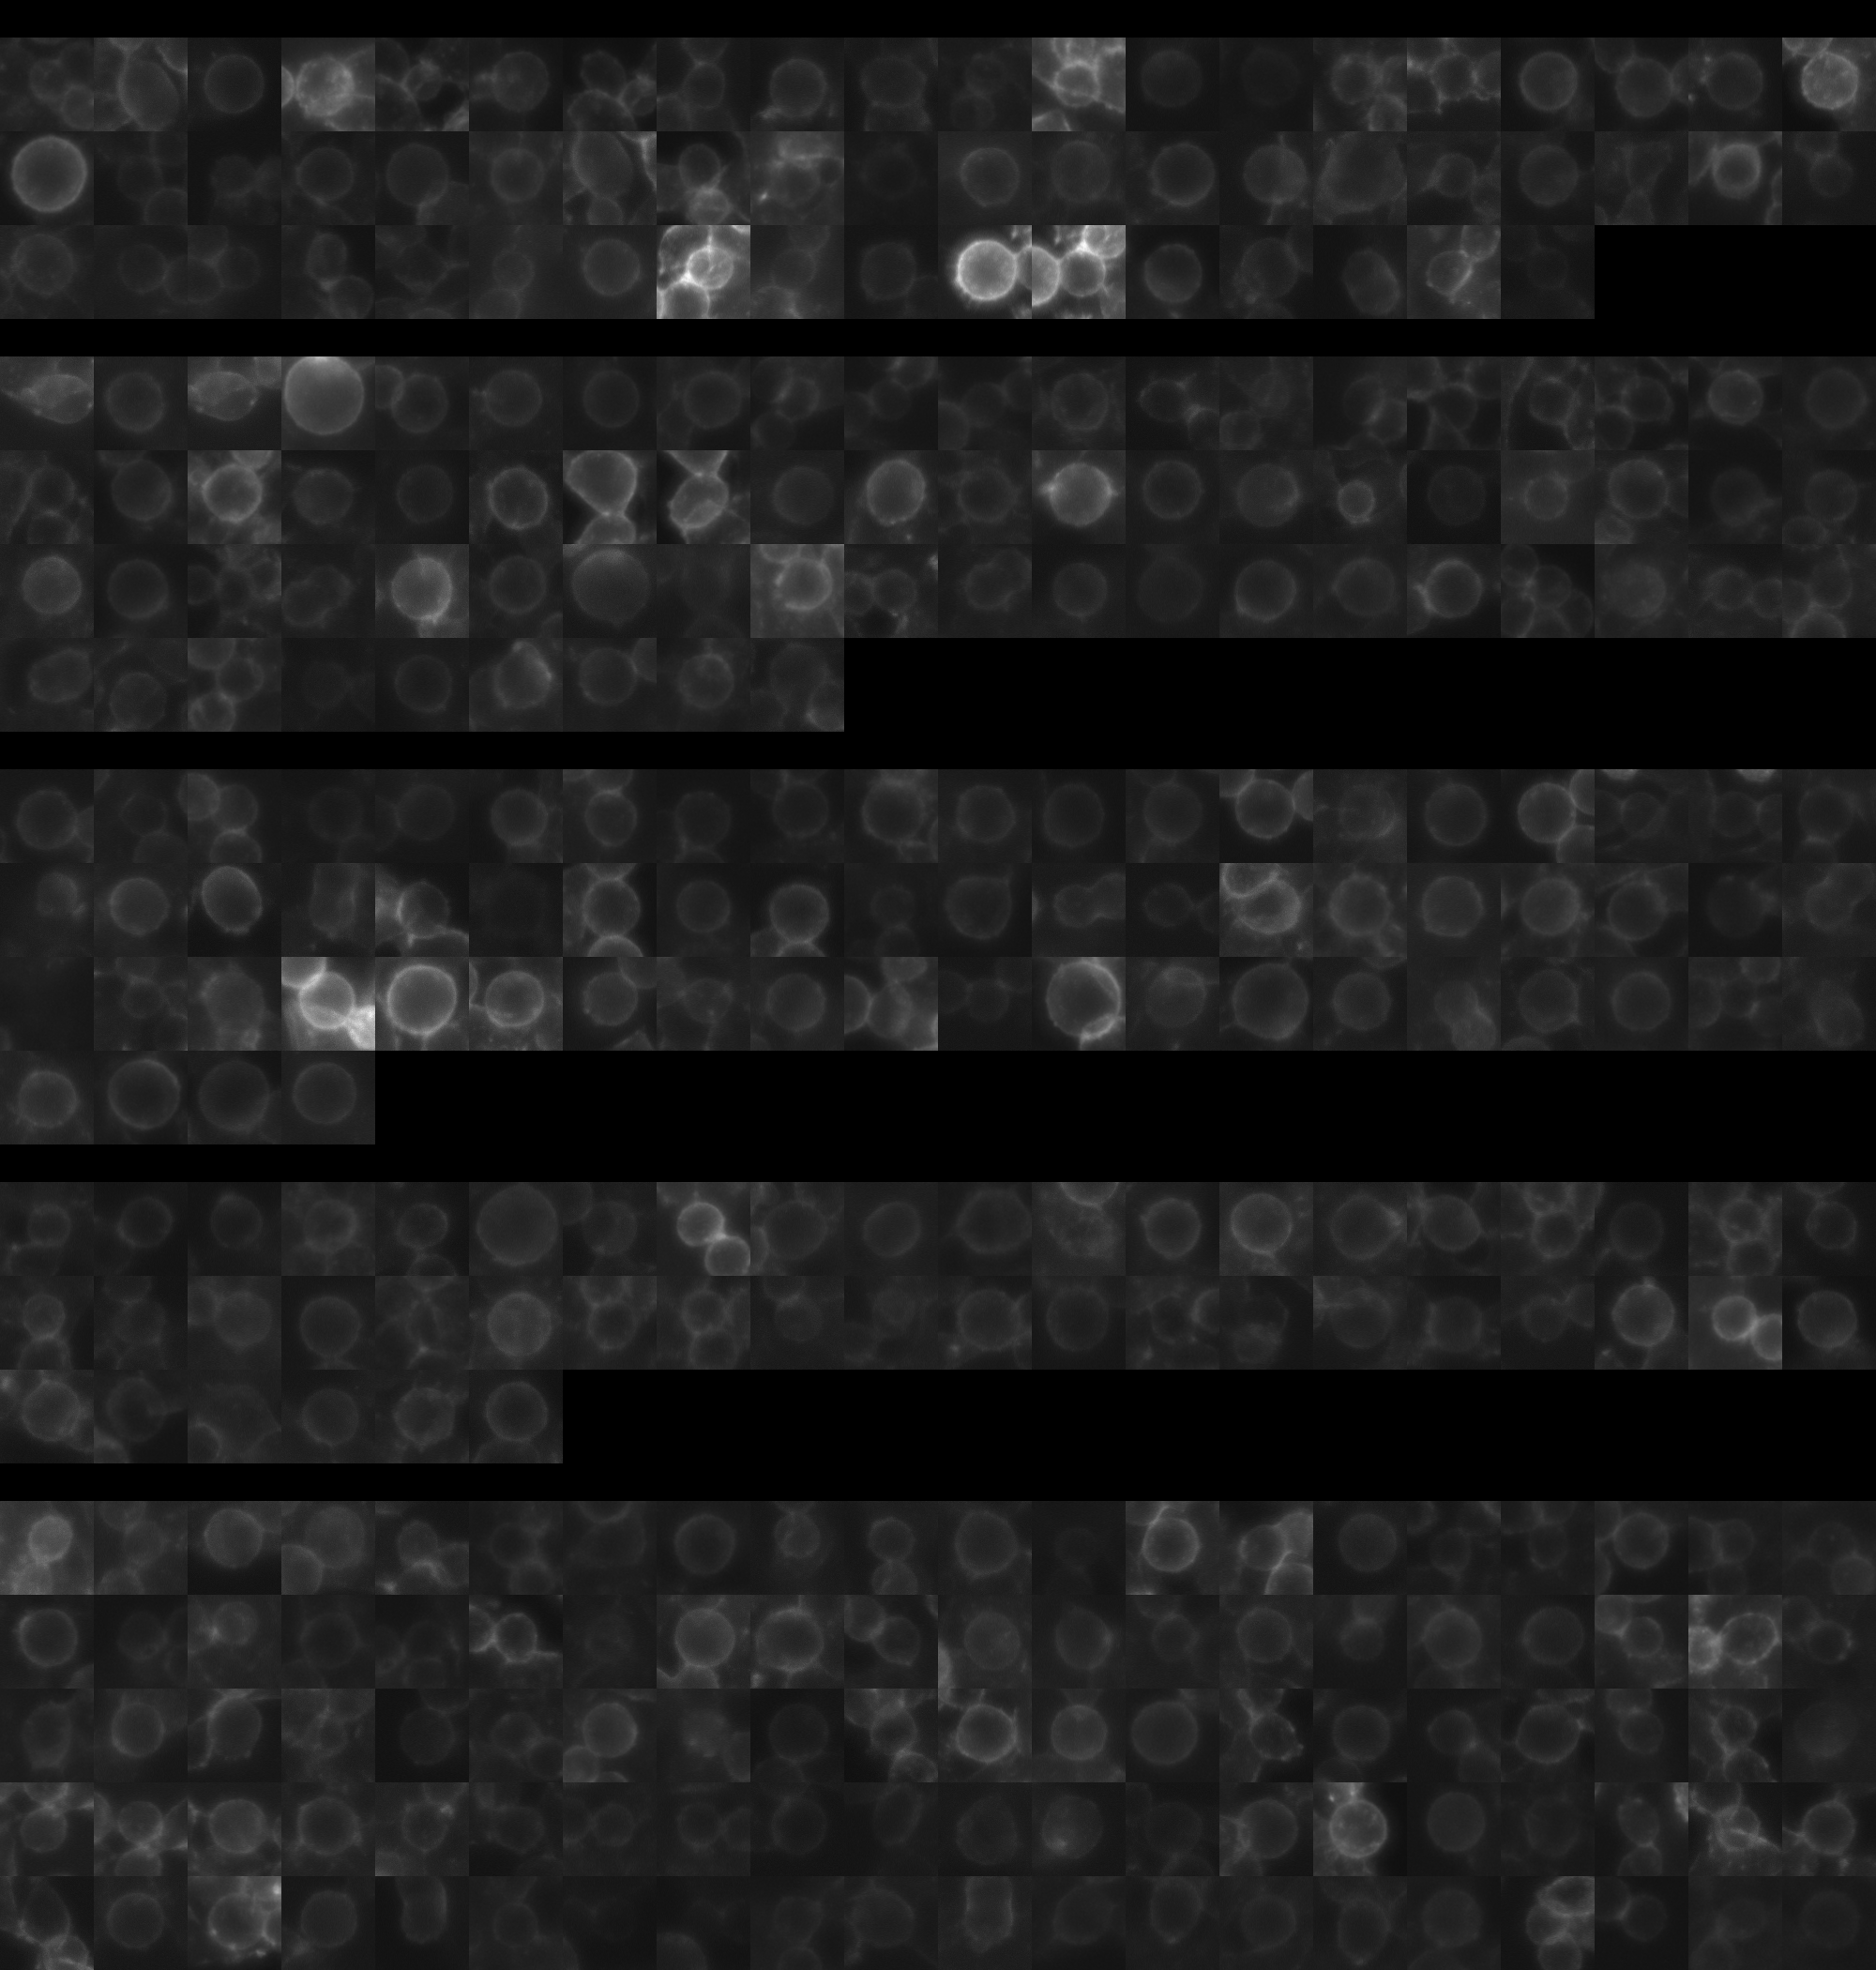
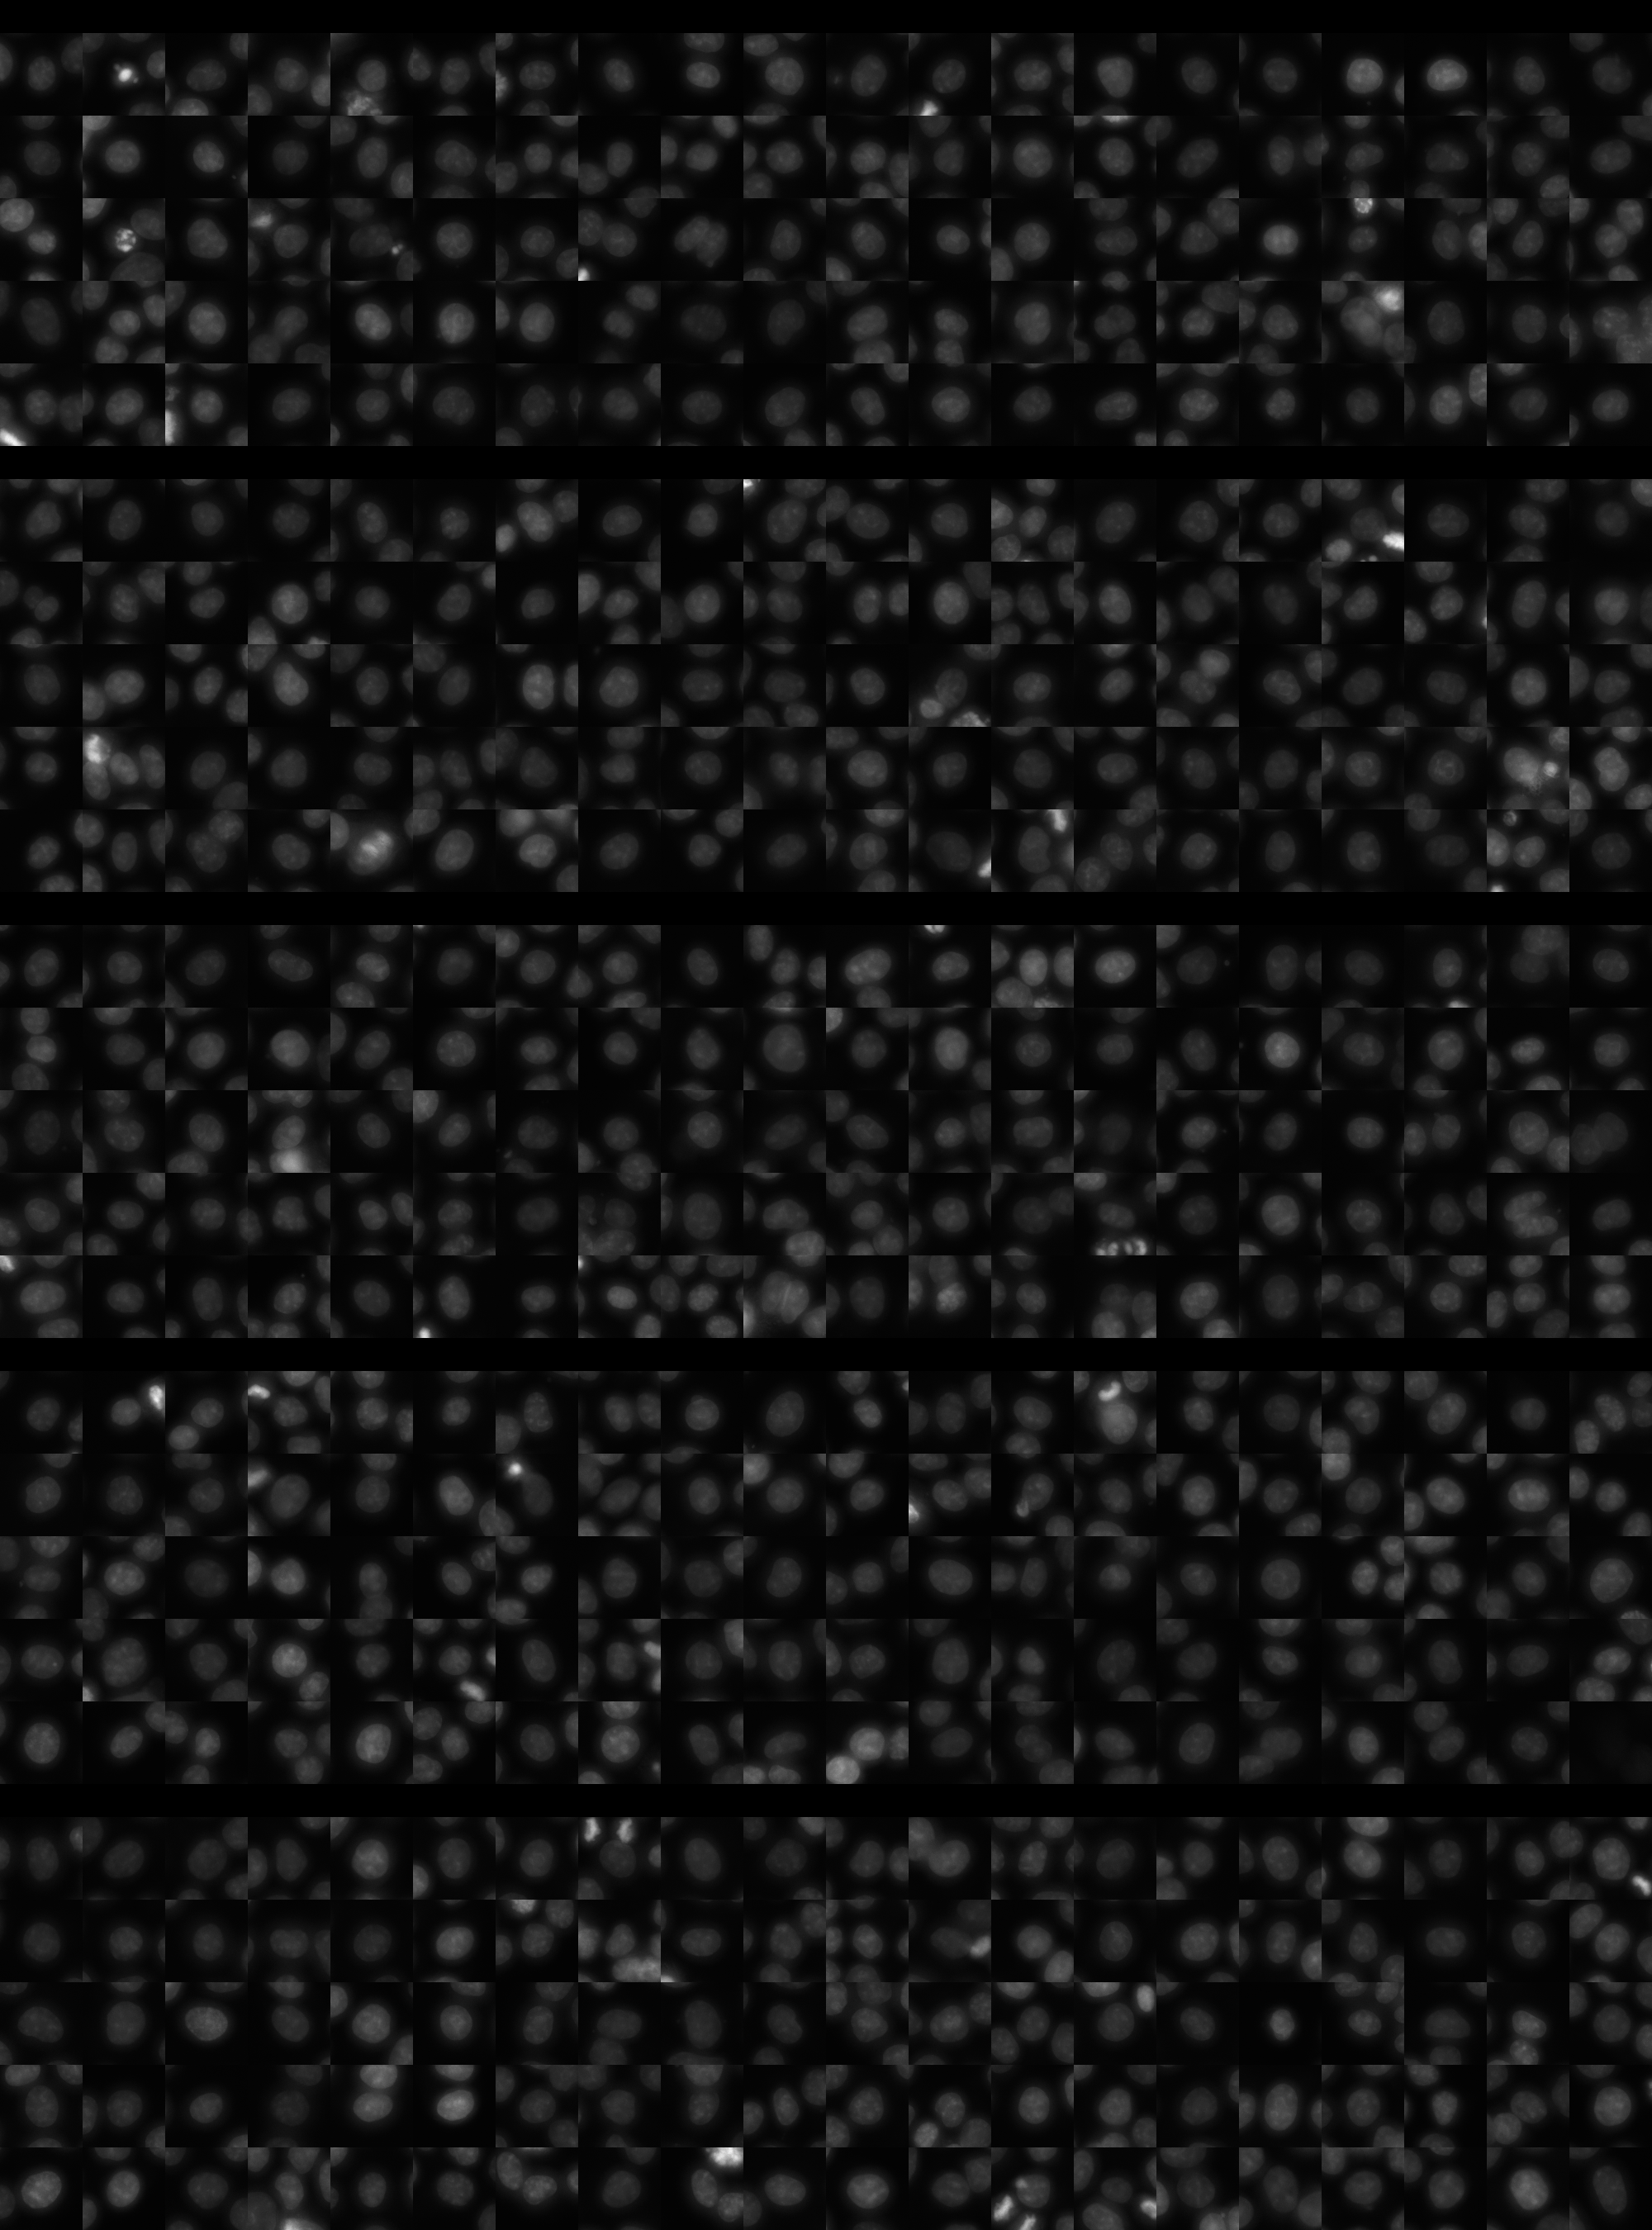
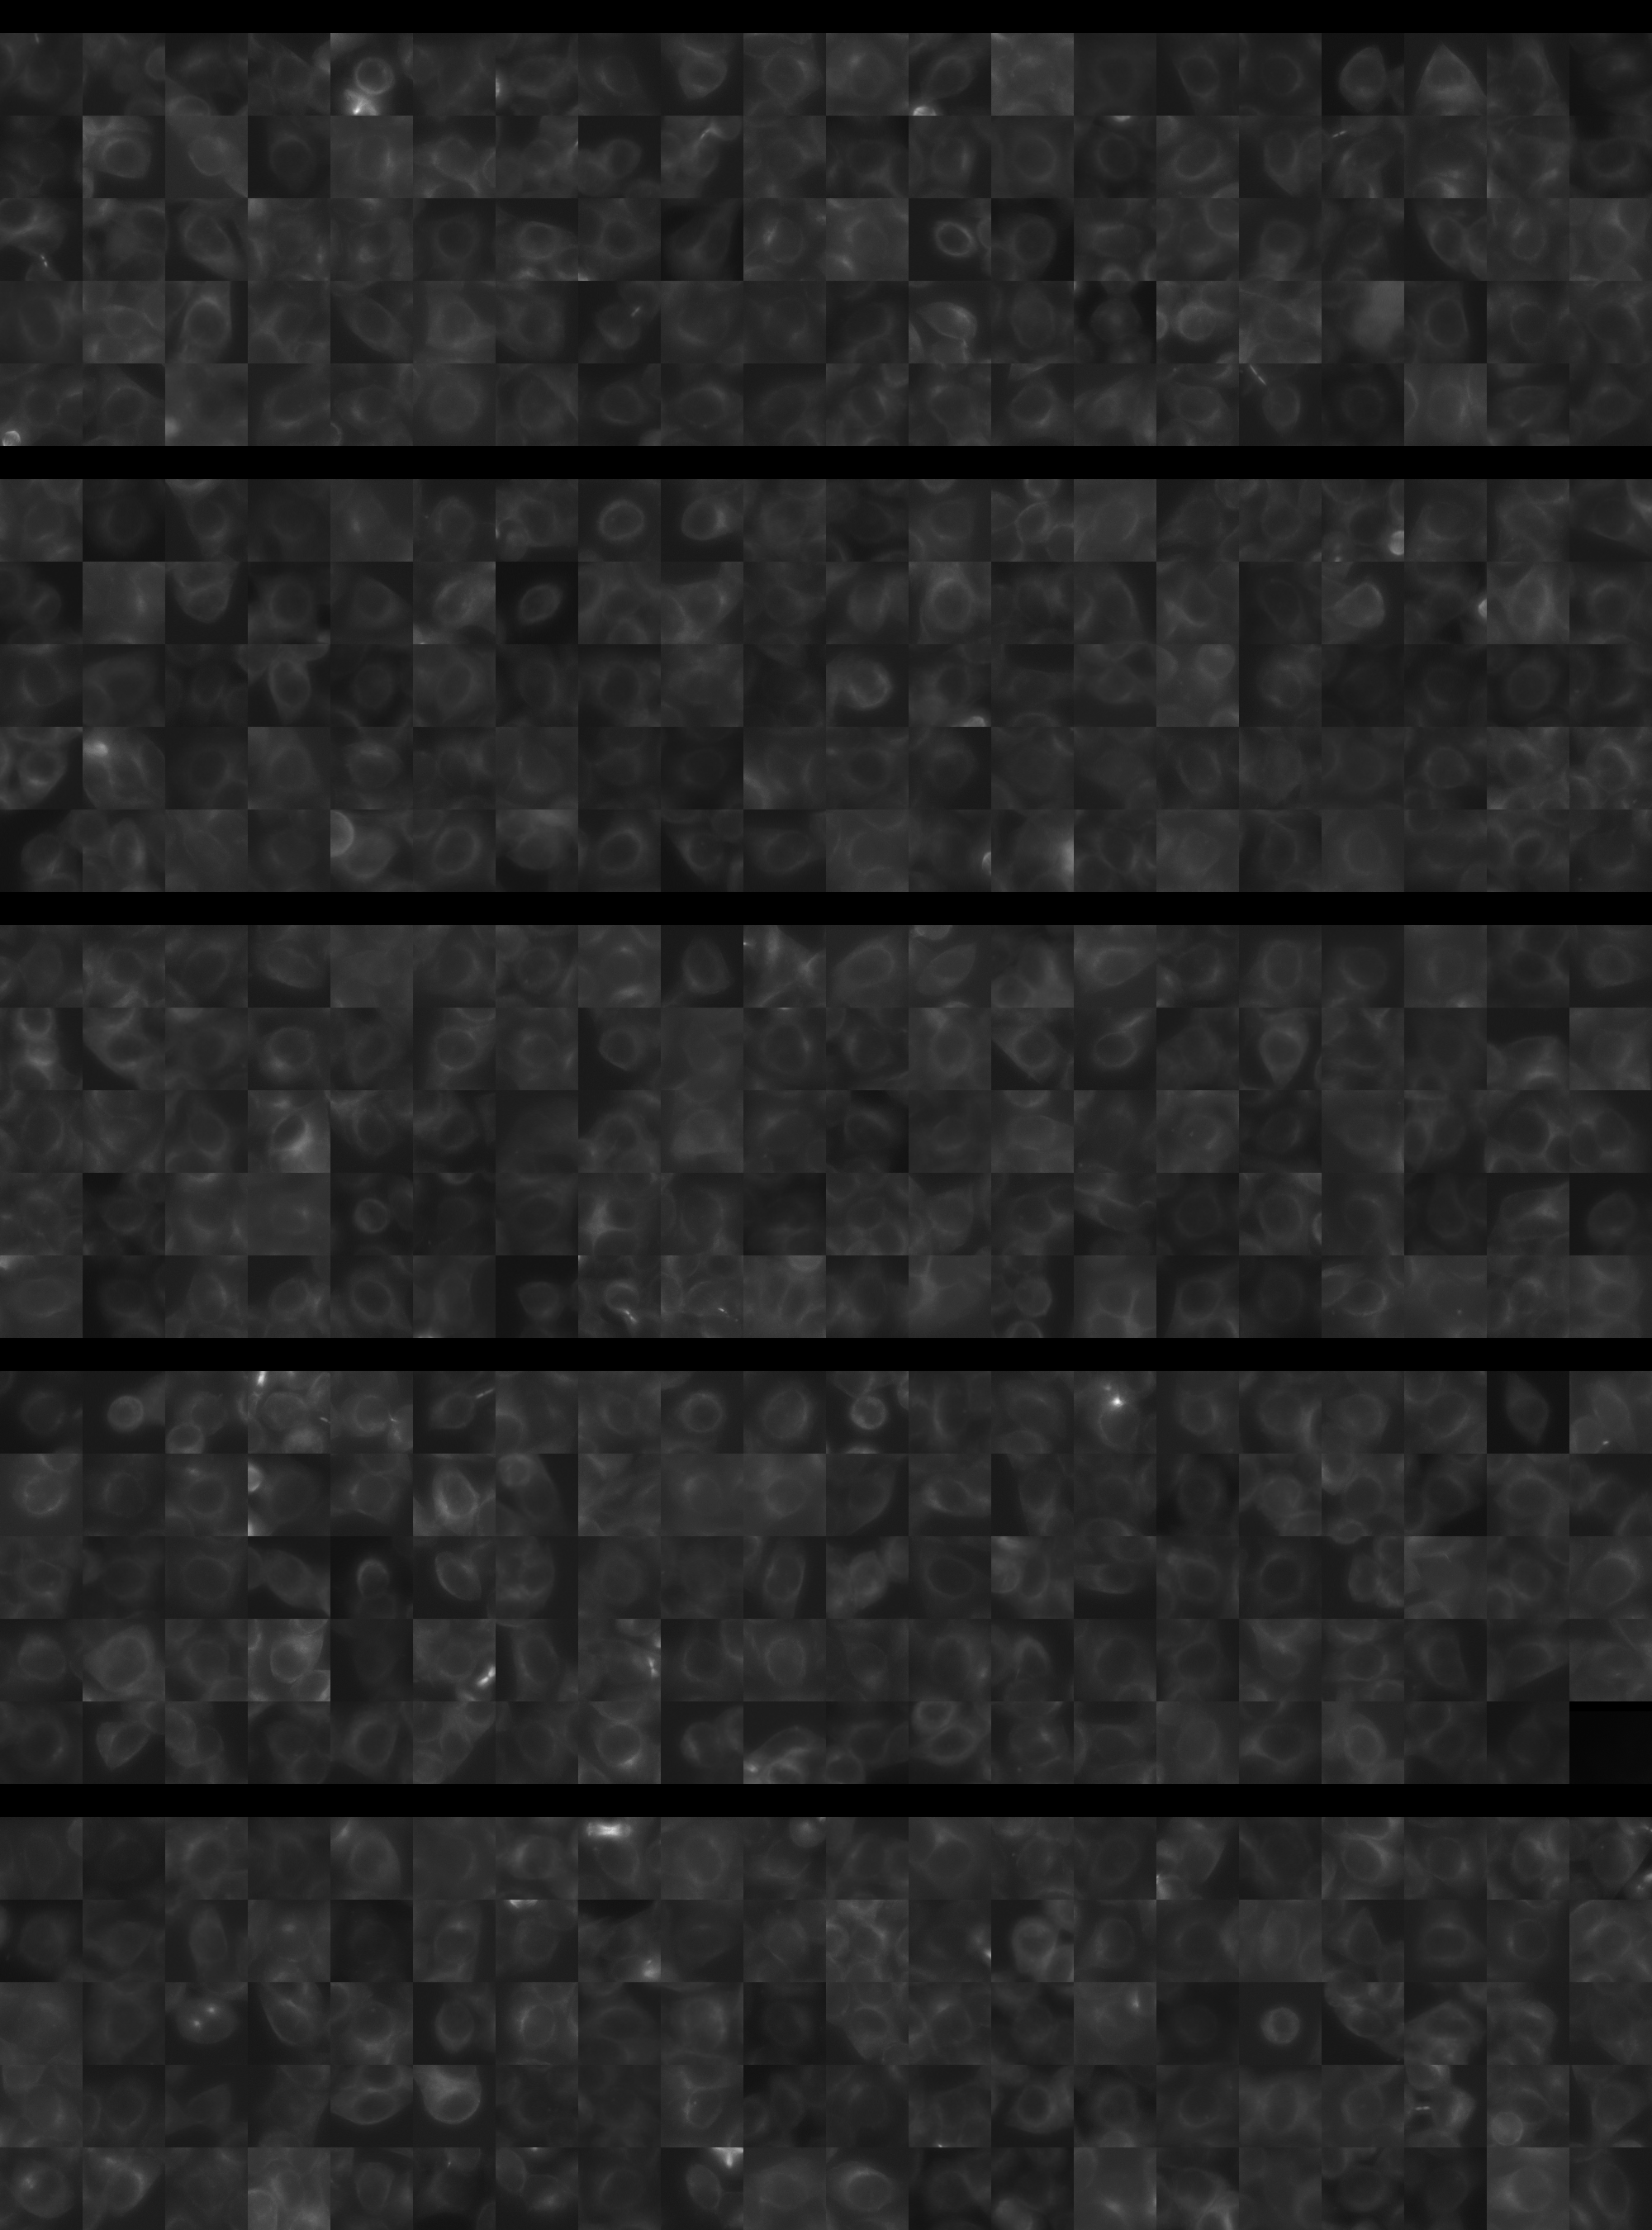
Each montage below shows randomly selected individual cell images for the same target gene separated by sgRNA, along with an example montage of cells expressing a non-targeting negative control sgRNA at the bottom. sgRNA labels in the montages correspond to the numbered sgRNA sequences in the gene info table above. The DNA (blue) and tubulin (green) channels are displayed by default, with gH2AX (grayscale) and actin (yellow) available using the check boxes. Channel brightness, contrast, and opacity are adjustable by clicking the arrow next to the channel name. When only one channel is selected, the display defaults to grayscale. Click the “Zoom” checkbox above the channel controls to enable image zooming (via scrolling) and panning (via click-and-drag).

The cell boxes displayed for this gene are square, 30.36 μm per side for the interphase montage and 30.36 μm per side for the mitotic montage.
Features

Interphase Score Rank FDR q-value
Nucleus DNA Integrated -3.492e-02 4546 of 5322 0.509
Nucleus DNA Mean -1.124e-02 2335 of 5322 0.863
Nucleus gH2AX Mean 0.078 2576 of 5322 0.044
Nucleus DNA - gH2AX Correlation 0.026 545 of 5322 0.454
Nucleus Shape Area -4.329e-02 4375 of 5322 0.283
Nucleus Shape Eccentricity -2.036e-02 4229 of 5322 0.703
Nucleus Shape Form Factor -7.499e-02 3734 of 5322 0.045
Nucleus Shape Solidity -9.416e-02 4172 of 5322 0.004
Cell DNA Mass Displacement -3.463e-02 5226 of 5322 0.429
Cell Tubulin Mean -7.758e-02 4738 of 5322 0.068
Cell Tubulin Mass Displacement 0.013 2223 of 5322 0.853
Cell Actin Mean -7.362e-02 4713 of 5322 0.103
Cell Tubulin - Actin Correlation -6.223e-03 3962 of 5322 0.919
Cell DNA - Tubulin Correlation -8.250e-02 5151 of 5322 0.011
Cell Shape Area 0.037 1943 of 5322 0.646
Cell Shape Eccentricity 0.034 1186 of 5322 0.565
Mitotic Score Rank FDR q-value
Nucleus DNA Integrated 0.037 3441 of 5322 0.995
Nucleus DNA Mean 0.010 2767 of 5322 1.000
Nucleus DNA Mass Displacement -5.440e-02 4255 of 5322 0.999
Nucleus DNA Mean Frac 3 0.048 2383 of 5322 1.000
Nucleus gH2AX Mean 0.107 1532 of 5322 1.000
Nucleus gH2AX Mean Frac 0 0.119 795 of 5322 1.000
Nucleus Tubulin Mean Frac 0 -2.832e-02 3890 of 5322 0.999
Nucleus Tubulin Mean Edge 0.186 924 of 5322 0.995
Nucleus Tubulin Std Edge 0.012 2391 of 5322 0.999
Nucleus Shape Area 0.021 3715 of 5322 0.994
Nucleus Shape Eccentricity 0.016 1842 of 5322 1.000
Nucleus Shape Form Factor -1.223e-01 3178 of 5322 0.998
Cell Tubulin Mean 0.358 246 of 5322 0.463
Cell Tubulin Mean Frac 3 -5.533e-02 2384 of 5322 0.999
Cell Actin Mean 0.112 1711 of 5322 0.997
Cell Shape Area -1.653e-02 4098 of 5322 0.998
( Reset Zoom )
Brightness
Contrast
Opacity
Brightness
Contrast
Opacity
Brightness
Contrast
Opacity
Brightness
Contrast
Opacity
Brightness
Contrast
Opacity

( Reset Zoom )
Brightness
Contrast
Opacity
Brightness
Contrast
Opacity
Brightness
Contrast
Opacity
Brightness
Contrast
Opacity
Brightness
Contrast
Opacity

MIT Central Accessability