TENT4B

Gene symbol: TENT4B
Gene: 64282
Uniprot Function: Terminal nucleotidyltransferase that catalyzes preferentially the transfert of ATP and GTP on RNA 3' poly(A) tail creating a heterogeneous 3' poly(A) tail leading to mRNAs stabilization by protecting mRNAs from active deadenylation (PubMed:21788334, PubMed:30026317). Also functions as a catalytic subunit of a TRAMP-like complex which has a poly(A) RNA polymerase activity and is involved in a post-transcriptional quality control mechanism. Polyadenylation with short oligo(A) tails is required for the degradative activity of the exosome on several of its nuclear RNA substrates. Doesn't need a cofactor for polyadenylation activity (in vitro) (PubMed:21788334, PubMed:21855801). Required for cytoplasmic polyadenylation of mRNAs involved in carbohydrate metabolism, including the glucose transporter SLC2A1/GLUT1 (PubMed:28383716). Plays a role in replication-dependent histone mRNA degradation, probably through terminal uridylation of mature histone mRNAs. May play a role in sister chromatid cohesion (PubMed:18172165). Mediates 3' adenylation of the microRNA MIR21 followed by its 3'-to-5' trimming by the exoribonuclease PARN leading to degradation (PubMed:25049417). Mediates 3' adenylation of H/ACA box snoRNAs (small nucleolar RNAs) followed by its 3'-to-5' trimming by the exoribonuclease PARN which enhances snoRNA stability and maturation (PubMed:22442037).
Mitotic Index 0.0237
Interphase Cluster: #24 (39 genes)
Mitotic Cluster: #140 (20 genes)
sgRNA 1: AAACGGAGGAACTACAACCA (interphase cells: 1310, mitotic cells: 25)
sgRNA 2: ACTGGCATCCGGATAAAGGA (interphase cells: 1647, mitotic cells: 40)
sgRNA 3: GAAGGGACTCACGTCAGCGC (interphase cells: 1020, mitotic cells: 29)
sgRNA 4: TGTTGGAAGGAGTTCATATG (interphase cells: 2207, mitotic cells: 56)

Interphase Cluster

Mitotic Cluster

Overview

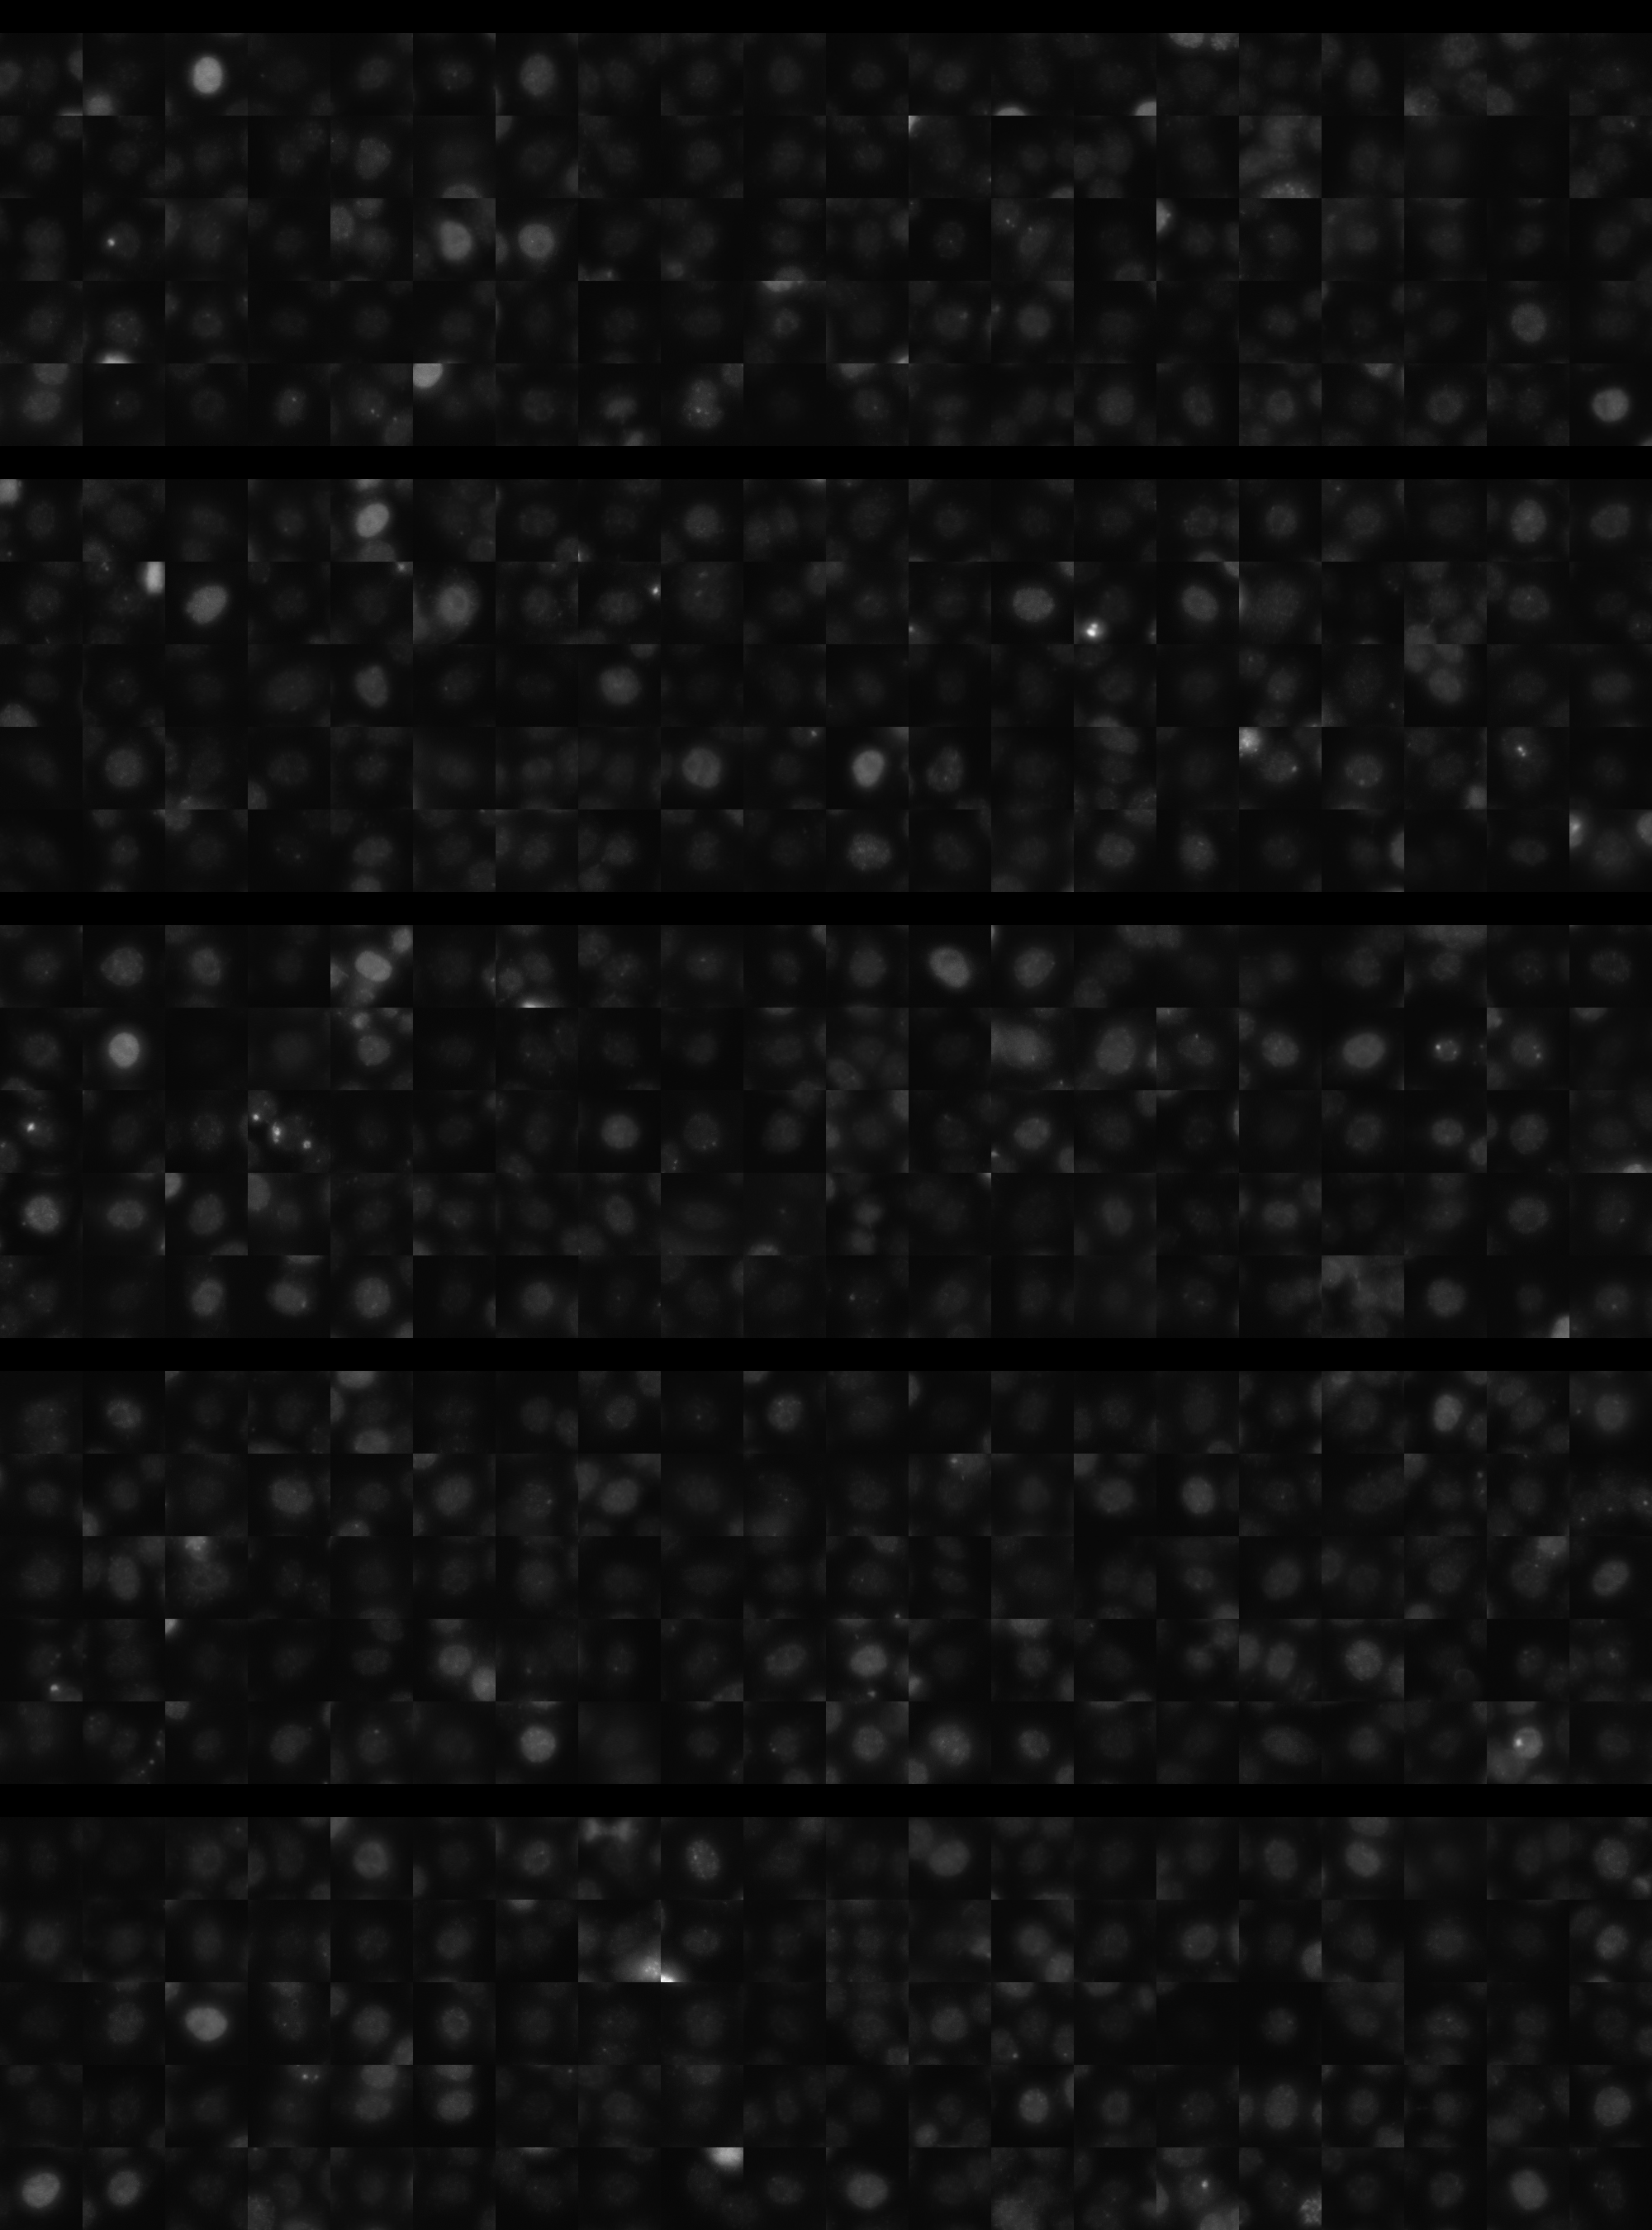
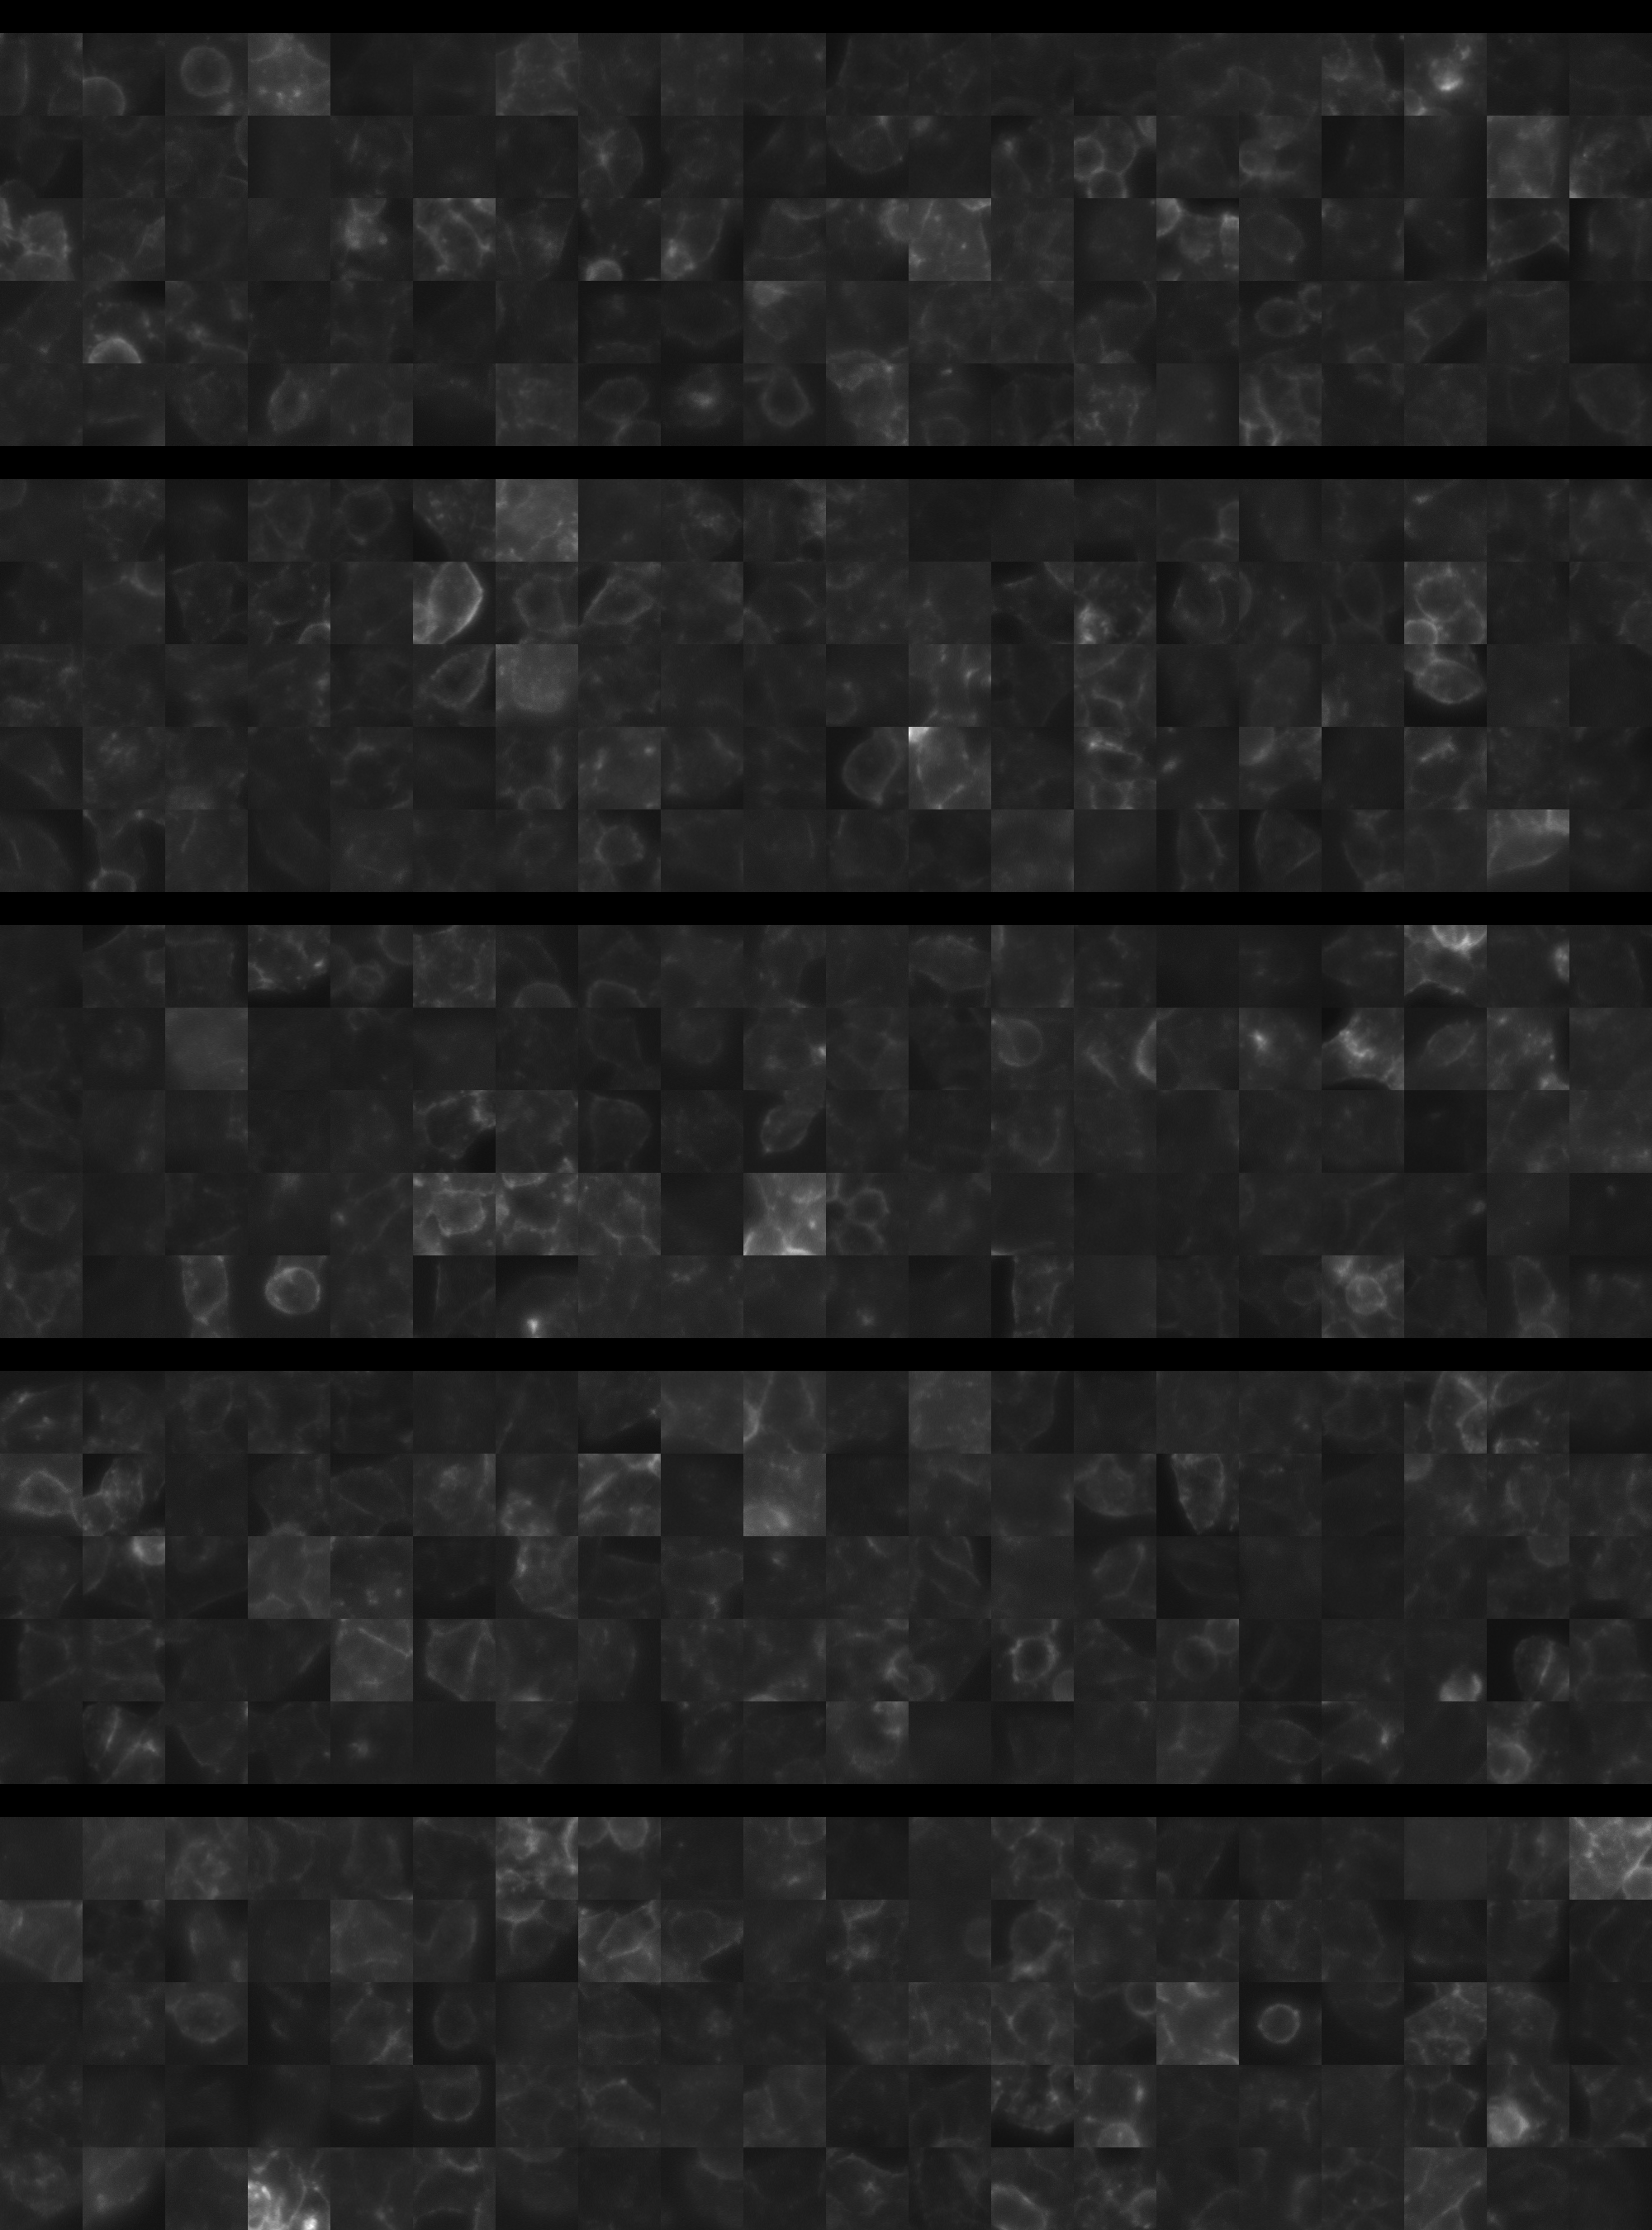
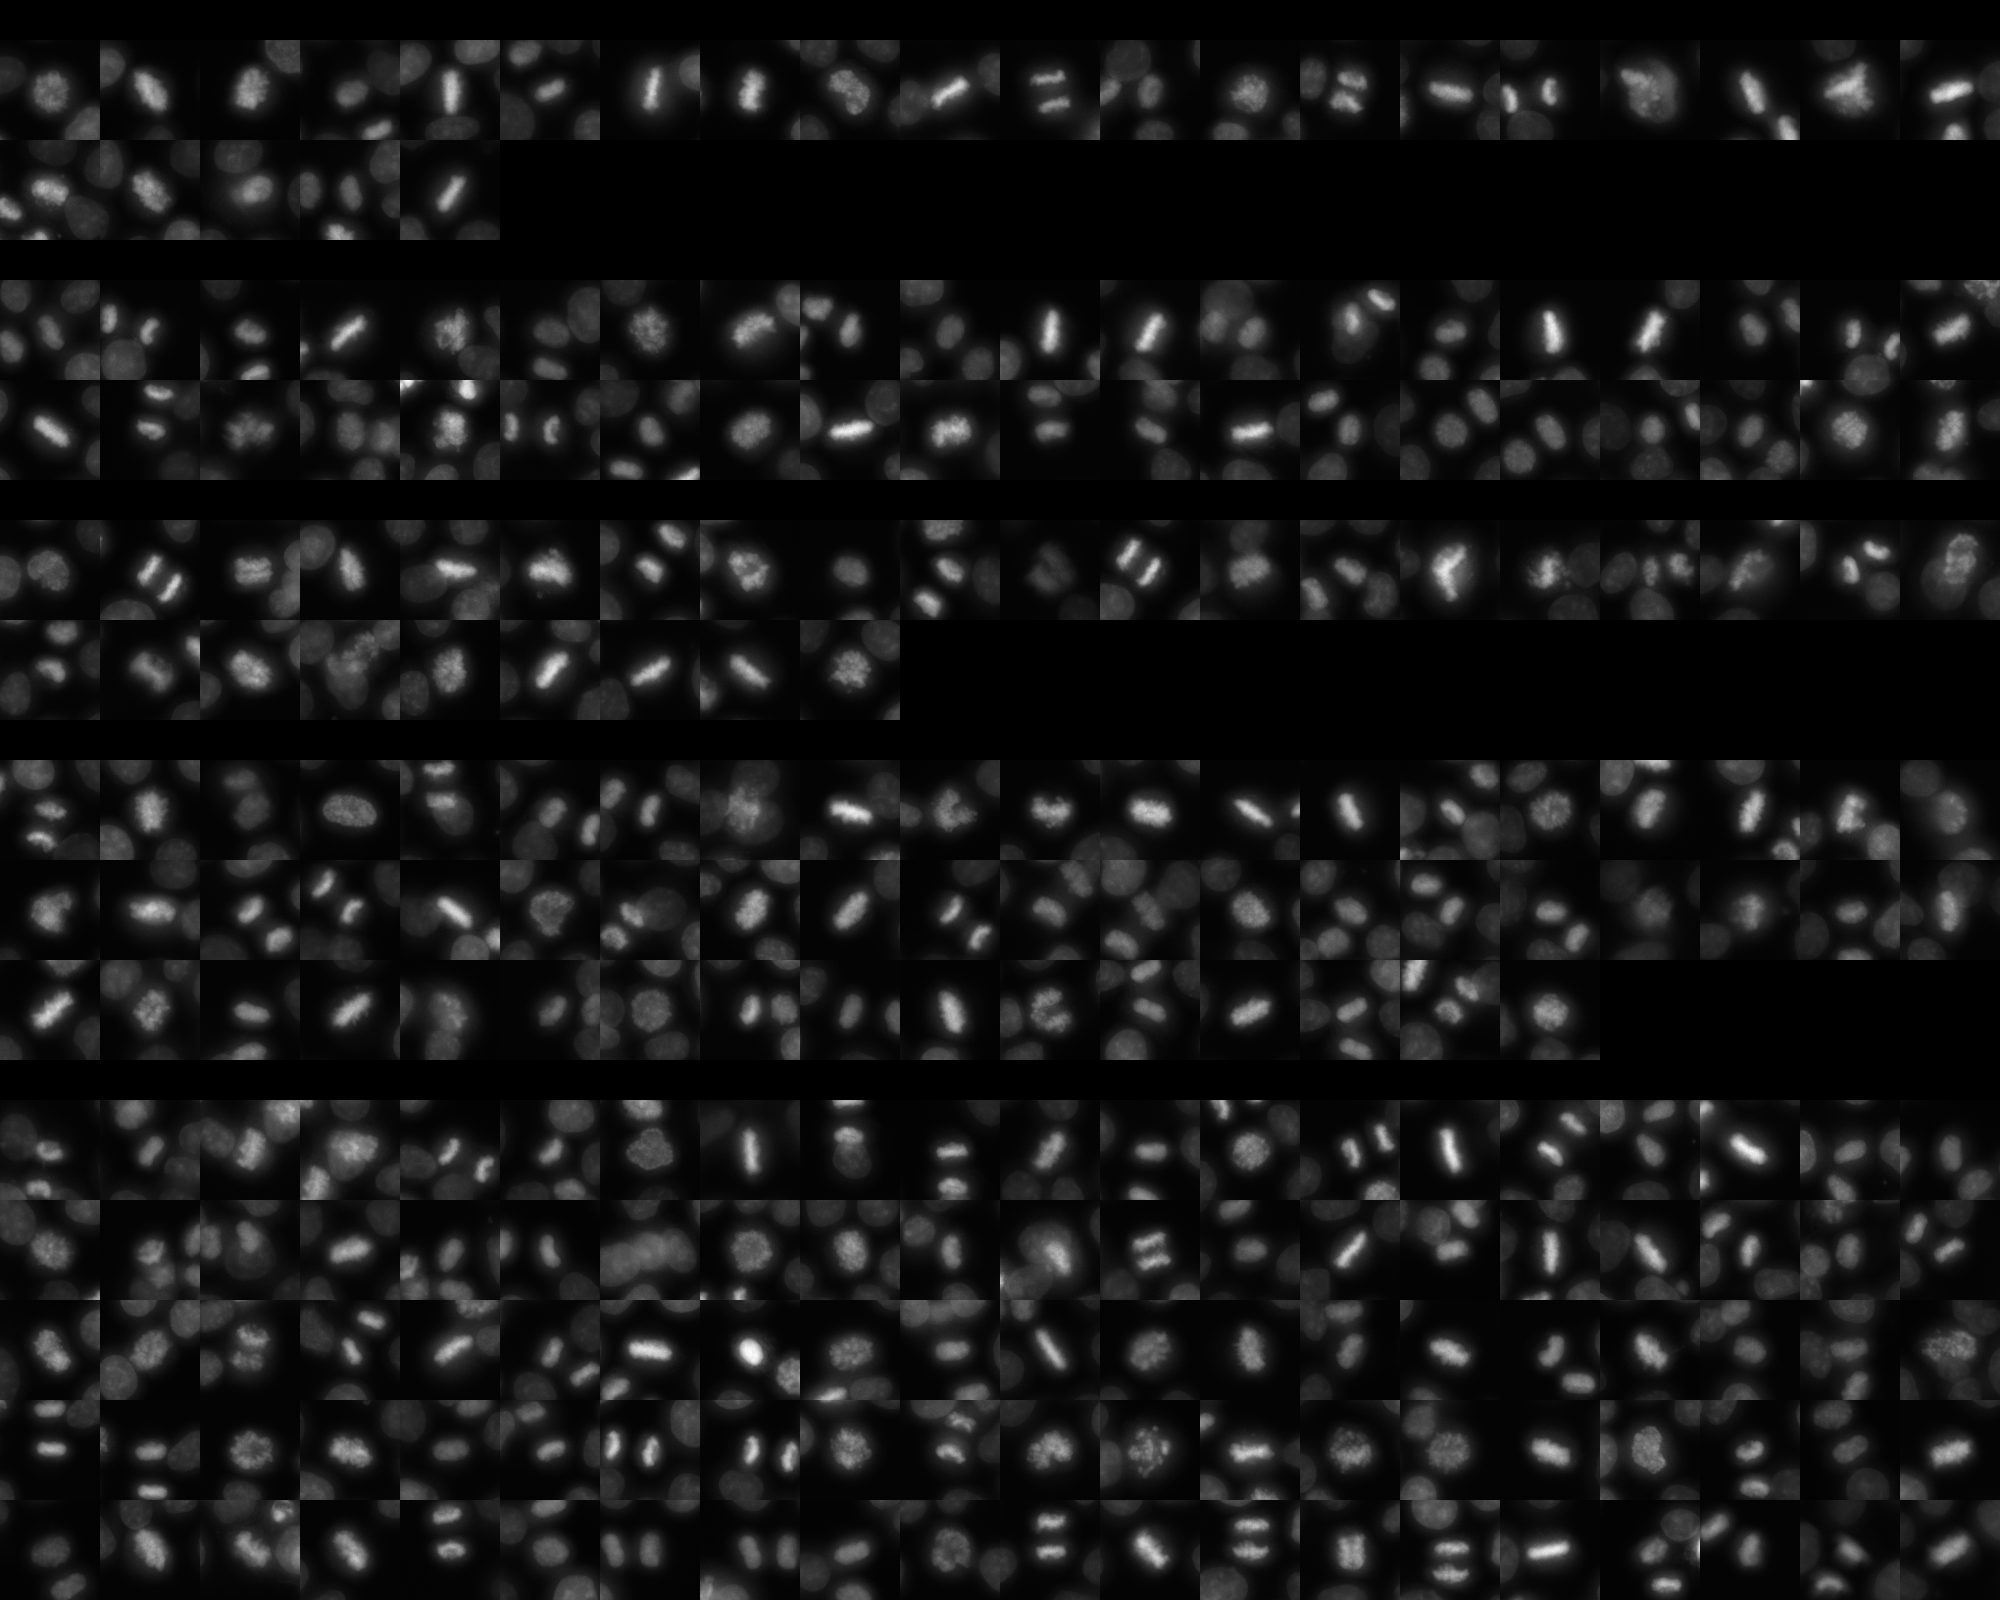
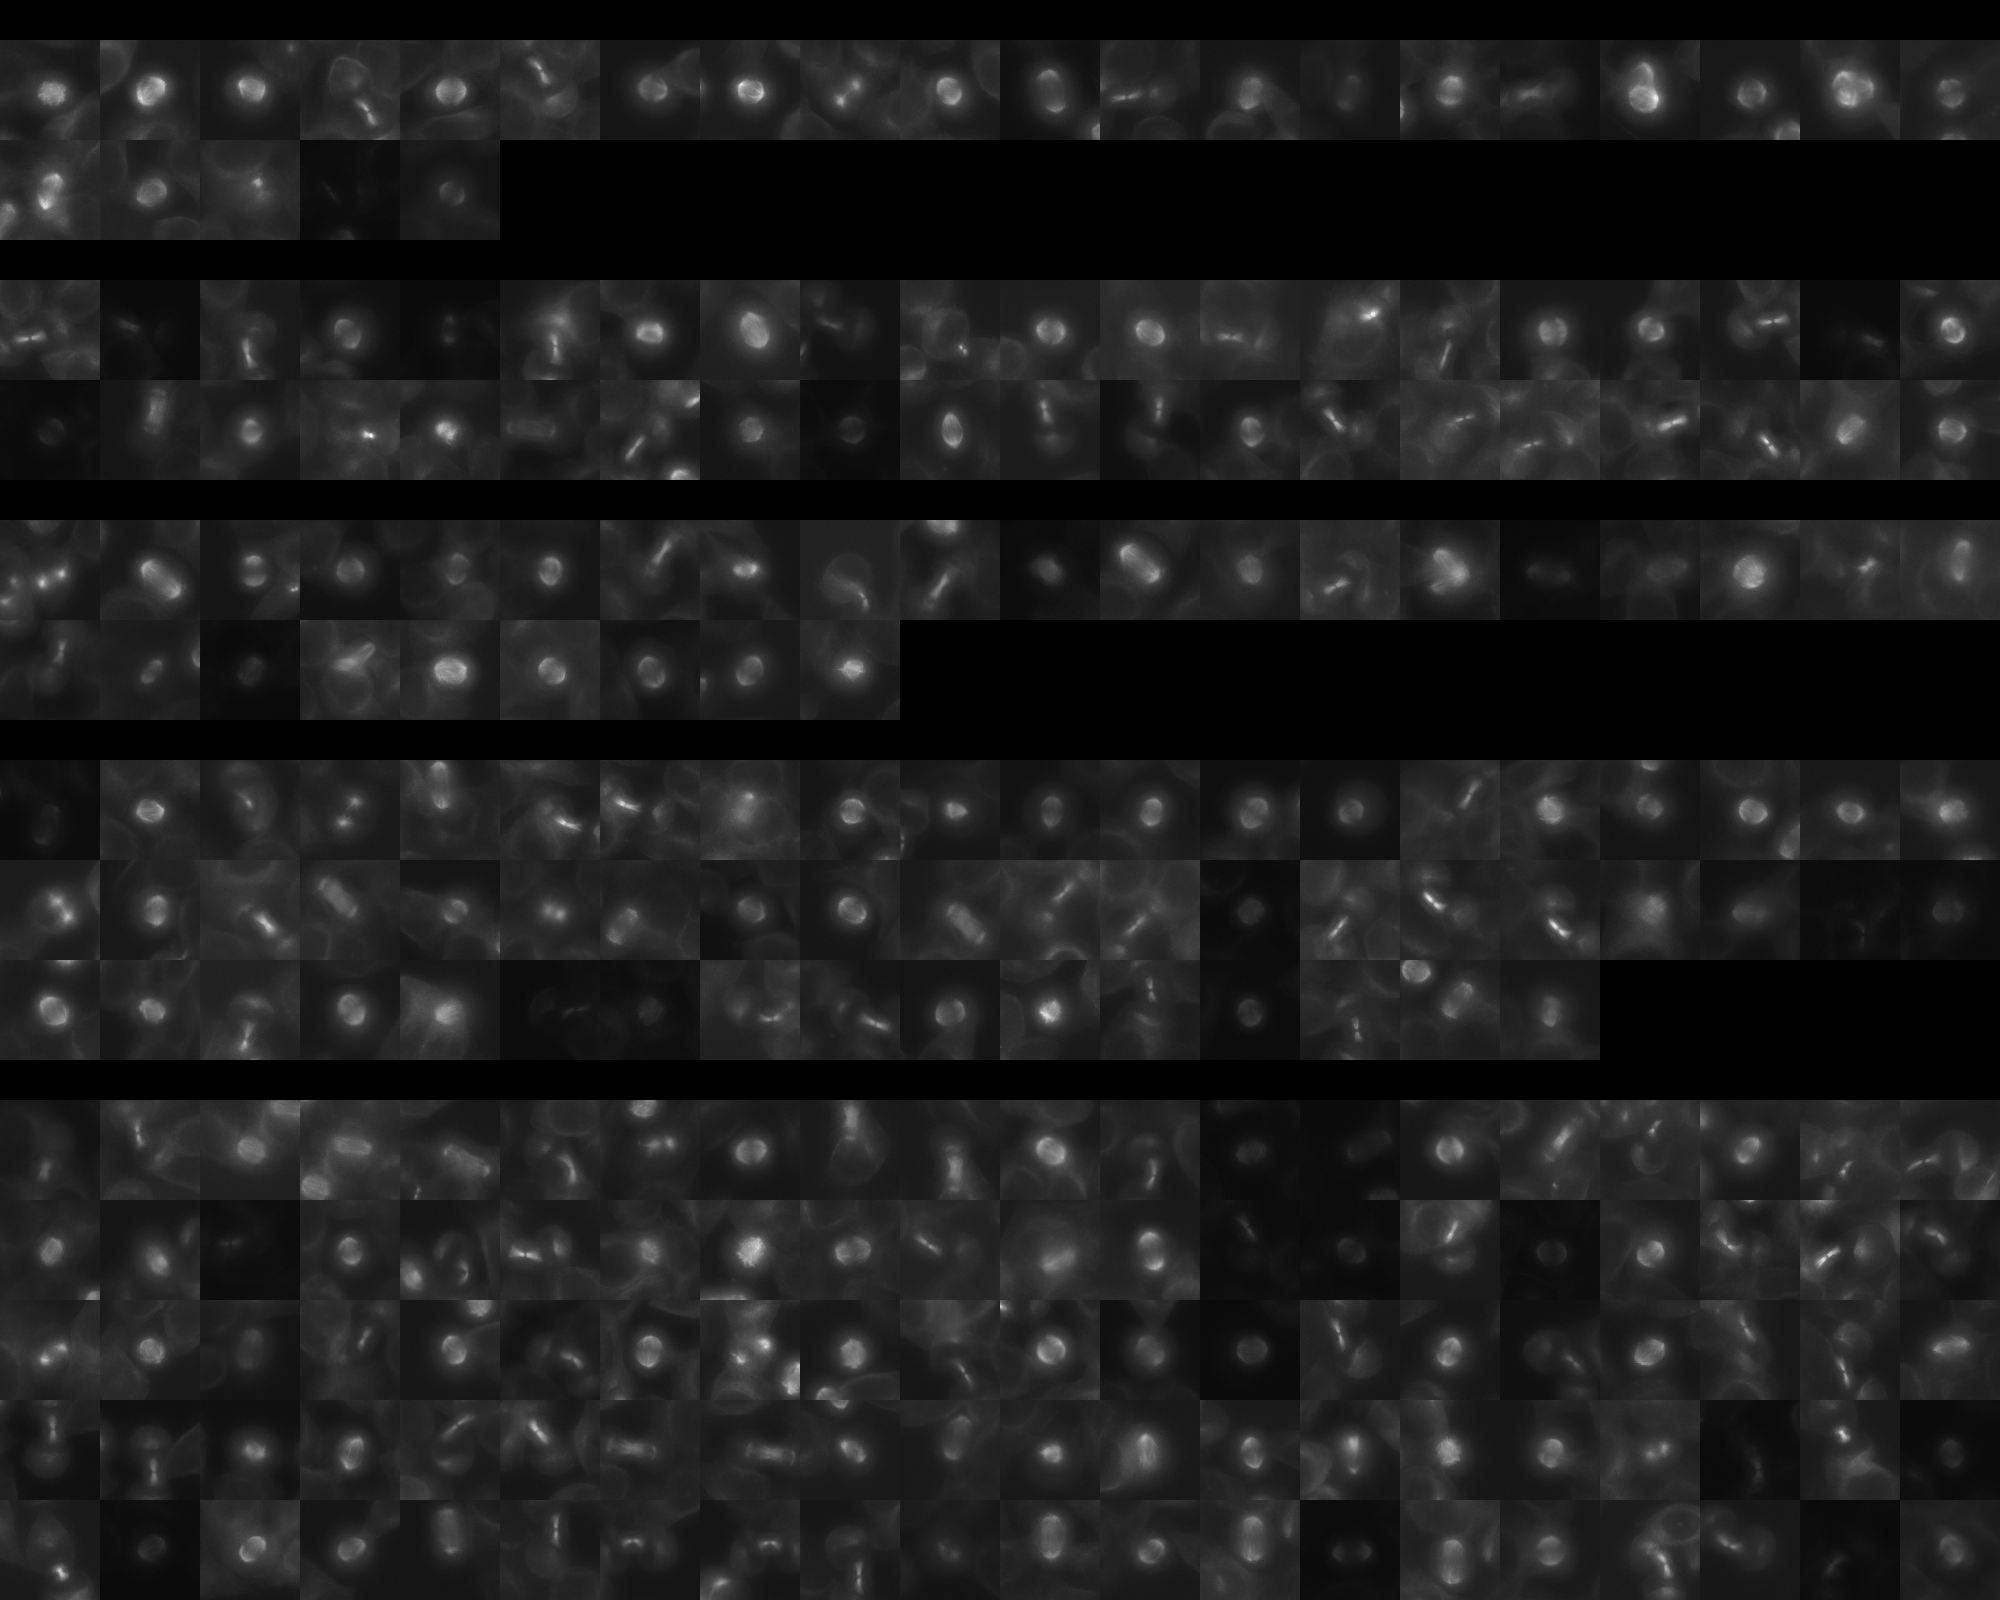
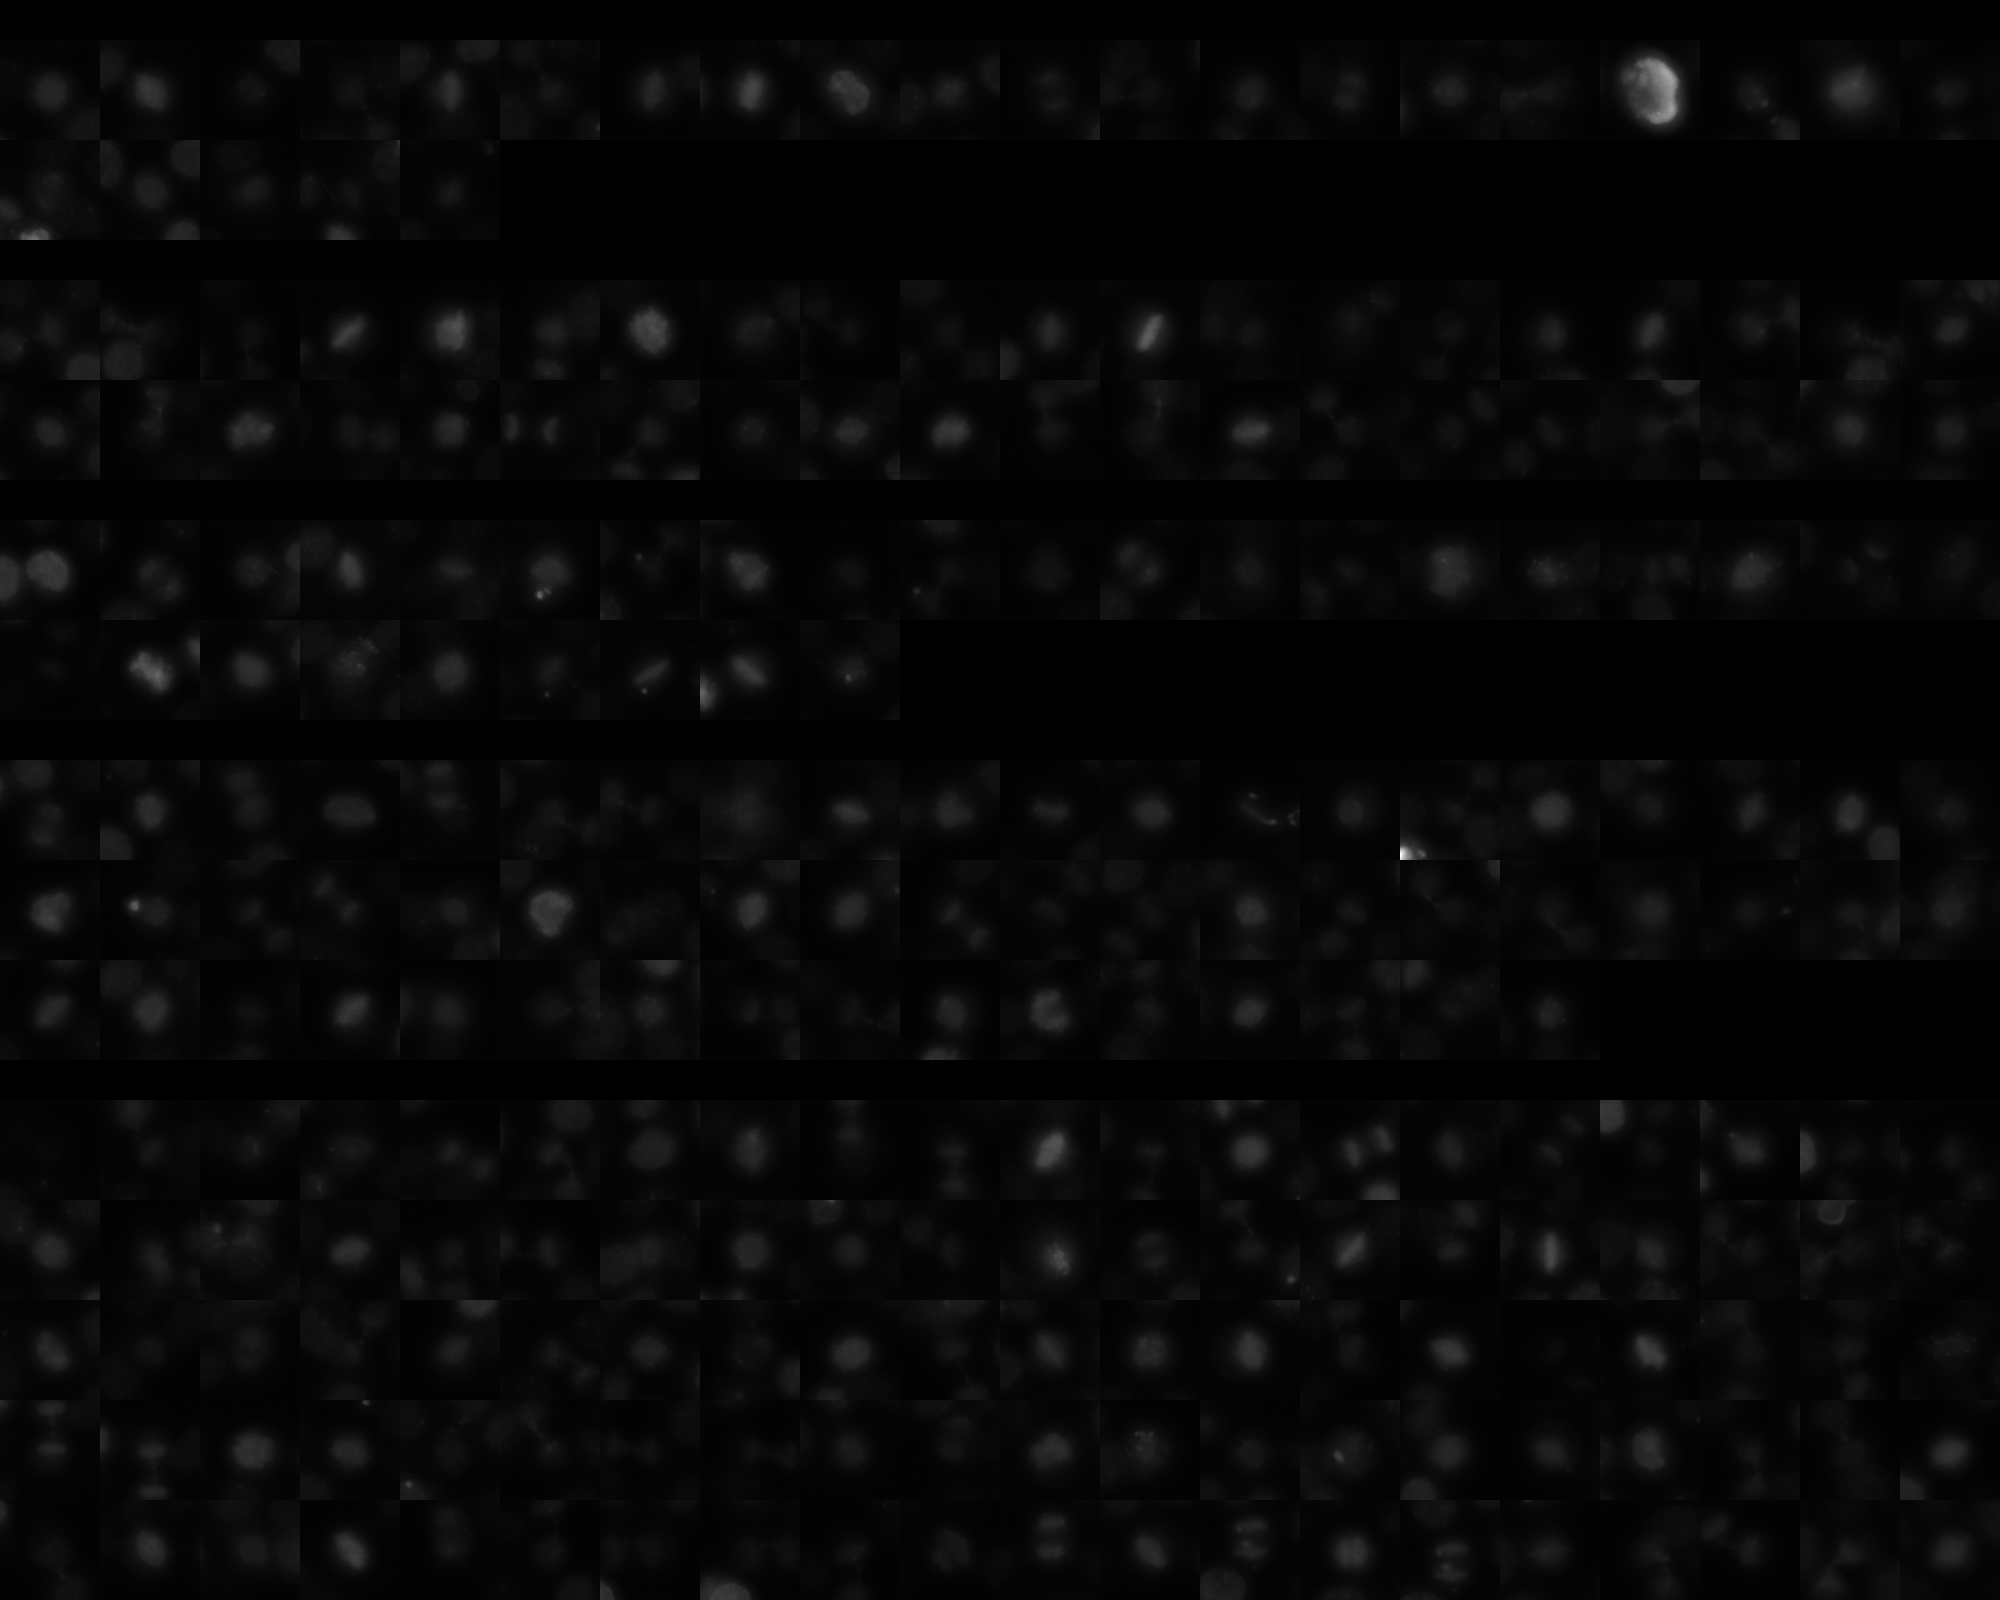
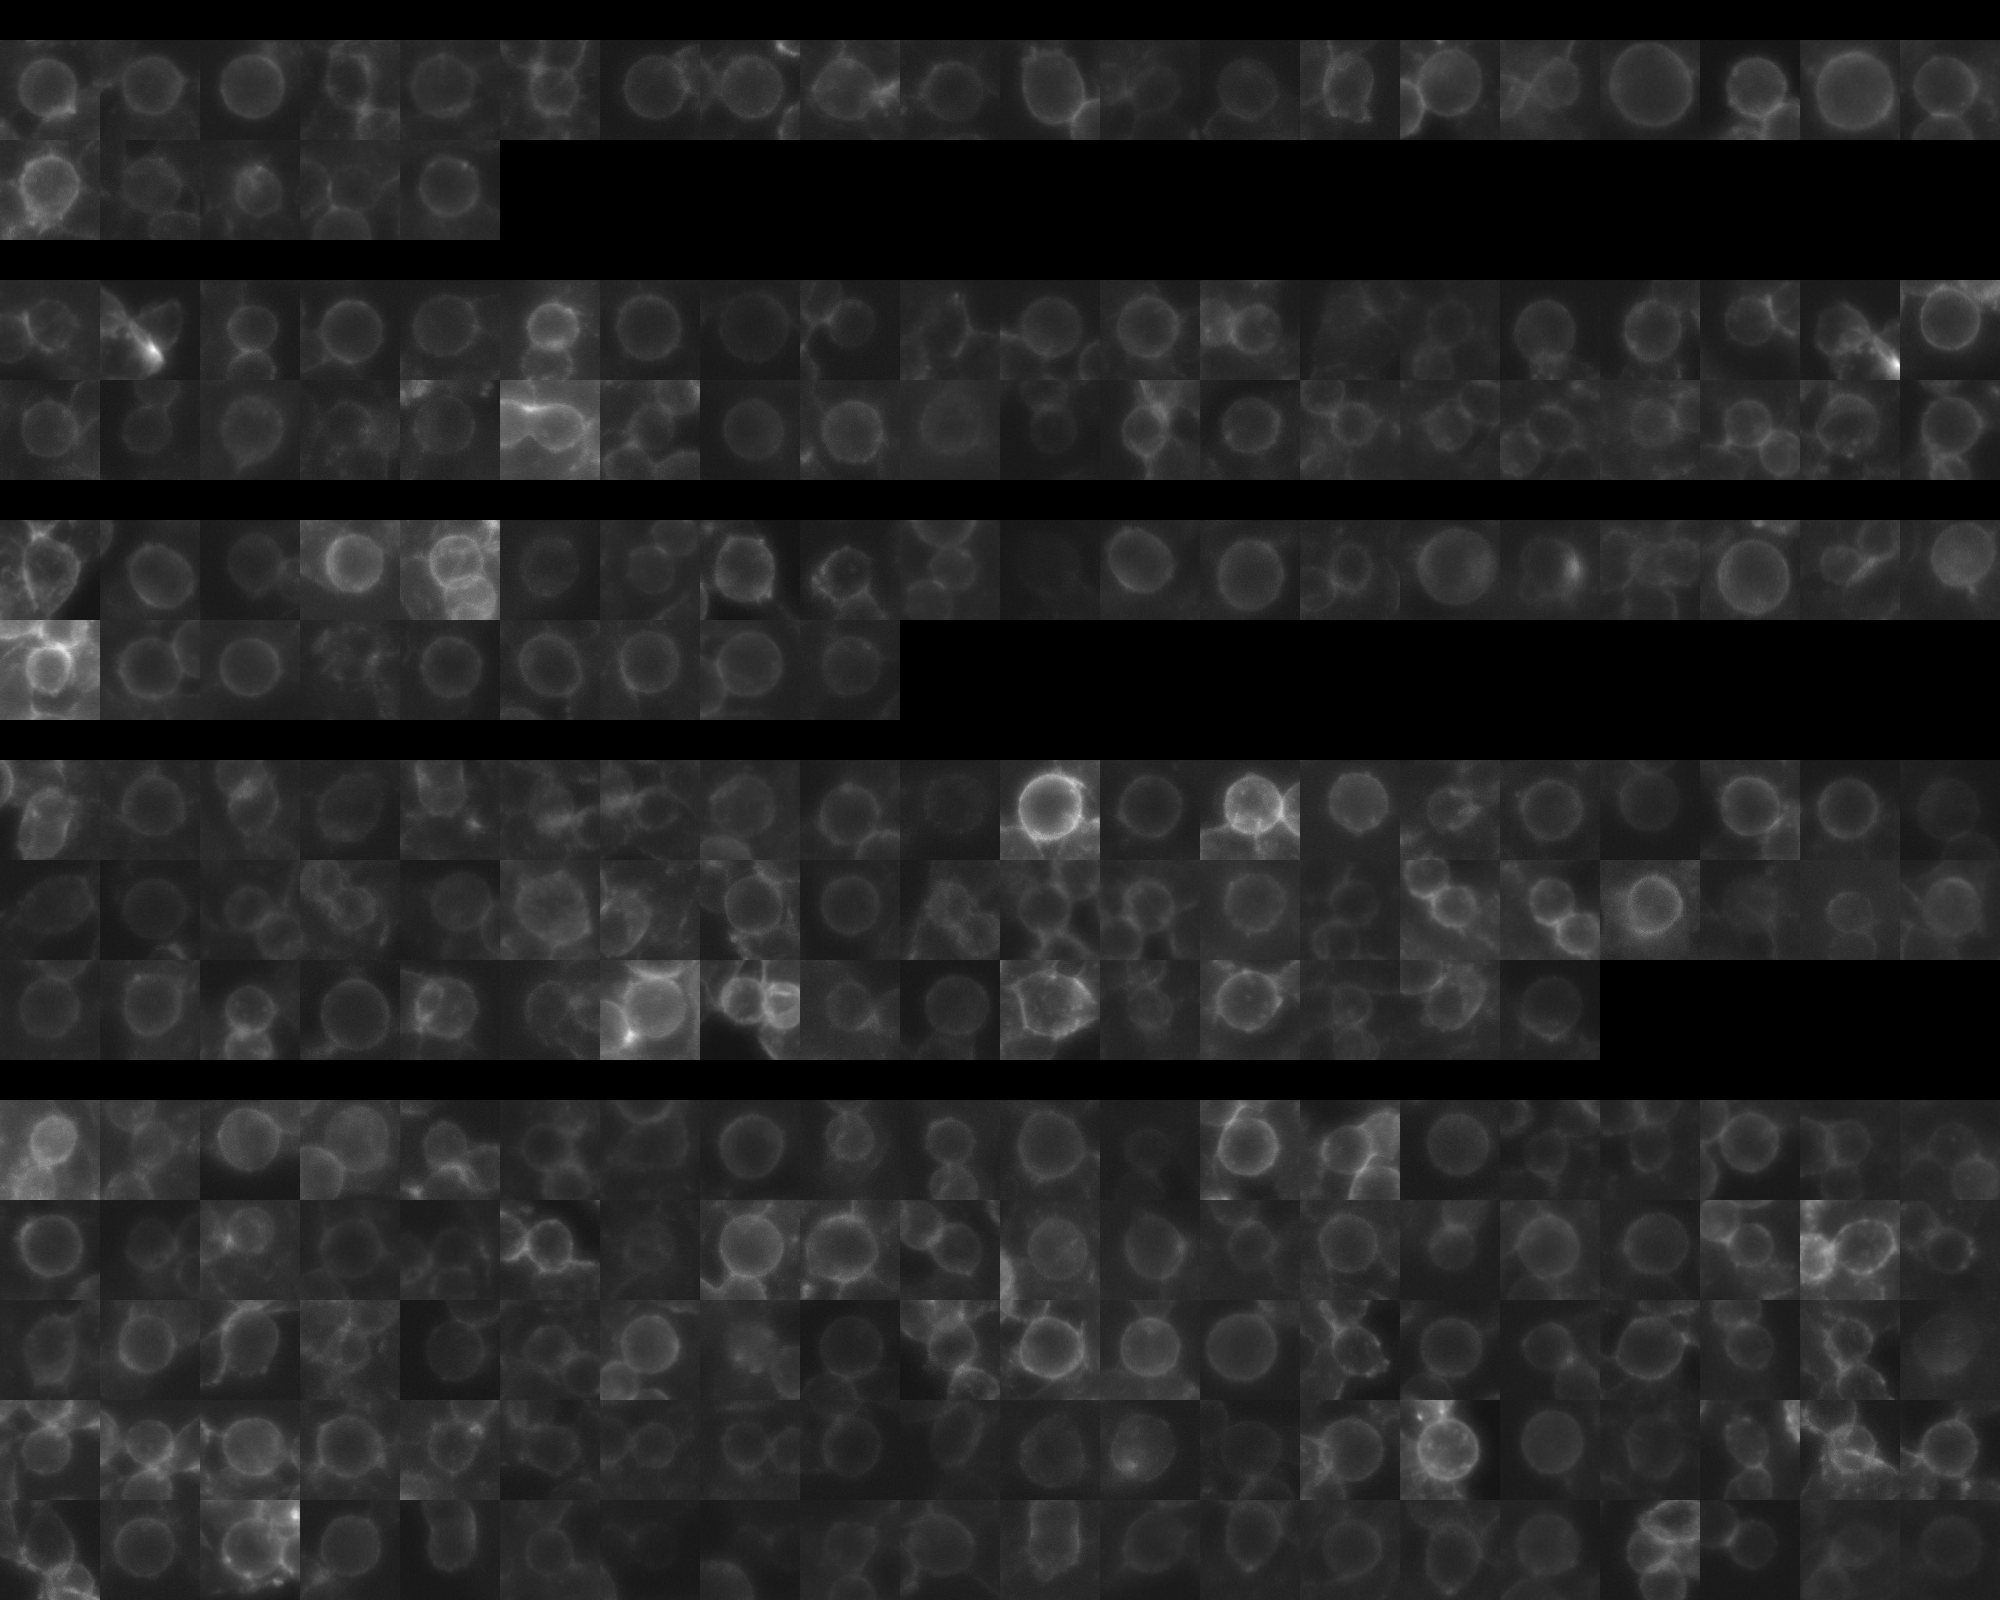
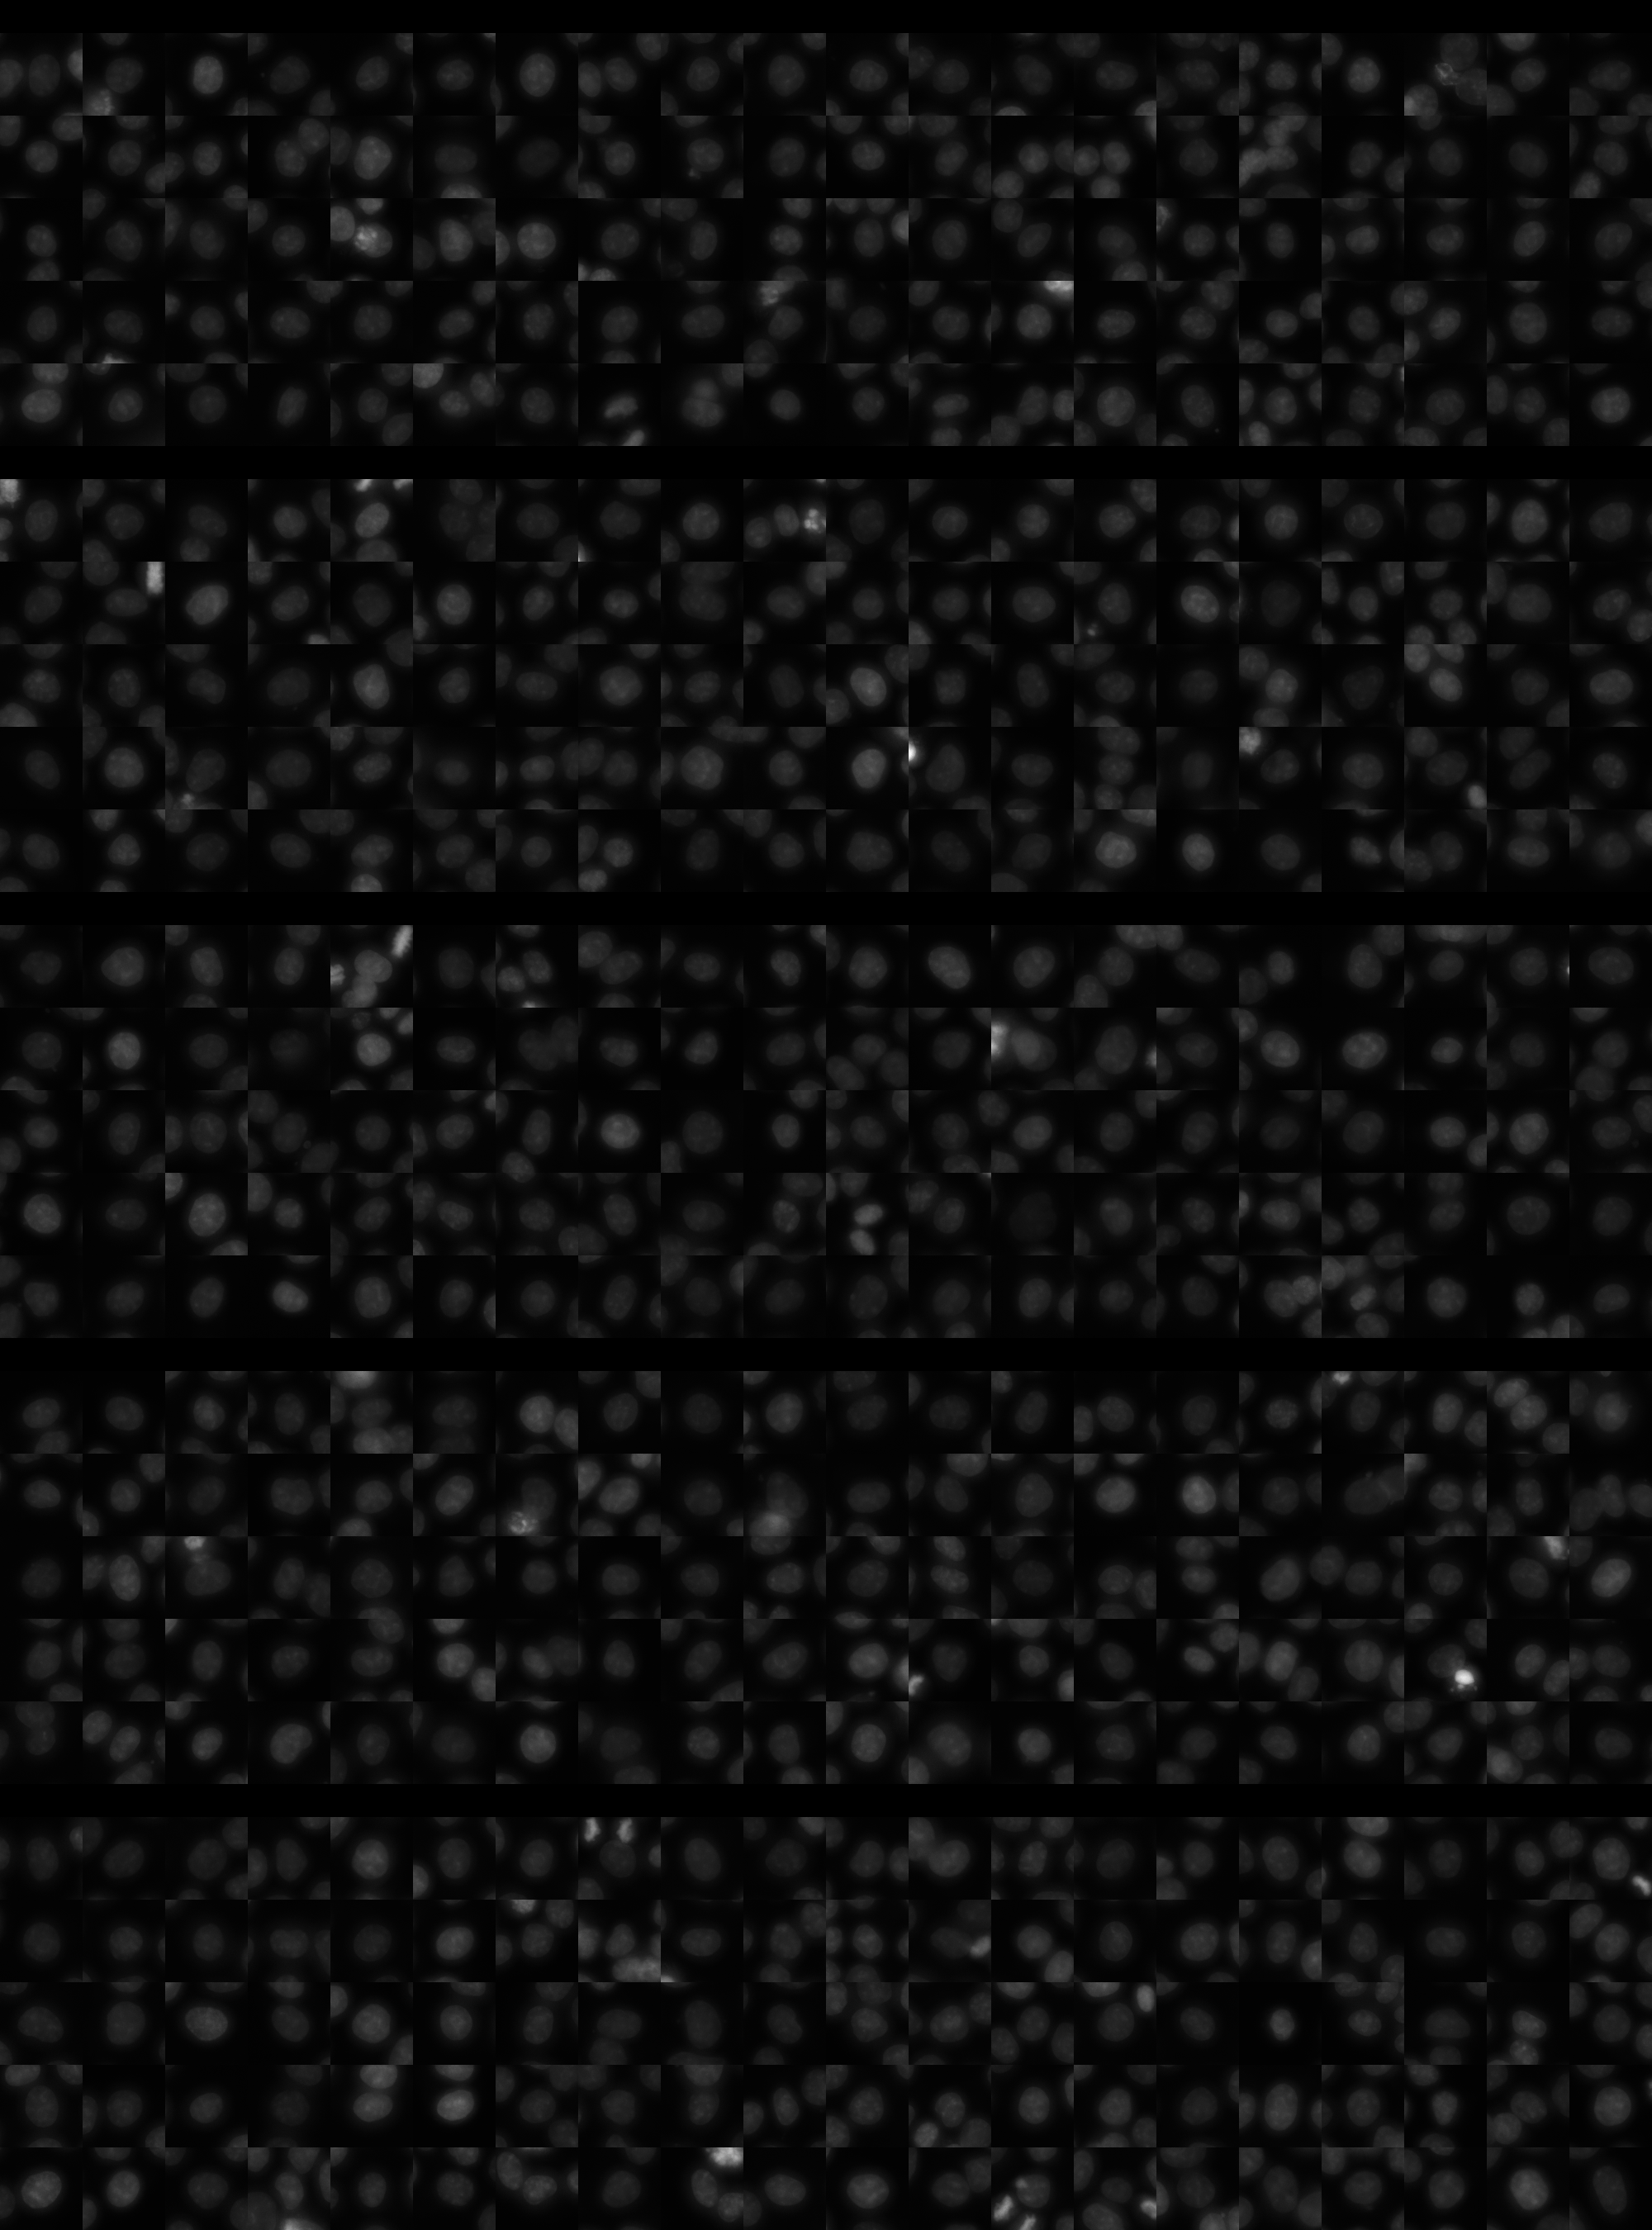
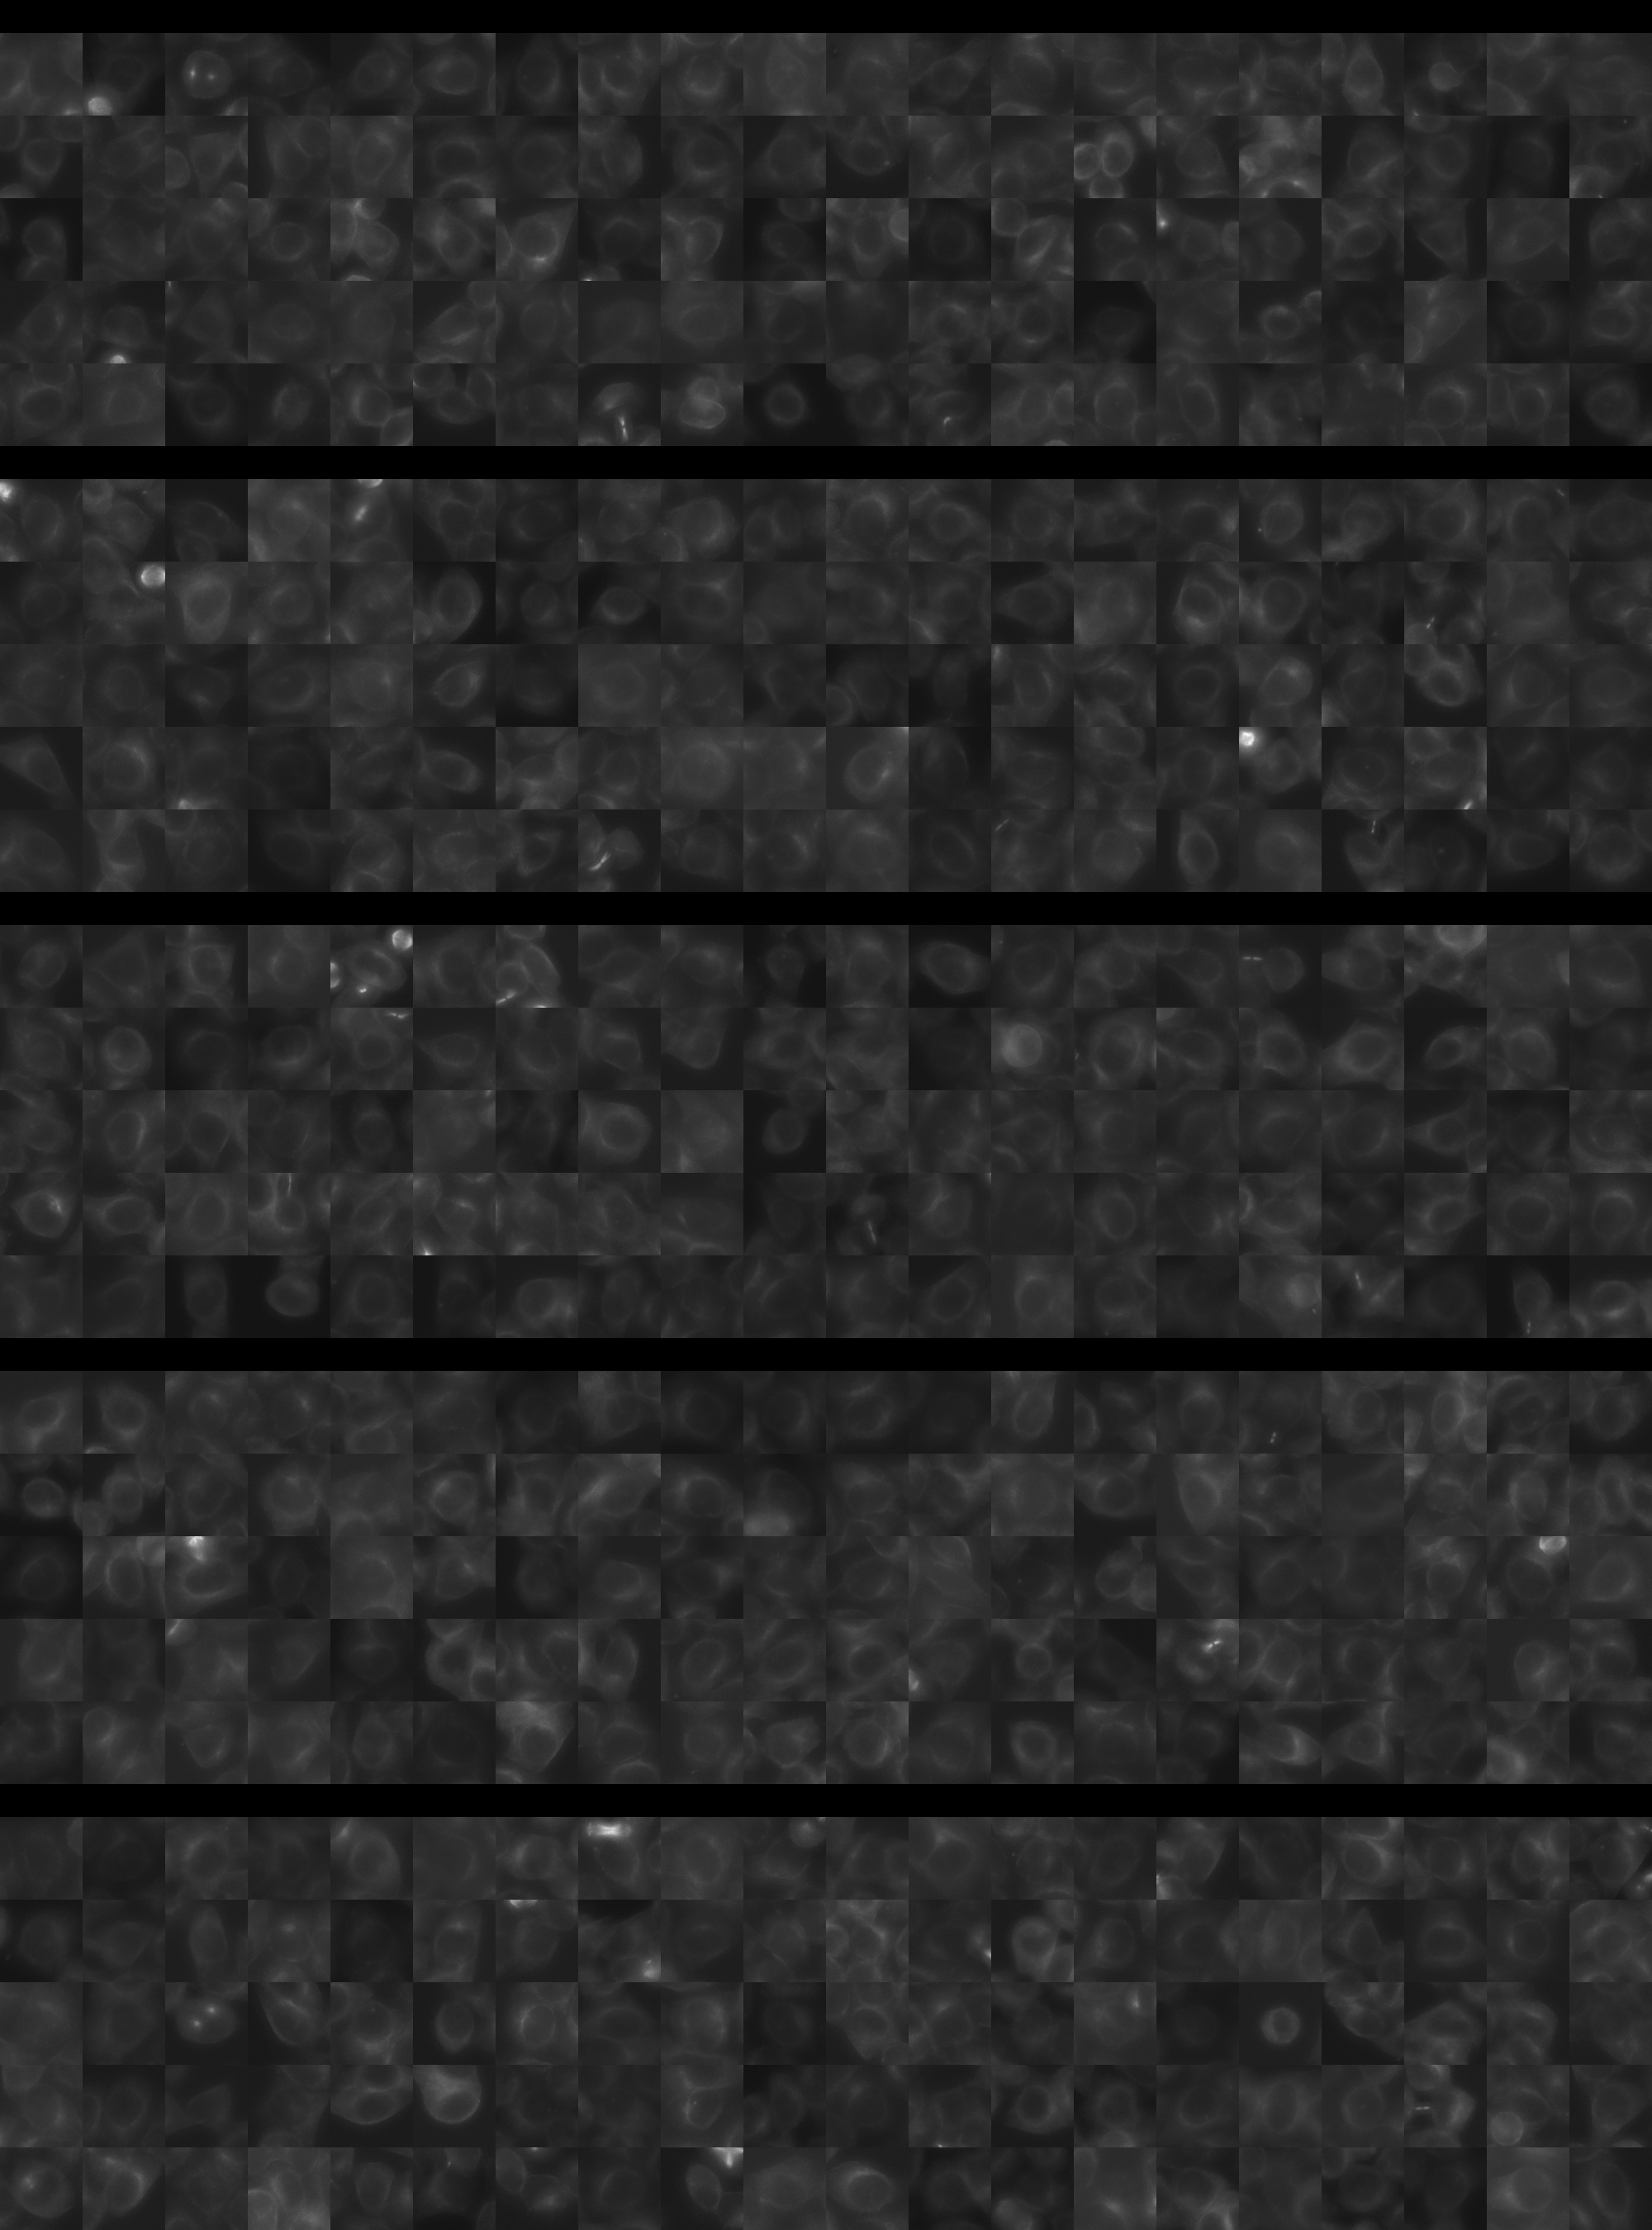
Each montage below shows randomly selected individual cell images for the same target gene separated by sgRNA, along with an example montage of cells expressing a non-targeting negative control sgRNA at the bottom. sgRNA labels in the montages correspond to the numbered sgRNA sequences in the gene info table above. The DNA (blue) and tubulin (green) channels are displayed by default, with gH2AX (grayscale) and actin (yellow) available using the check boxes. Channel brightness, contrast, and opacity are adjustable by clicking the arrow next to the channel name. When only one channel is selected, the display defaults to grayscale. Click the “Zoom” checkbox above the channel controls to enable image zooming (via scrolling) and panning (via click-and-drag).

The cell boxes displayed for this gene are square, 30.36 μm per side for the interphase montage and 30.36 μm per side for the mitotic montage.
Features

Interphase Score Rank FDR q-value
Nucleus DNA Integrated 0.034 1541 of 5322 0.659
Nucleus DNA Mean -1.854e-02 2580 of 5322 0.743
Nucleus gH2AX Mean 0.024 4167 of 5322 0.541
Nucleus DNA - gH2AX Correlation 0.038 423 of 5322 0.276
Nucleus Shape Area 0.074 1107 of 5322 0.163
Nucleus Shape Eccentricity 0.003 3187 of 5322 0.932
Nucleus Shape Form Factor -4.241e-02 2306 of 5322 0.284
Nucleus Shape Solidity -3.053e-02 1772 of 5322 0.380
Cell DNA Mass Displacement 0.005 4073 of 5322 0.976
Cell Tubulin Mean -7.284e-02 4685 of 5322 0.095
Cell Tubulin Mass Displacement -6.876e-02 4989 of 5322 0.067
Cell Actin Mean -1.175e-01 5013 of 5322 0.004
Cell Tubulin - Actin Correlation -5.325e-02 5052 of 5322 0.178
Cell DNA - Tubulin Correlation -3.999e-02 4845 of 5322 0.285
Cell Shape Area 0.068 1059 of 5322 0.247
Cell Shape Eccentricity -1.909e-02 4715 of 5322 0.855
Mitotic Score Rank FDR q-value
Nucleus DNA Integrated 0.183 1434 of 5322 0.884
Nucleus DNA Mean -2.814e-02 3407 of 5322 1.000
Nucleus DNA Mass Displacement 0.065 2457 of 5322 0.999
Nucleus DNA Mean Frac 3 0.126 1256 of 5322 1.000
Nucleus gH2AX Mean -8.401e-02 4074 of 5322 1.000
Nucleus gH2AX Mean Frac 0 -1.183e-01 4040 of 5322 1.000
Nucleus Tubulin Mean Frac 0 0.099 2000 of 5322 0.999
Nucleus Tubulin Mean Edge -6.620e-02 3987 of 5322 0.999
Nucleus Tubulin Std Edge -9.610e-02 3847 of 5322 0.999
Nucleus Shape Area 0.223 1277 of 5322 0.852
Nucleus Shape Eccentricity -1.599e-01 4212 of 5322 1.000
Nucleus Shape Form Factor -2.608e-01 4601 of 5322 0.976
Cell Tubulin Mean 0.005 3426 of 5322 1.000
Cell Tubulin Mean Frac 3 -4.643e-02 2253 of 5322 0.999
Cell Actin Mean 0.017 2979 of 5322 1.000
Cell Shape Area 0.079 2904 of 5322 0.998
( Reset Zoom )
Brightness
Contrast
Opacity
Brightness
Contrast
Opacity
Brightness
Contrast
Opacity
Brightness
Contrast
Opacity
Brightness
Contrast
Opacity

( Reset Zoom )
Brightness
Contrast
Opacity
Brightness
Contrast
Opacity
Brightness
Contrast
Opacity
Brightness
Contrast
Opacity
Brightness
Contrast
Opacity

MIT Central Accessability