TAF6L

Gene symbol: TAF6L
Gene: 10629
Uniprot Function: Functions as a component of the PCAF complex. The PCAF complex is capable of efficiently acetylating histones in a nucleosomal context. The PCAF complex could be considered as the human version of the yeast SAGA complex (Probable). With TAF5L, acts as an epigenetic regulator essential for somatic reprogramming. Regulates target genes through H3K9ac deposition and MYC recruitment which trigger MYC regulatory network to orchestrate gene expression programs to control embryonic stem cell state. Functions with MYC to activate target gene expression through RNA polymerase II pause release (By similarity).
Mitotic Index 0.0295
Interphase Cluster: #166 (17 genes)
Mitotic Cluster: #116 (23 genes)
sgRNA 1: AGATCCTGGCAGATCCTGTG (interphase cells: 1713, mitotic cells: 66)
sgRNA 2: CACCCCTTACCCGATCCTTG (interphase cells: 4036, mitotic cells: 112)
sgRNA 3: GCAGACGAACTCCAAGATTG (interphase cells: 1830, mitotic cells: 55)
sgRNA 4: TCATGAAGCACACCAAACGC (interphase cells: 2075, mitotic cells: 60)

Interphase Cluster

Mitotic Cluster

Overview

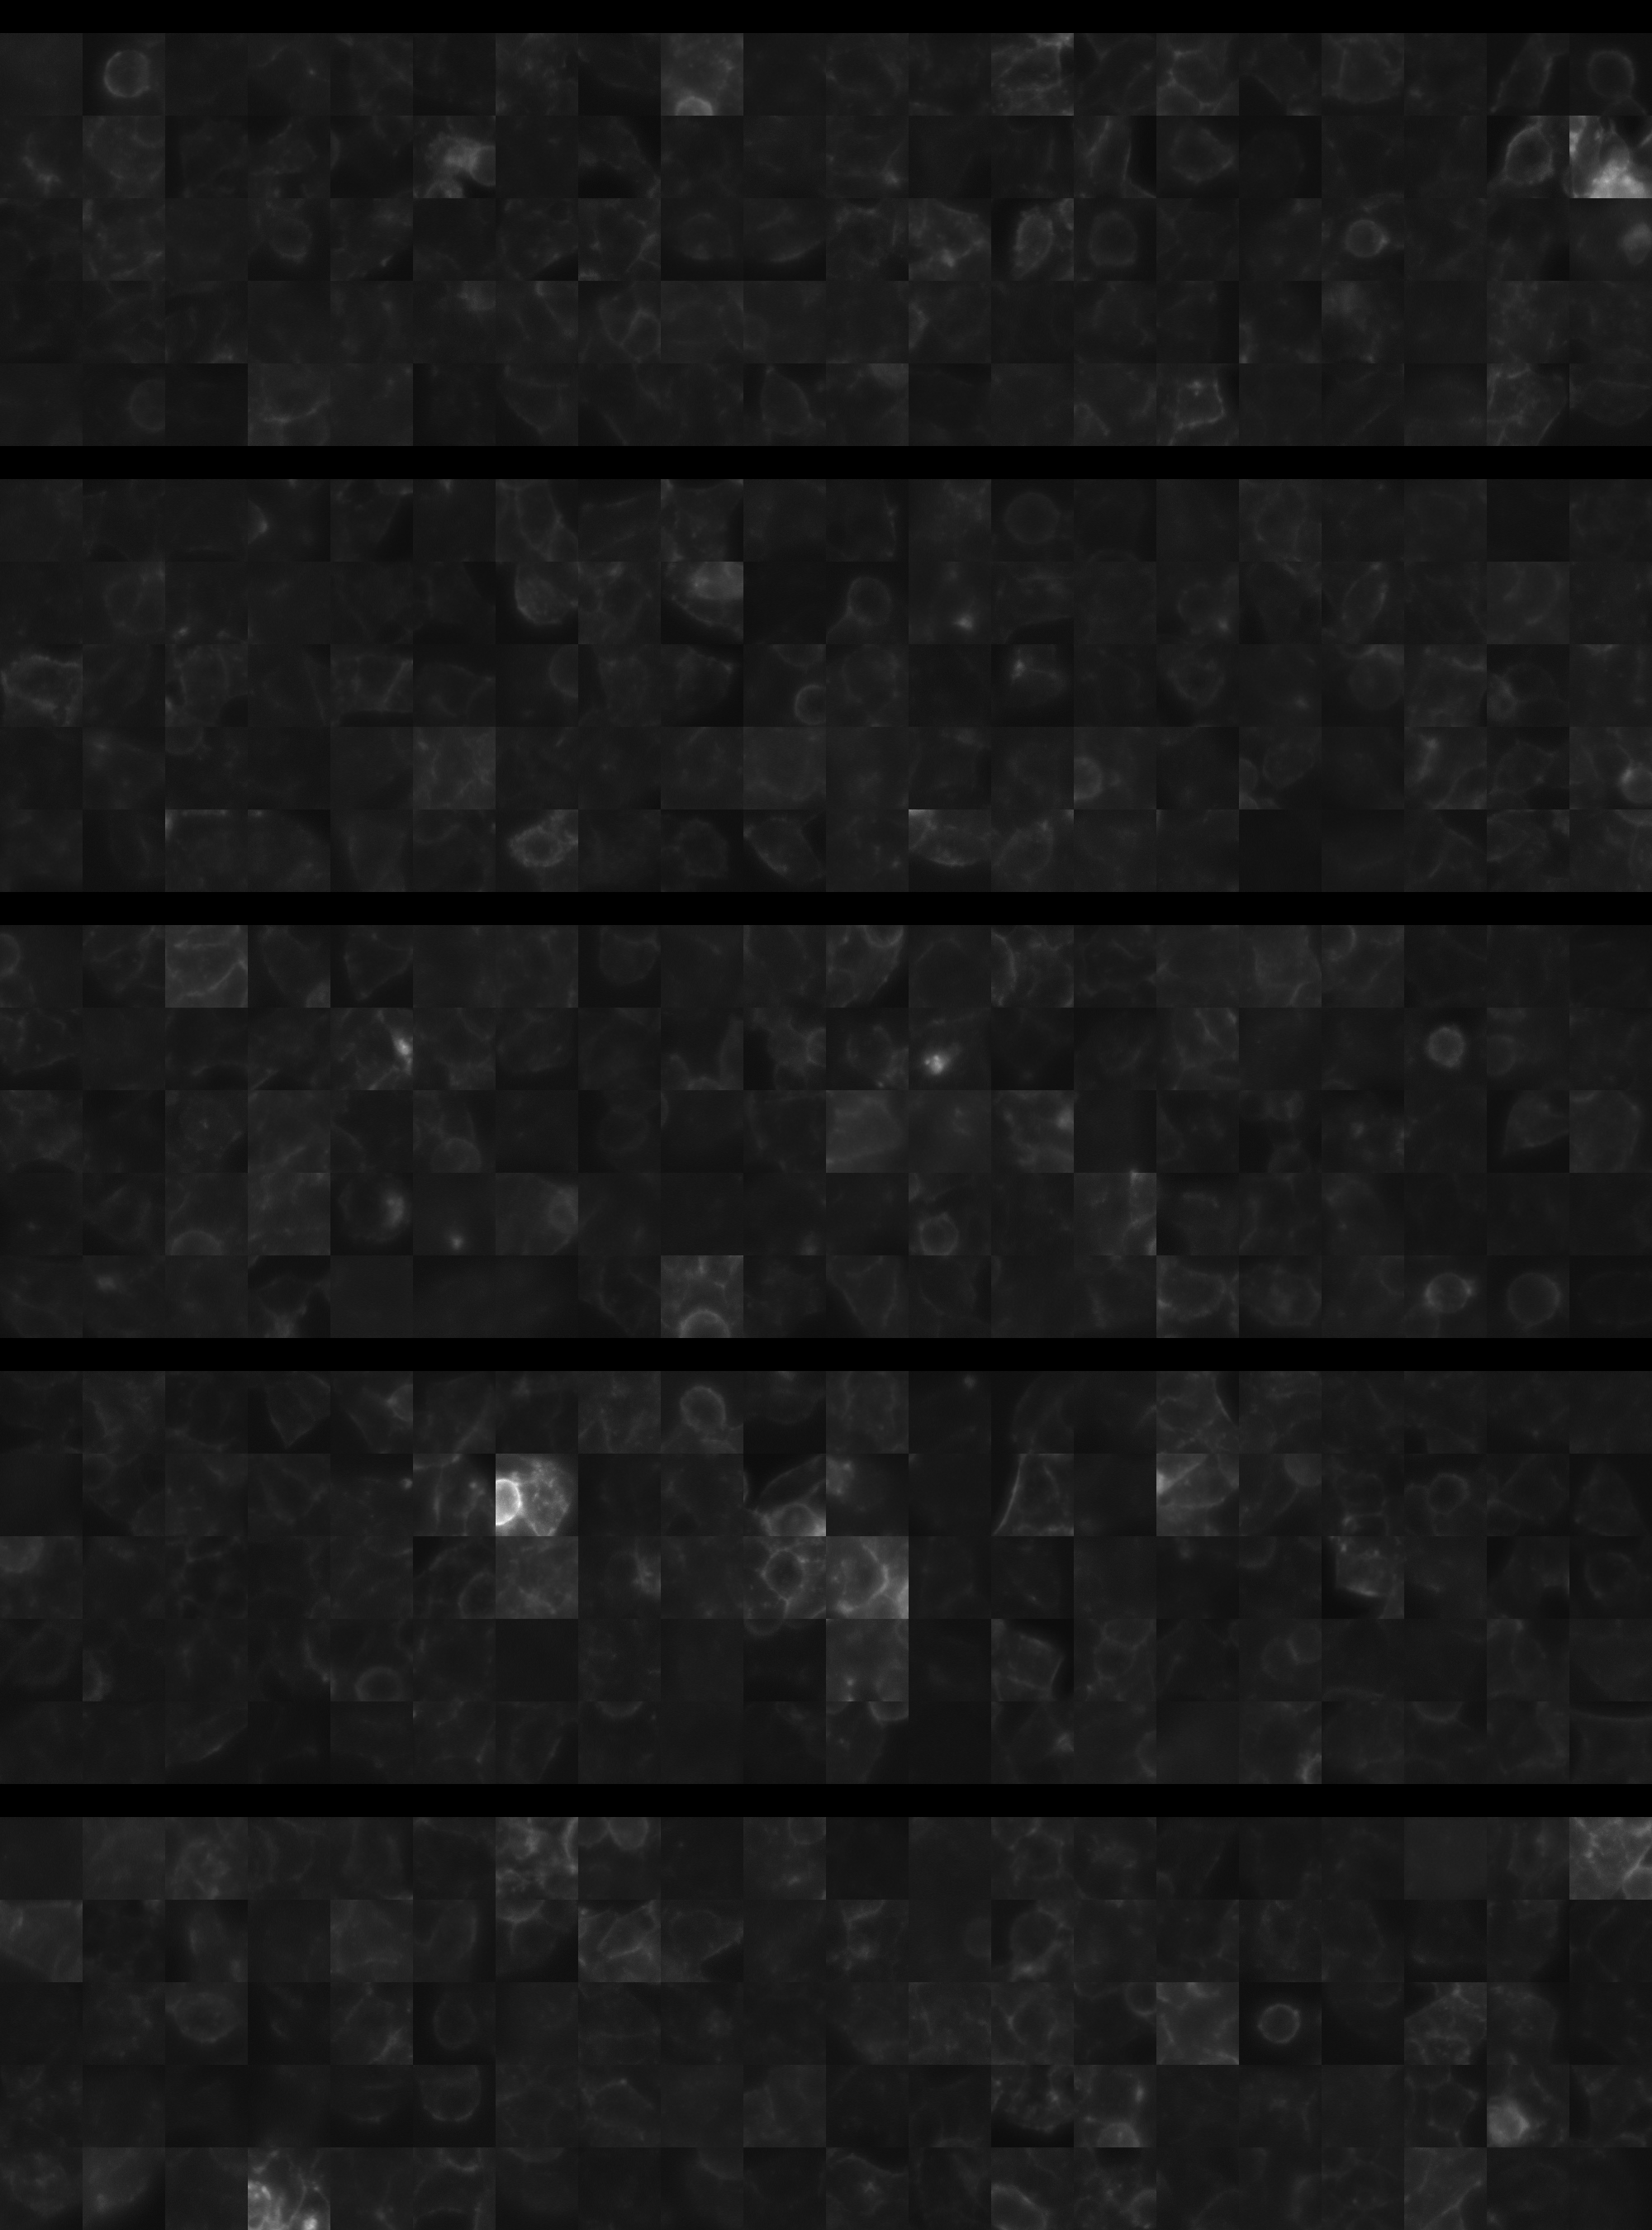
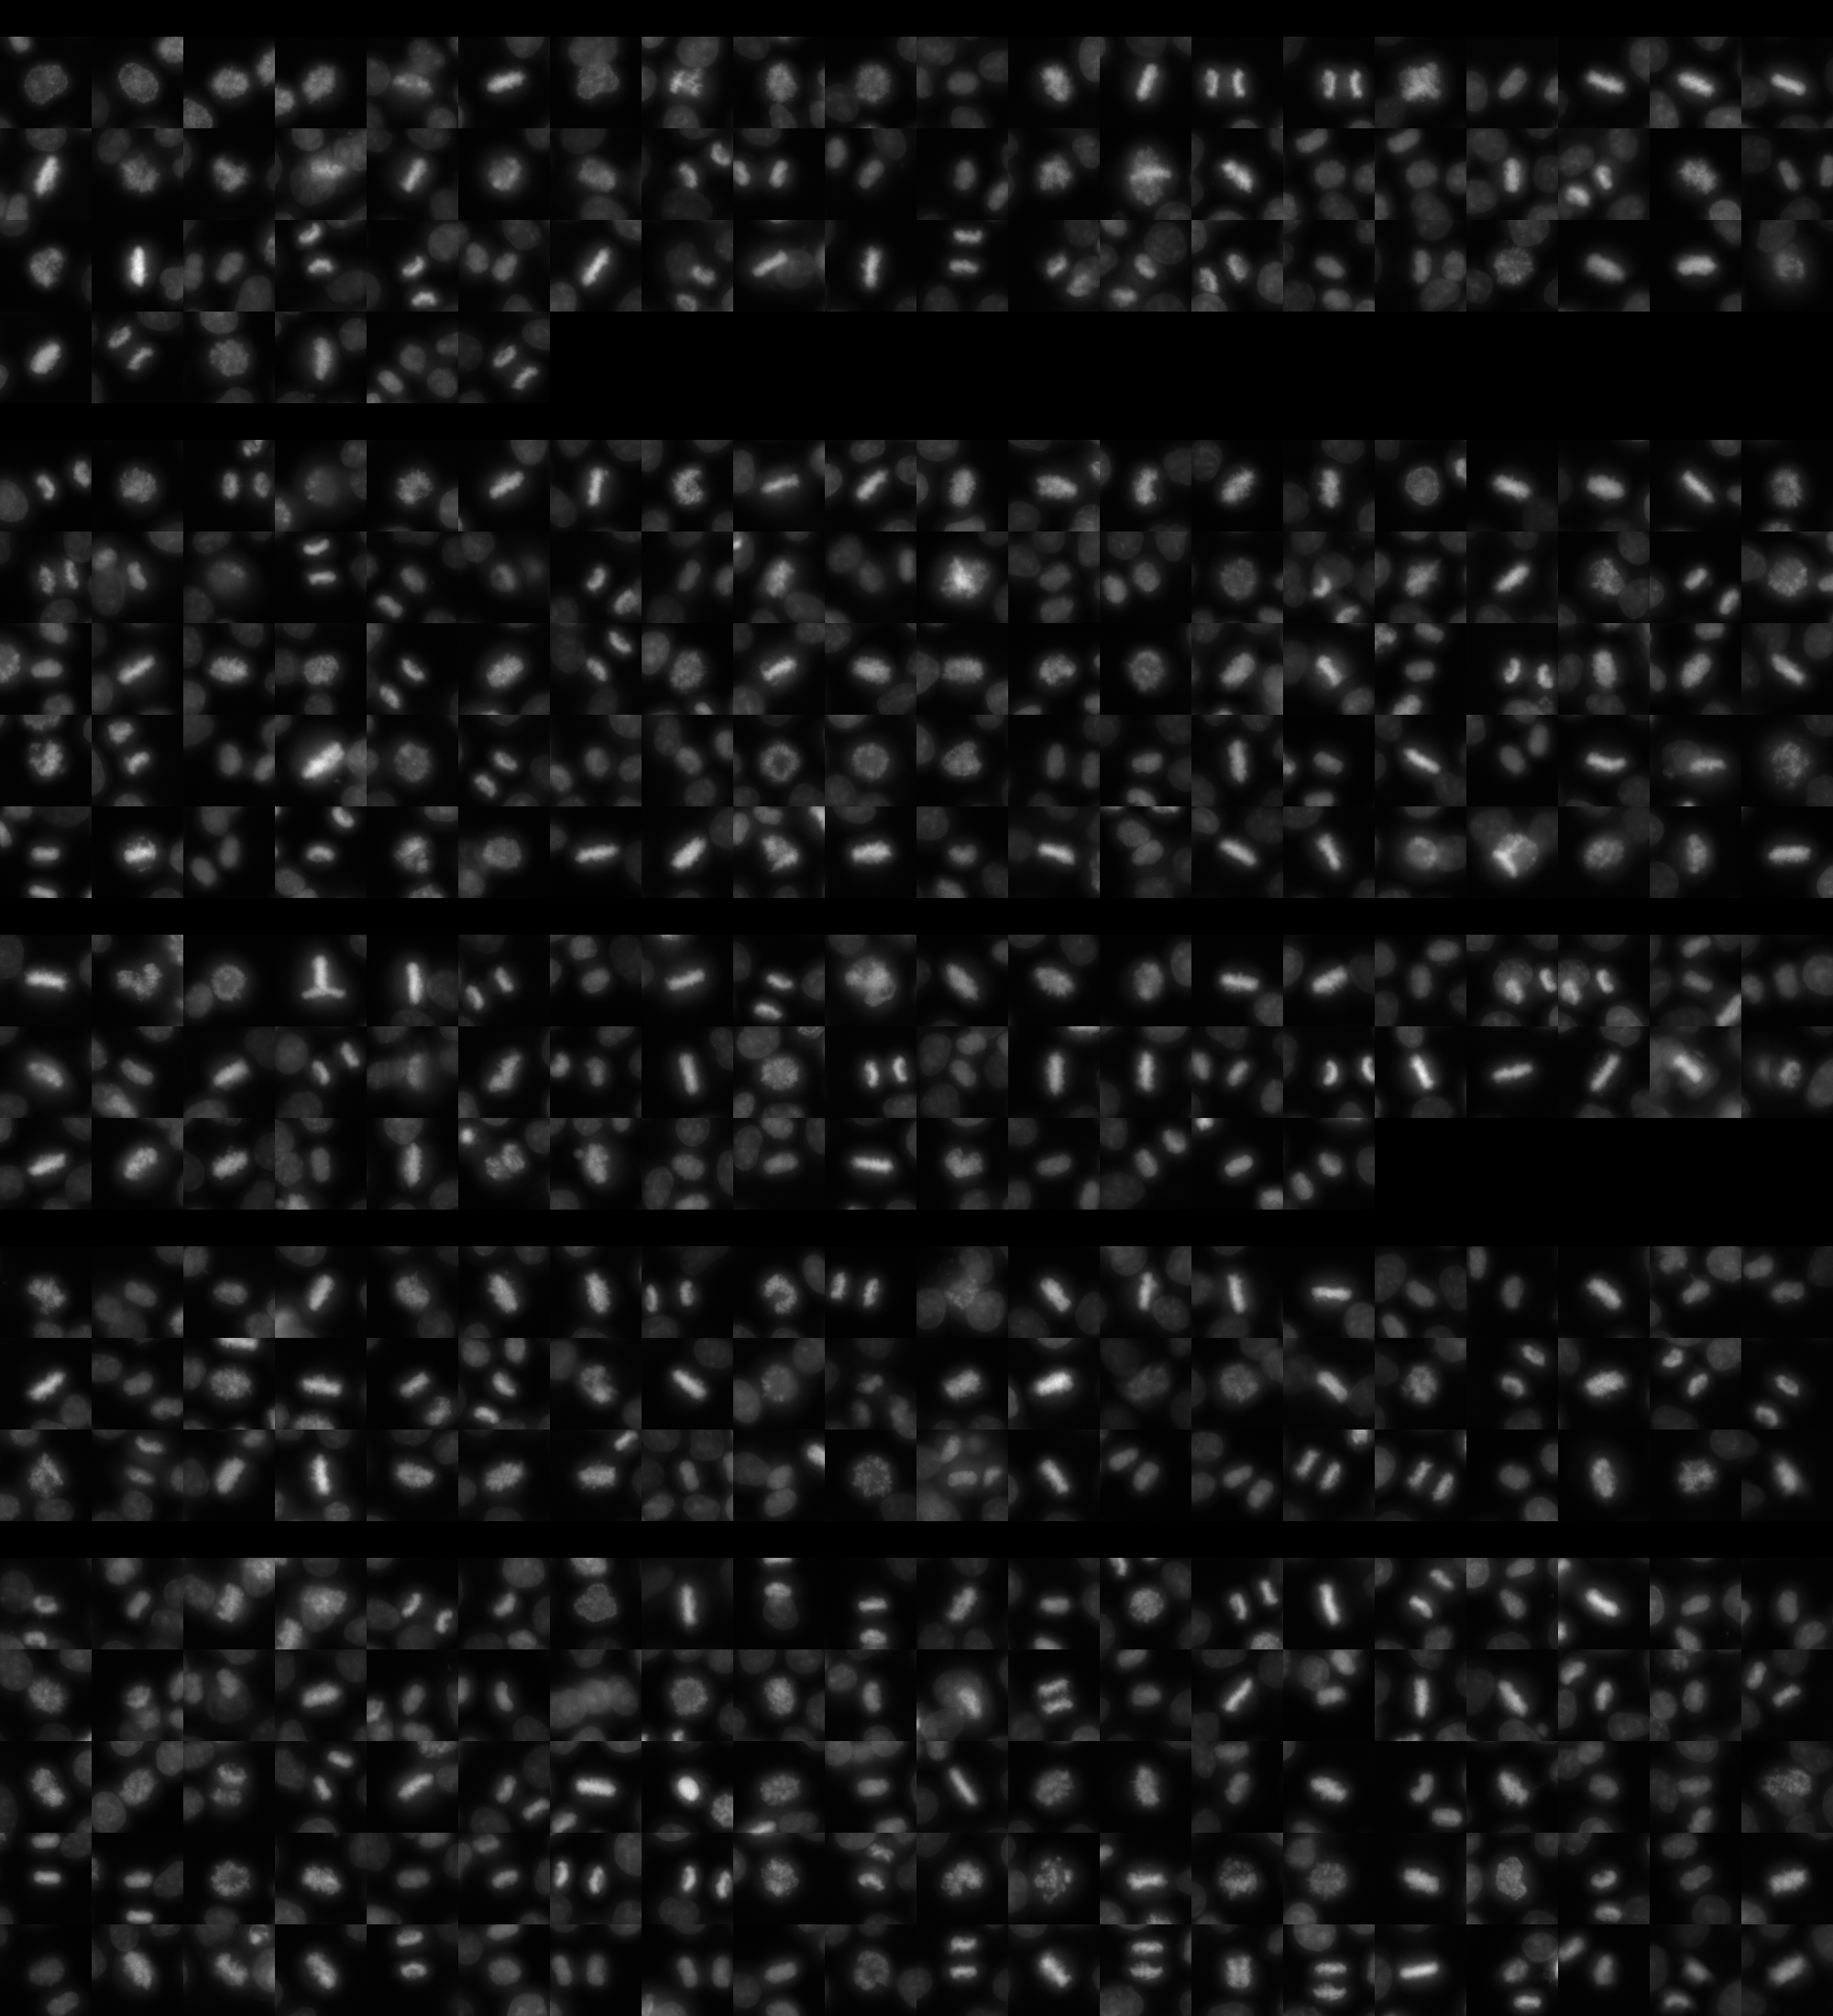
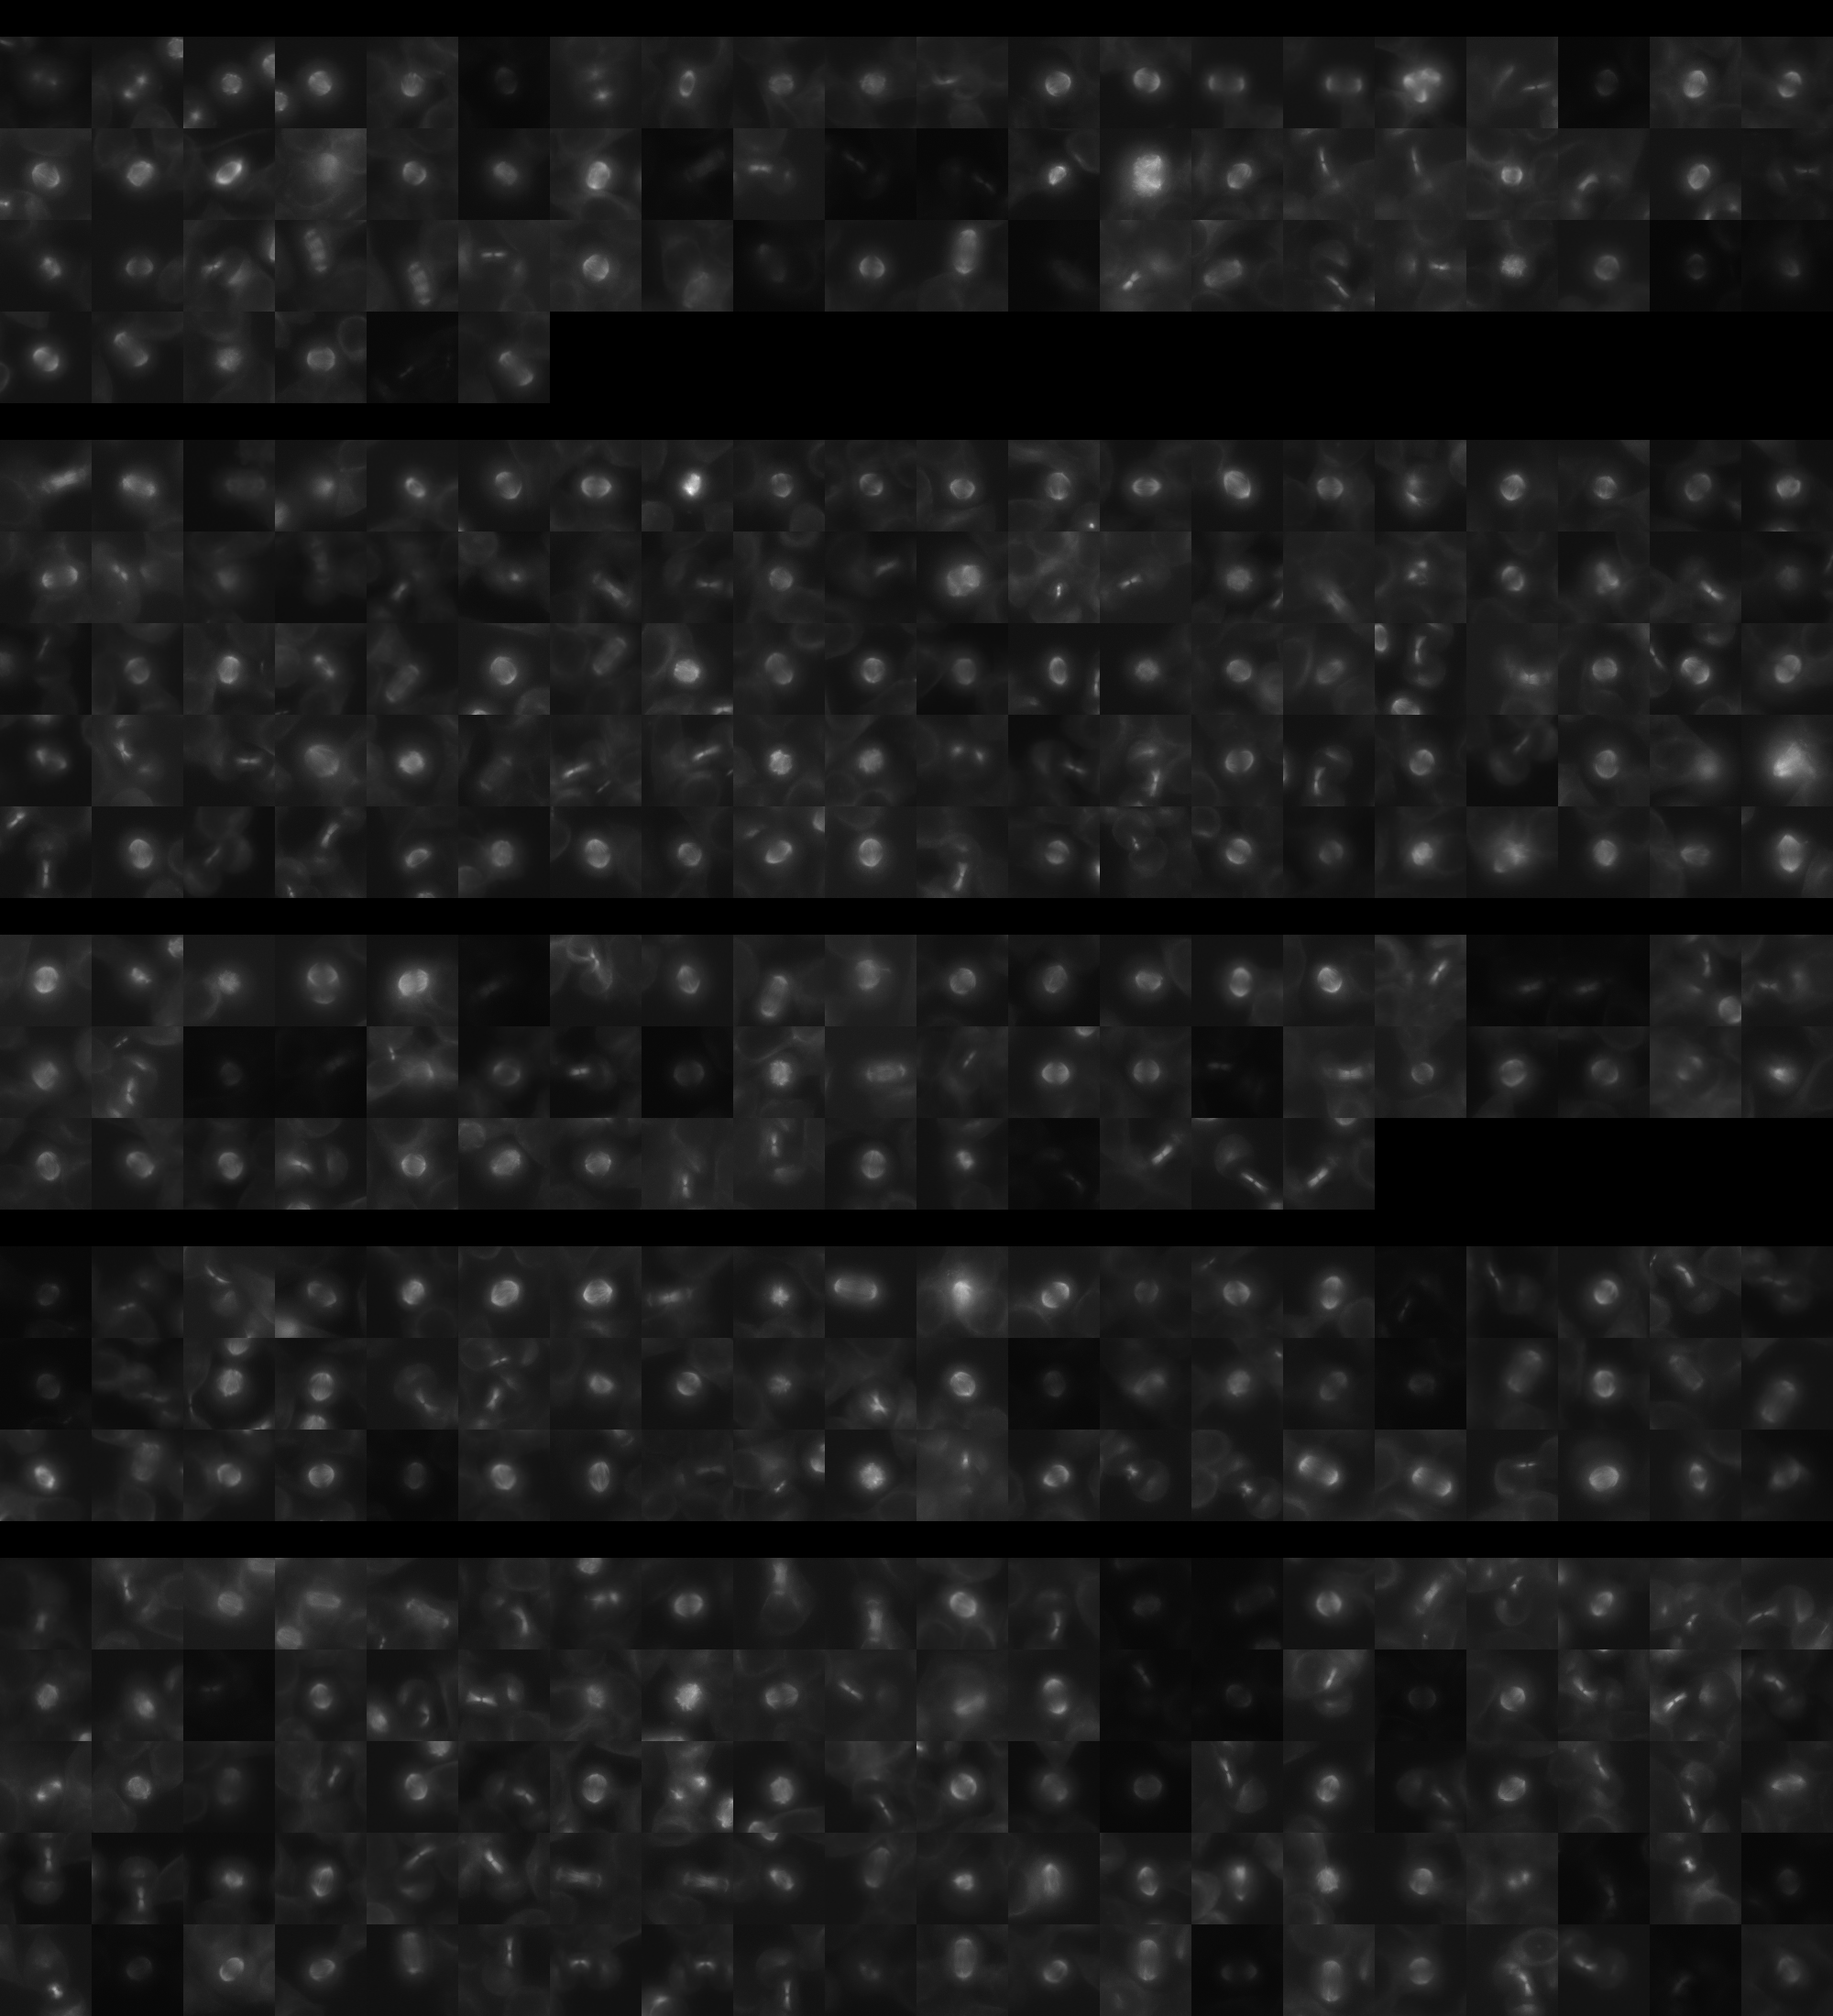
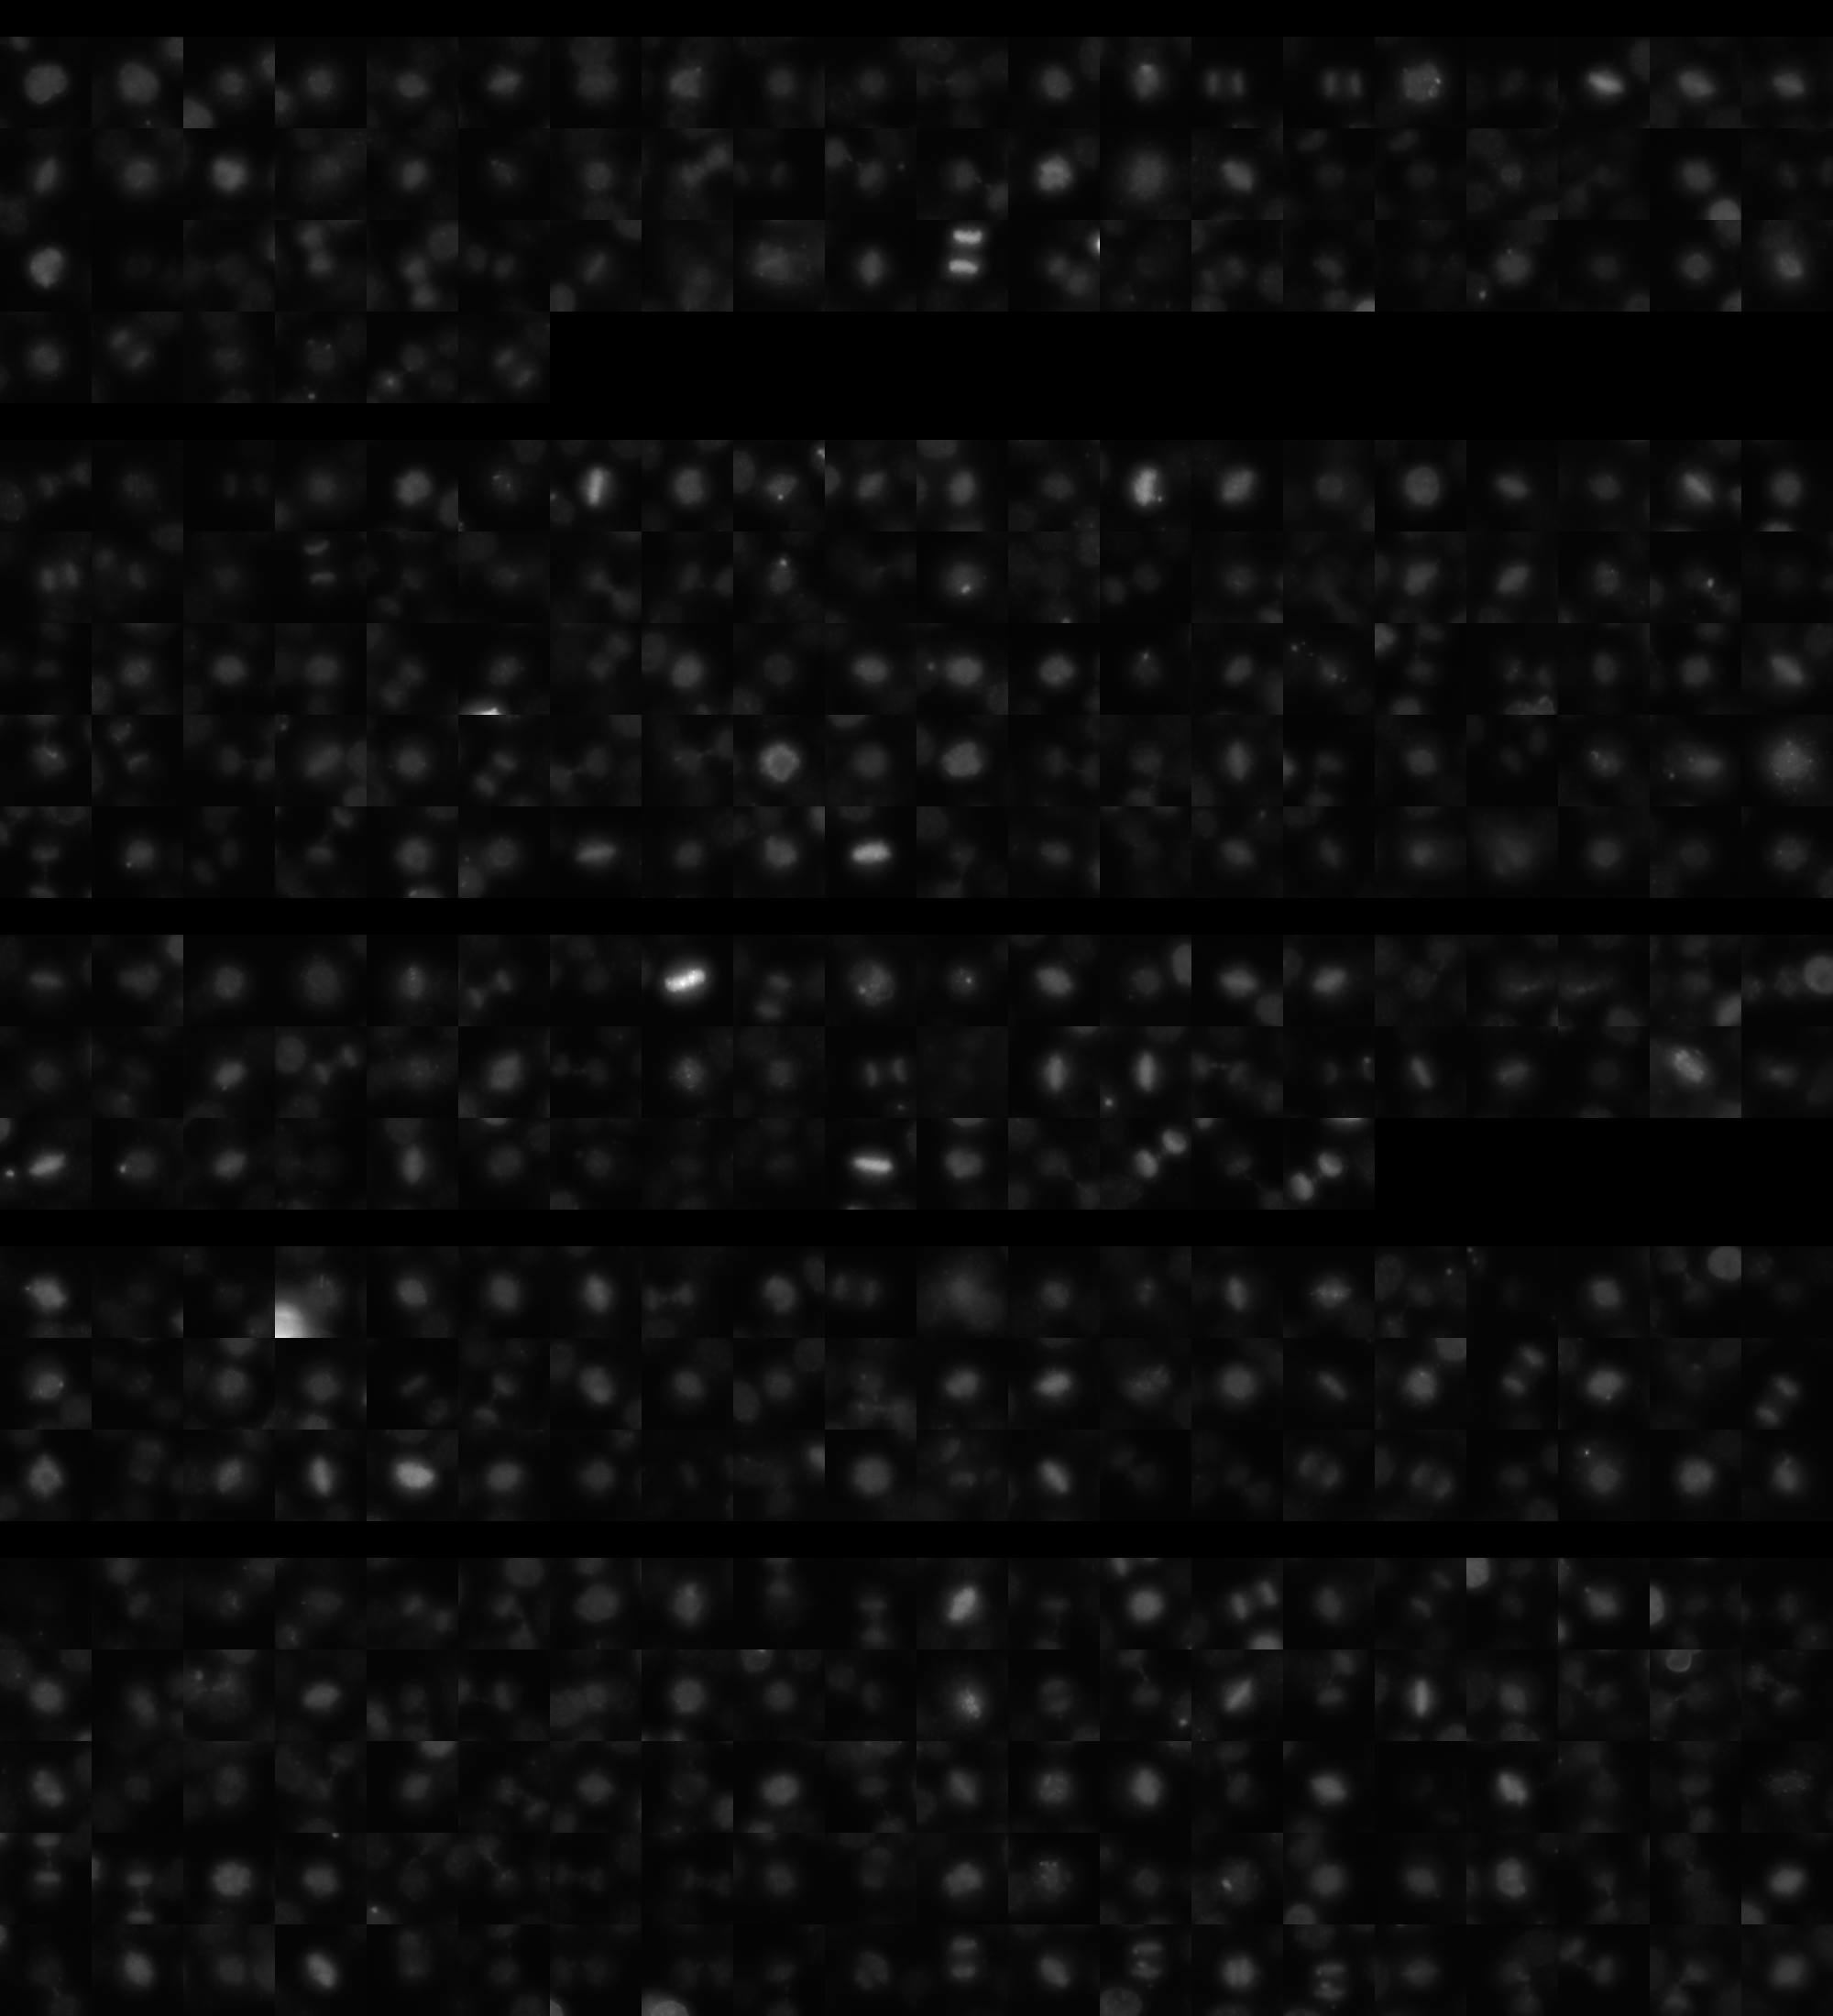
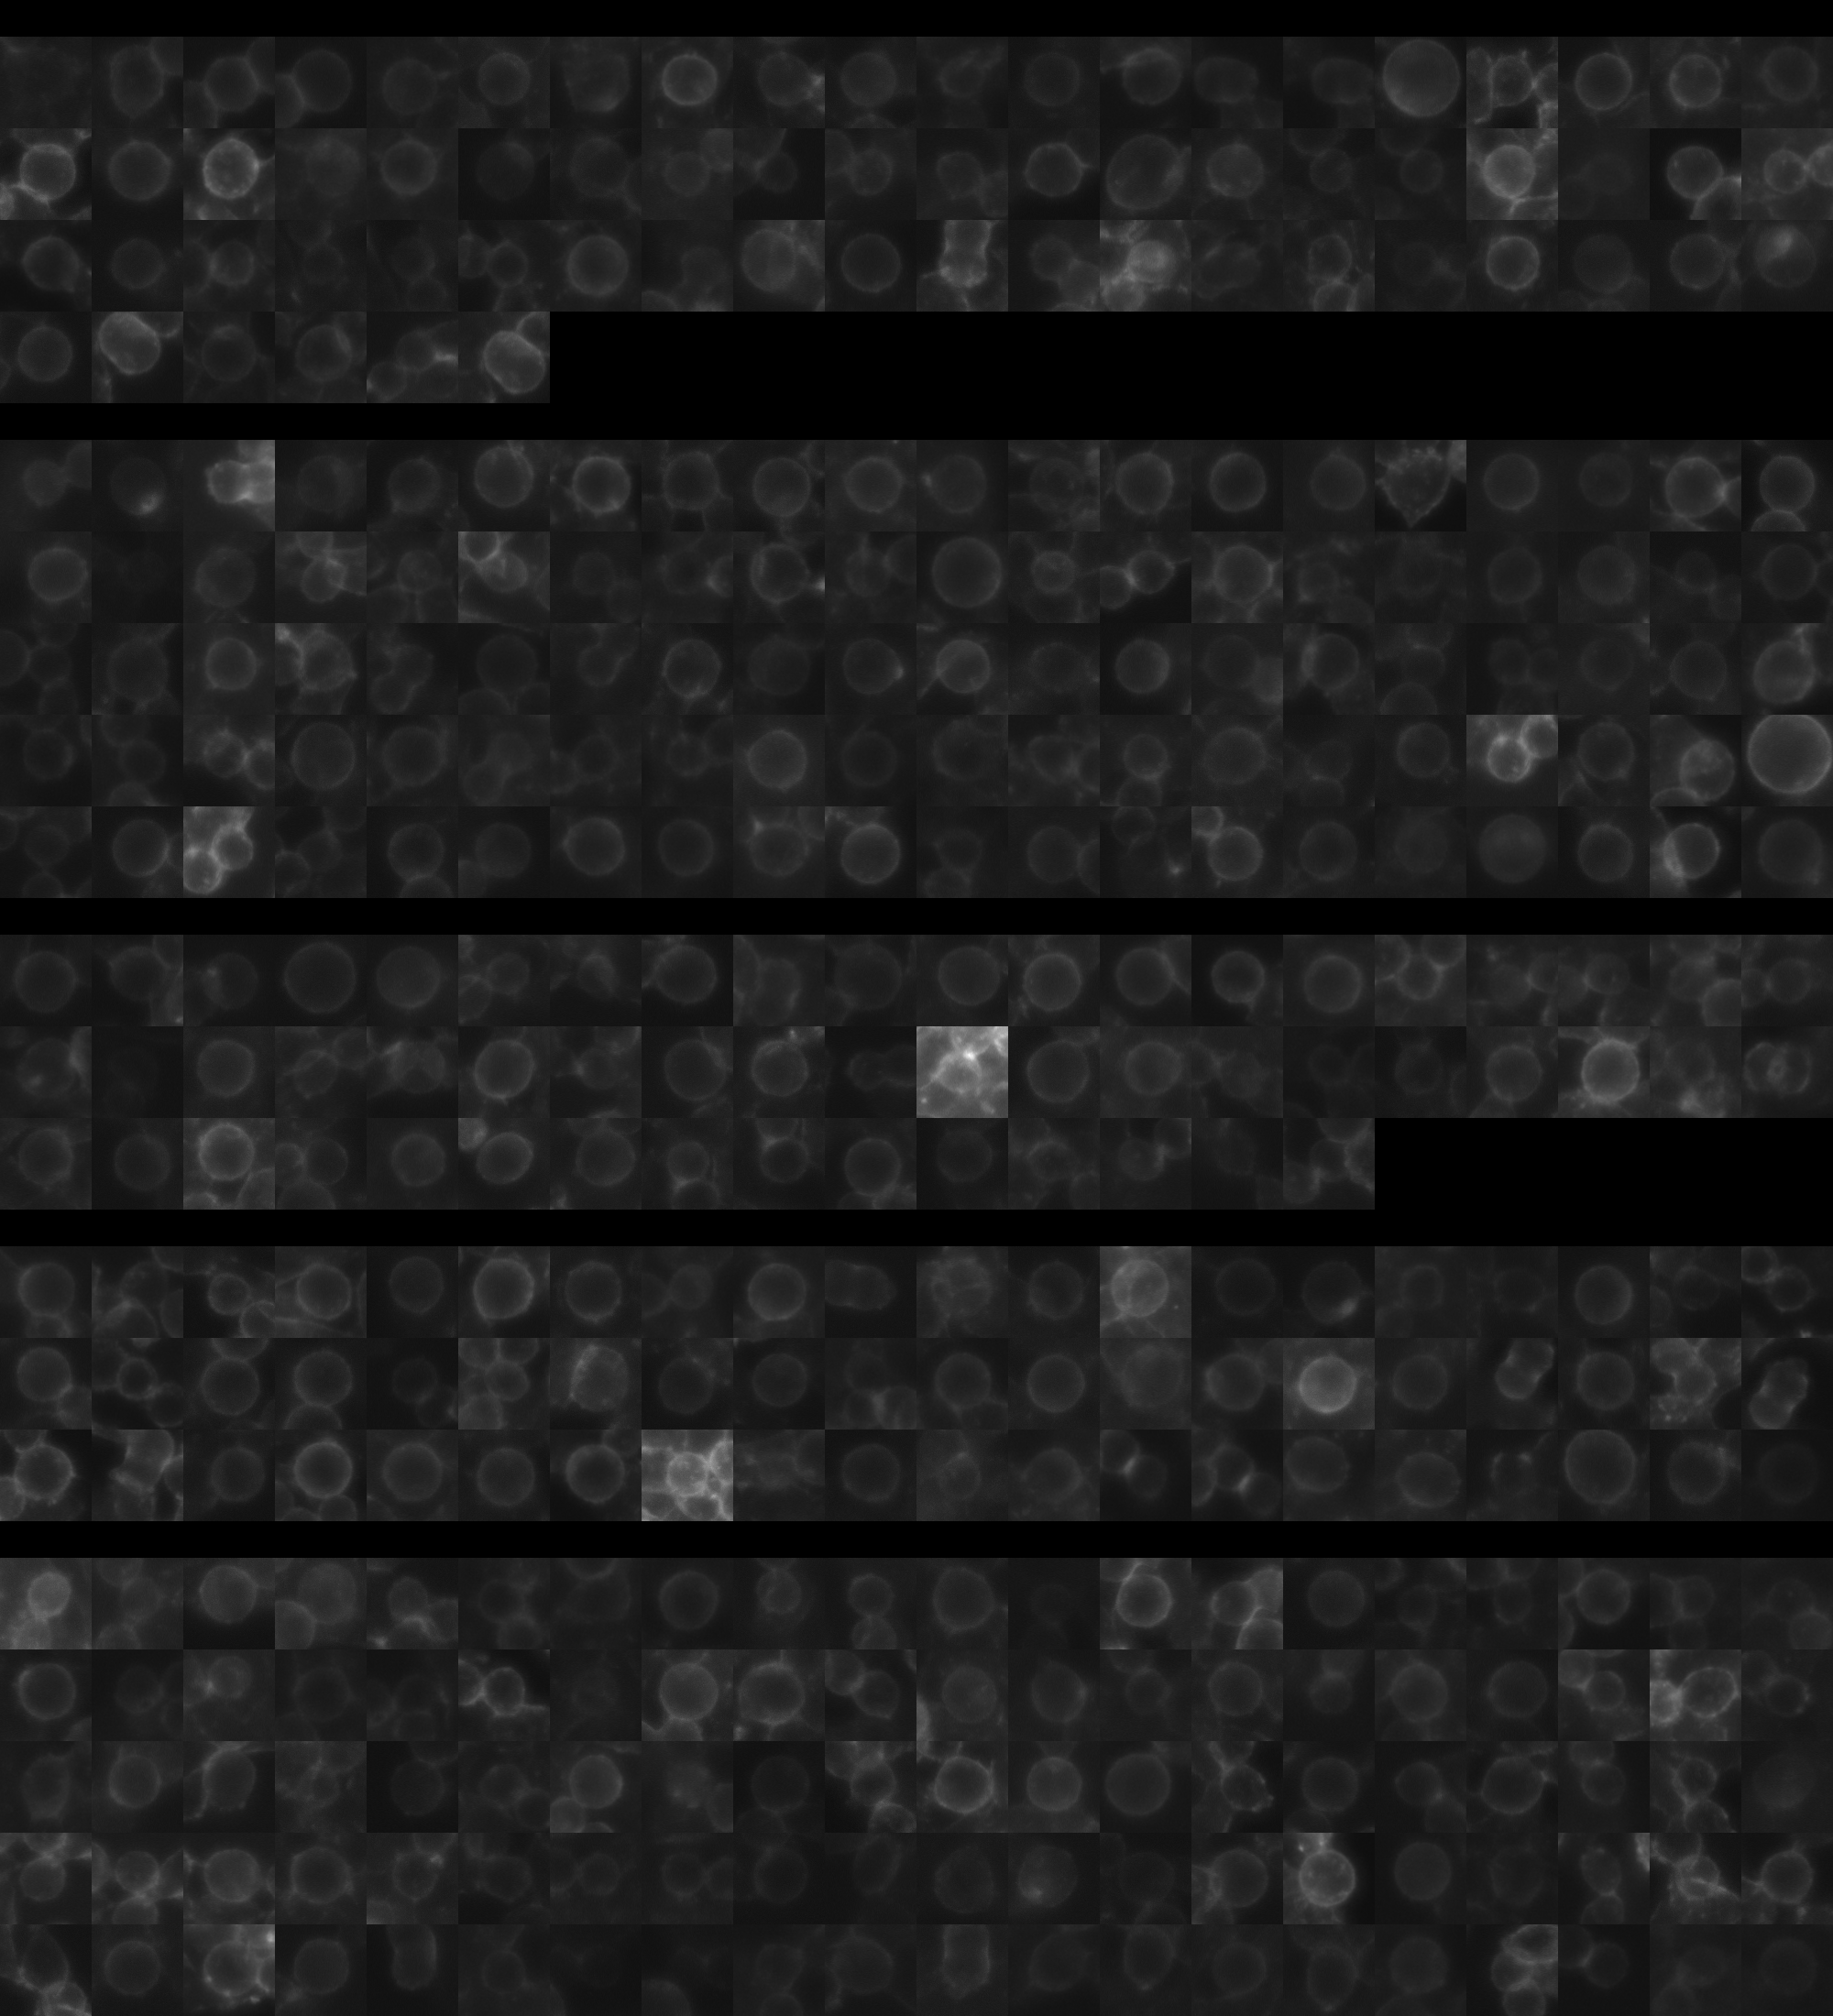
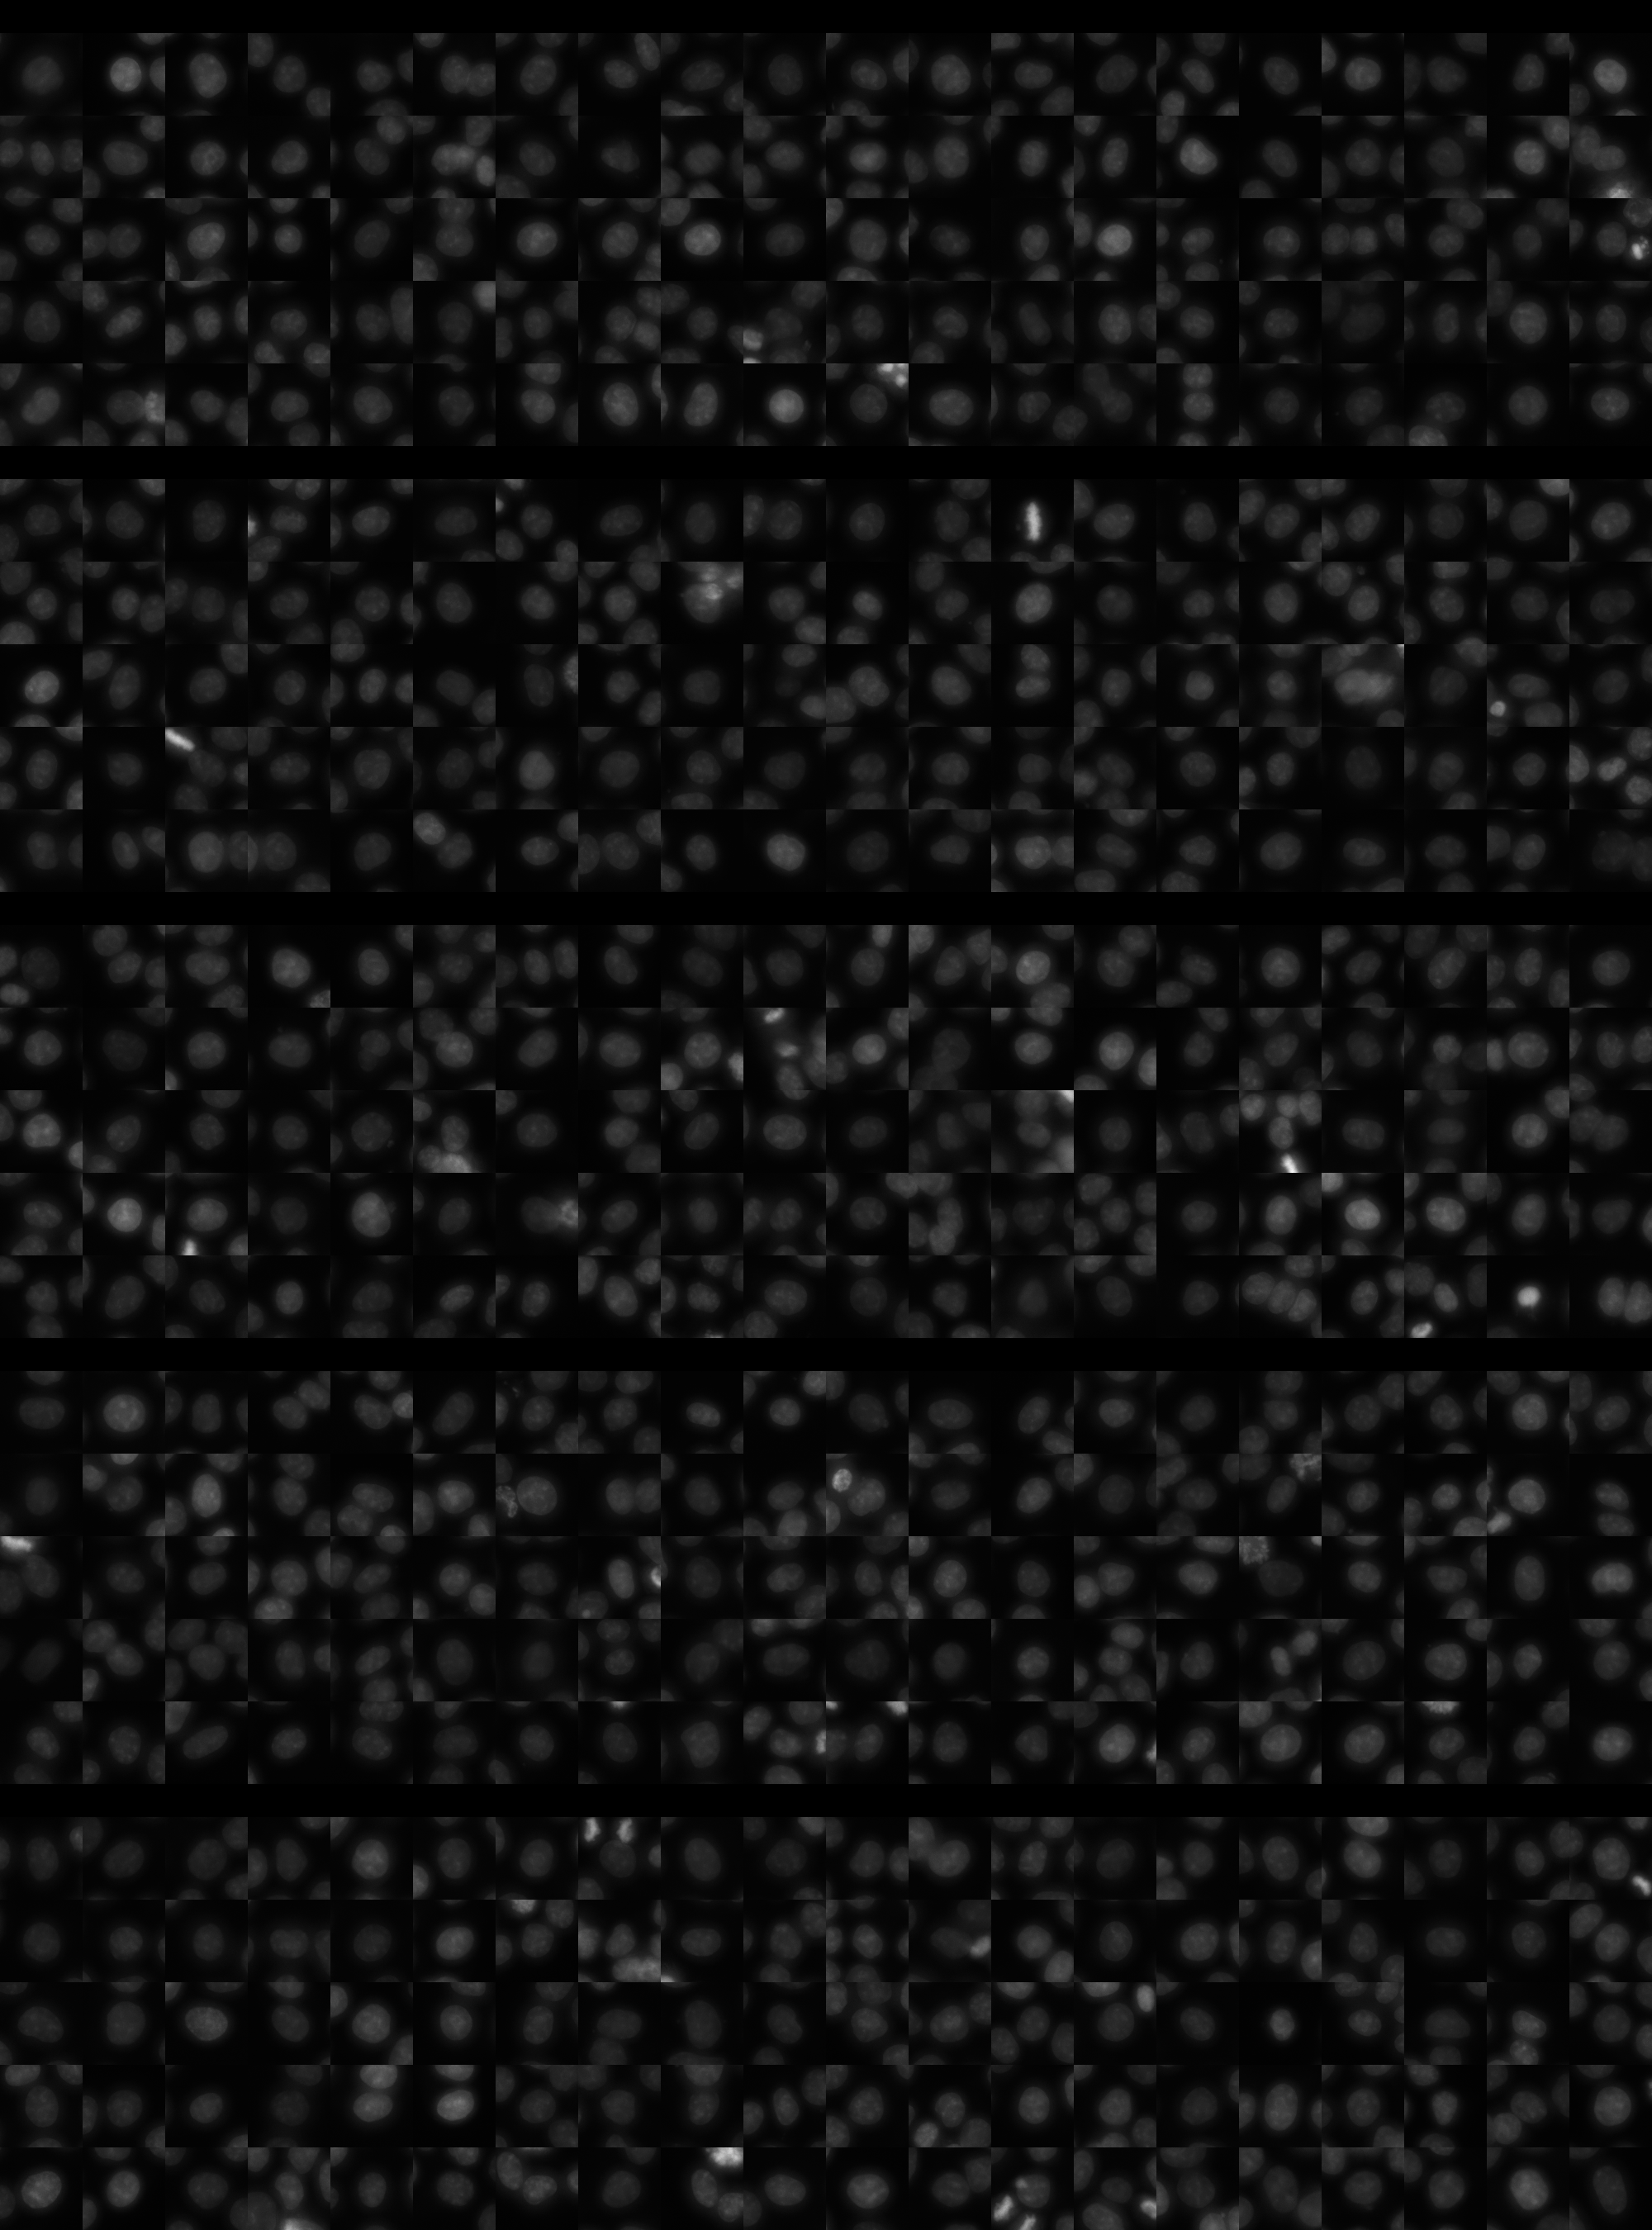
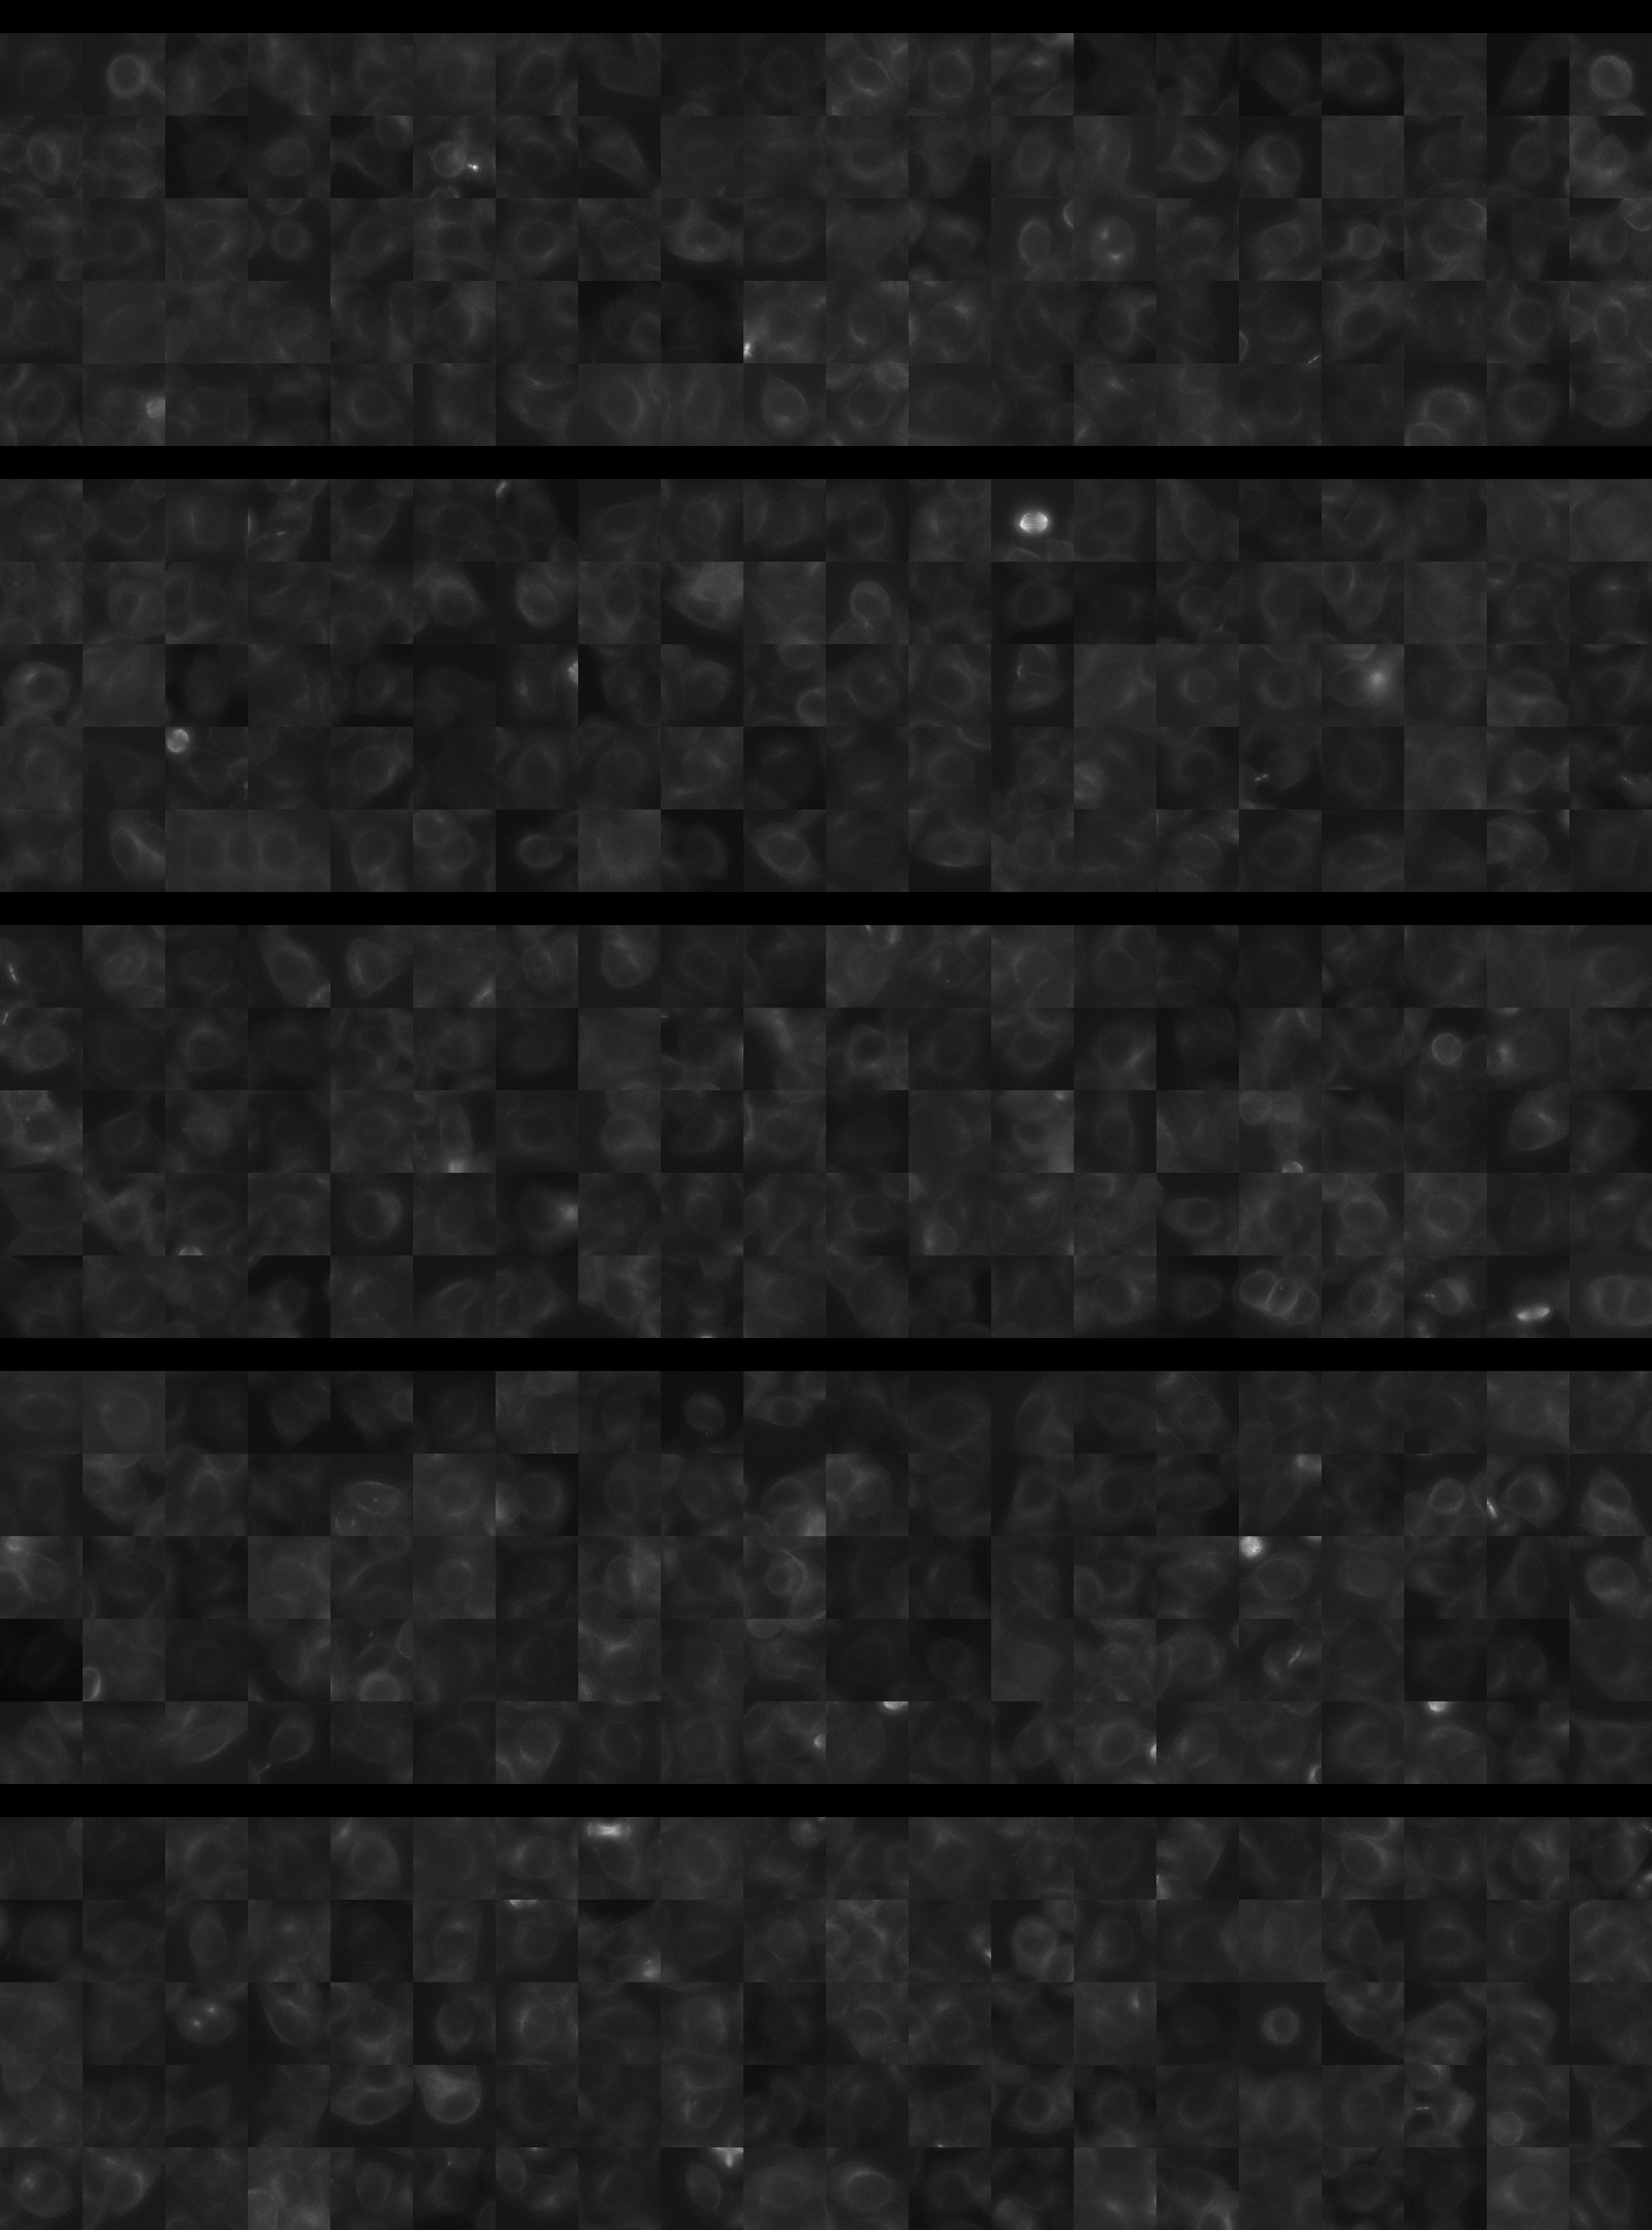
Each montage below shows randomly selected individual cell images for the same target gene separated by sgRNA, along with an example montage of cells expressing a non-targeting negative control sgRNA at the bottom. sgRNA labels in the montages correspond to the numbered sgRNA sequences in the gene info table above. The DNA (blue) and tubulin (green) channels are displayed by default, with gH2AX (grayscale) and actin (yellow) available using the check boxes. Channel brightness, contrast, and opacity are adjustable by clicking the arrow next to the channel name. When only one channel is selected, the display defaults to grayscale. Click the “Zoom” checkbox above the channel controls to enable image zooming (via scrolling) and panning (via click-and-drag).

The cell boxes displayed for this gene are square, 30.36 μm per side for the interphase montage and 30.36 μm per side for the mitotic montage.
Features

Interphase Score Rank FDR q-value
Nucleus DNA Integrated 0.030 1673 of 5322 0.670
Nucleus DNA Mean 0.111 461 of 5322 0.001
Nucleus gH2AX Mean -3.952e-03 4658 of 5322 0.885
Nucleus DNA - gH2AX Correlation 0.044 386 of 5322 0.151
Nucleus Shape Area -8.853e-02 4783 of 5322 0.014
Nucleus Shape Eccentricity 6.288e-04 3321 of 5322 0.959
Nucleus Shape Form Factor -5.143e-02 2757 of 5322 0.156
Nucleus Shape Solidity -6.927e-02 3473 of 5322 0.023
Cell DNA Mass Displacement 0.029 2379 of 5322 0.610
Cell Tubulin Mean -1.367e-01 5047 of 5322 2.141e-04
Cell Tubulin Mass Displacement -3.828e-02 4603 of 5322 0.359
Cell Actin Mean -2.644e-02 3817 of 5322 0.649
Cell Tubulin - Actin Correlation -2.063e-02 4502 of 5322 0.649
Cell DNA - Tubulin Correlation -5.124e-02 4961 of 5322 0.111
Cell Shape Area -1.472e-02 3651 of 5322 0.701
Cell Shape Eccentricity 0.009 2979 of 5322 0.918
Mitotic Score Rank FDR q-value
Nucleus DNA Integrated 0.037 3437 of 5322 0.995
Nucleus DNA Mean 0.069 1896 of 5322 1.000
Nucleus DNA Mass Displacement -1.217e-01 4857 of 5322 0.999
Nucleus DNA Mean Frac 3 -8.074e-02 4232 of 5322 1.000
Nucleus gH2AX Mean 0.027 2559 of 5322 1.000
Nucleus gH2AX Mean Frac 0 0.146 606 of 5322 1.000
Nucleus Tubulin Mean Frac 0 0.201 849 of 5322 0.999
Nucleus Tubulin Mean Edge -2.764e-02 3548 of 5322 0.999
Nucleus Tubulin Std Edge -8.872e-02 3759 of 5322 0.999
Nucleus Shape Area 0.082 2903 of 5322 0.990
Nucleus Shape Eccentricity 0.182 293 of 5322 1.000
Nucleus Shape Form Factor 5.711e-04 1365 of 5322 0.998
Cell Tubulin Mean 0.032 3049 of 5322 0.997
Cell Tubulin Mean Frac 3 -8.983e-02 2797 of 5322 0.999
Cell Actin Mean -1.696e-02 3434 of 5322 0.998
Cell Shape Area 0.020 3649 of 5322 0.999
( Reset Zoom )
Brightness
Contrast
Opacity
Brightness
Contrast
Opacity
Brightness
Contrast
Opacity
Brightness
Contrast
Opacity
Brightness
Contrast
Opacity

( Reset Zoom )
Brightness
Contrast
Opacity
Brightness
Contrast
Opacity
Brightness
Contrast
Opacity
Brightness
Contrast
Opacity
Brightness
Contrast
Opacity

MIT Central Accessability