SMARCA4

Gene symbol: SMARCA4
Gene: 6597
Uniprot Function: Involved in transcriptional activation and repression of select genes by chromatin remodeling (alteration of DNA-nucleosome topology). Component of SWI/SNF chromatin remodeling complexes that carry out key enzymatic activities, changing chromatin structure by altering DNA-histone contacts within a nucleosome in an ATP-dependent manner. Component of the CREST-BRG1 complex, a multiprotein complex that regulates promoter activation by orchestrating the calcium-dependent release of a repressor complex and the recruitment of an activator complex. In resting neurons, transcription of the c-FOS promoter is inhibited by SMARCA4-dependent recruitment of a phospho-RB1-HDAC repressor complex. Upon calcium influx, RB1 is dephosphorylated by calcineurin, which leads to release of the repressor complex. At the same time, there is increased recruitment of CREBBP to the promoter by a CREST-dependent mechanism, which leads to transcriptional activation. The CREST-BRG1 complex also binds to the NR2B promoter, and activity-dependent induction of NR2B expression involves the release of HDAC1 and recruitment of CREBBP. Belongs to the neural progenitors-specific chromatin remodeling complex (npBAF complex) and the neuron-specific chromatin remodeling complex (nBAF complex). During neural development, a switch from a stem/progenitor to a postmitotic chromatin remodeling mechanism occurs as neurons exit the cell cycle and become committed to their adult state. The transition from proliferating neural stem/progenitor cells to postmitotic neurons requires a switch in subunit composition of the npBAF and nBAF complexes. As neural progenitors exit mitosis and differentiate into neurons, npBAF complexes which contain ACTL6A/BAF53A and PHF10/BAF45A, are exchanged for homologous alternative ACTL6B/BAF53B and DPF1/BAF45B or DPF3/BAF45C subunits in neuron-specific complexes (nBAF). The npBAF complex is essential for the self-renewal/proliferative capacity of the multipotent neural stem cells. The nBAF complex along with CREST plays a role regulating the activity of genes essential for dendrite growth. SMARCA4/BAF190A may promote neural stem cell self-renewal/proliferation by enhancing Notch-dependent proliferative signals, while concurrently making the neural stem cell insensitive to SHH-dependent differentiating cues (By similarity). Acts as a corepressor of ZEB1 to regulate E-cadherin transcription and is required for induction of epithelial-mesenchymal transition (EMT) by ZEB1. Binds via DLX1 to enhancers located in the intergenic region between DLX5 and DLX6 and this binding is stabilized by the long non-coding RNA (lncRNA) Evf2 (By similarity). Binds to RNA in a promiscuous manner (By similarity). Binding to RNAs including lncRNA Evf2 leads to inhibition of SMARCA4 ATPase and chromatin remodeling activities (By similarity).
Mitotic Index 0.0255
Interphase Cluster: #218 (7 genes)
Mitotic Cluster: #50 (30 genes)
sgRNA 1: ATGGTCCCTCTCGCAGCCCA (interphase cells: 1324, mitotic cells: 31)
sgRNA 2: GCATGCTCAGAGCCACCCAG (interphase cells: 2088, mitotic cells: 46)
sgRNA 3: GGGCGTACGAGTTTGACAAG (interphase cells: 1127, mitotic cells: 37)
sgRNA 4: TGAACACCATCATGCAGCTG (interphase cells: 2718, mitotic cells: 76)

Interphase Cluster

Mitotic Cluster

Overview

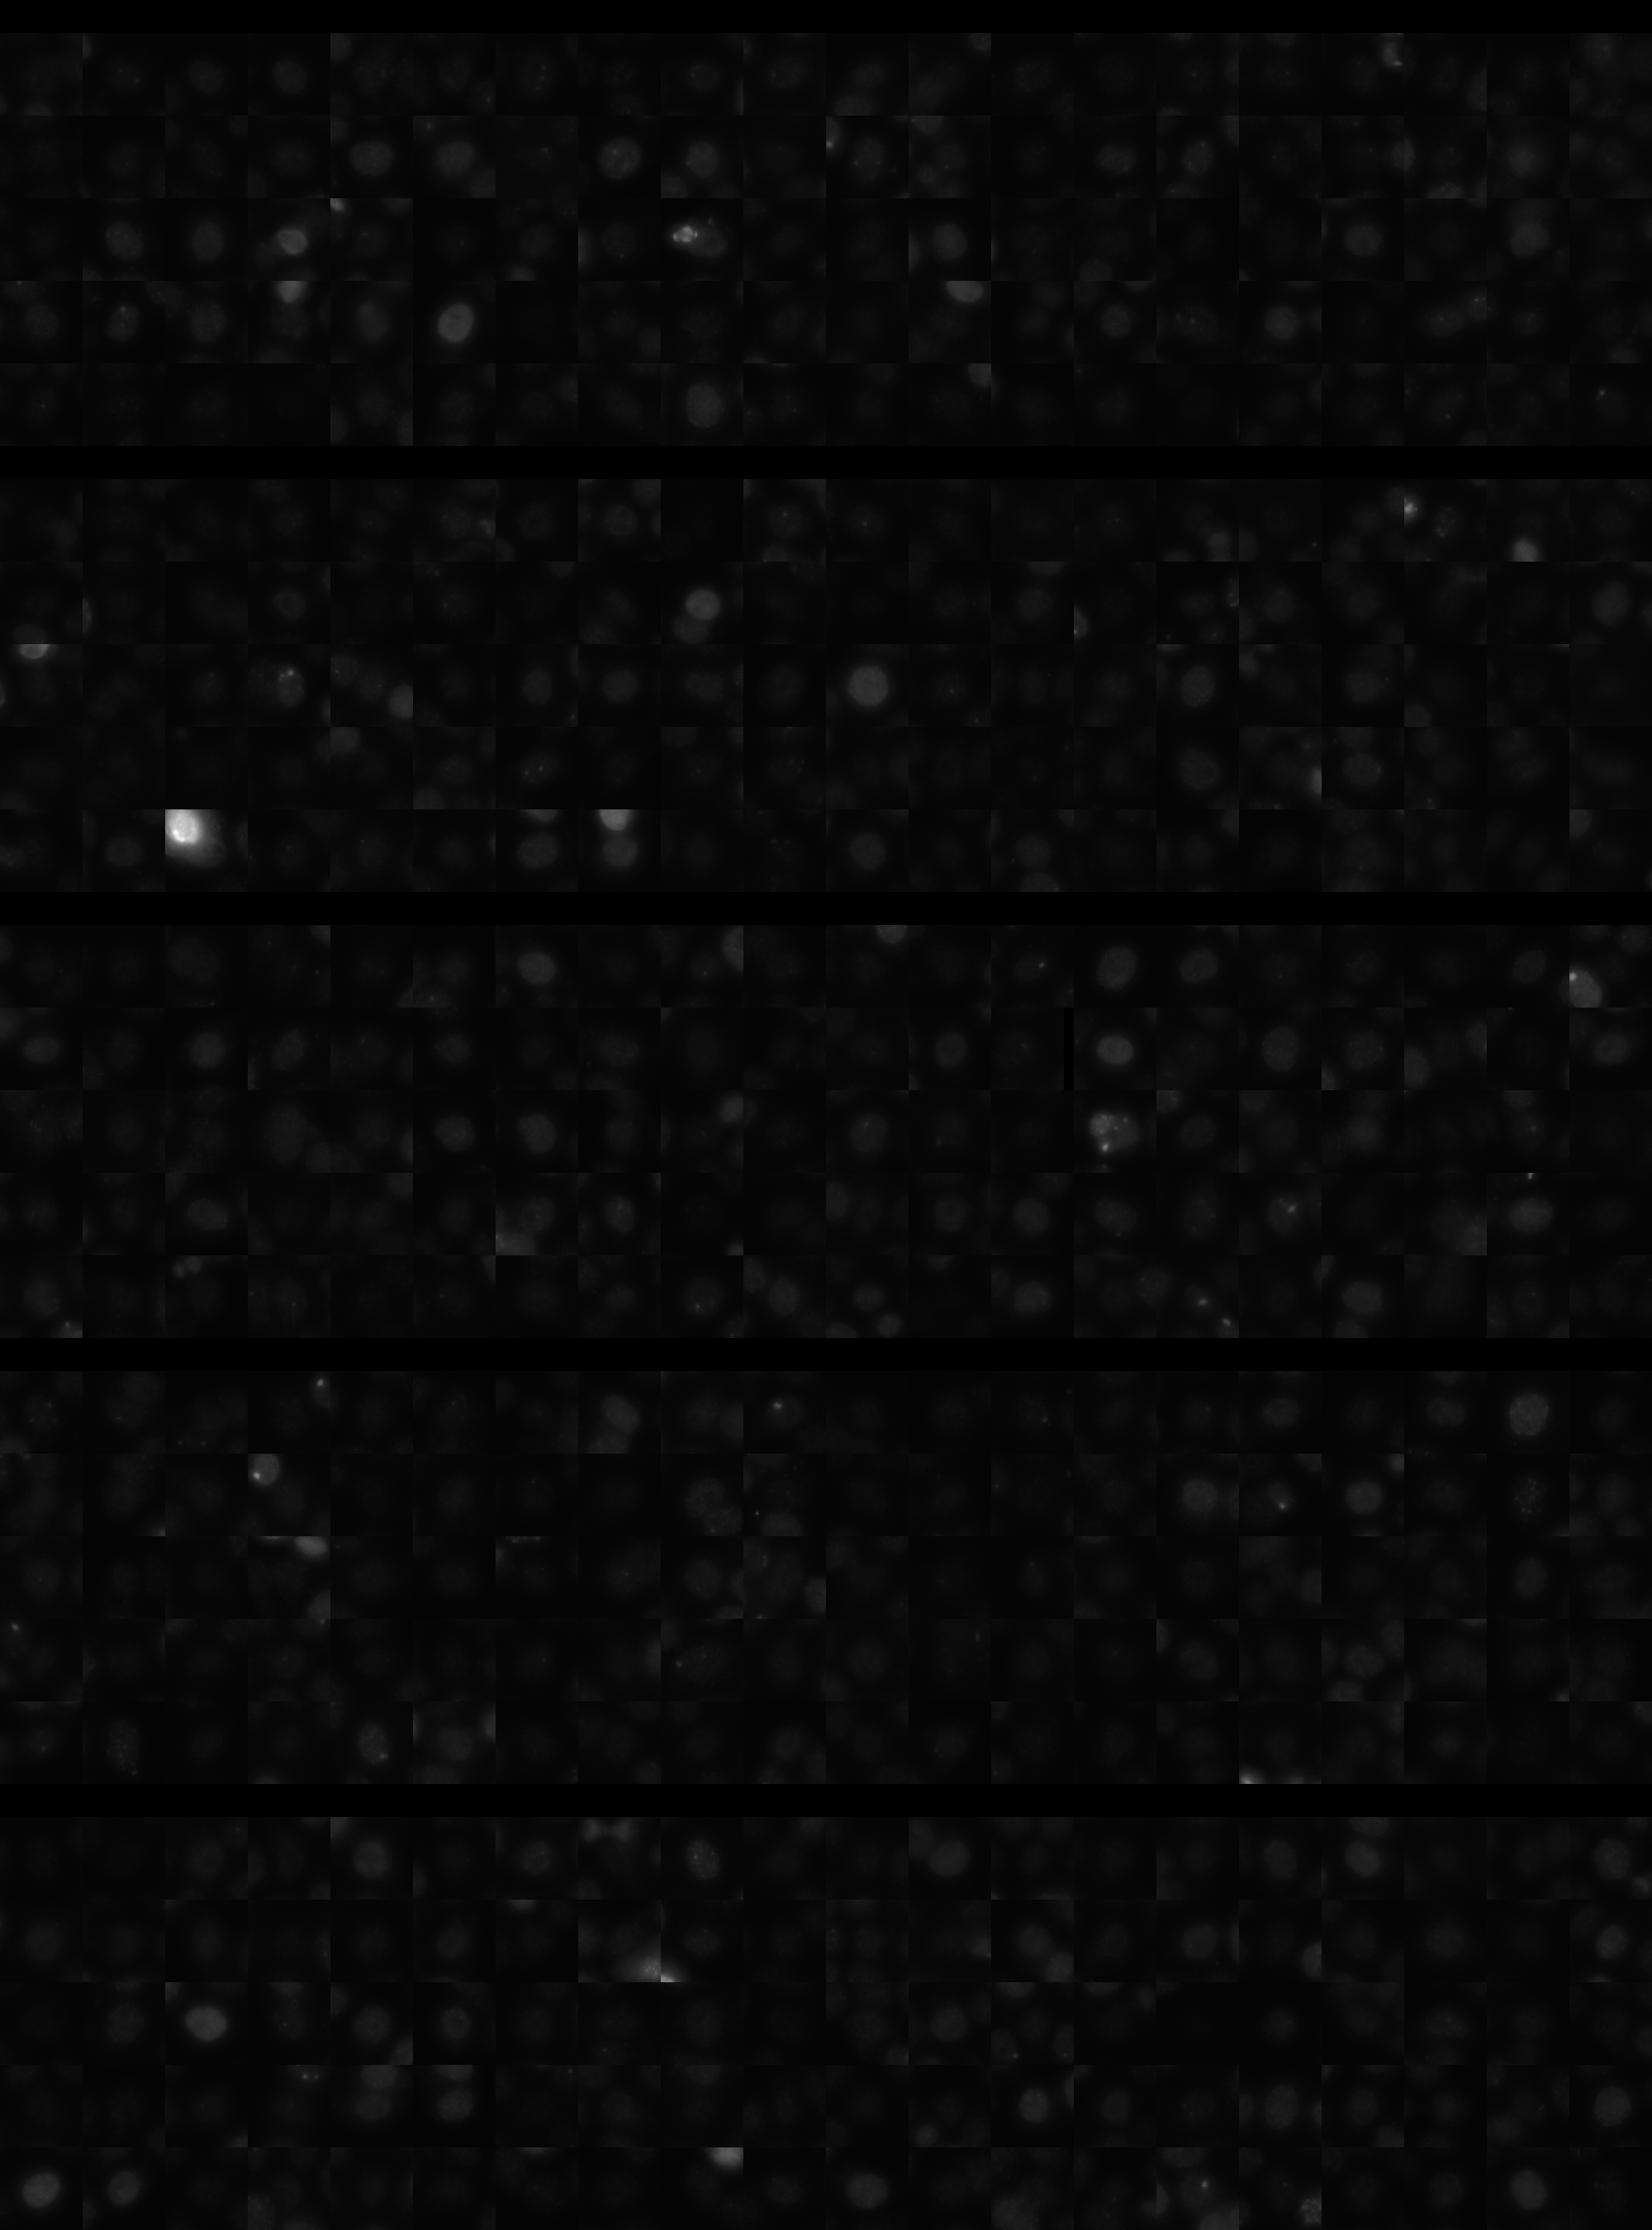
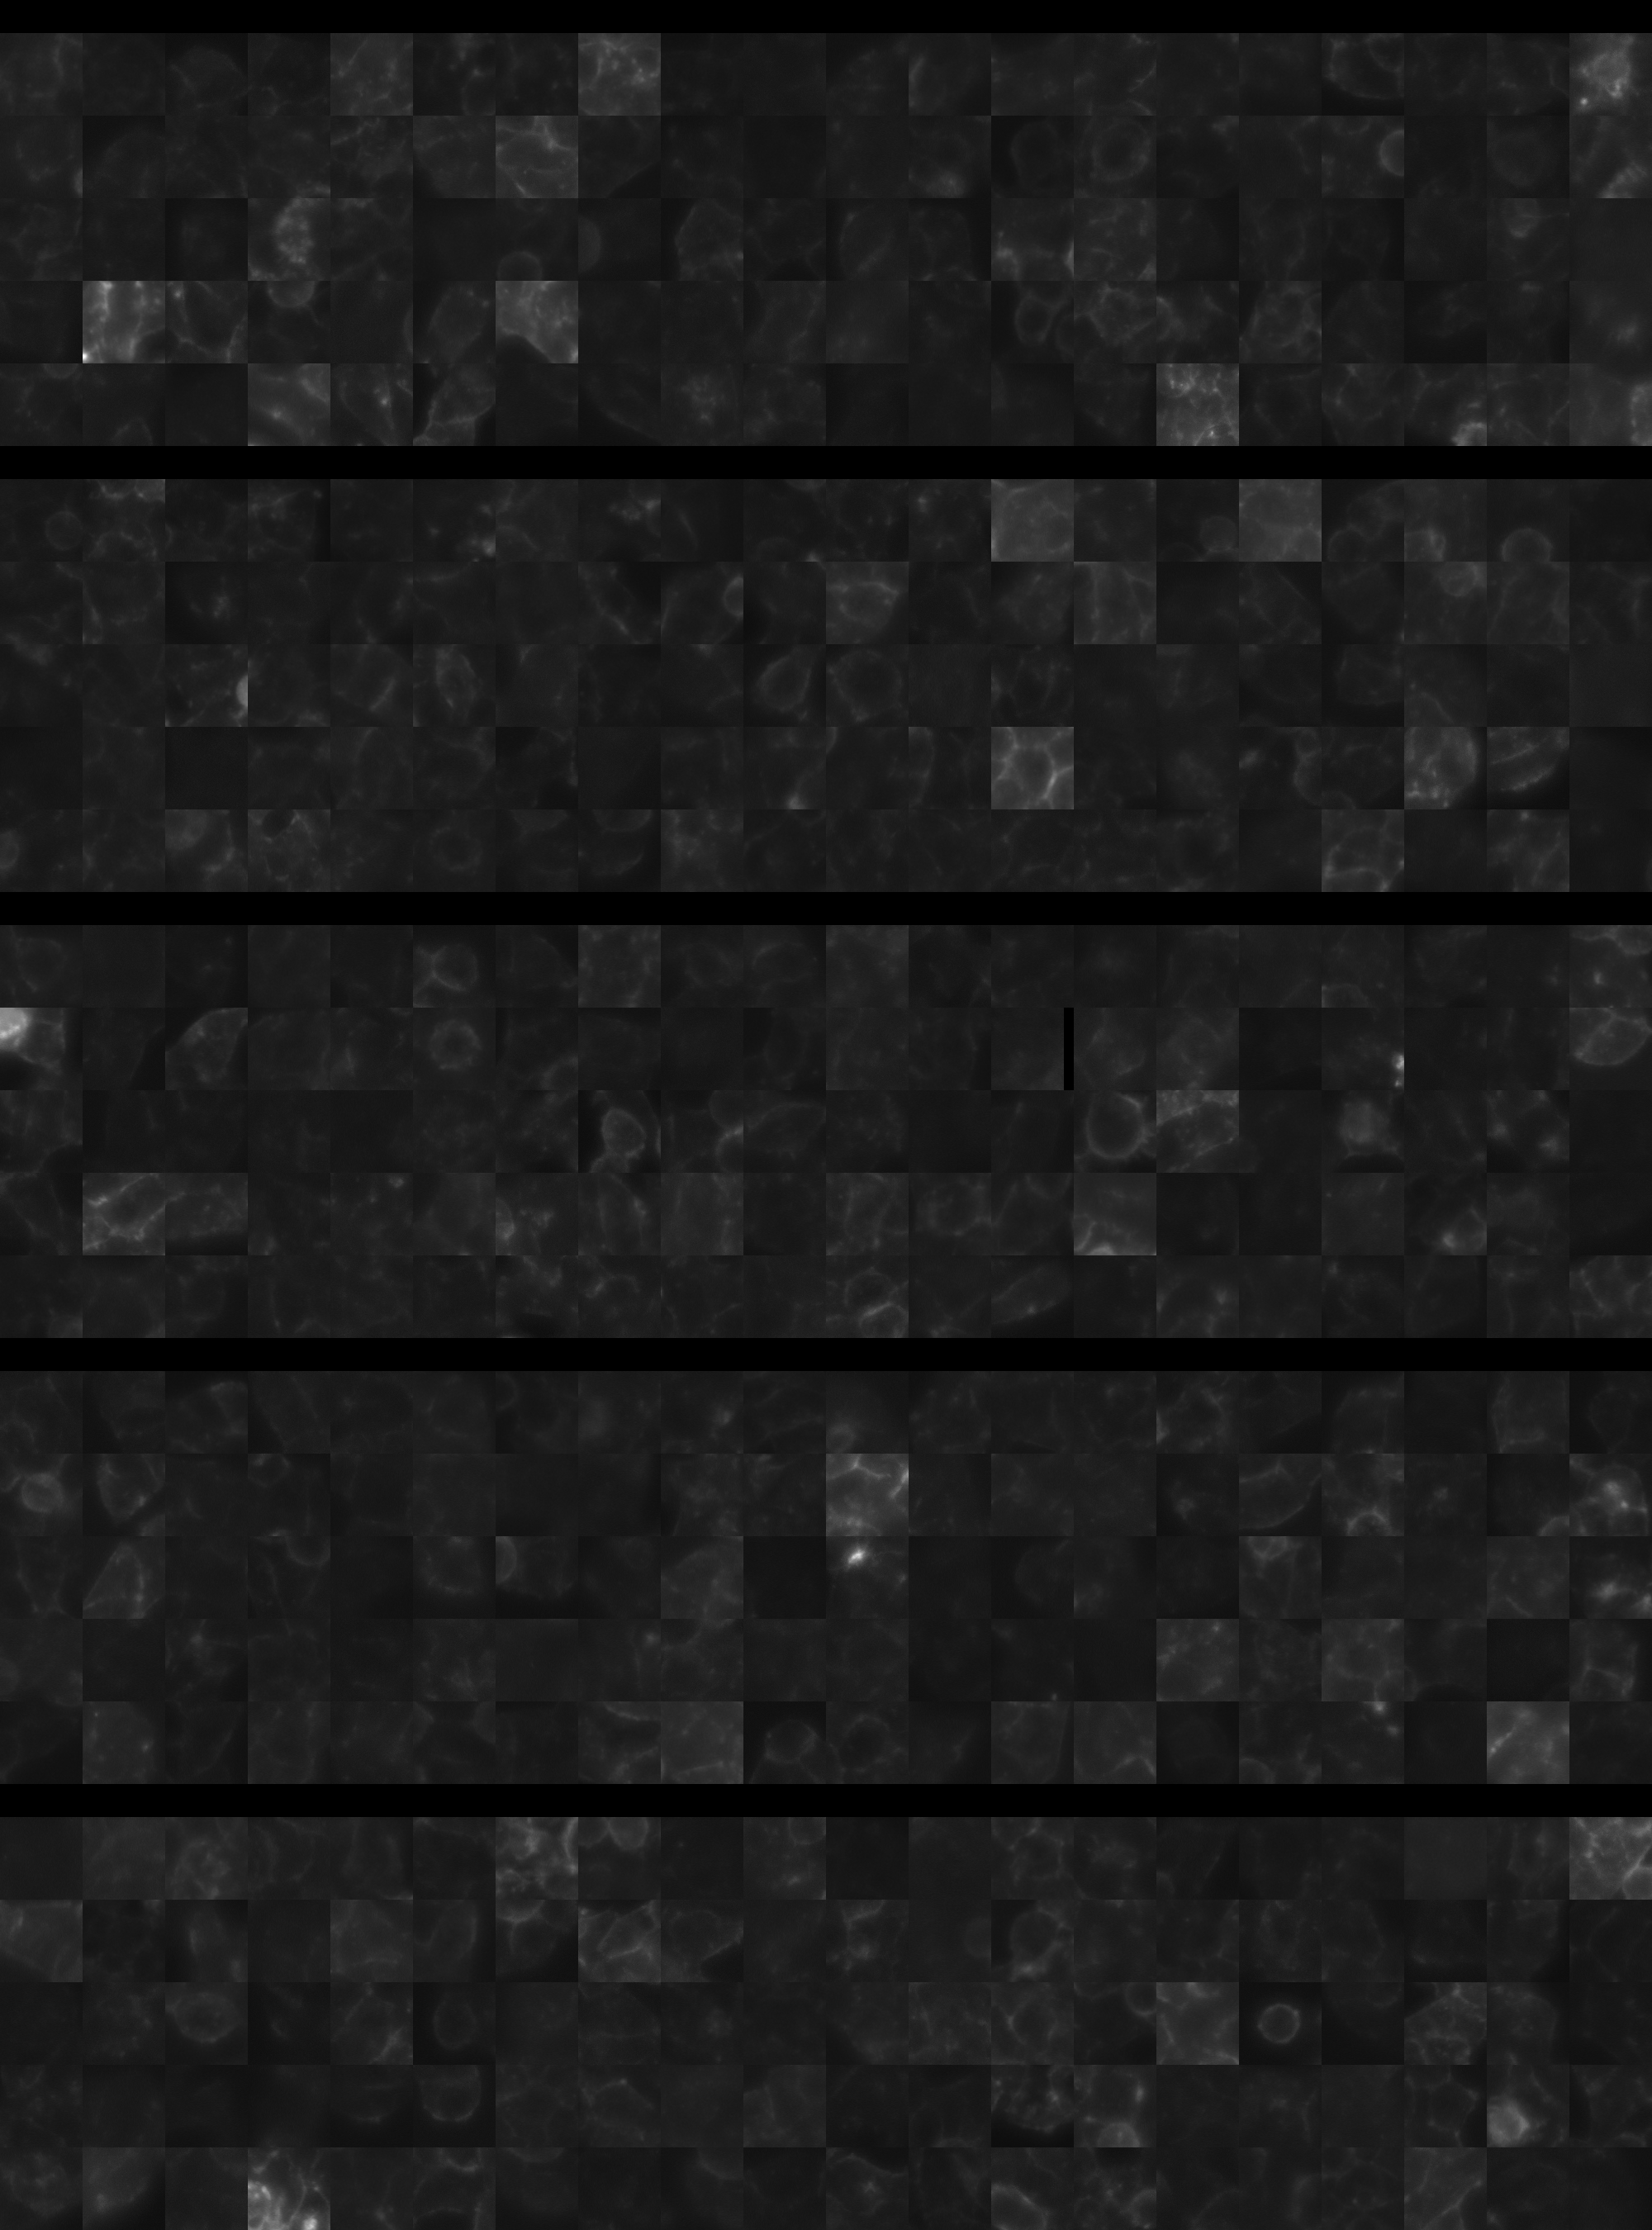
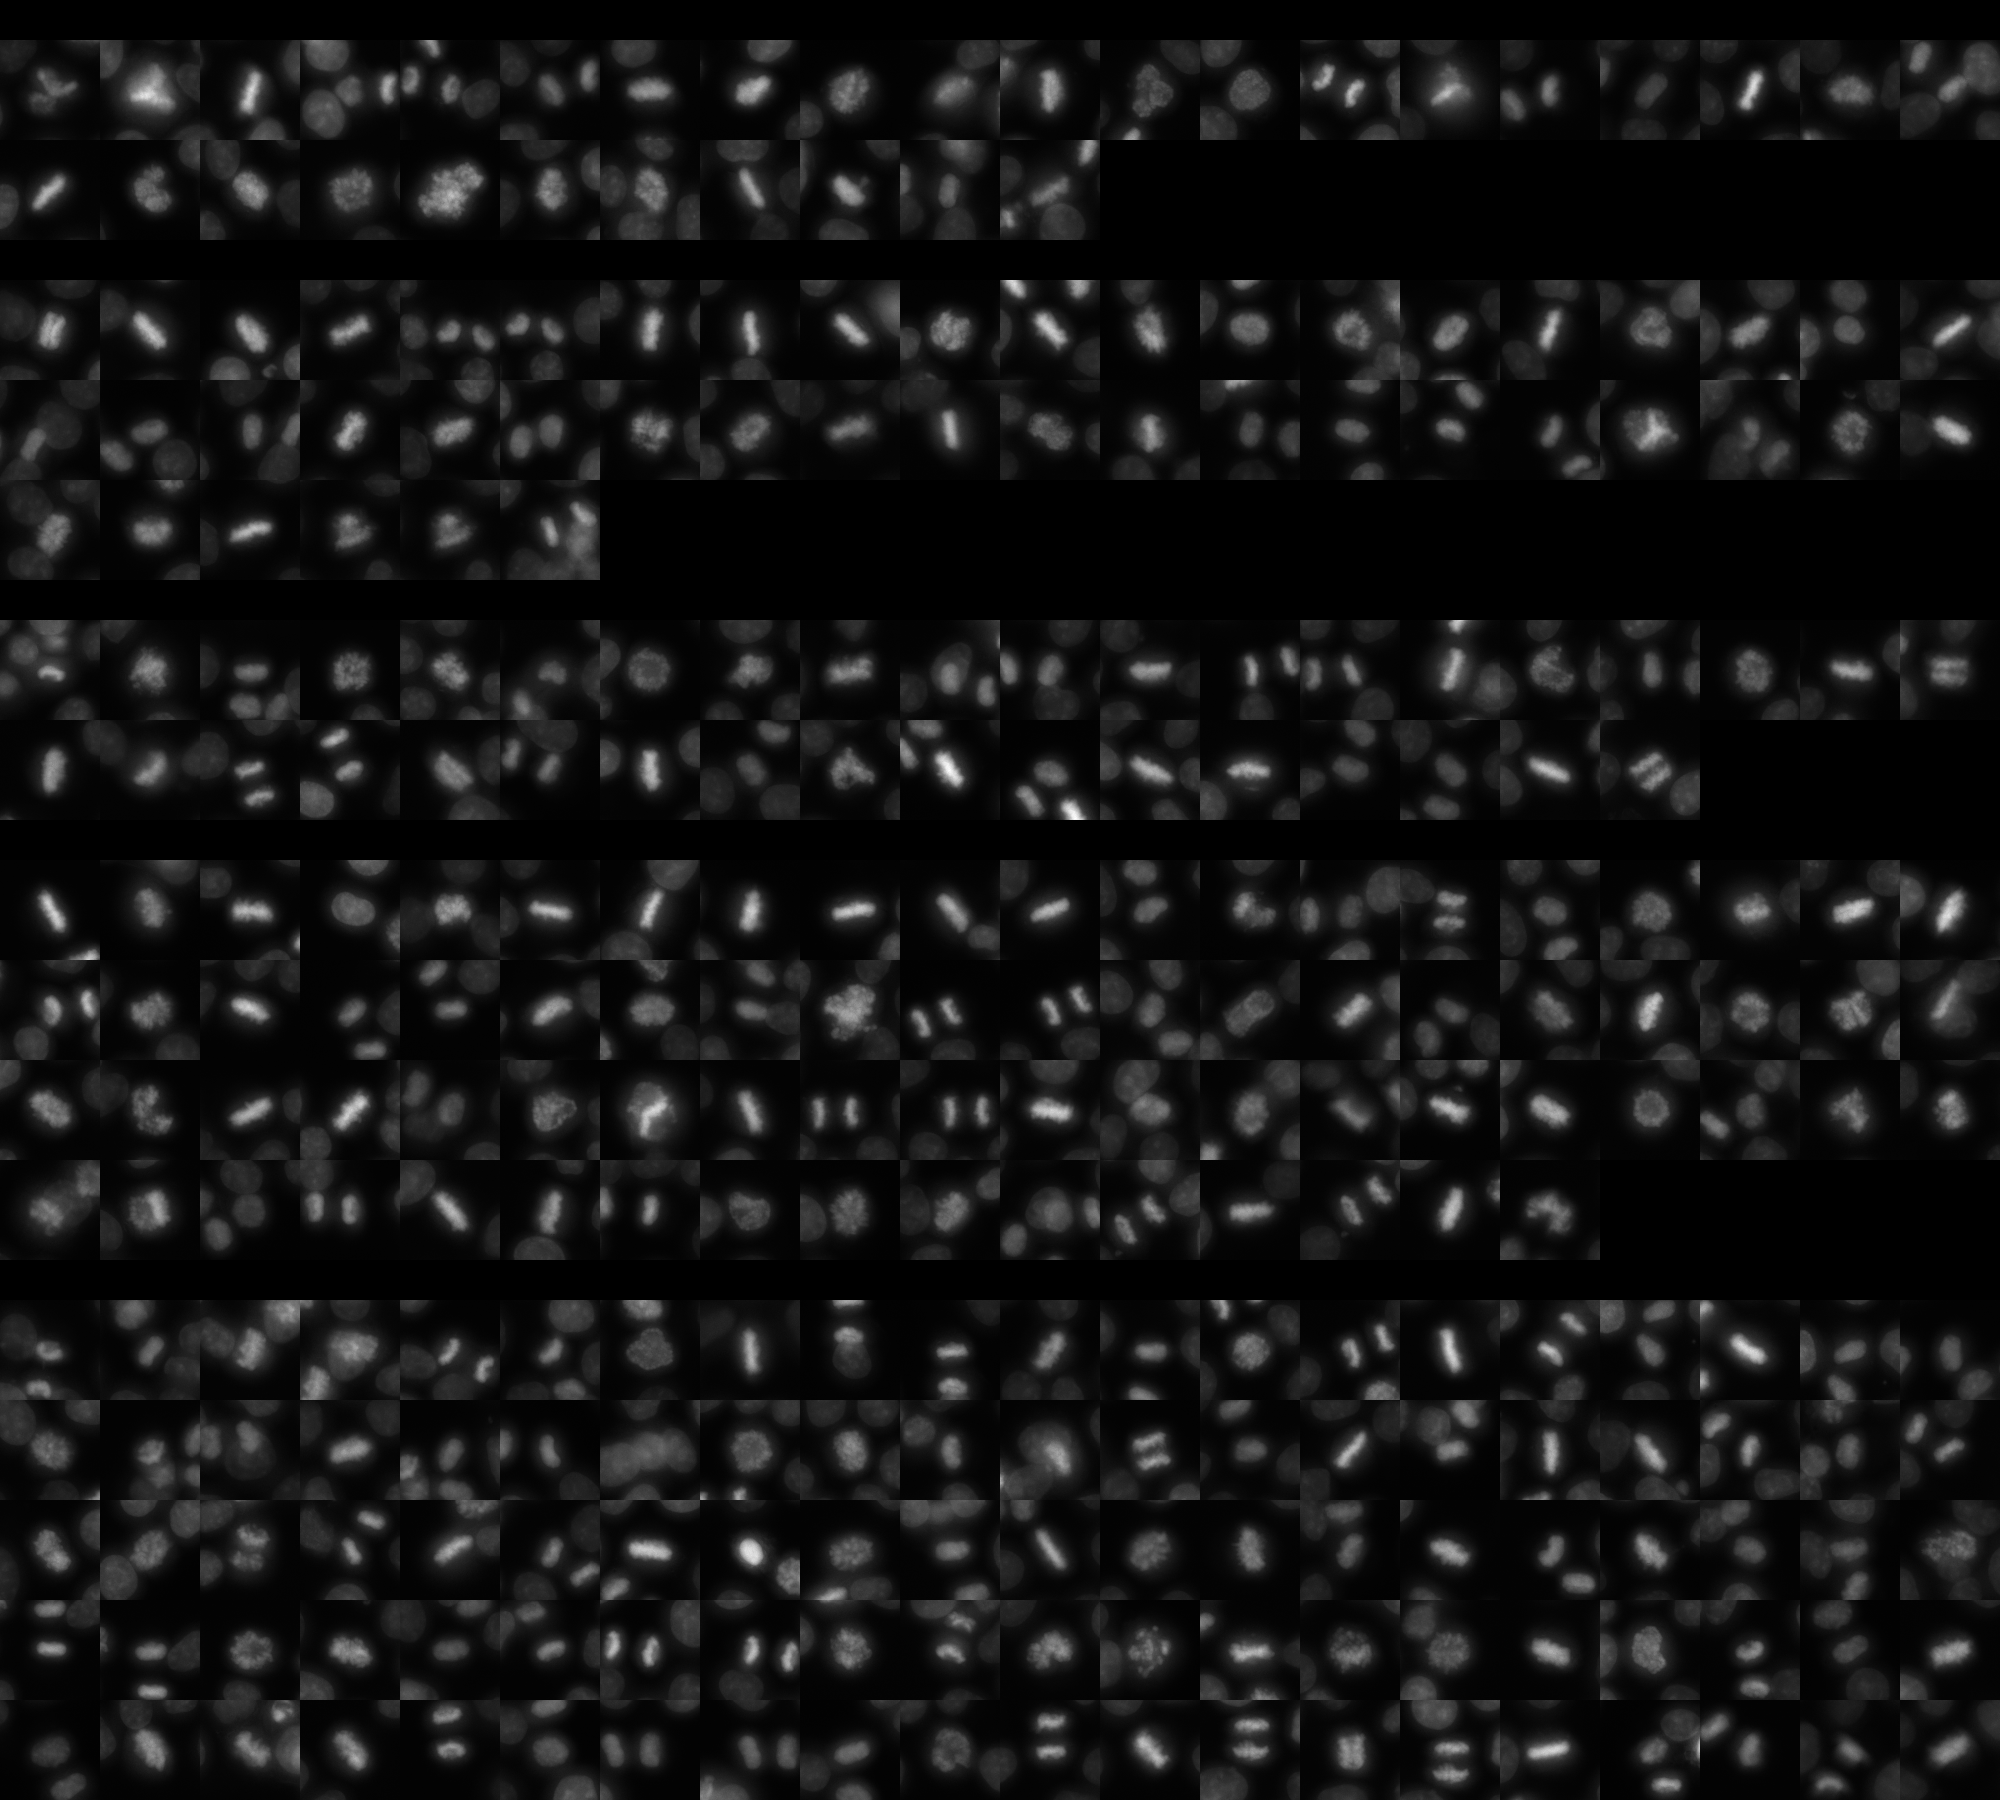
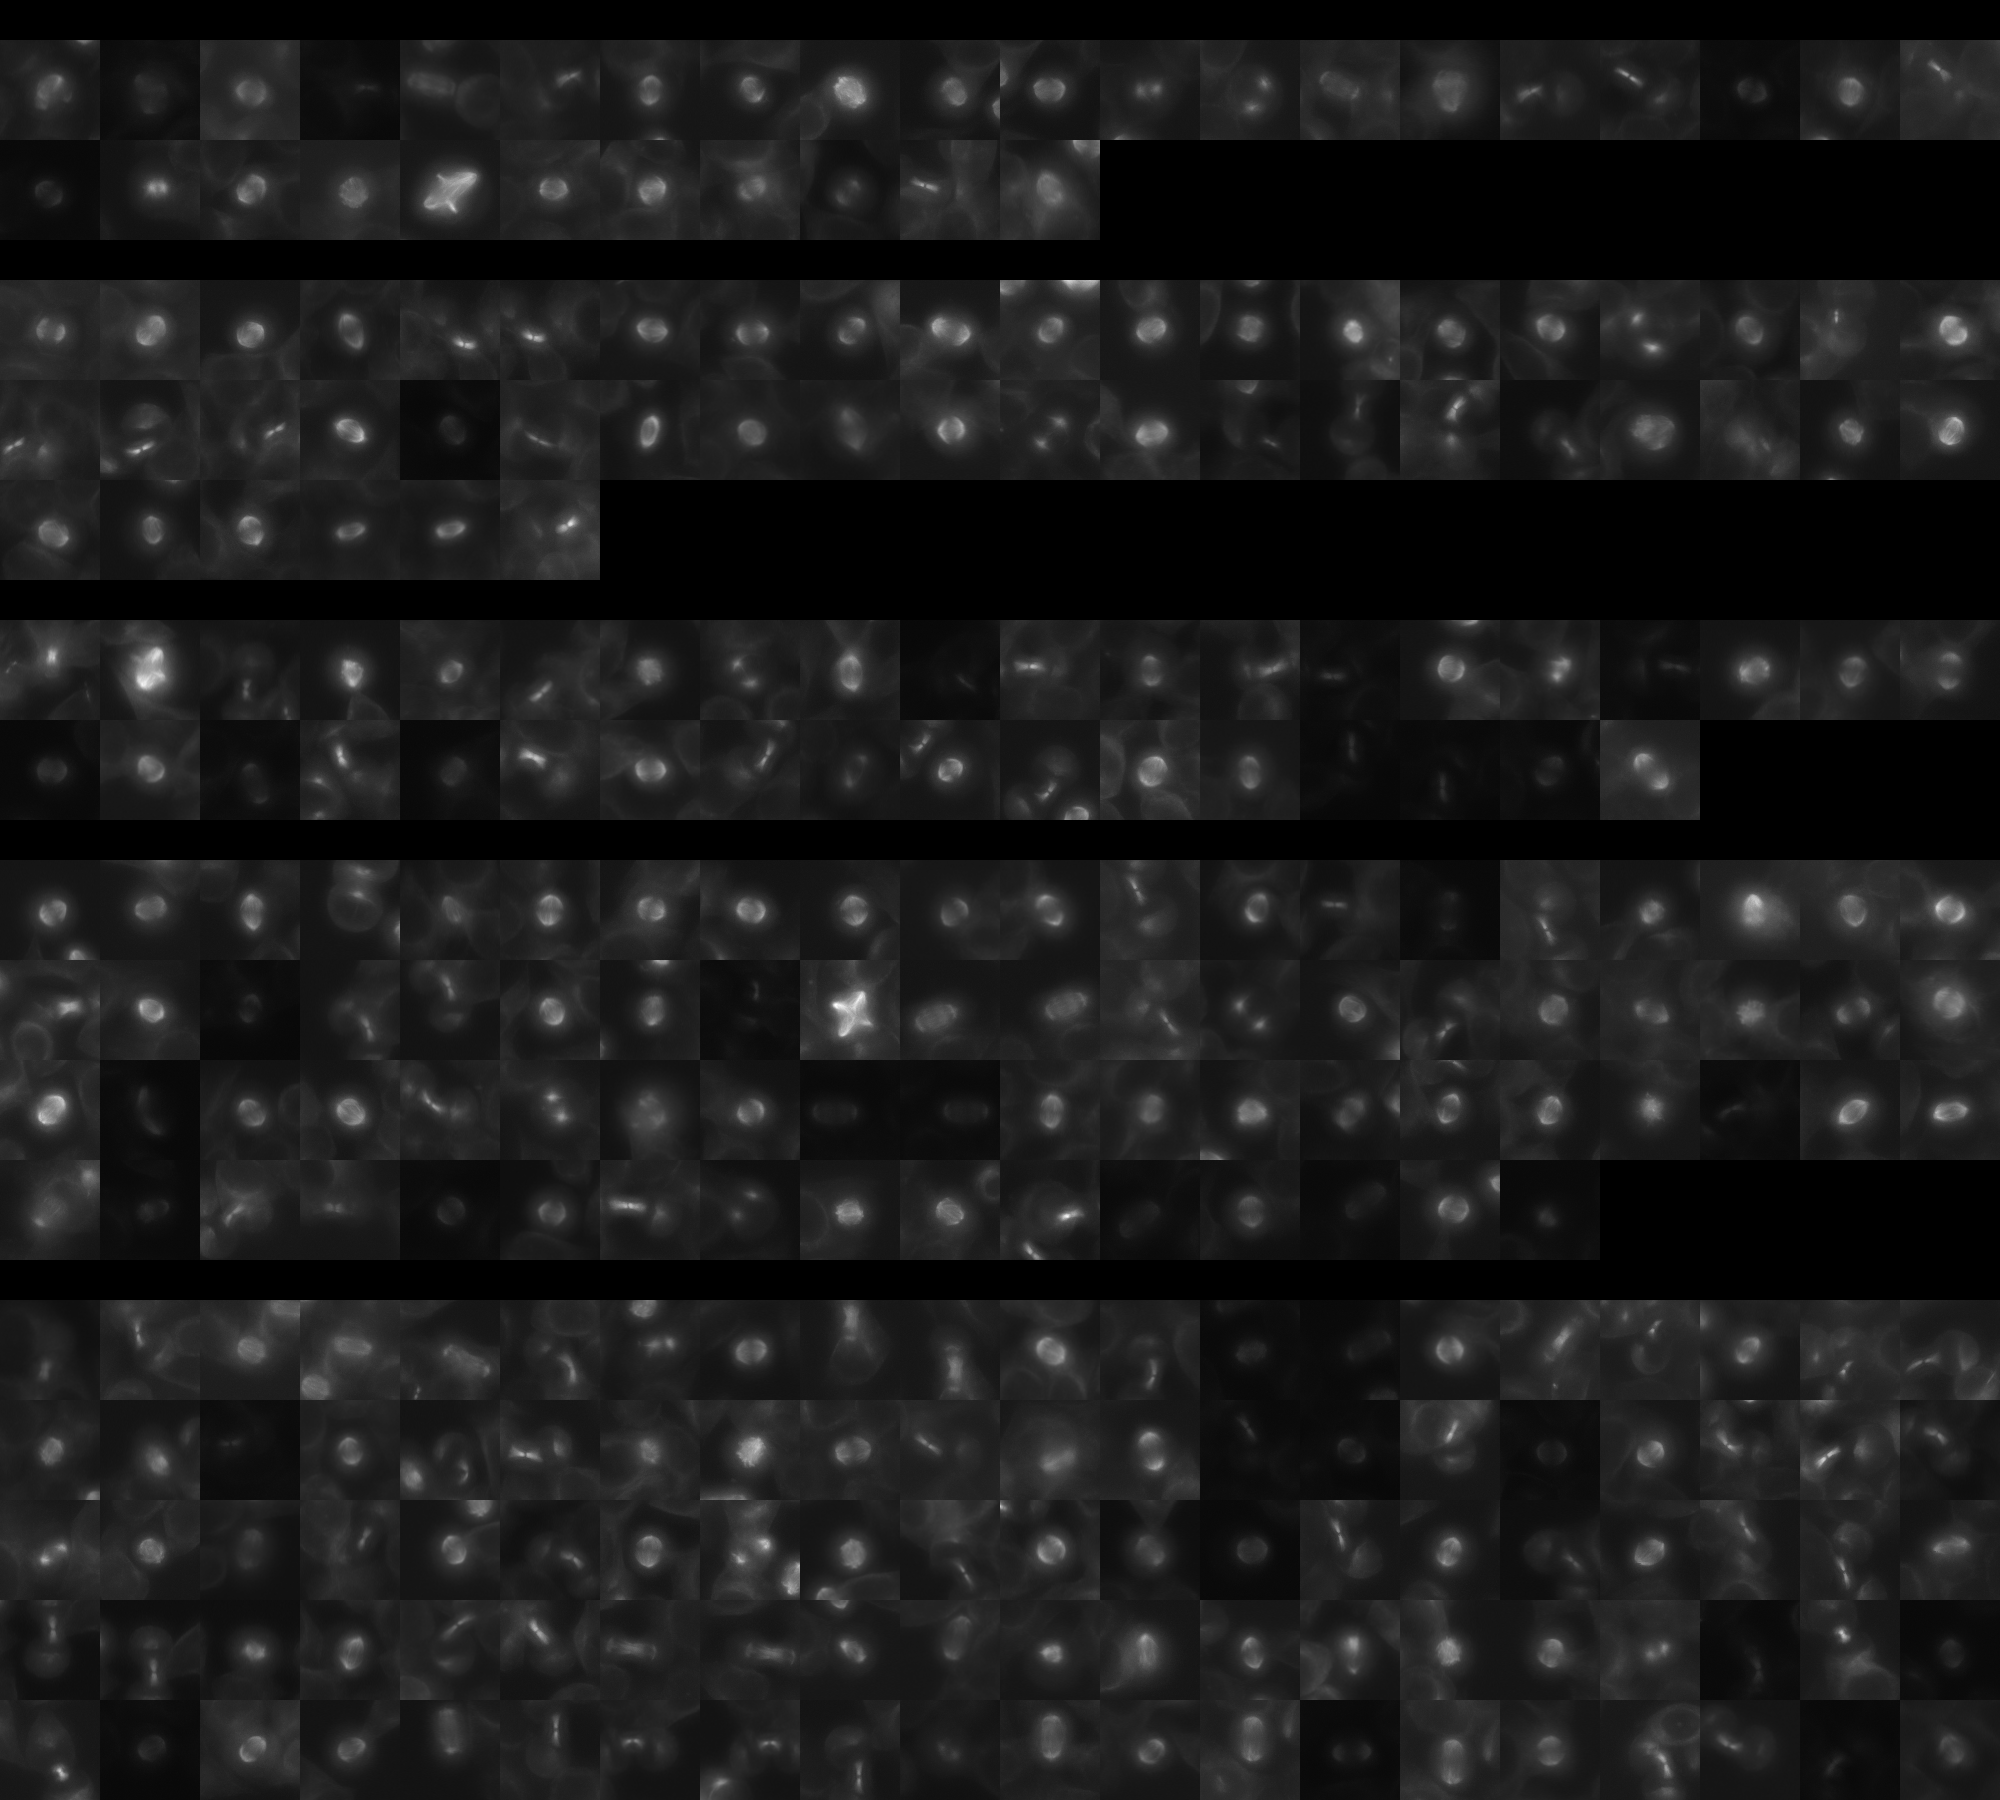
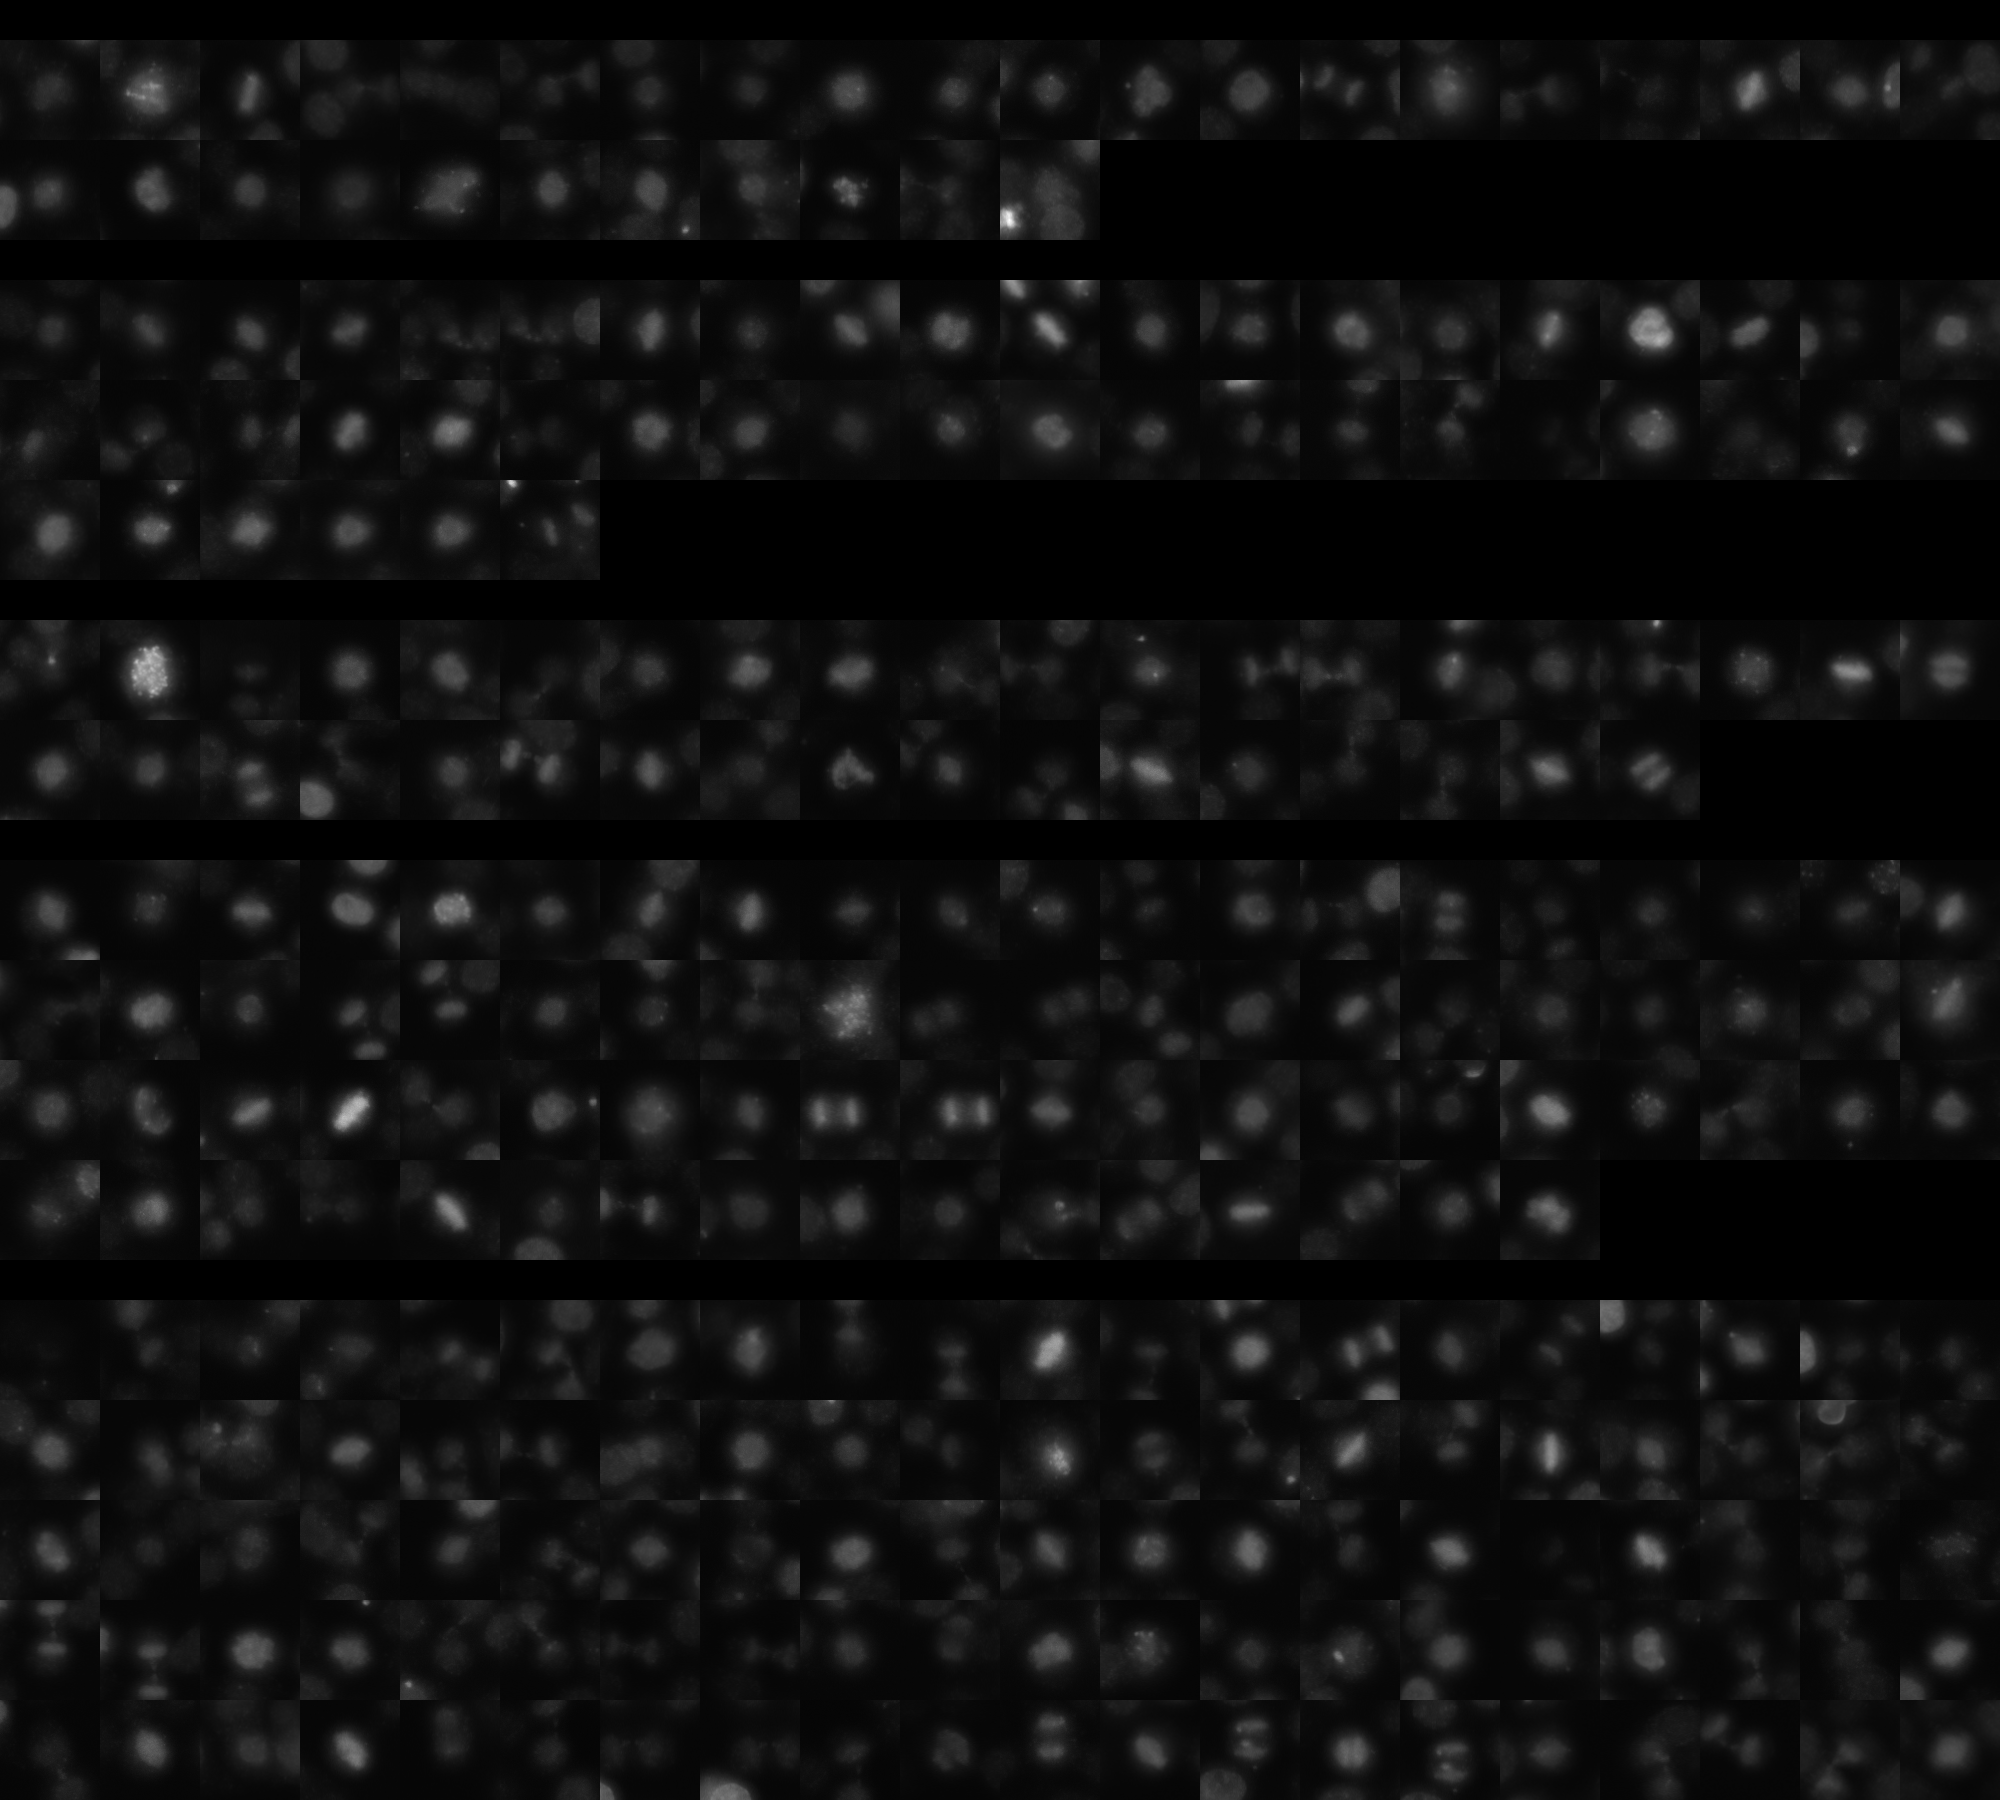
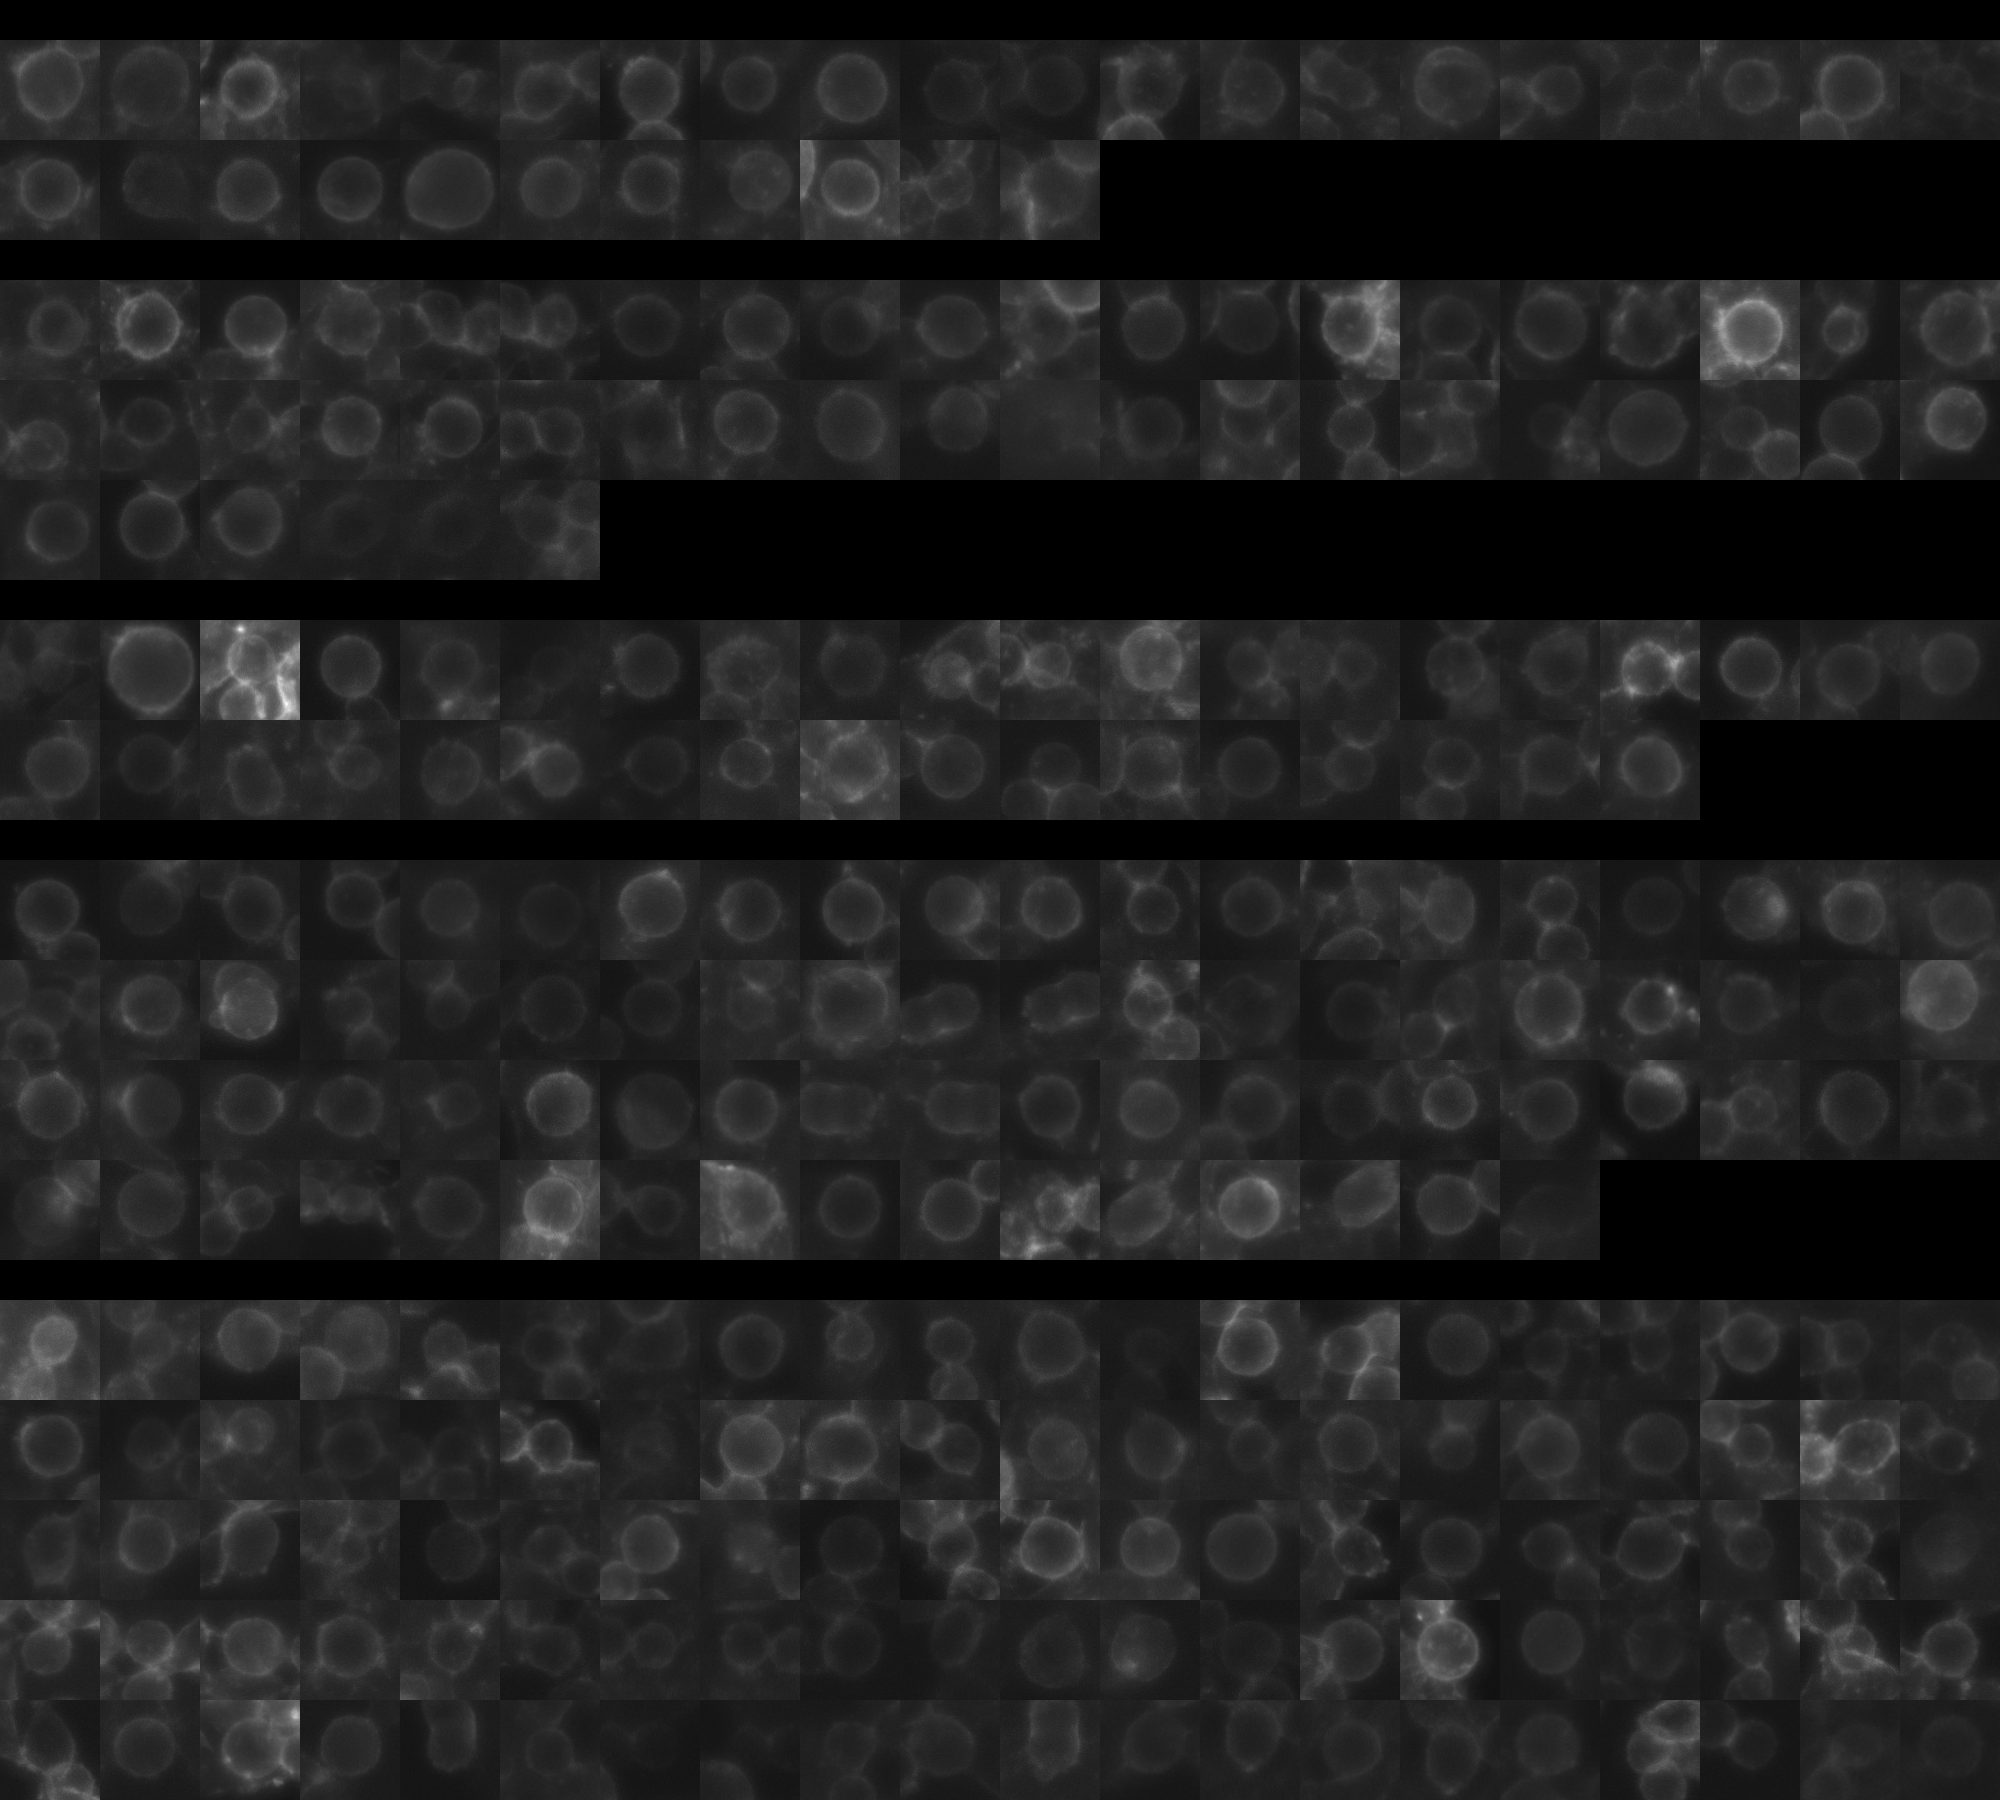
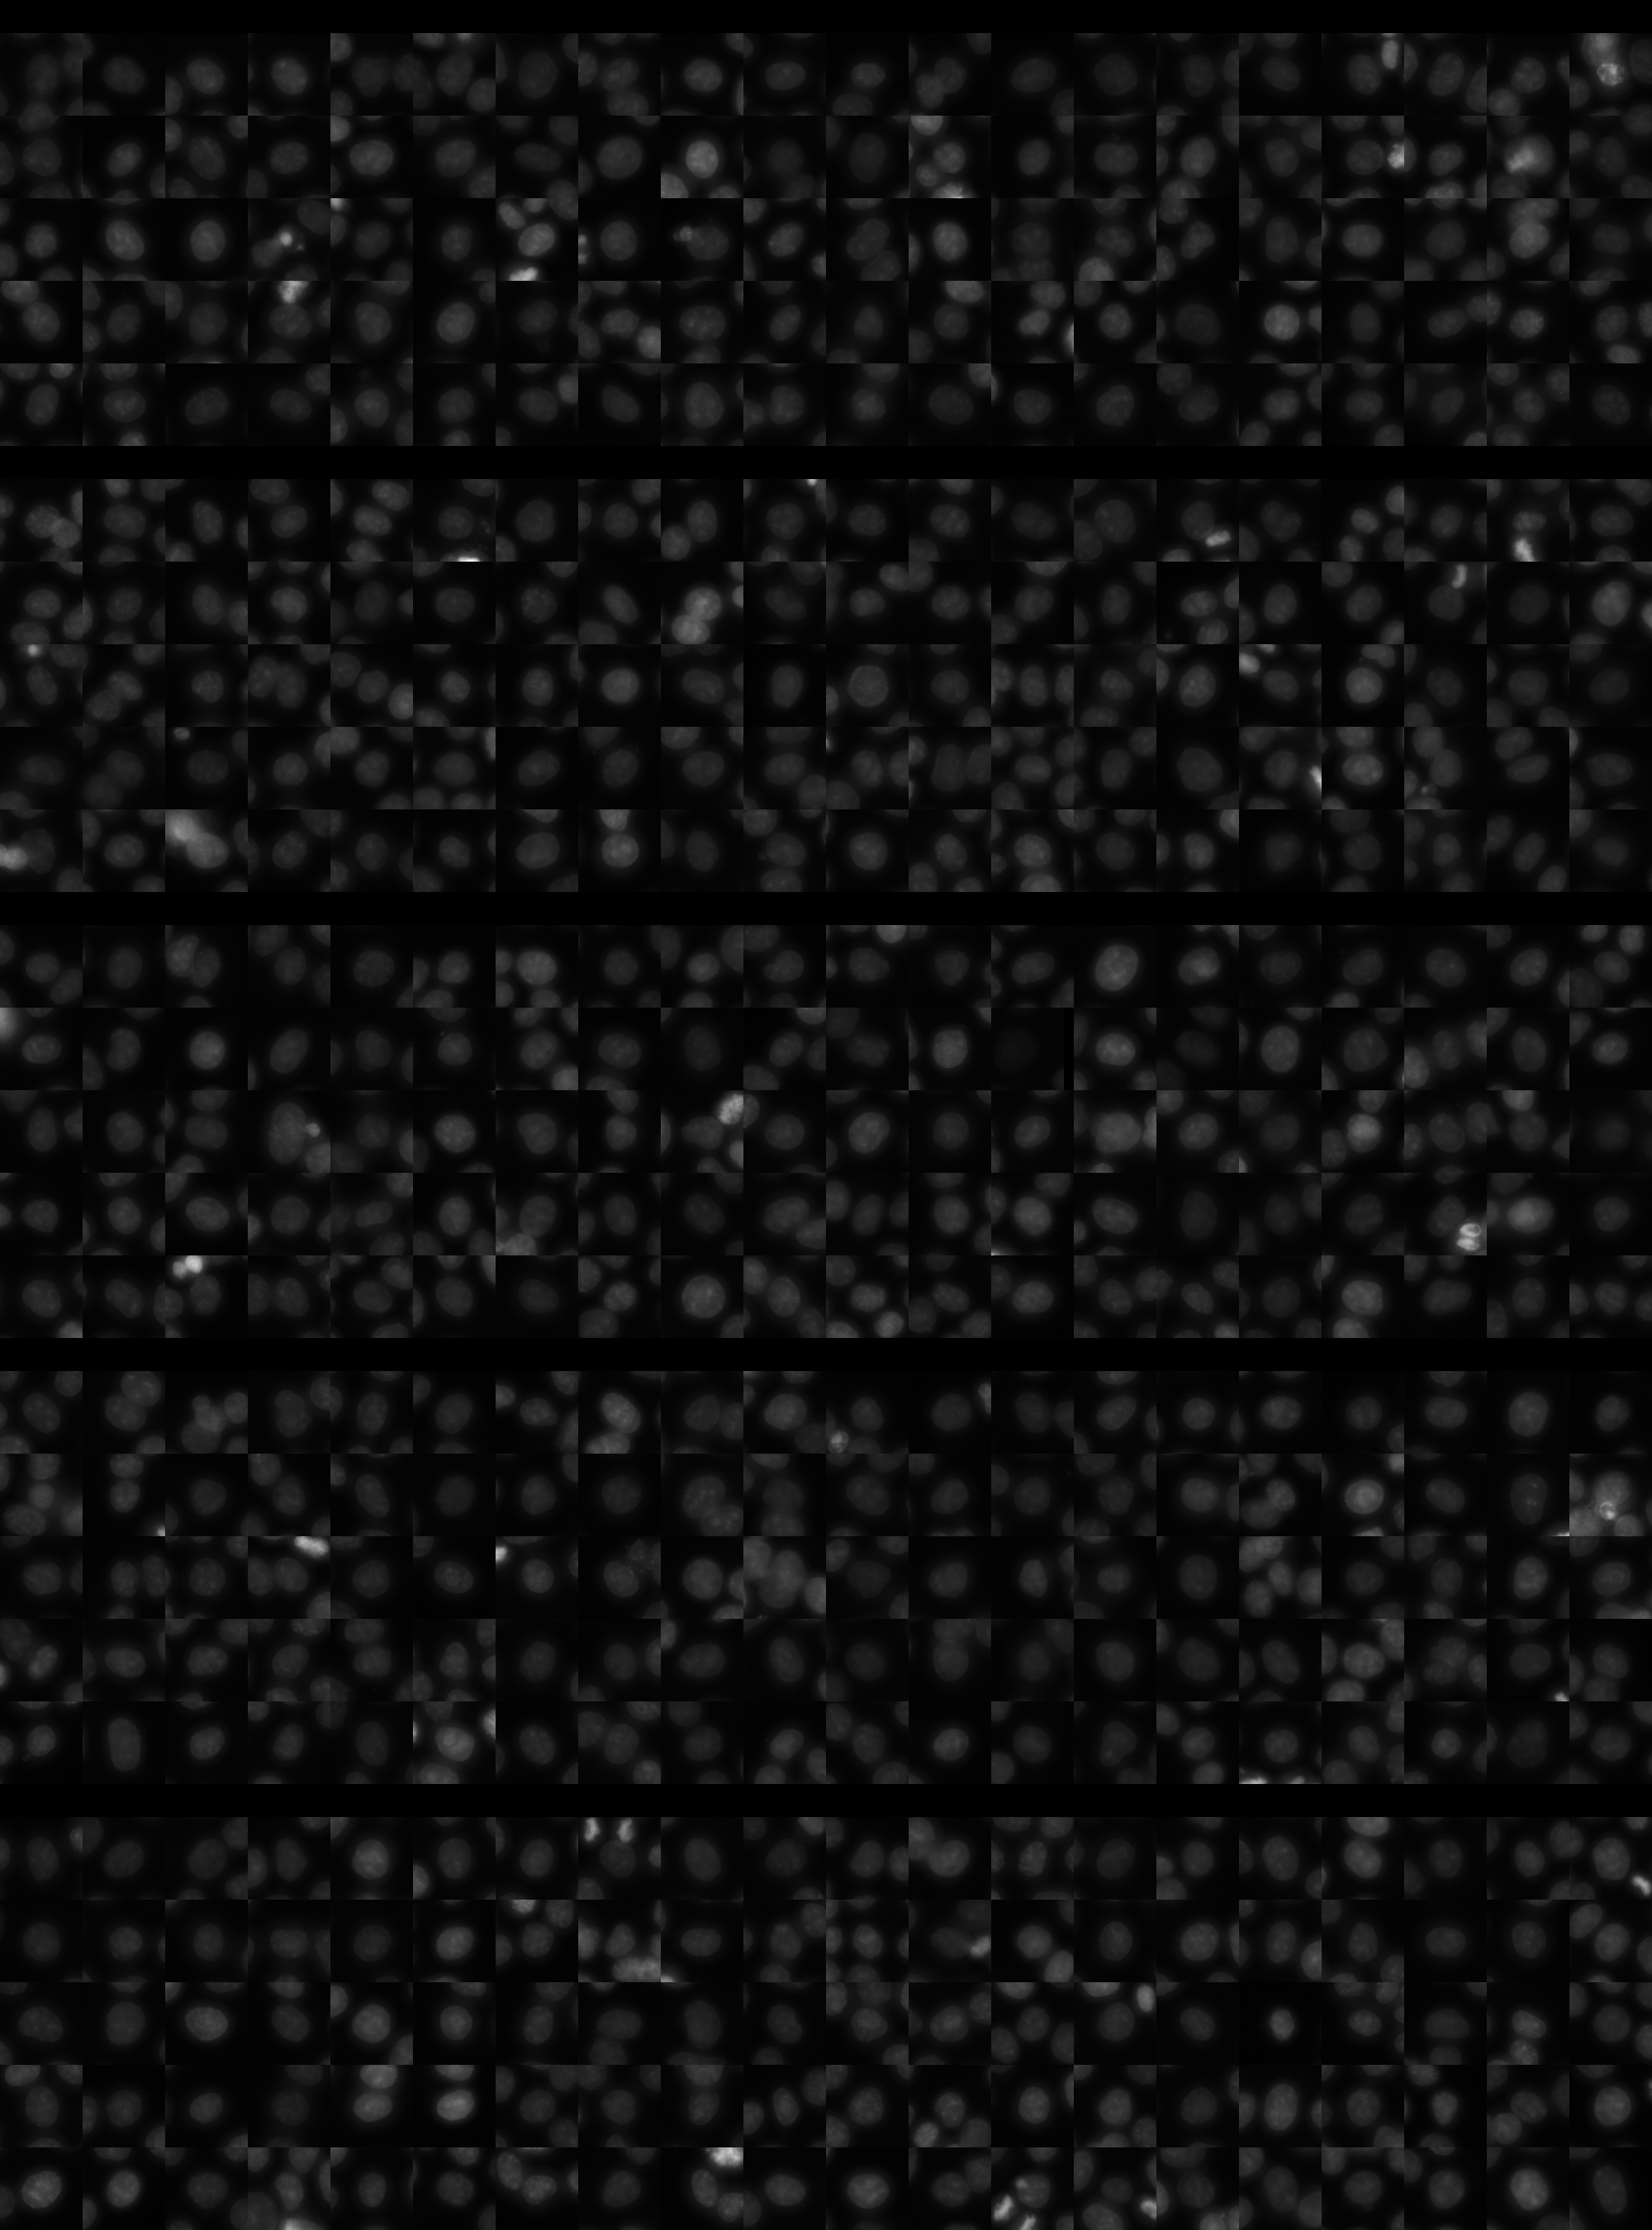
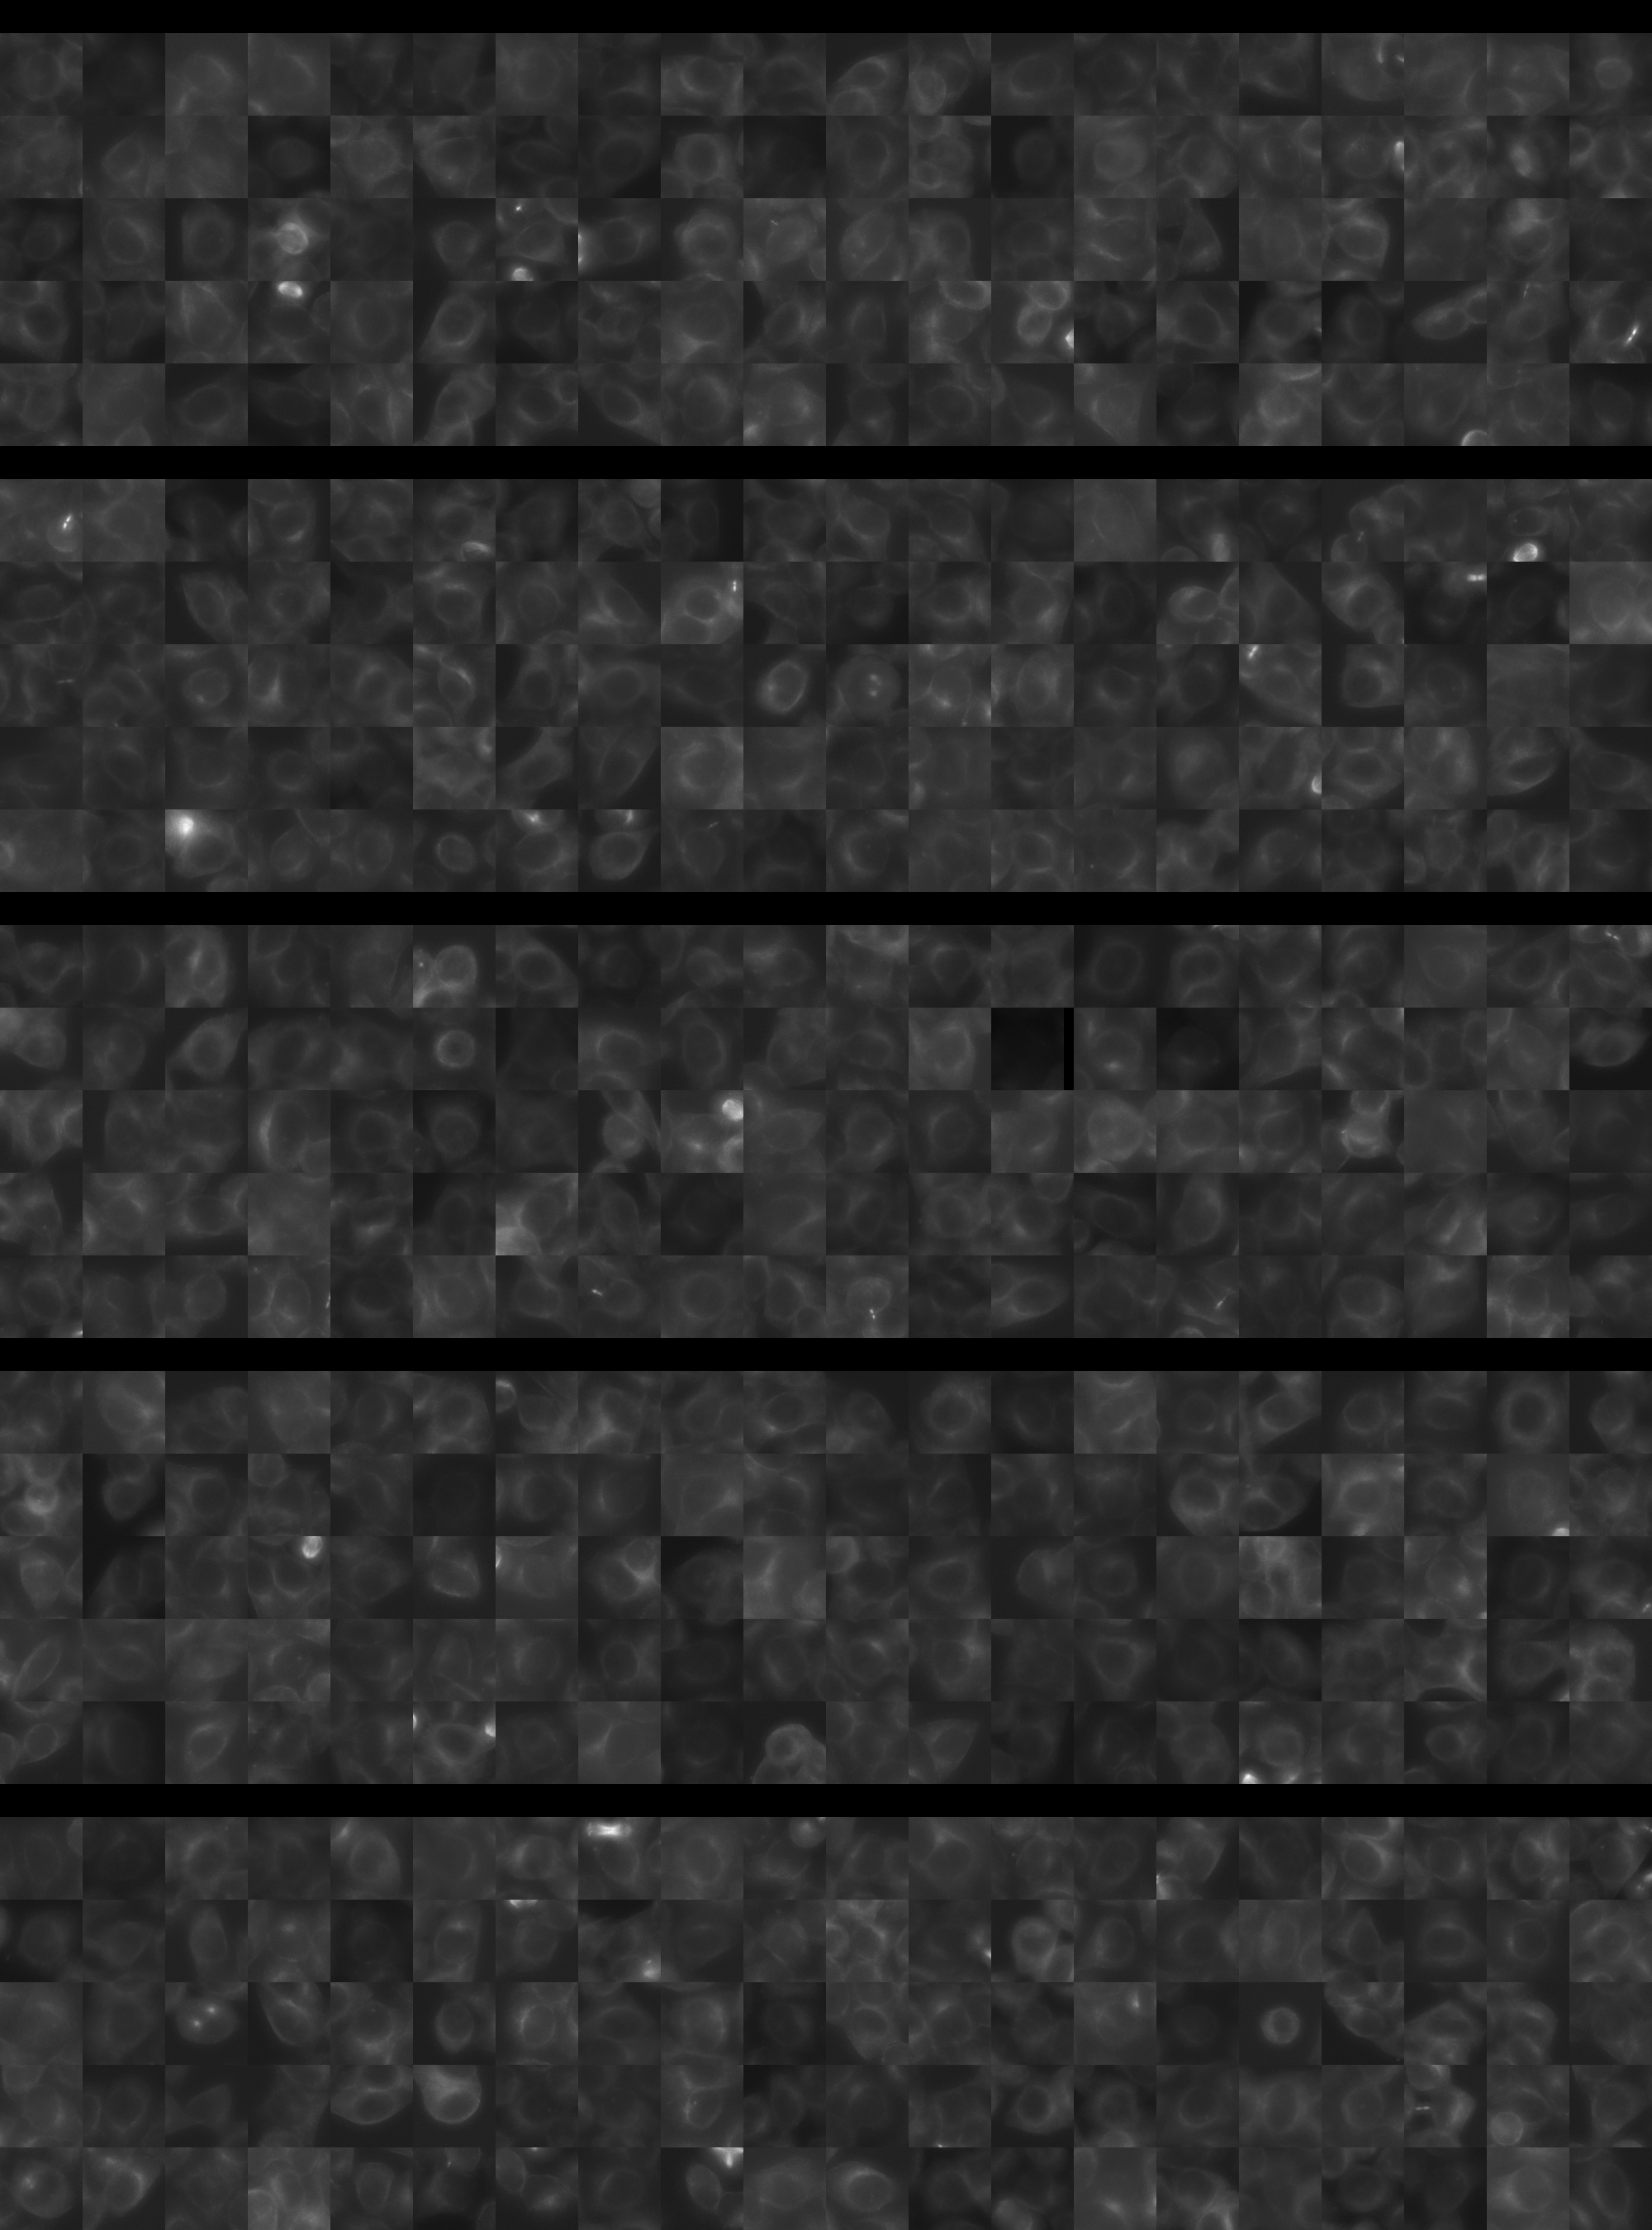
Each montage below shows randomly selected individual cell images for the same target gene separated by sgRNA, along with an example montage of cells expressing a non-targeting negative control sgRNA at the bottom. sgRNA labels in the montages correspond to the numbered sgRNA sequences in the gene info table above. The DNA (blue) and tubulin (green) channels are displayed by default, with gH2AX (grayscale) and actin (yellow) available using the check boxes. Channel brightness, contrast, and opacity are adjustable by clicking the arrow next to the channel name. When only one channel is selected, the display defaults to grayscale. Click the “Zoom” checkbox above the channel controls to enable image zooming (via scrolling) and panning (via click-and-drag).

The cell boxes displayed for this gene are square, 30.36 μm per side for the interphase montage and 30.36 μm per side for the mitotic montage.
Features

Interphase Score Rank FDR q-value
Nucleus DNA Integrated 0.027 1813 of 5322 0.738
Nucleus DNA Mean -1.087e-01 4684 of 5322 0.005
Nucleus gH2AX Mean 0.008 4488 of 5322 0.861
Nucleus DNA - gH2AX Correlation -1.431e-01 4685 of 5322 1.021e-04
Nucleus Shape Area 0.140 429 of 5322 0.004
Nucleus Shape Eccentricity 0.083 336 of 5322 0.016
Nucleus Shape Form Factor 0.001 608 of 5322 0.877
Nucleus Shape Solidity 0.021 247 of 5322 0.495
Cell DNA Mass Displacement 0.025 2681 of 5322 0.693
Cell Tubulin Mean 0.012 2295 of 5322 0.792
Cell Tubulin Mass Displacement 0.015 2098 of 5322 0.819
Cell Actin Mean -1.015e-01 4934 of 5322 0.013
Cell Tubulin - Actin Correlation -8.512e-02 5219 of 5322 0.016
Cell DNA - Tubulin Correlation -2.308e-01 5304 of 5322 1.948e-04
Cell Shape Area 0.047 1625 of 5322 0.506
Cell Shape Eccentricity 0.013 2649 of 5322 0.890
Mitotic Score Rank FDR q-value
Nucleus DNA Integrated 0.151 1801 of 5322 0.922
Nucleus DNA Mean 0.135 1083 of 5322 1.000
Nucleus DNA Mass Displacement 0.094 2003 of 5322 0.999
Nucleus DNA Mean Frac 3 0.076 1905 of 5322 1.000
Nucleus gH2AX Mean 0.144 1176 of 5322 1.000
Nucleus gH2AX Mean Frac 0 0.025 1889 of 5322 1.000
Nucleus Tubulin Mean Frac 0 0.105 1910 of 5322 0.999
Nucleus Tubulin Mean Edge 0.291 335 of 5322 0.814
Nucleus Tubulin Std Edge 0.175 615 of 5322 0.999
Nucleus Shape Area 0.172 1760 of 5322 0.934
Nucleus Shape Eccentricity 0.041 1490 of 5322 1.000
Nucleus Shape Form Factor -1.690e-01 3799 of 5322 0.998
Cell Tubulin Mean 0.213 869 of 5322 0.975
Cell Tubulin Mean Frac 3 -3.083e-01 4749 of 5322 0.890
Cell Actin Mean 0.117 1649 of 5322 0.997
Cell Shape Area 0.188 1511 of 5322 0.994
( Reset Zoom )
Brightness
Contrast
Opacity
Brightness
Contrast
Opacity
Brightness
Contrast
Opacity
Brightness
Contrast
Opacity
Brightness
Contrast
Opacity

( Reset Zoom )
Brightness
Contrast
Opacity
Brightness
Contrast
Opacity
Brightness
Contrast
Opacity
Brightness
Contrast
Opacity
Brightness
Contrast
Opacity

MIT Central Accessability