RABL2B

Due to sgRNA sequence design constraints two or more of the sgRNAs used to target this gene have multiple genomic target sites, potentially impacting the observed phenotype through increased DNA damage.
Gene symbol: RABL2B
Gene: 11158
Uniprot Function: Small GTPase required for ciliation. Activated in a guanine nucleotide exchange factor (GEF)-independent manner via its intrinsic GDP for GTP nucleotide exchange ability (PubMed:28625565). Involved in ciliary assembly by binding the intraflagellar transport (IFT) complex B from the large pool pre-docked at the base of the cilium and thus triggers its entry into the cilia (PubMed:28625565, PubMed:28428259).
Mitotic Index 0.027000000000000003
Interphase Cluster: #79 (26 genes)
Mitotic Cluster: #18 (40 genes)
sgRNA 1: AACCGAGTGAGTTGGACCAA (interphase cells: 743, mitotic cells: 23)
sgRNA 2: GATGGTCCTTCCATCTACCG (interphase cells: 953, mitotic cells: 28)
sgRNA 3: GCATGCCTCCTACTACCACA (interphase cells: 1834, mitotic cells: 55)
sgRNA 4: TGCAGGTGTTTGATGTACAG (interphase cells: 2353, mitotic cells: 57)

Interphase Cluster

Mitotic Cluster

Overview

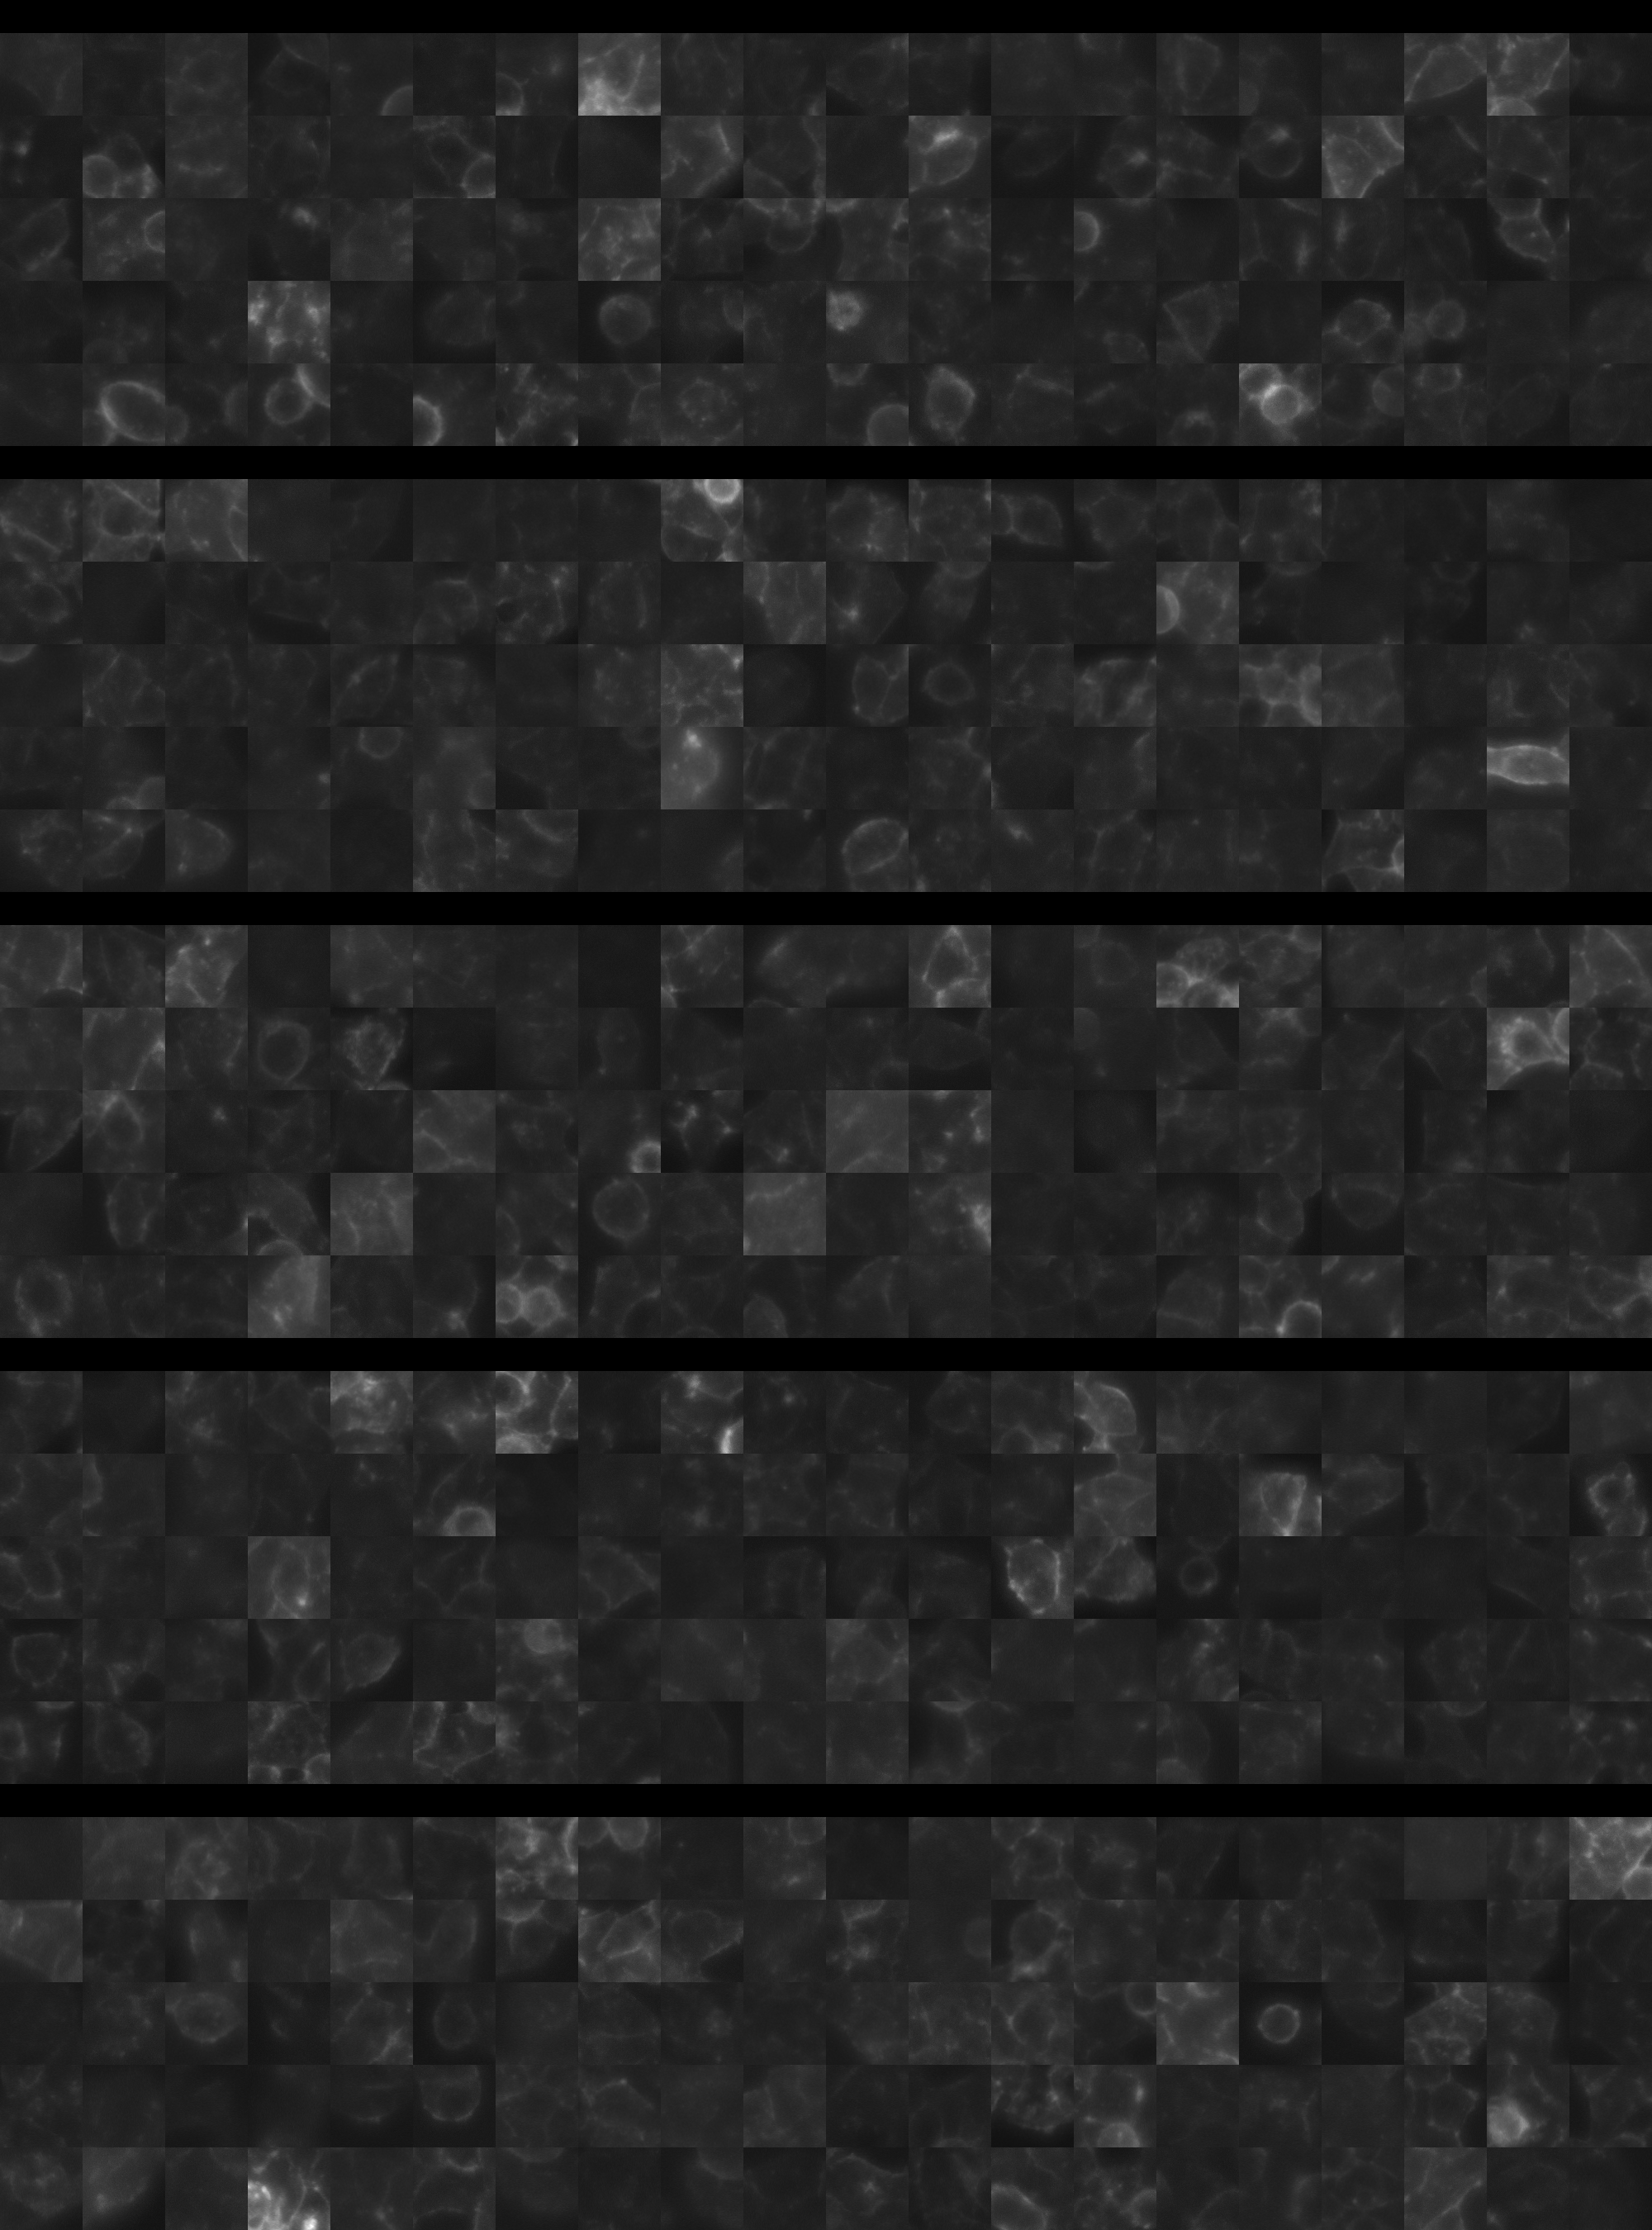
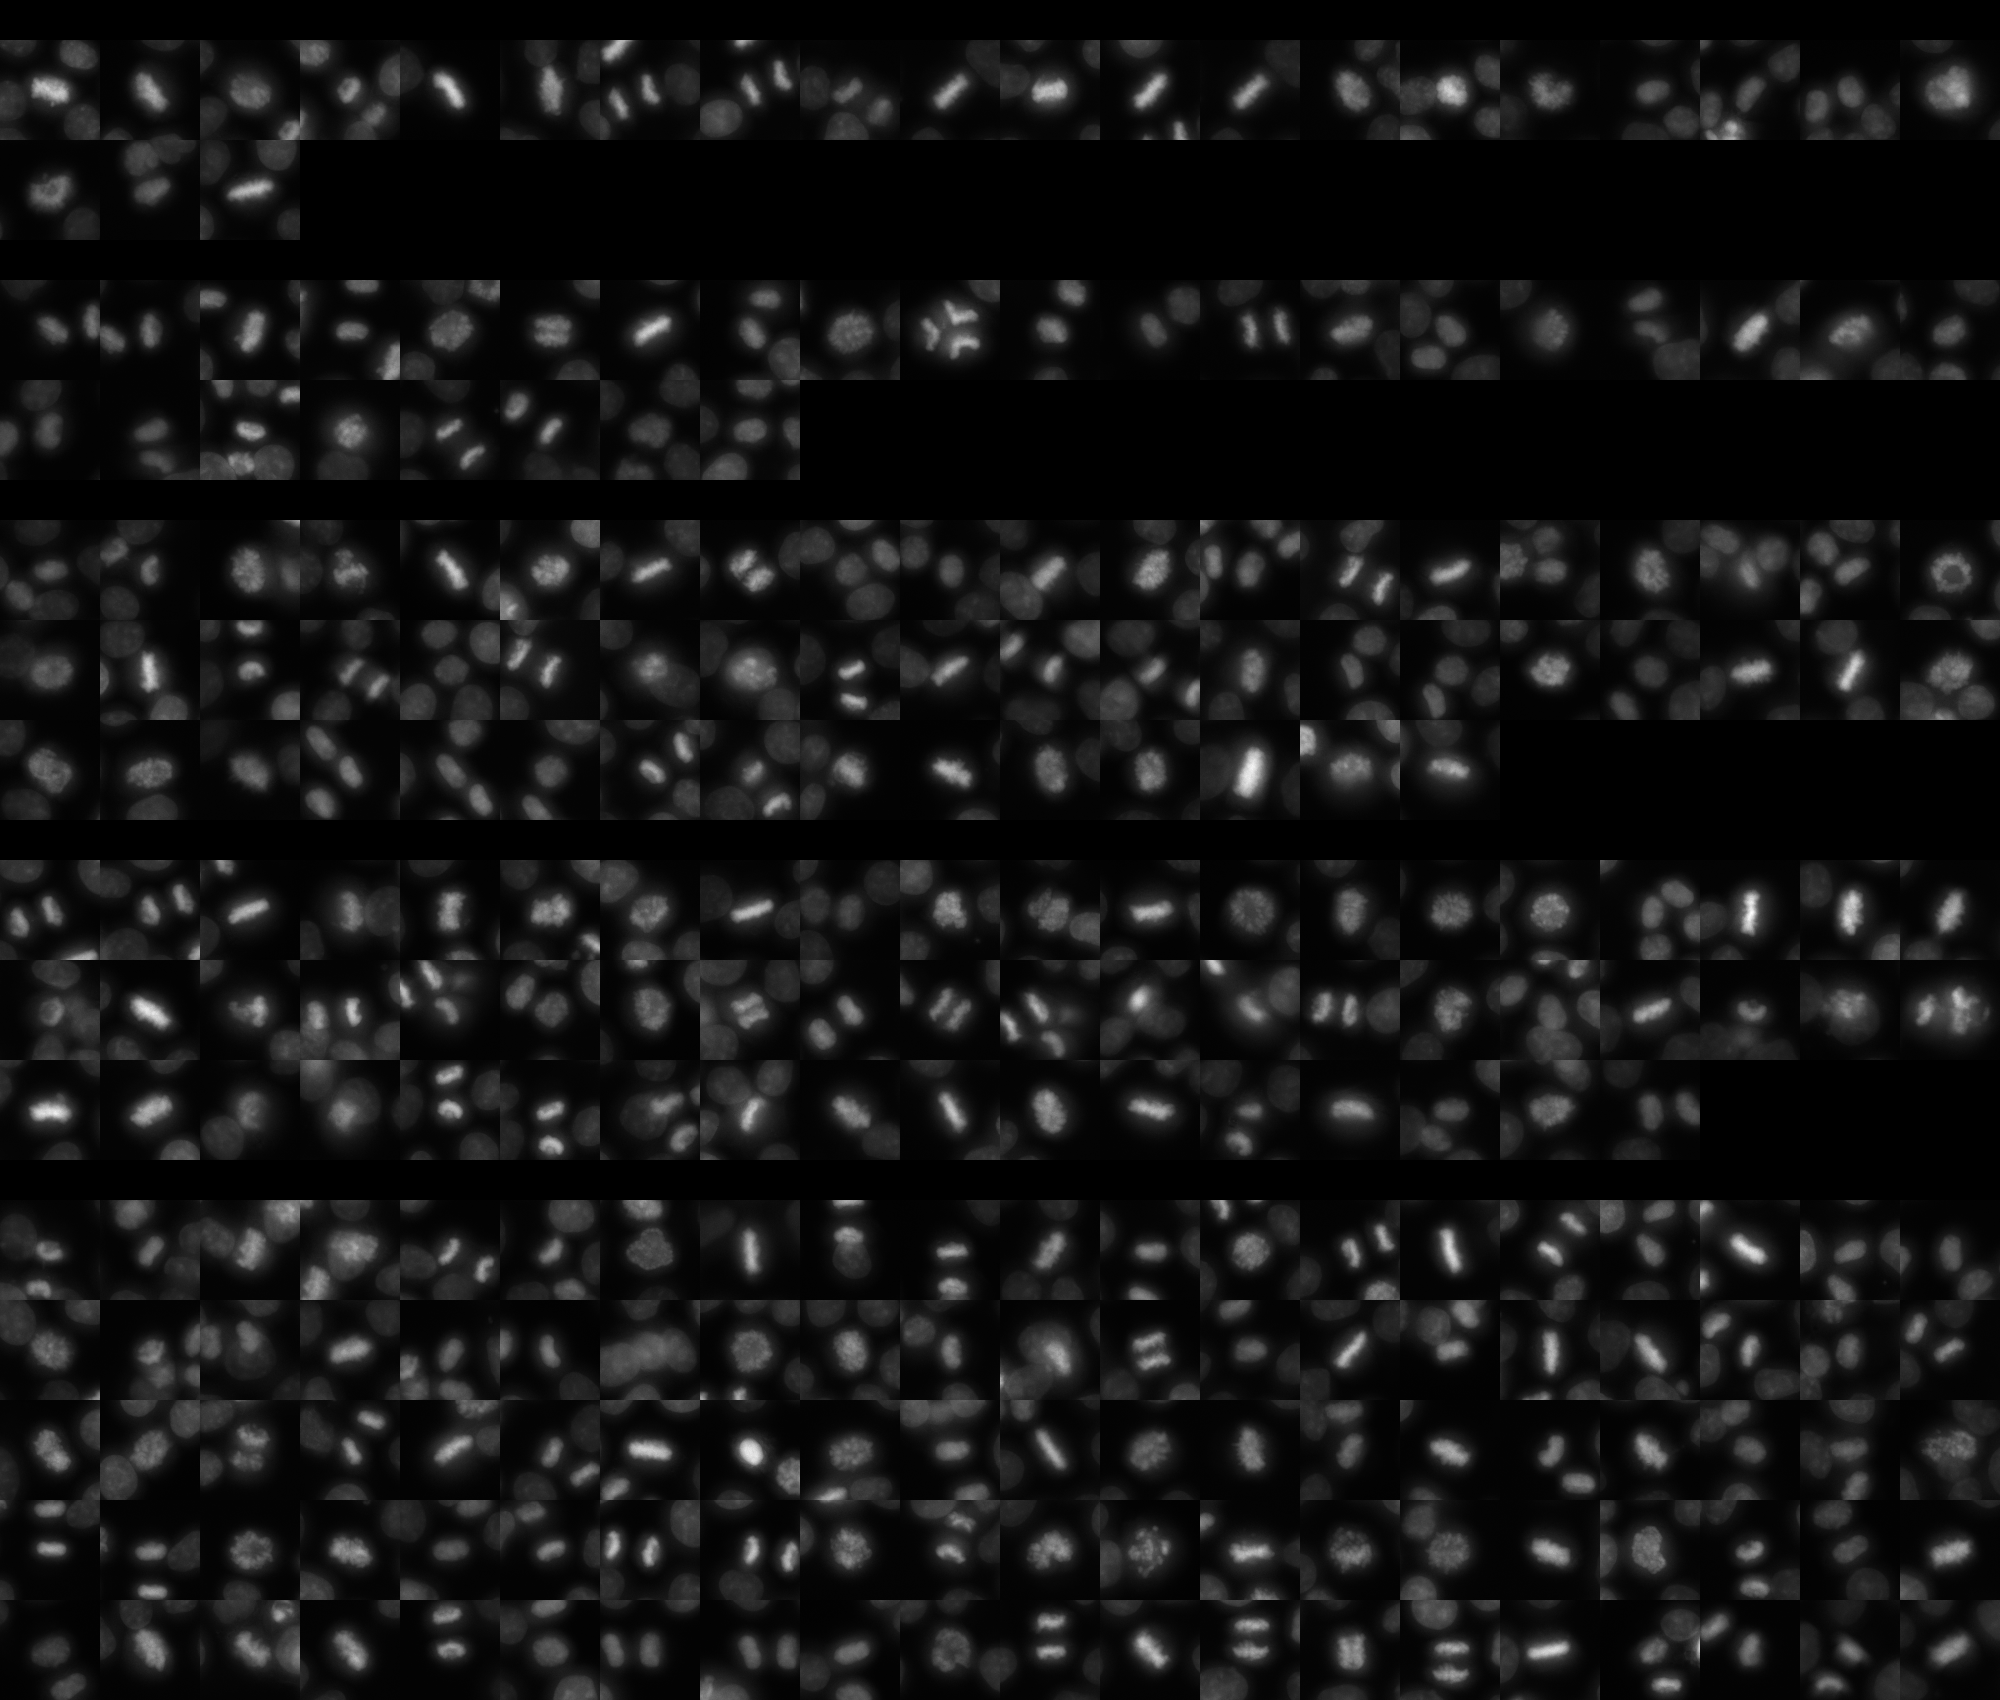
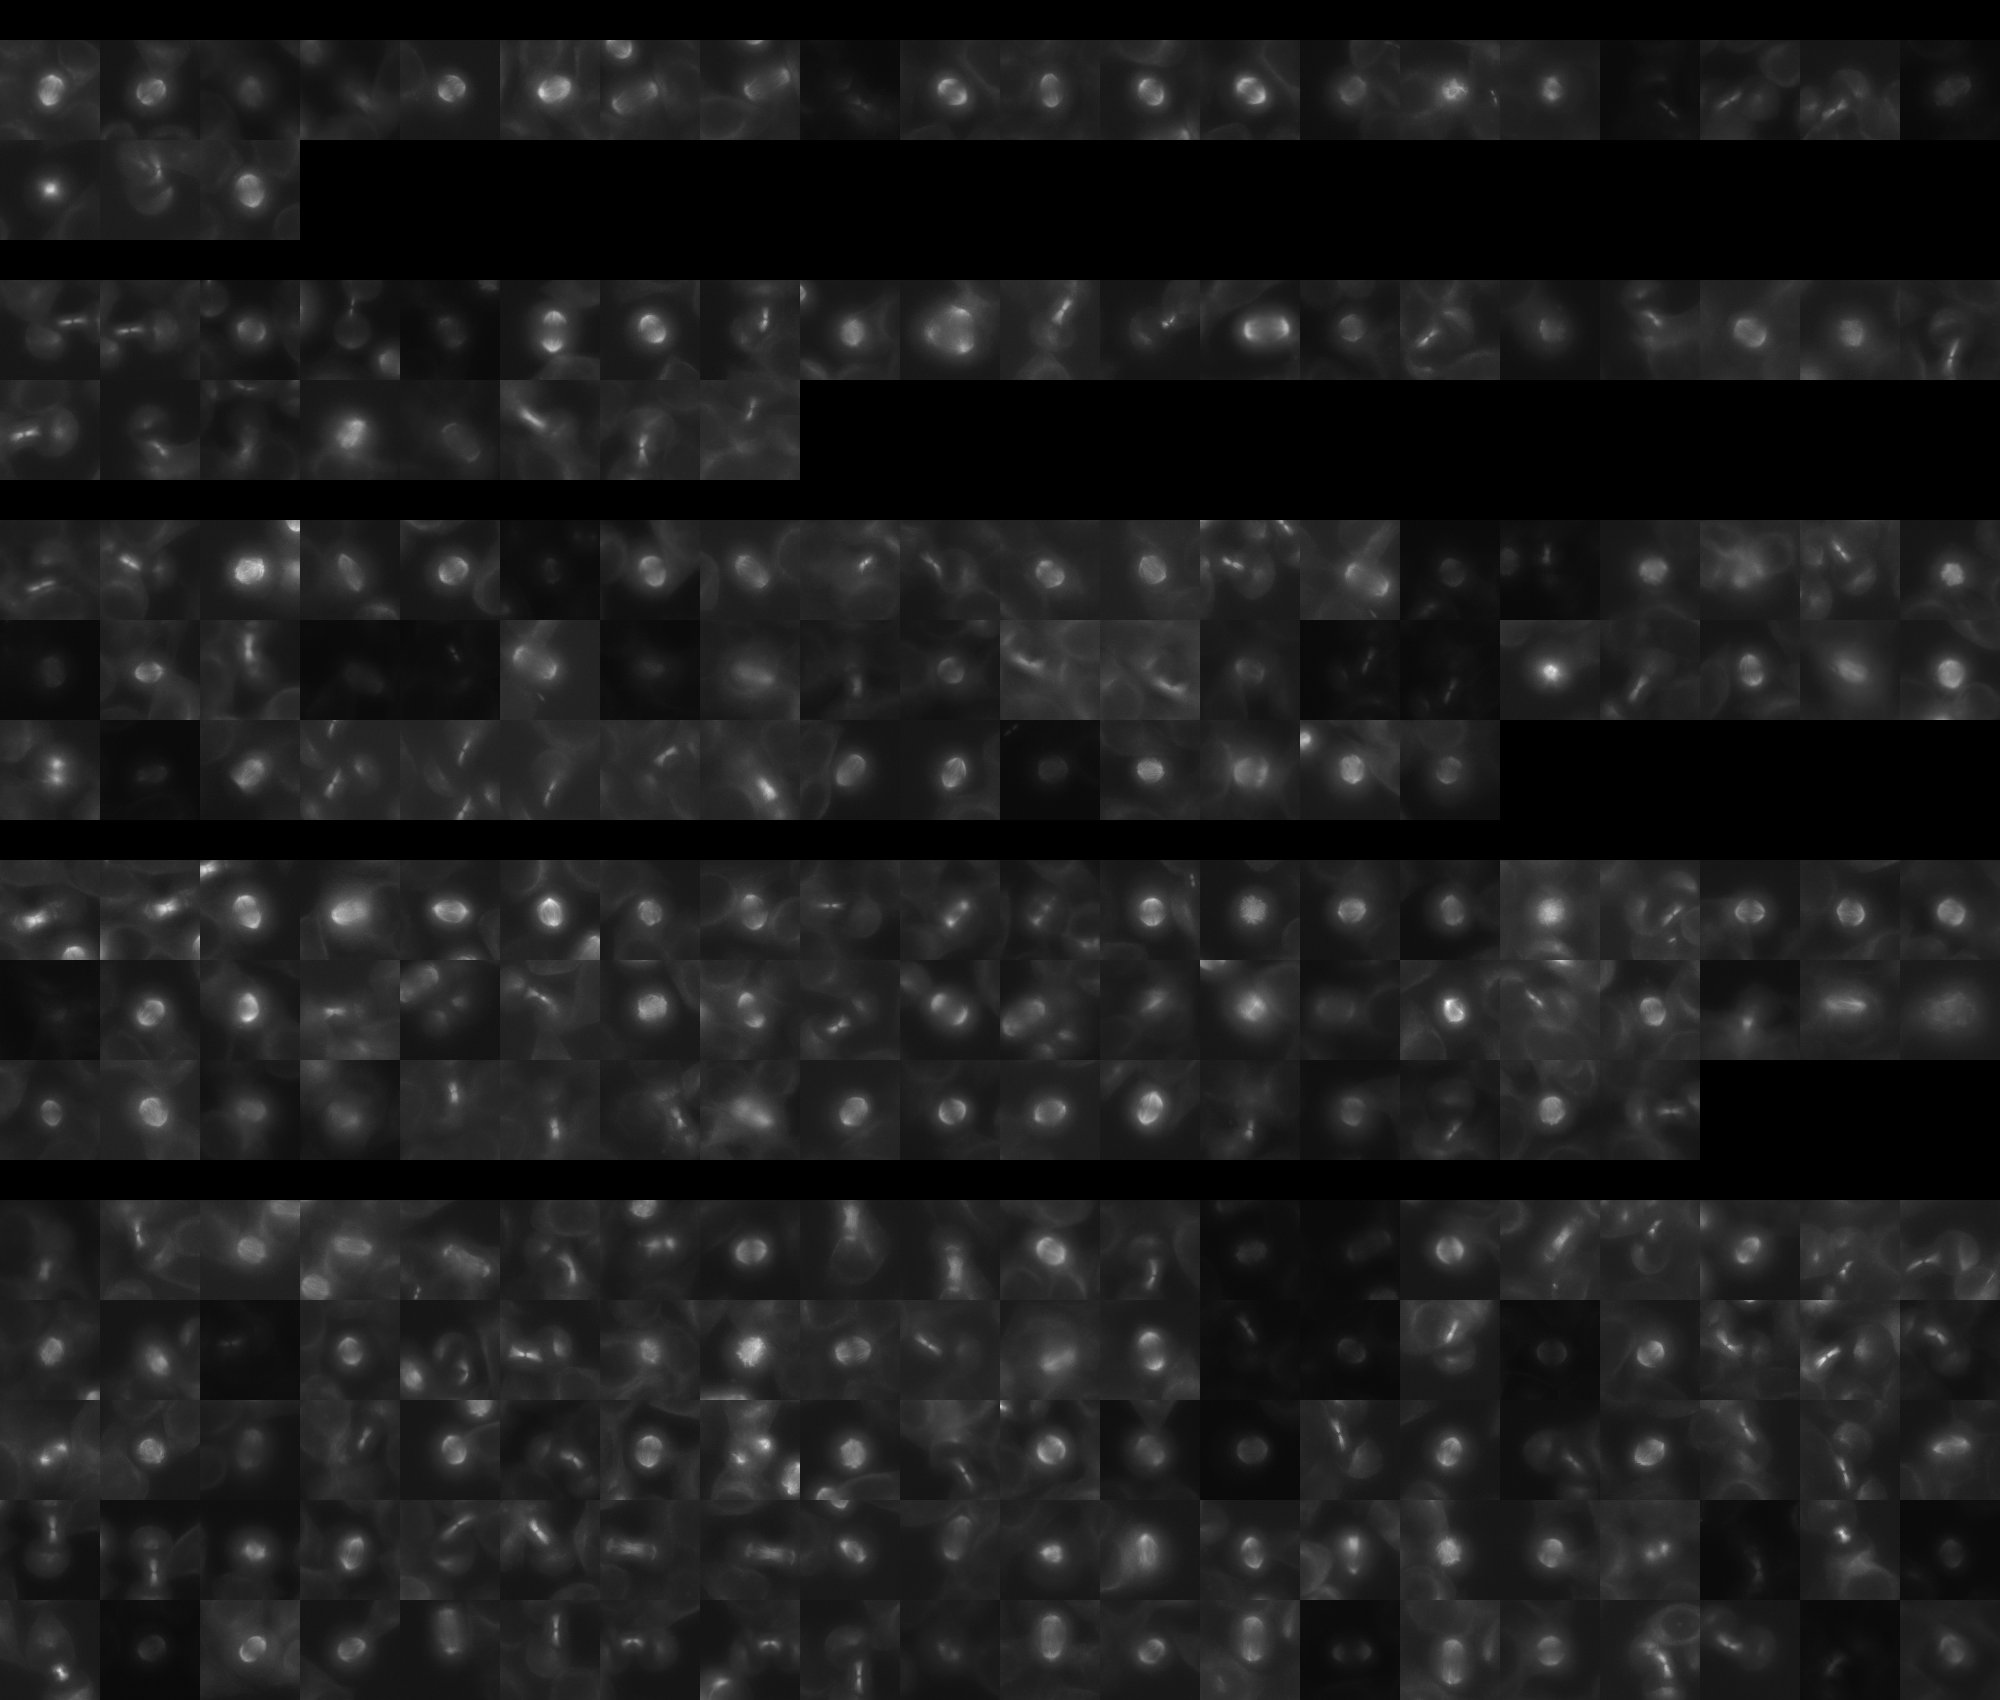
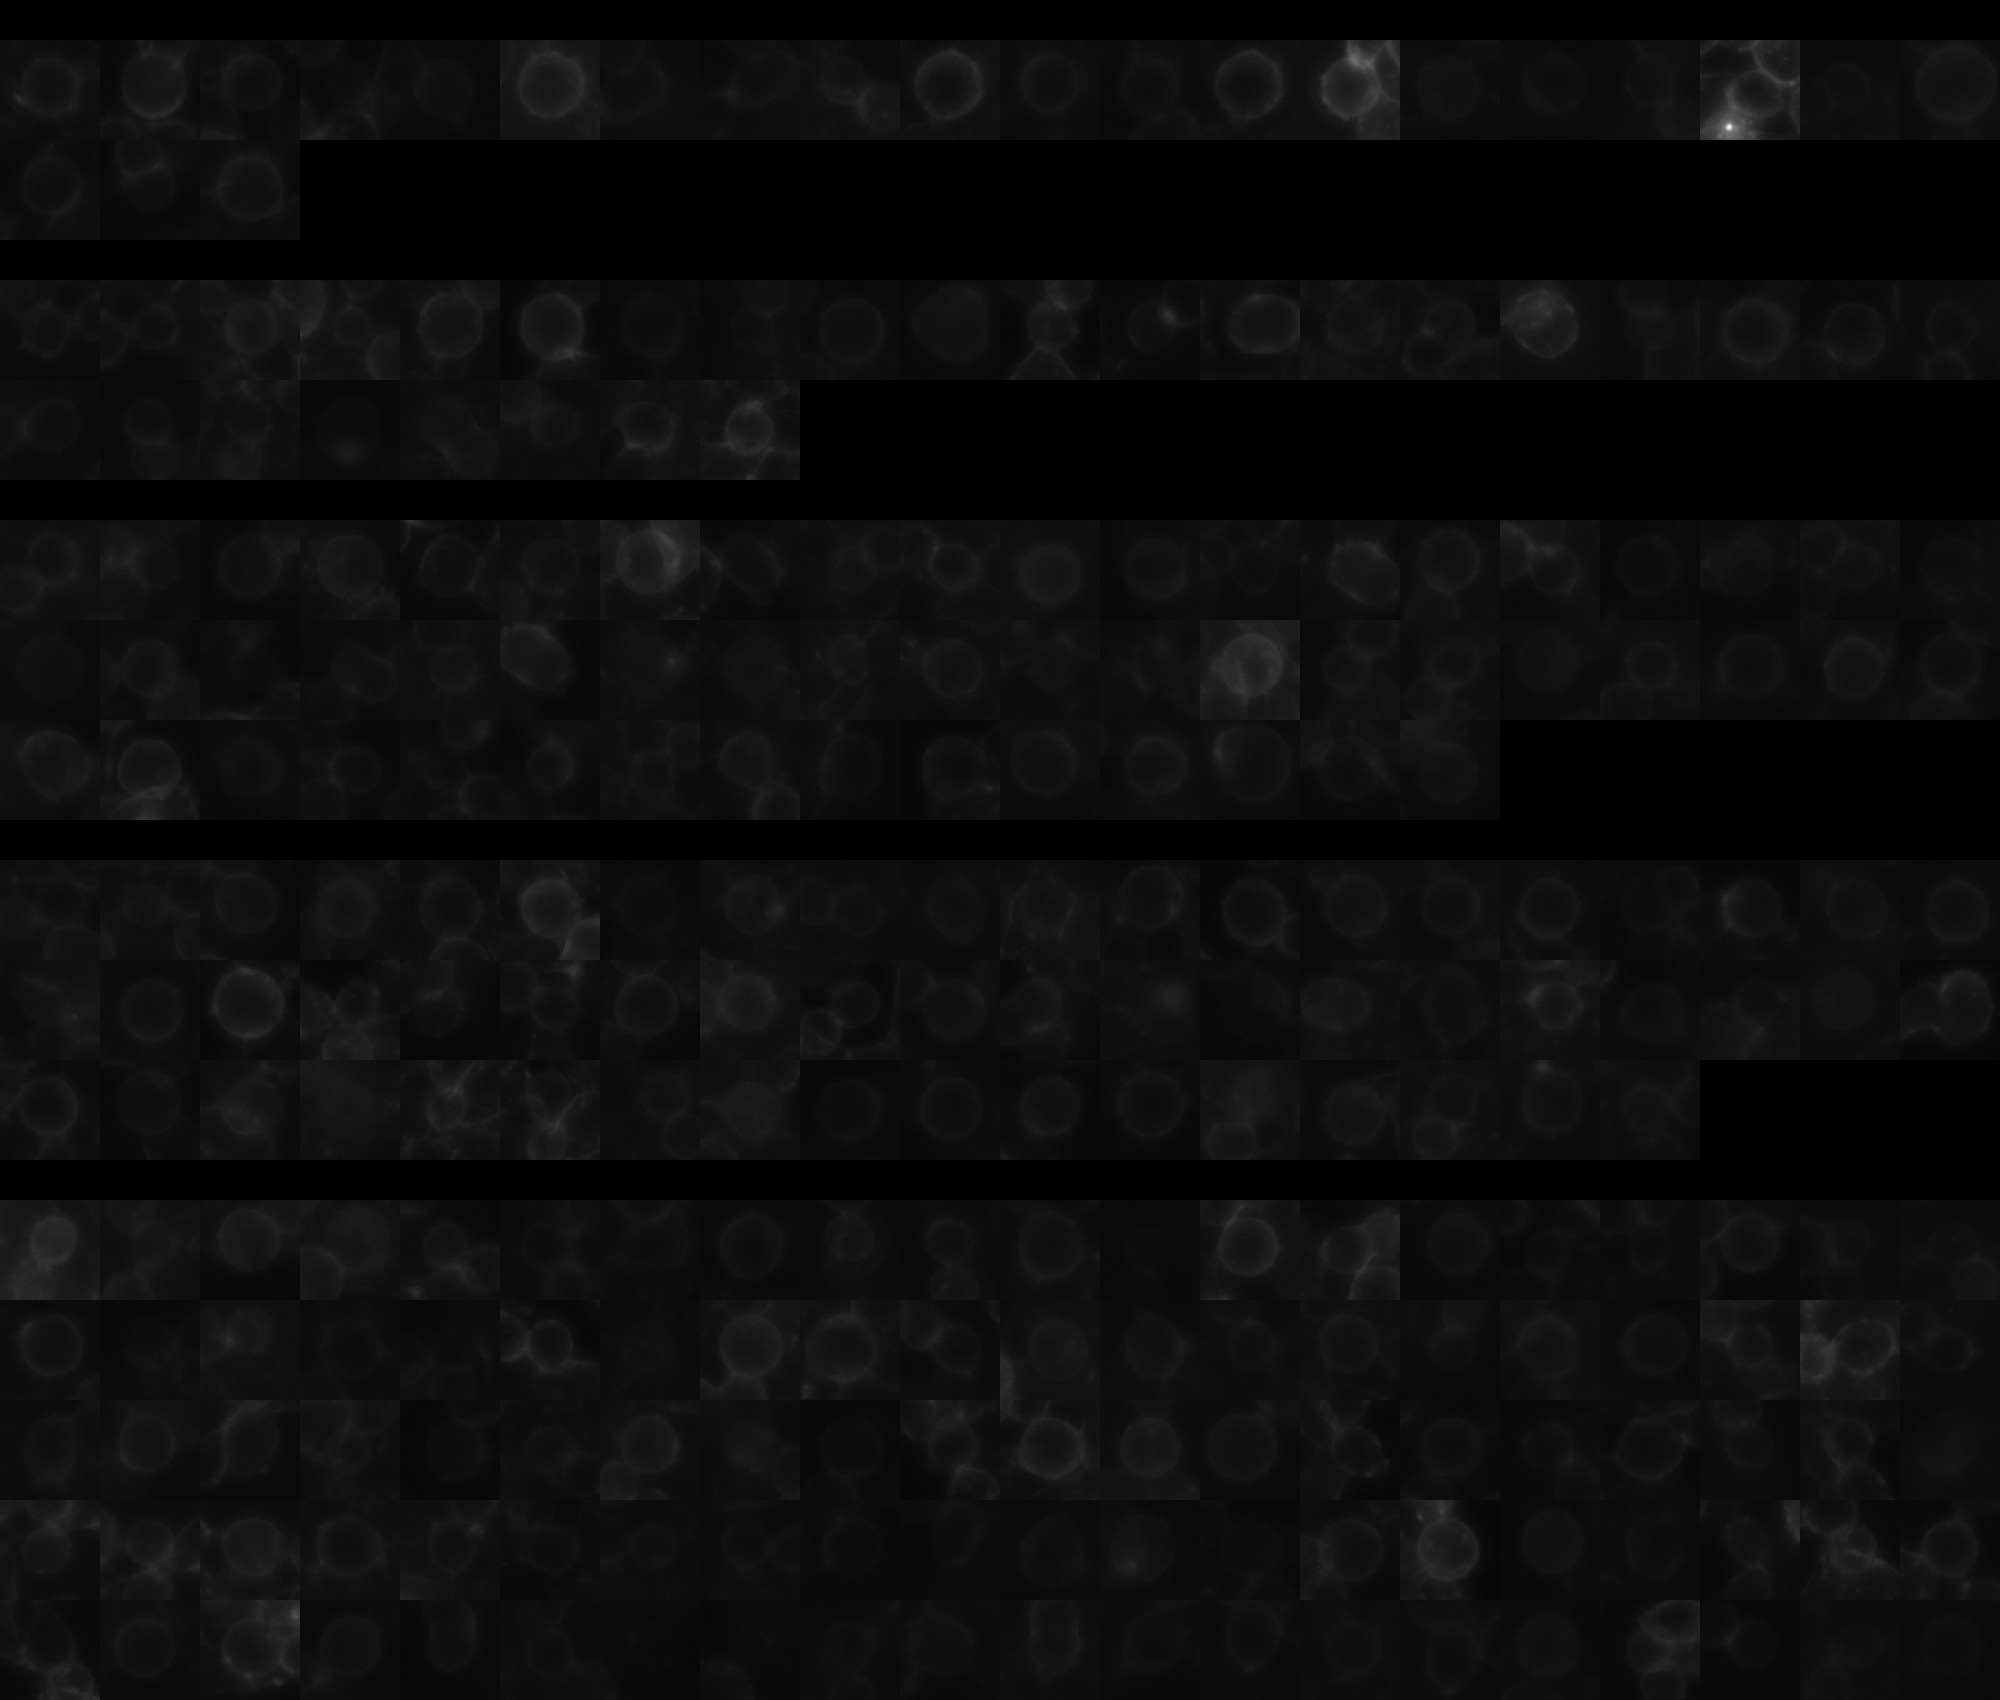
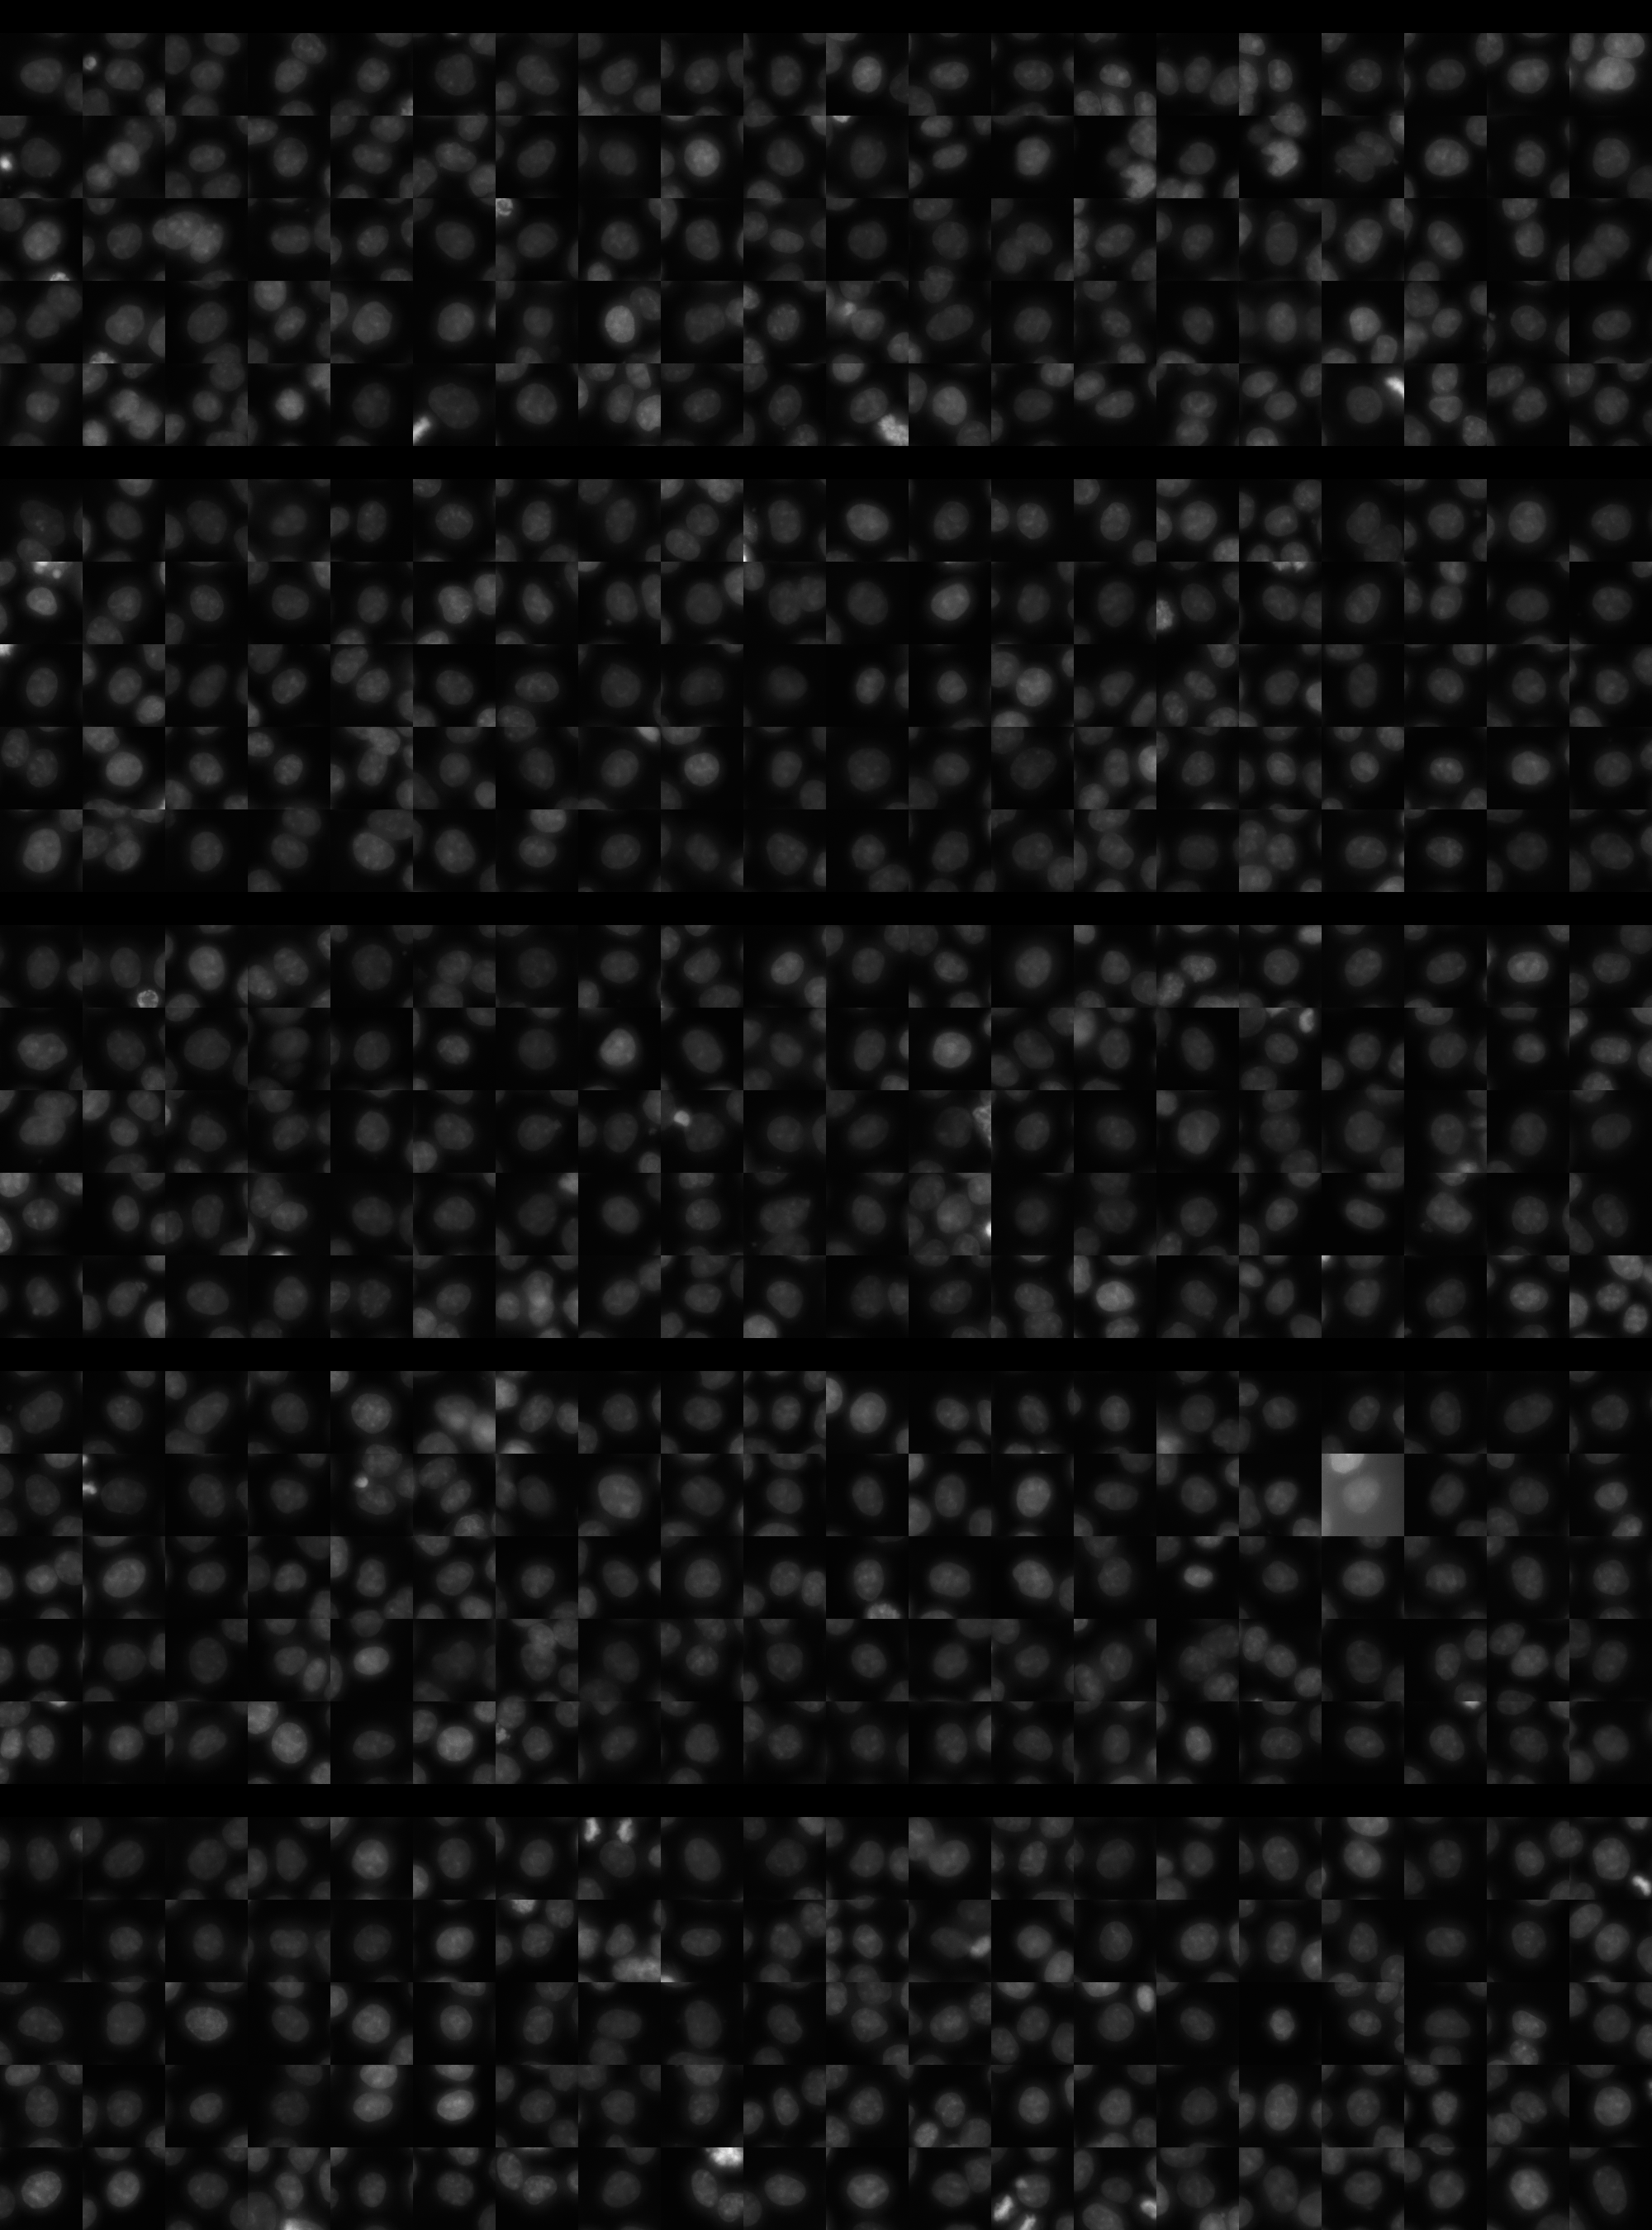
Each montage below shows randomly selected individual cell images for the same target gene separated by sgRNA, along with an example montage of cells expressing a non-targeting negative control sgRNA at the bottom. sgRNA labels in the montages correspond to the numbered sgRNA sequences in the gene info table above. The DNA (blue) and tubulin (green) channels are displayed by default, with gH2AX (grayscale) and actin (yellow) available using the check boxes. Channel brightness, contrast, and opacity are adjustable by clicking the arrow next to the channel name. When only one channel is selected, the display defaults to grayscale. Click the “Zoom” checkbox above the channel controls to enable image zooming (via scrolling) and panning (via click-and-drag).

The cell boxes displayed for this gene are square, 30.36 μm per side for the interphase montage and 30.36 μm per side for the mitotic montage.
Features

Interphase Score Rank FDR q-value
Nucleus DNA Integrated -2.561e-02 4247 of 5322 0.678
Nucleus DNA Mean -7.608e-02 4212 of 5322 0.076
Nucleus gH2AX Mean 0.029 4052 of 5322 0.463
Nucleus DNA - gH2AX Correlation -9.792e-02 3924 of 5322 0.001
Nucleus Shape Area 0.016 2736 of 5322 0.890
Nucleus Shape Eccentricity 0.019 2274 of 5322 0.671
Nucleus Shape Form Factor -1.429e-02 1040 of 5322 0.792
Nucleus Shape Solidity -6.542e-02 3340 of 5322 0.060
Cell DNA Mass Displacement 0.018 3197 of 5322 0.827
Cell Tubulin Mean -4.703e-02 4246 of 5322 0.346
Cell Tubulin Mass Displacement 0.037 971 of 5322 0.468
Cell Actin Mean -3.511e-02 4037 of 5322 0.533
Cell Tubulin - Actin Correlation 0.018 2737 of 5322 0.734
Cell DNA - Tubulin Correlation 0.046 2031 of 5322 0.246
Cell Shape Area 0.001 3195 of 5322 0.931
Cell Shape Eccentricity 0.040 917 of 5322 0.529
Mitotic Score Rank FDR q-value
Nucleus DNA Integrated 0.133 2027 of 5322 0.949
Nucleus DNA Mean -4.019e-02 3580 of 5322 1.000
Nucleus DNA Mass Displacement -1.327e-01 4934 of 5322 0.999
Nucleus DNA Mean Frac 3 0.168 843 of 5322 1.000
Nucleus gH2AX Mean -1.981e-02 3218 of 5322 1.000
Nucleus gH2AX Mean Frac 0 0.001 2255 of 5322 1.000
Nucleus Tubulin Mean Frac 0 0.176 1051 of 5322 0.999
Nucleus Tubulin Mean Edge -4.088e-02 3705 of 5322 0.999
Nucleus Tubulin Std Edge -1.062e-01 3957 of 5322 0.999
Nucleus Shape Area 0.023 3701 of 5322 0.990
Nucleus Shape Eccentricity -1.668e-01 4276 of 5322 1.000
Nucleus Shape Form Factor -1.129e-01 3038 of 5322 0.998
Cell Tubulin Mean 0.092 2154 of 5322 0.997
Cell Tubulin Mean Frac 3 -9.536e-02 2883 of 5322 0.999
Cell Actin Mean 0.211 826 of 5322 0.997
Cell Shape Area -5.819e-02 4495 of 5322 0.998
( Reset Zoom )
Brightness
Contrast
Opacity
Brightness
Contrast
Opacity
Brightness
Contrast
Opacity
Brightness
Contrast
Opacity
Brightness
Contrast
Opacity

( Reset Zoom )
Brightness
Contrast
Opacity
Brightness
Contrast
Opacity
Brightness
Contrast
Opacity
Brightness
Contrast
Opacity
Brightness
Contrast
Opacity

MIT Central Accessability