PTDSS1

Gene symbol: PTDSS1
Gene: 9791
Uniprot Function: Catalyzes a base-exchange reaction in which the polar head group of phosphatidylethanolamine (PE) or phosphatidylcholine (PC) is replaced by L-serine (PubMed:19014349, PubMed:24241535). Catalyzes mainly the conversion of phosphatidylcholine (PubMed:19014349, PubMed:24241535). Also converts, in vitro and to a lesser extent, phosphatidylethanolamine (PubMed:19014349, PubMed:24241535).
Mitotic Index 0.0219
Interphase Cluster: #89 (25 genes)
Mitotic Cluster: #133 (20 genes)
sgRNA 1: AAATCTTCGATACGCCACAA (interphase cells: 2120, mitotic cells: 40)
sgRNA 2: ACCGTAACTACGGATCAGCA (interphase cells: 1493, mitotic cells: 38)
sgRNA 3: AGCACTCGGCAAAATTGGGG (interphase cells: 2341, mitotic cells: 60)
sgRNA 4: GGGGTCAAACCATCGAACAT (interphase cells: 1005, mitotic cells: 18)

Interphase Cluster

Mitotic Cluster

Overview

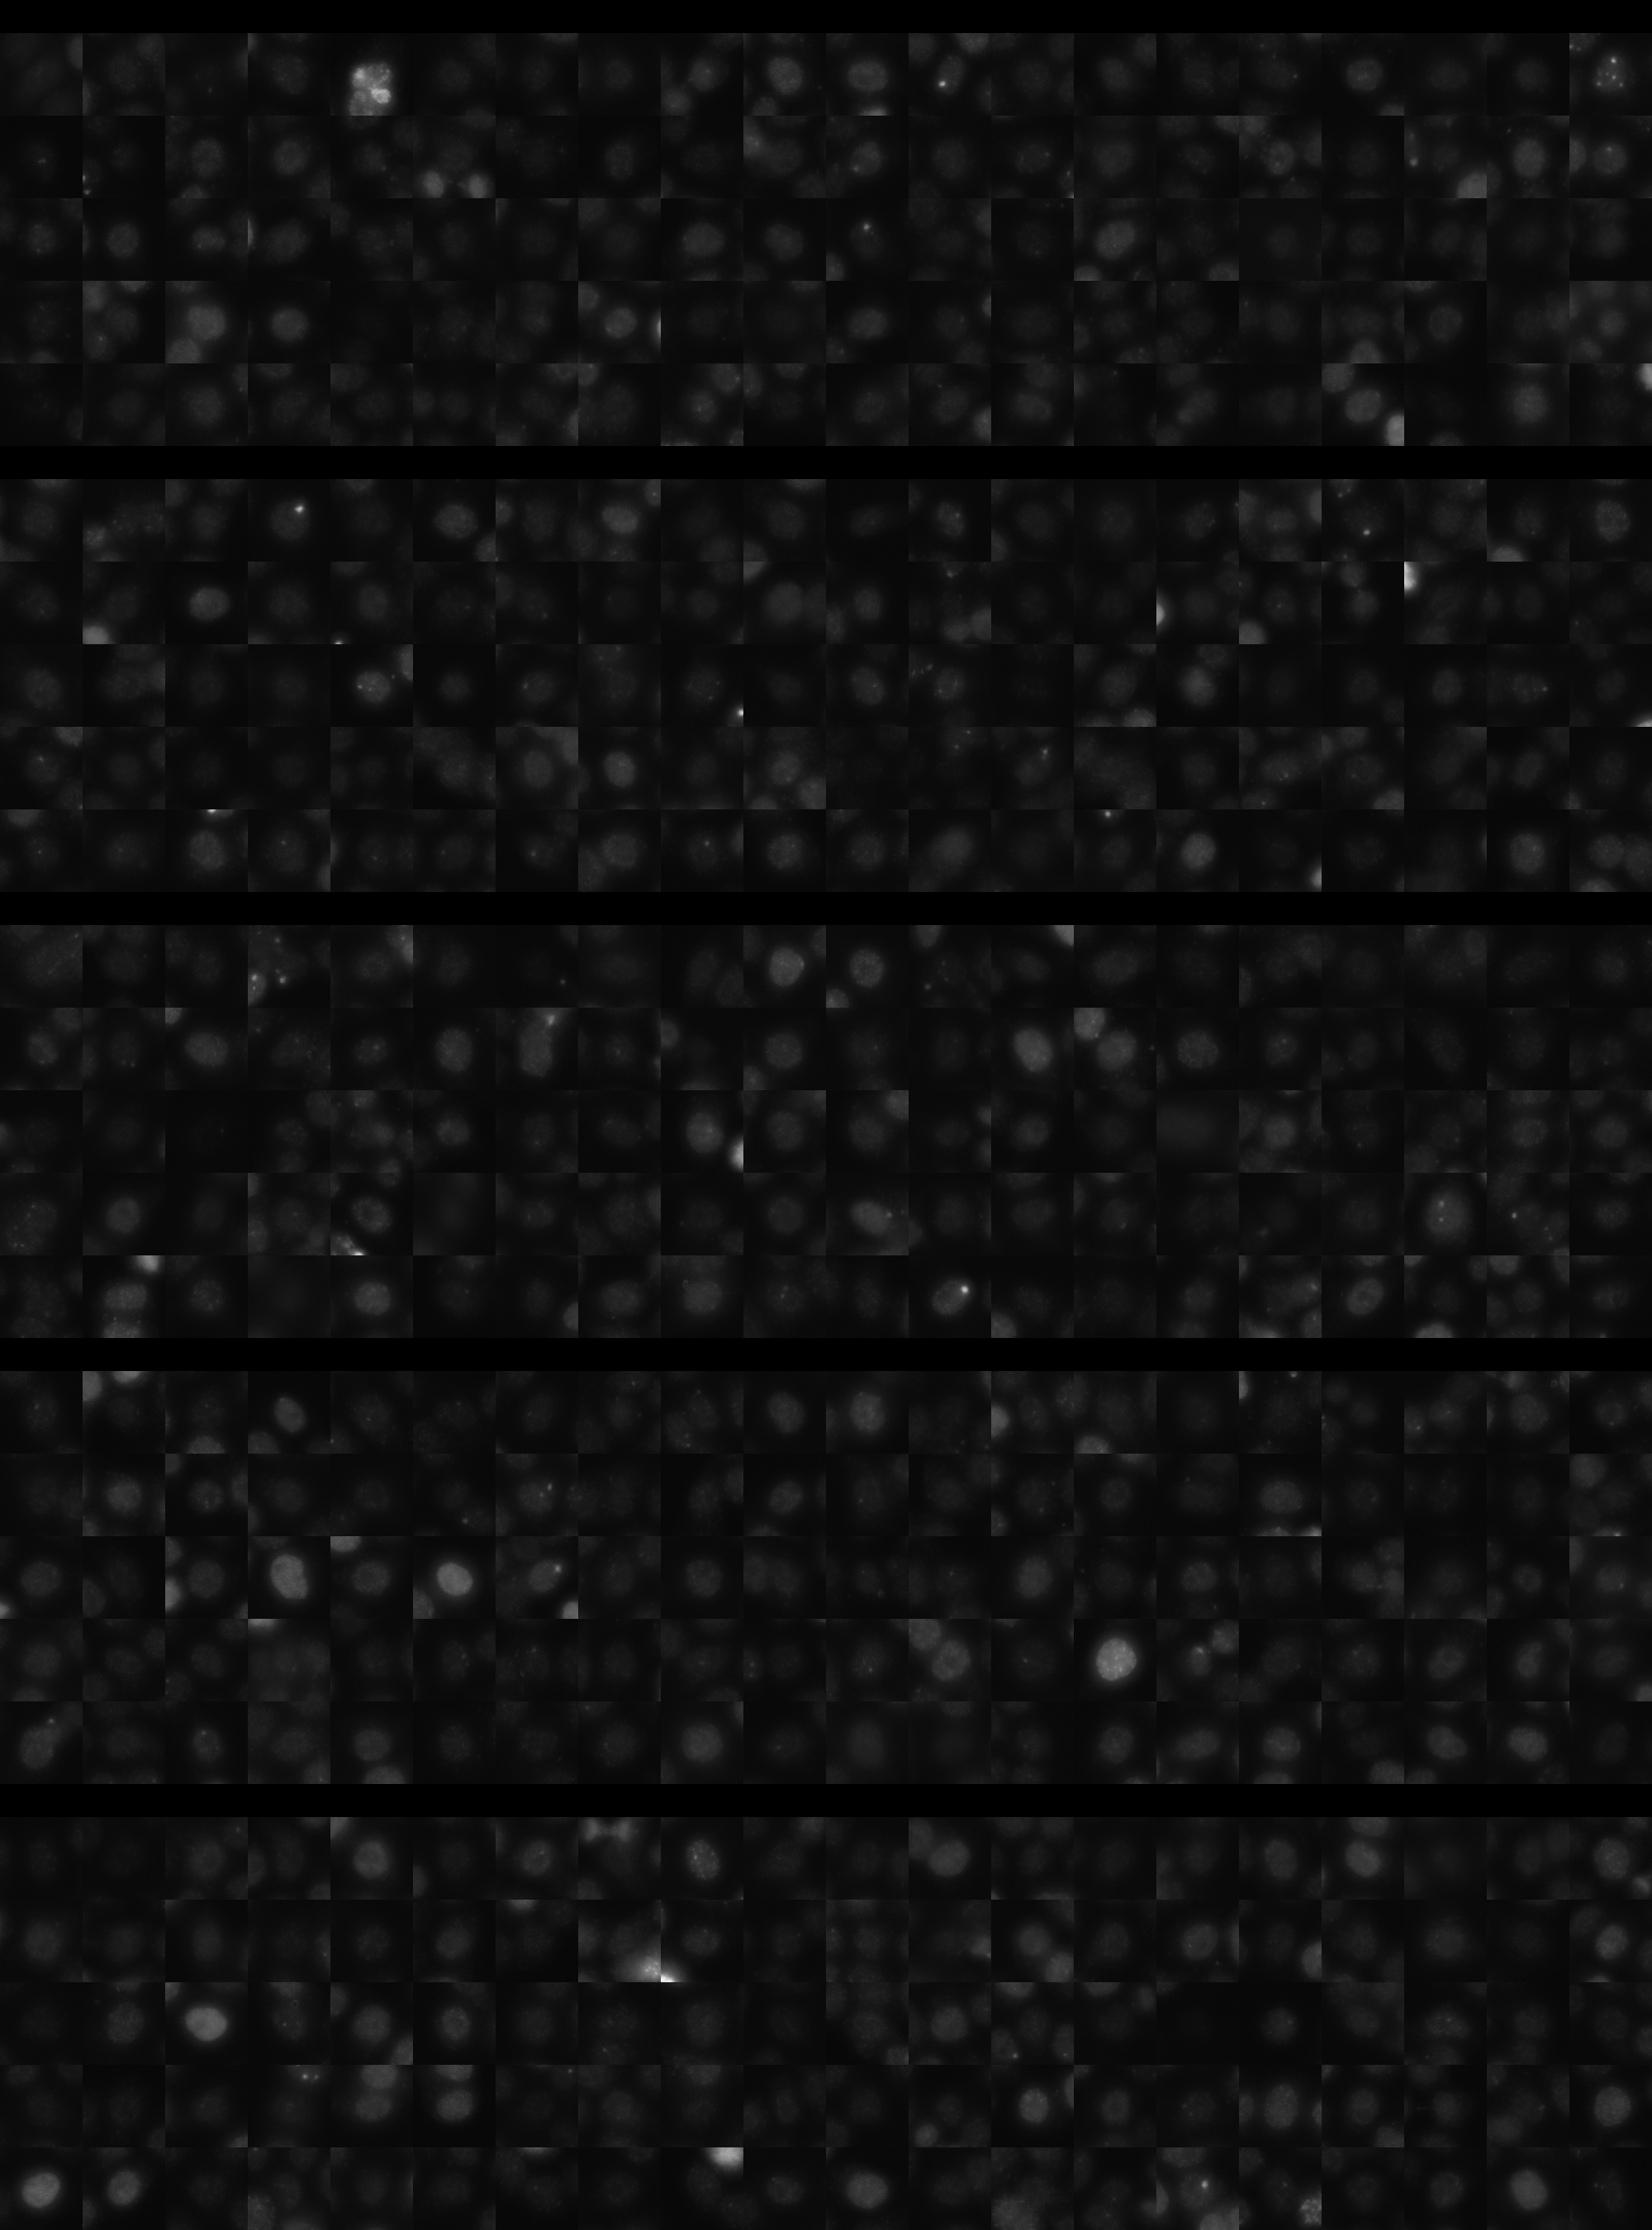
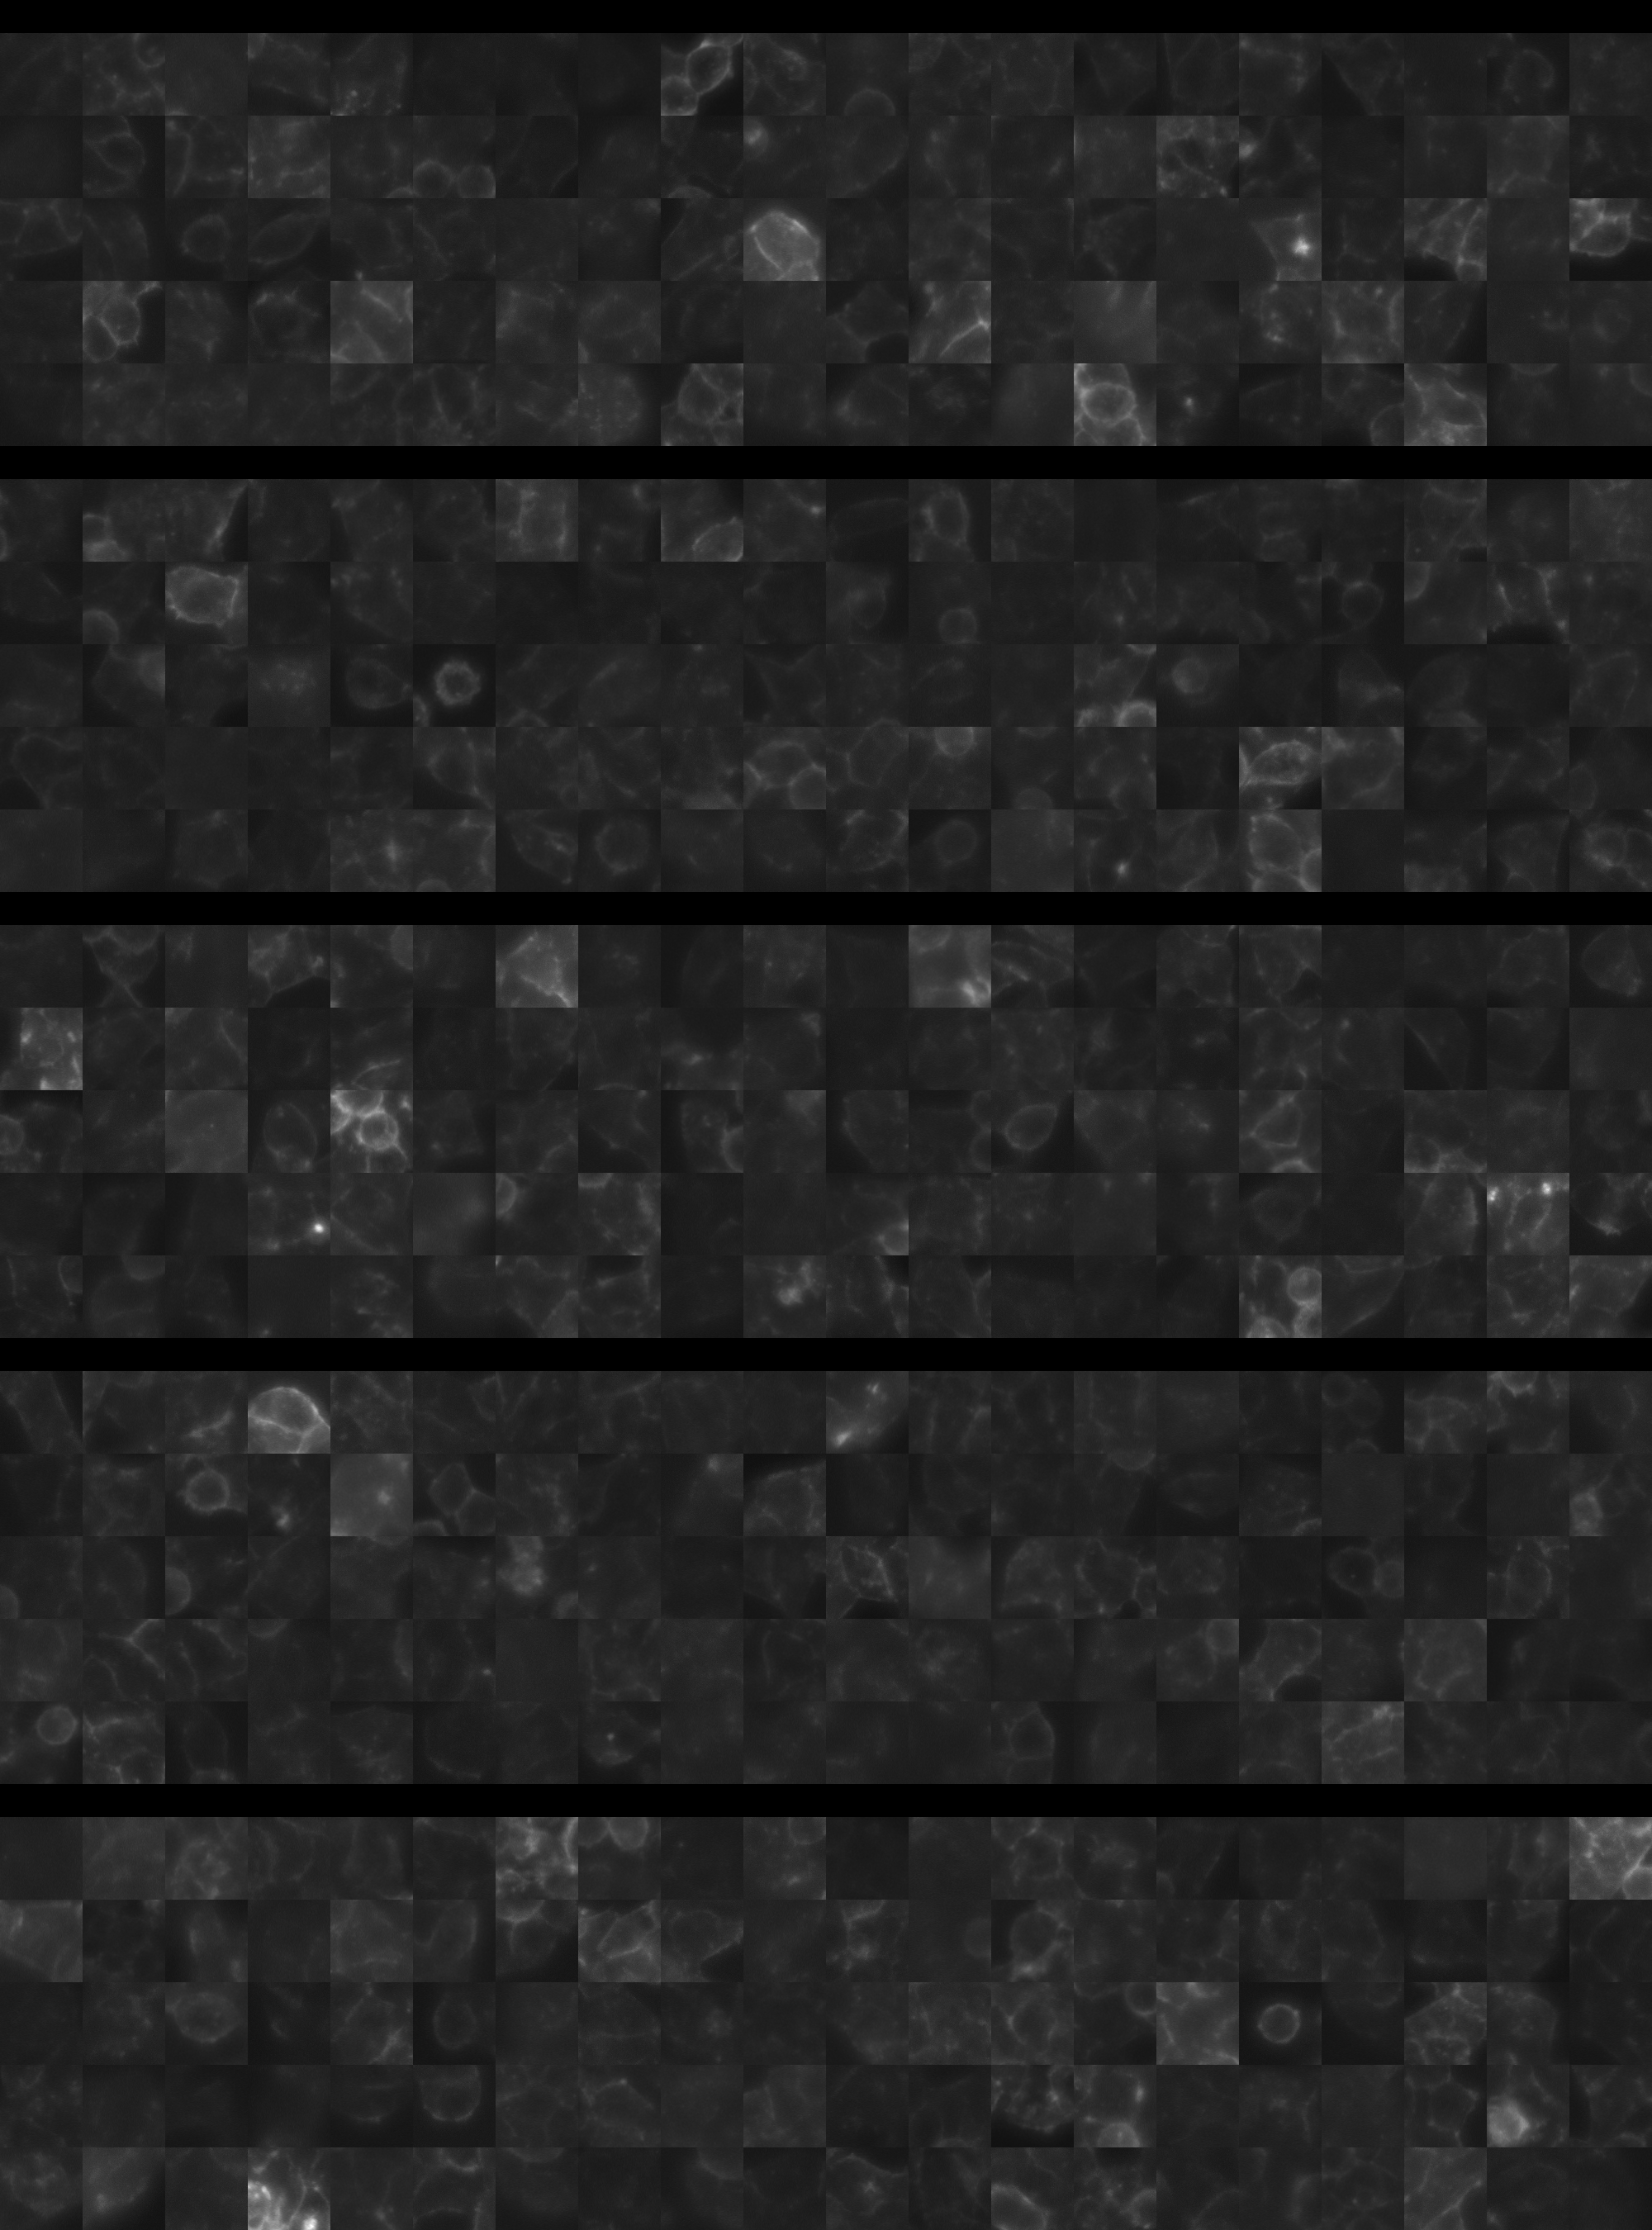
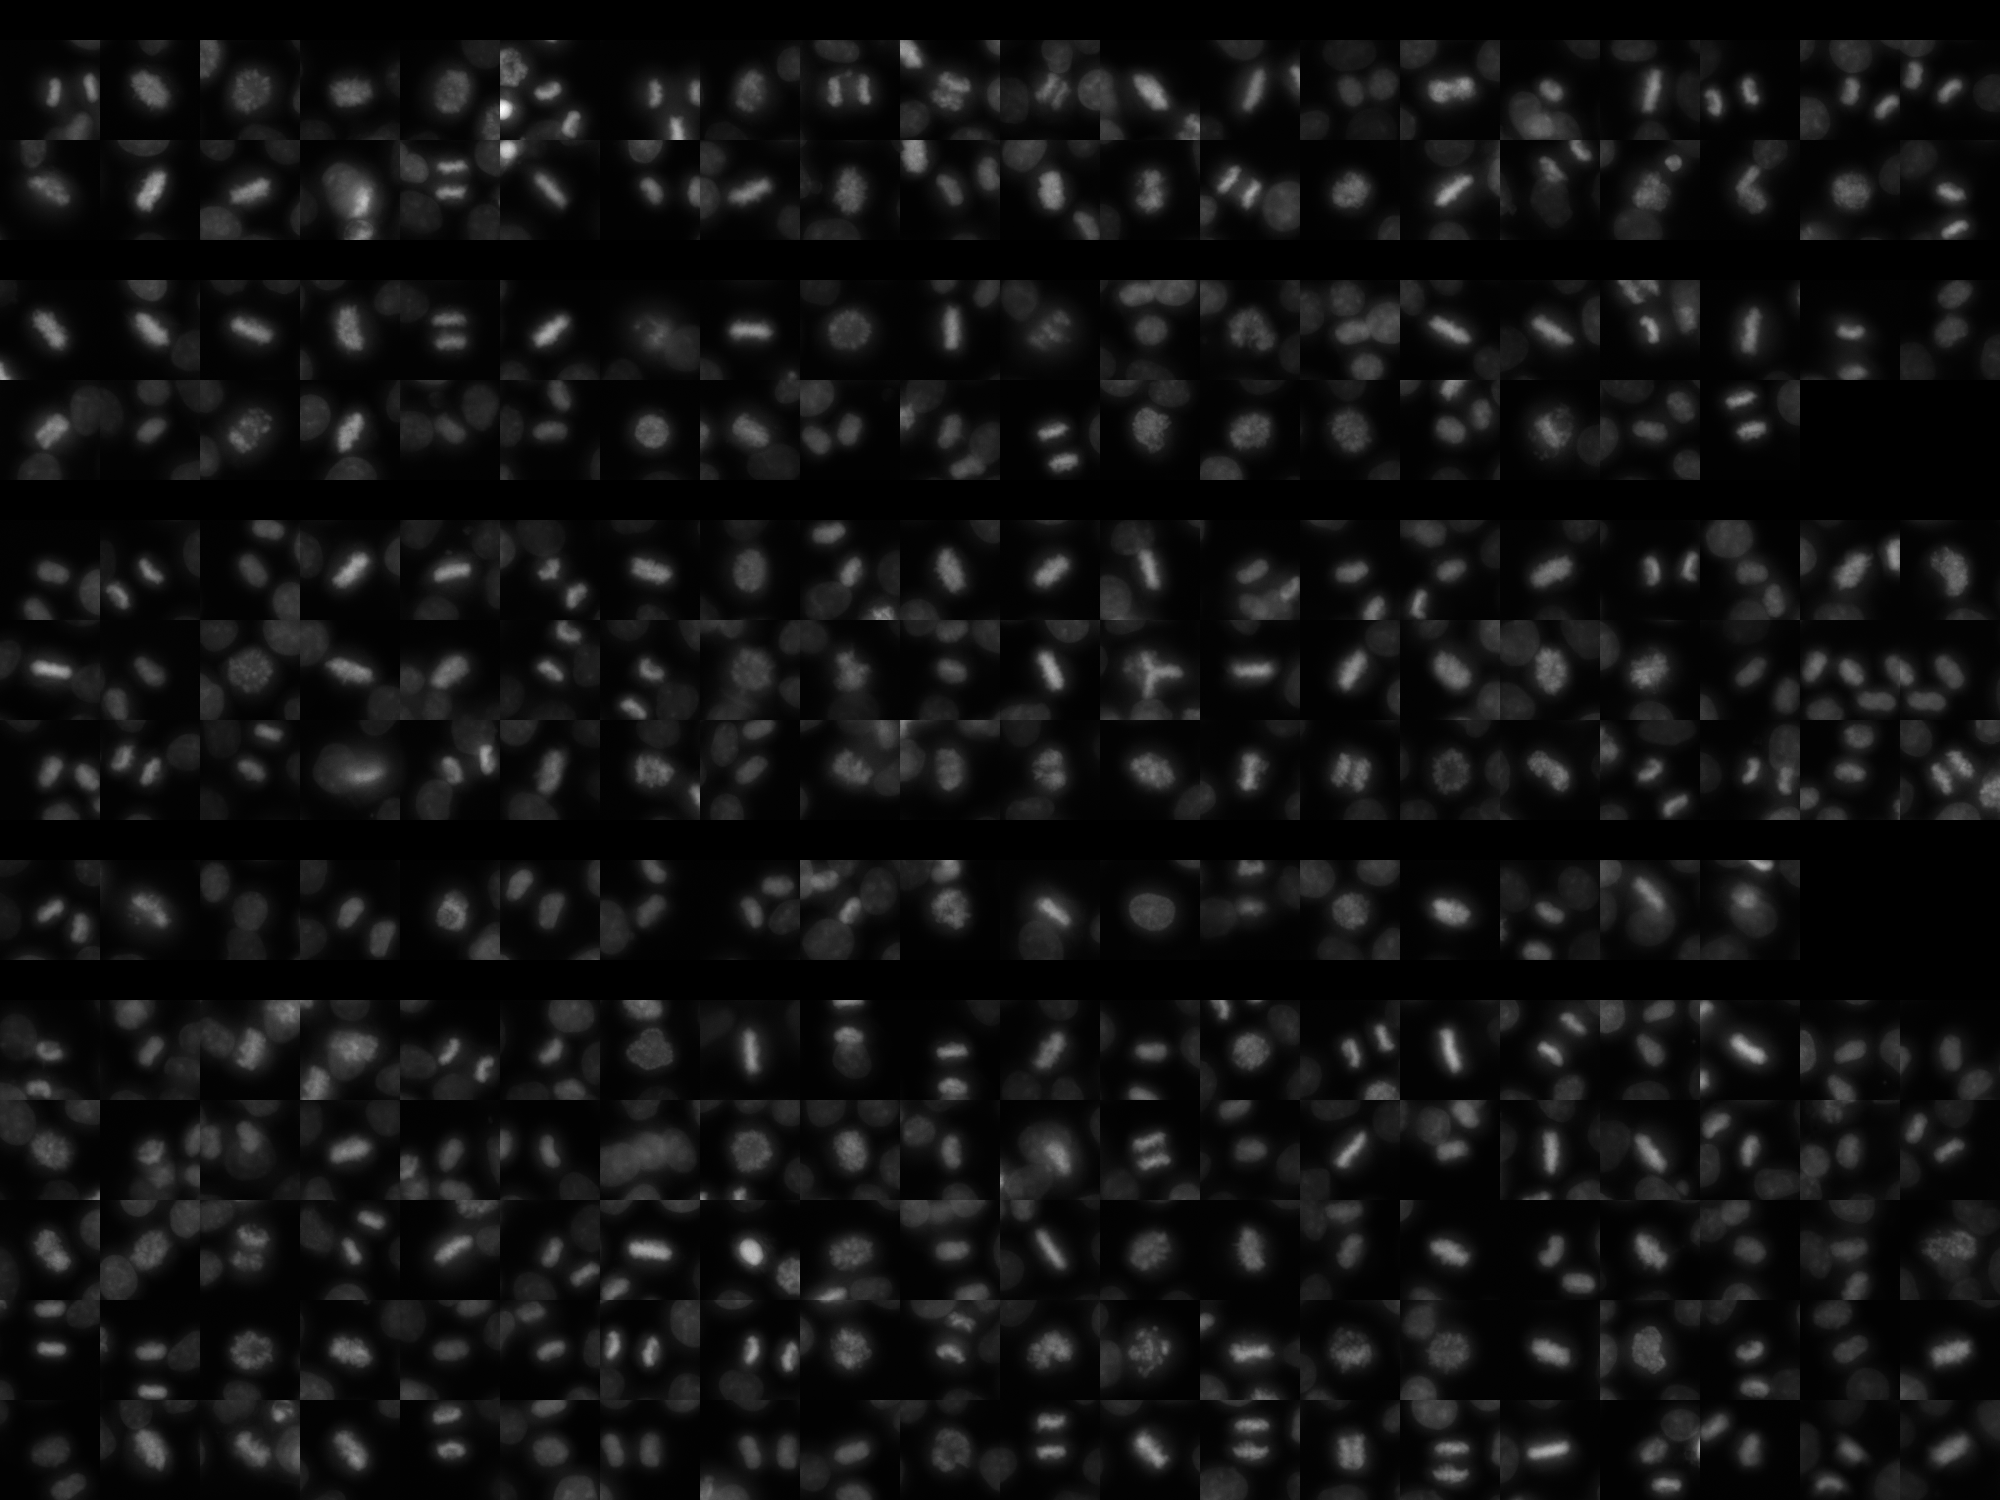
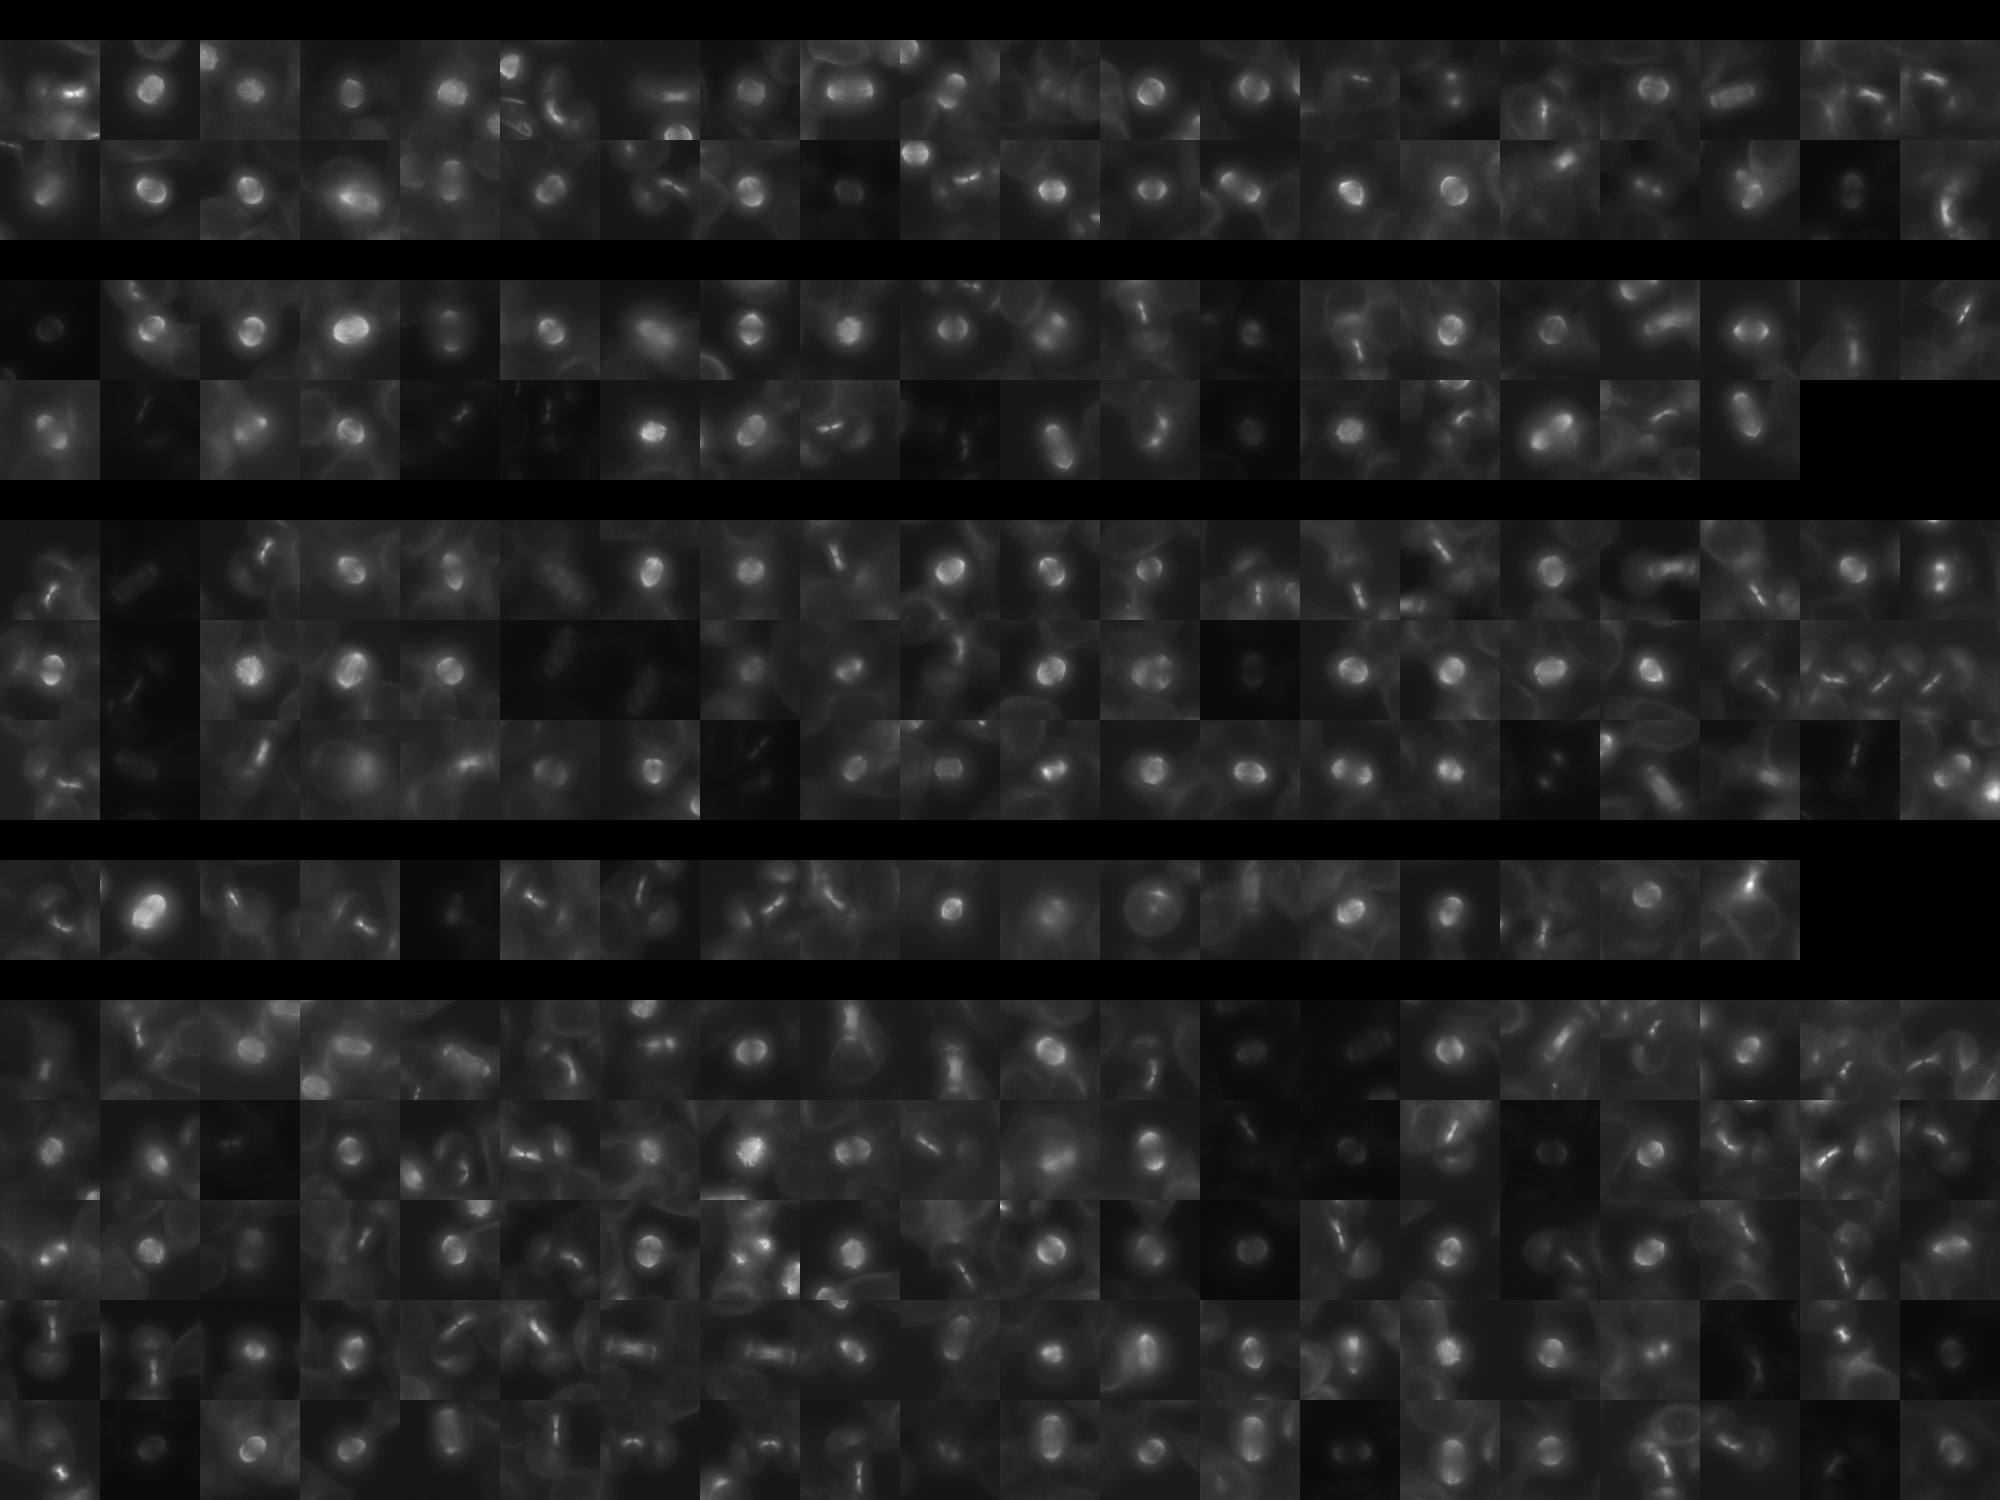
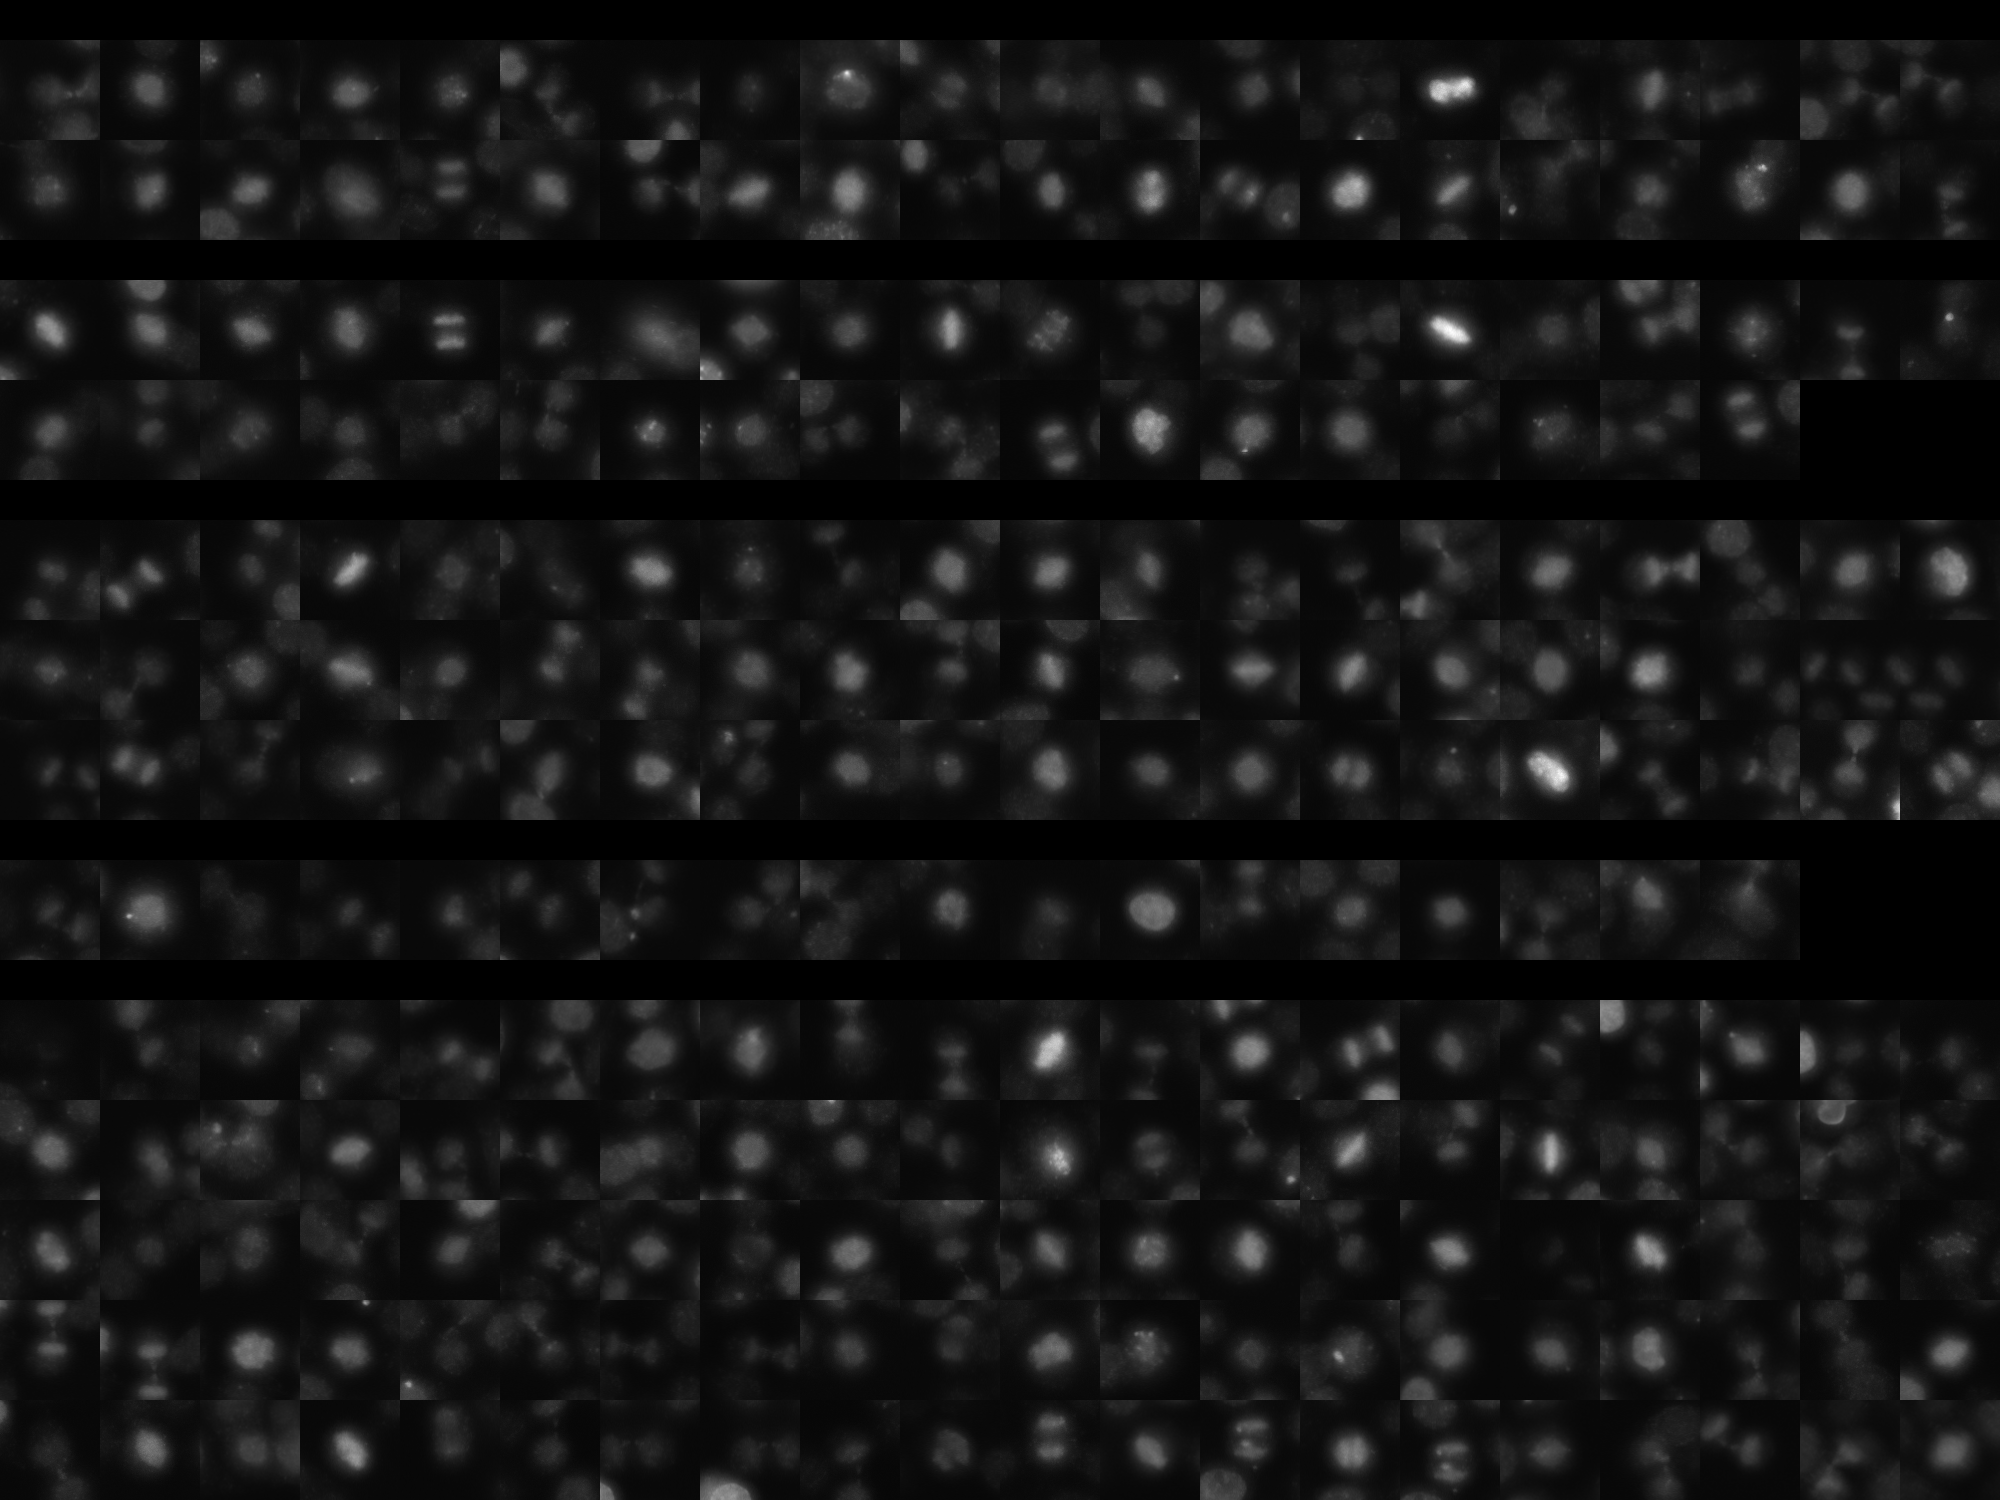
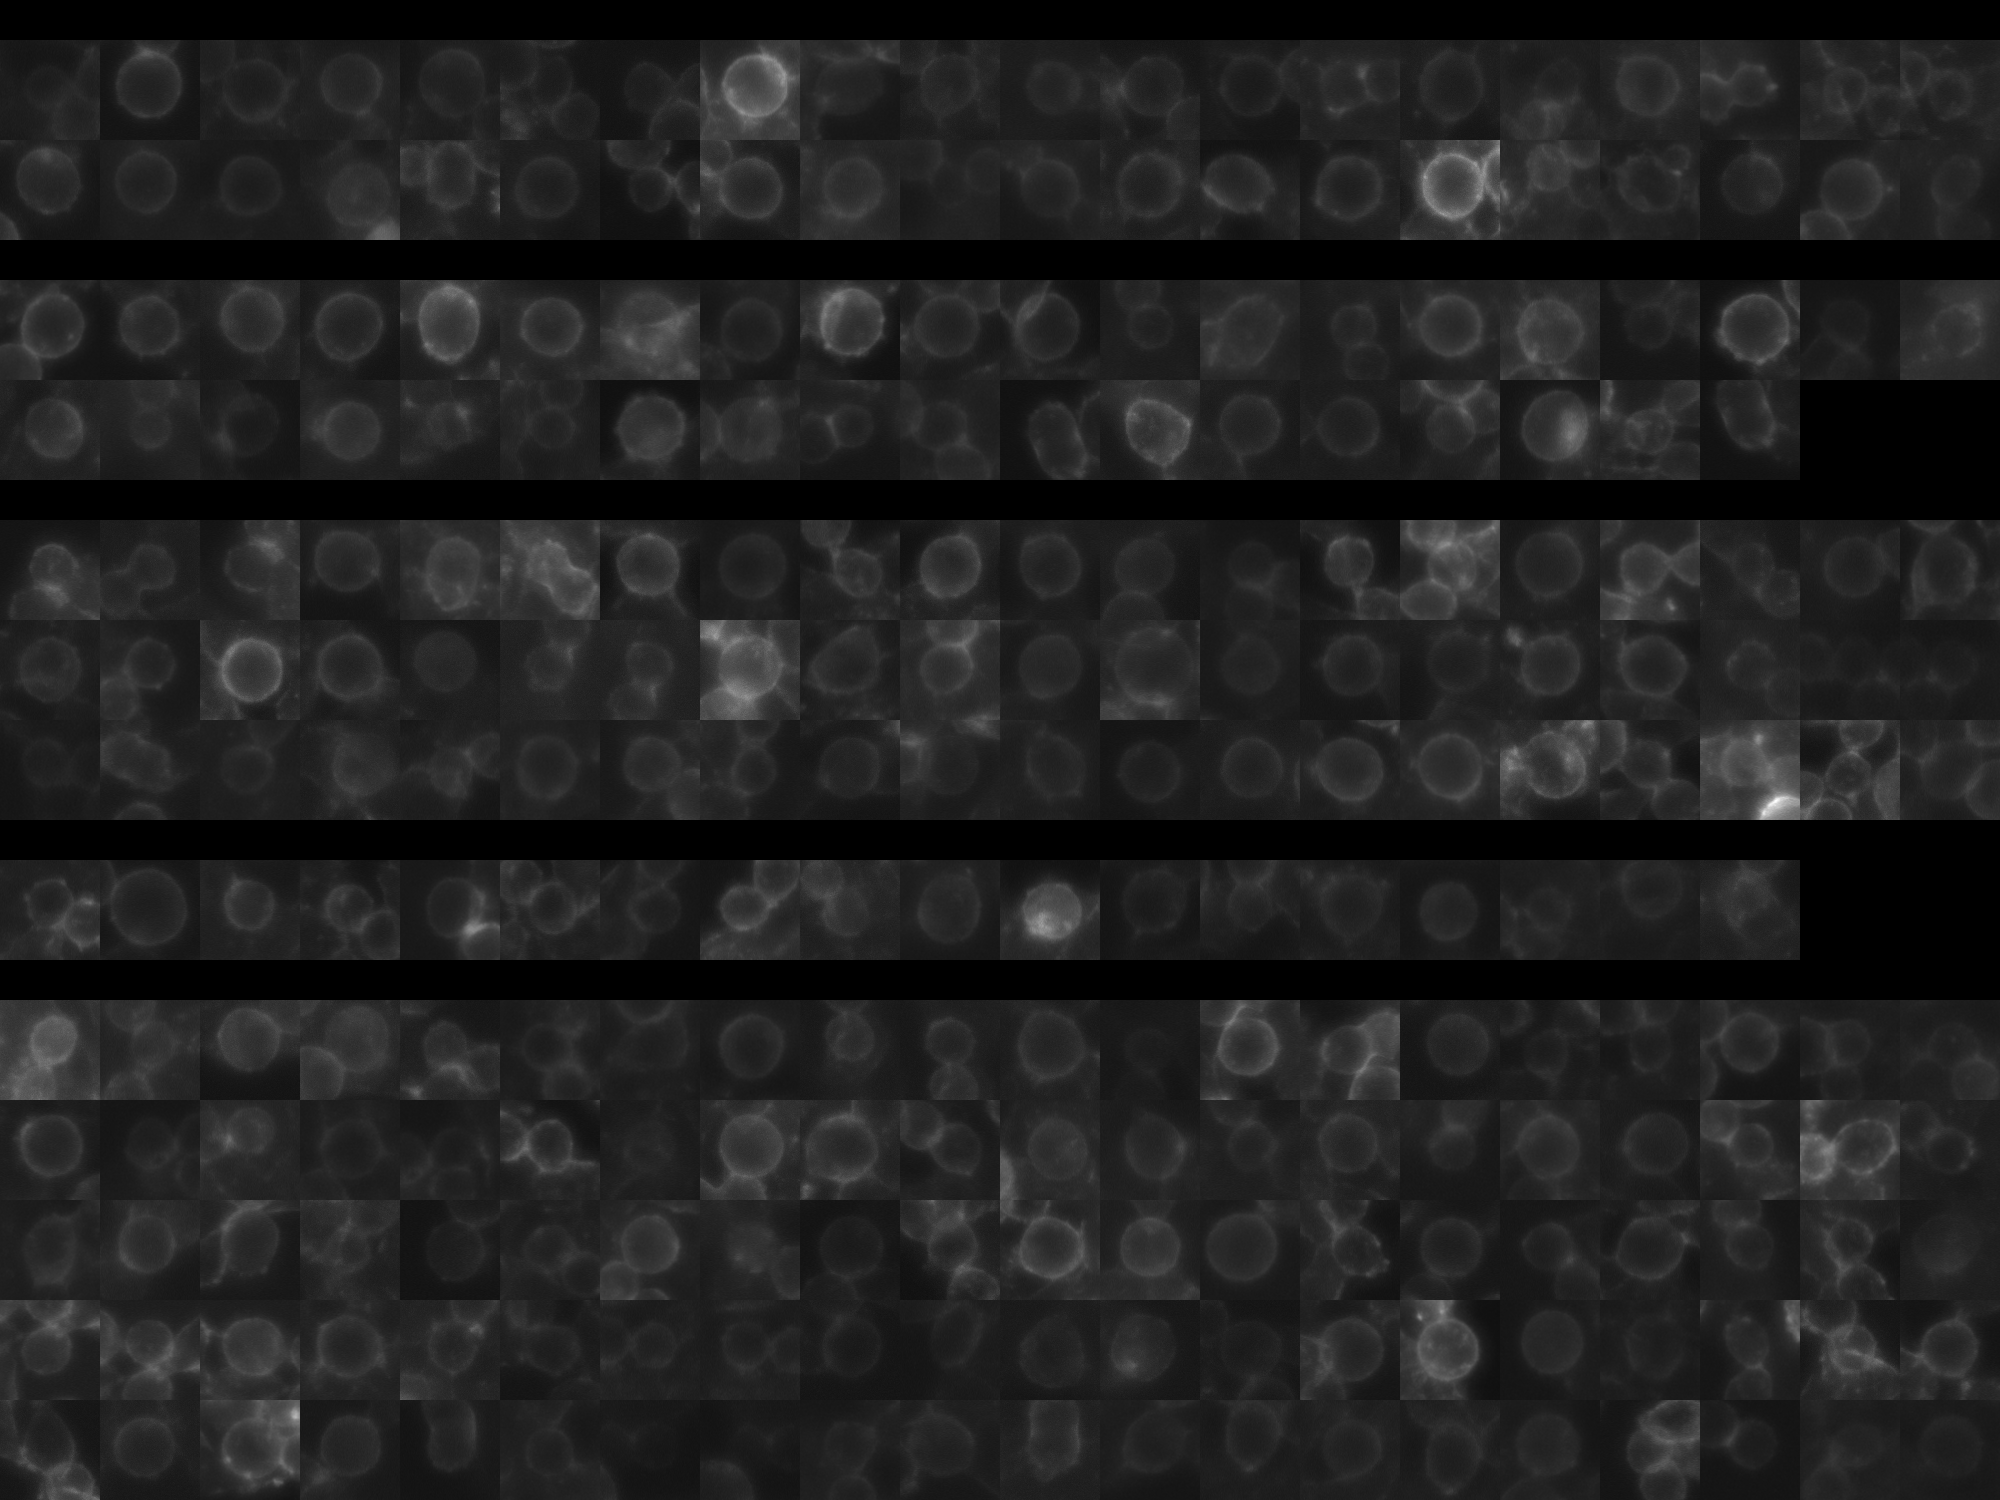
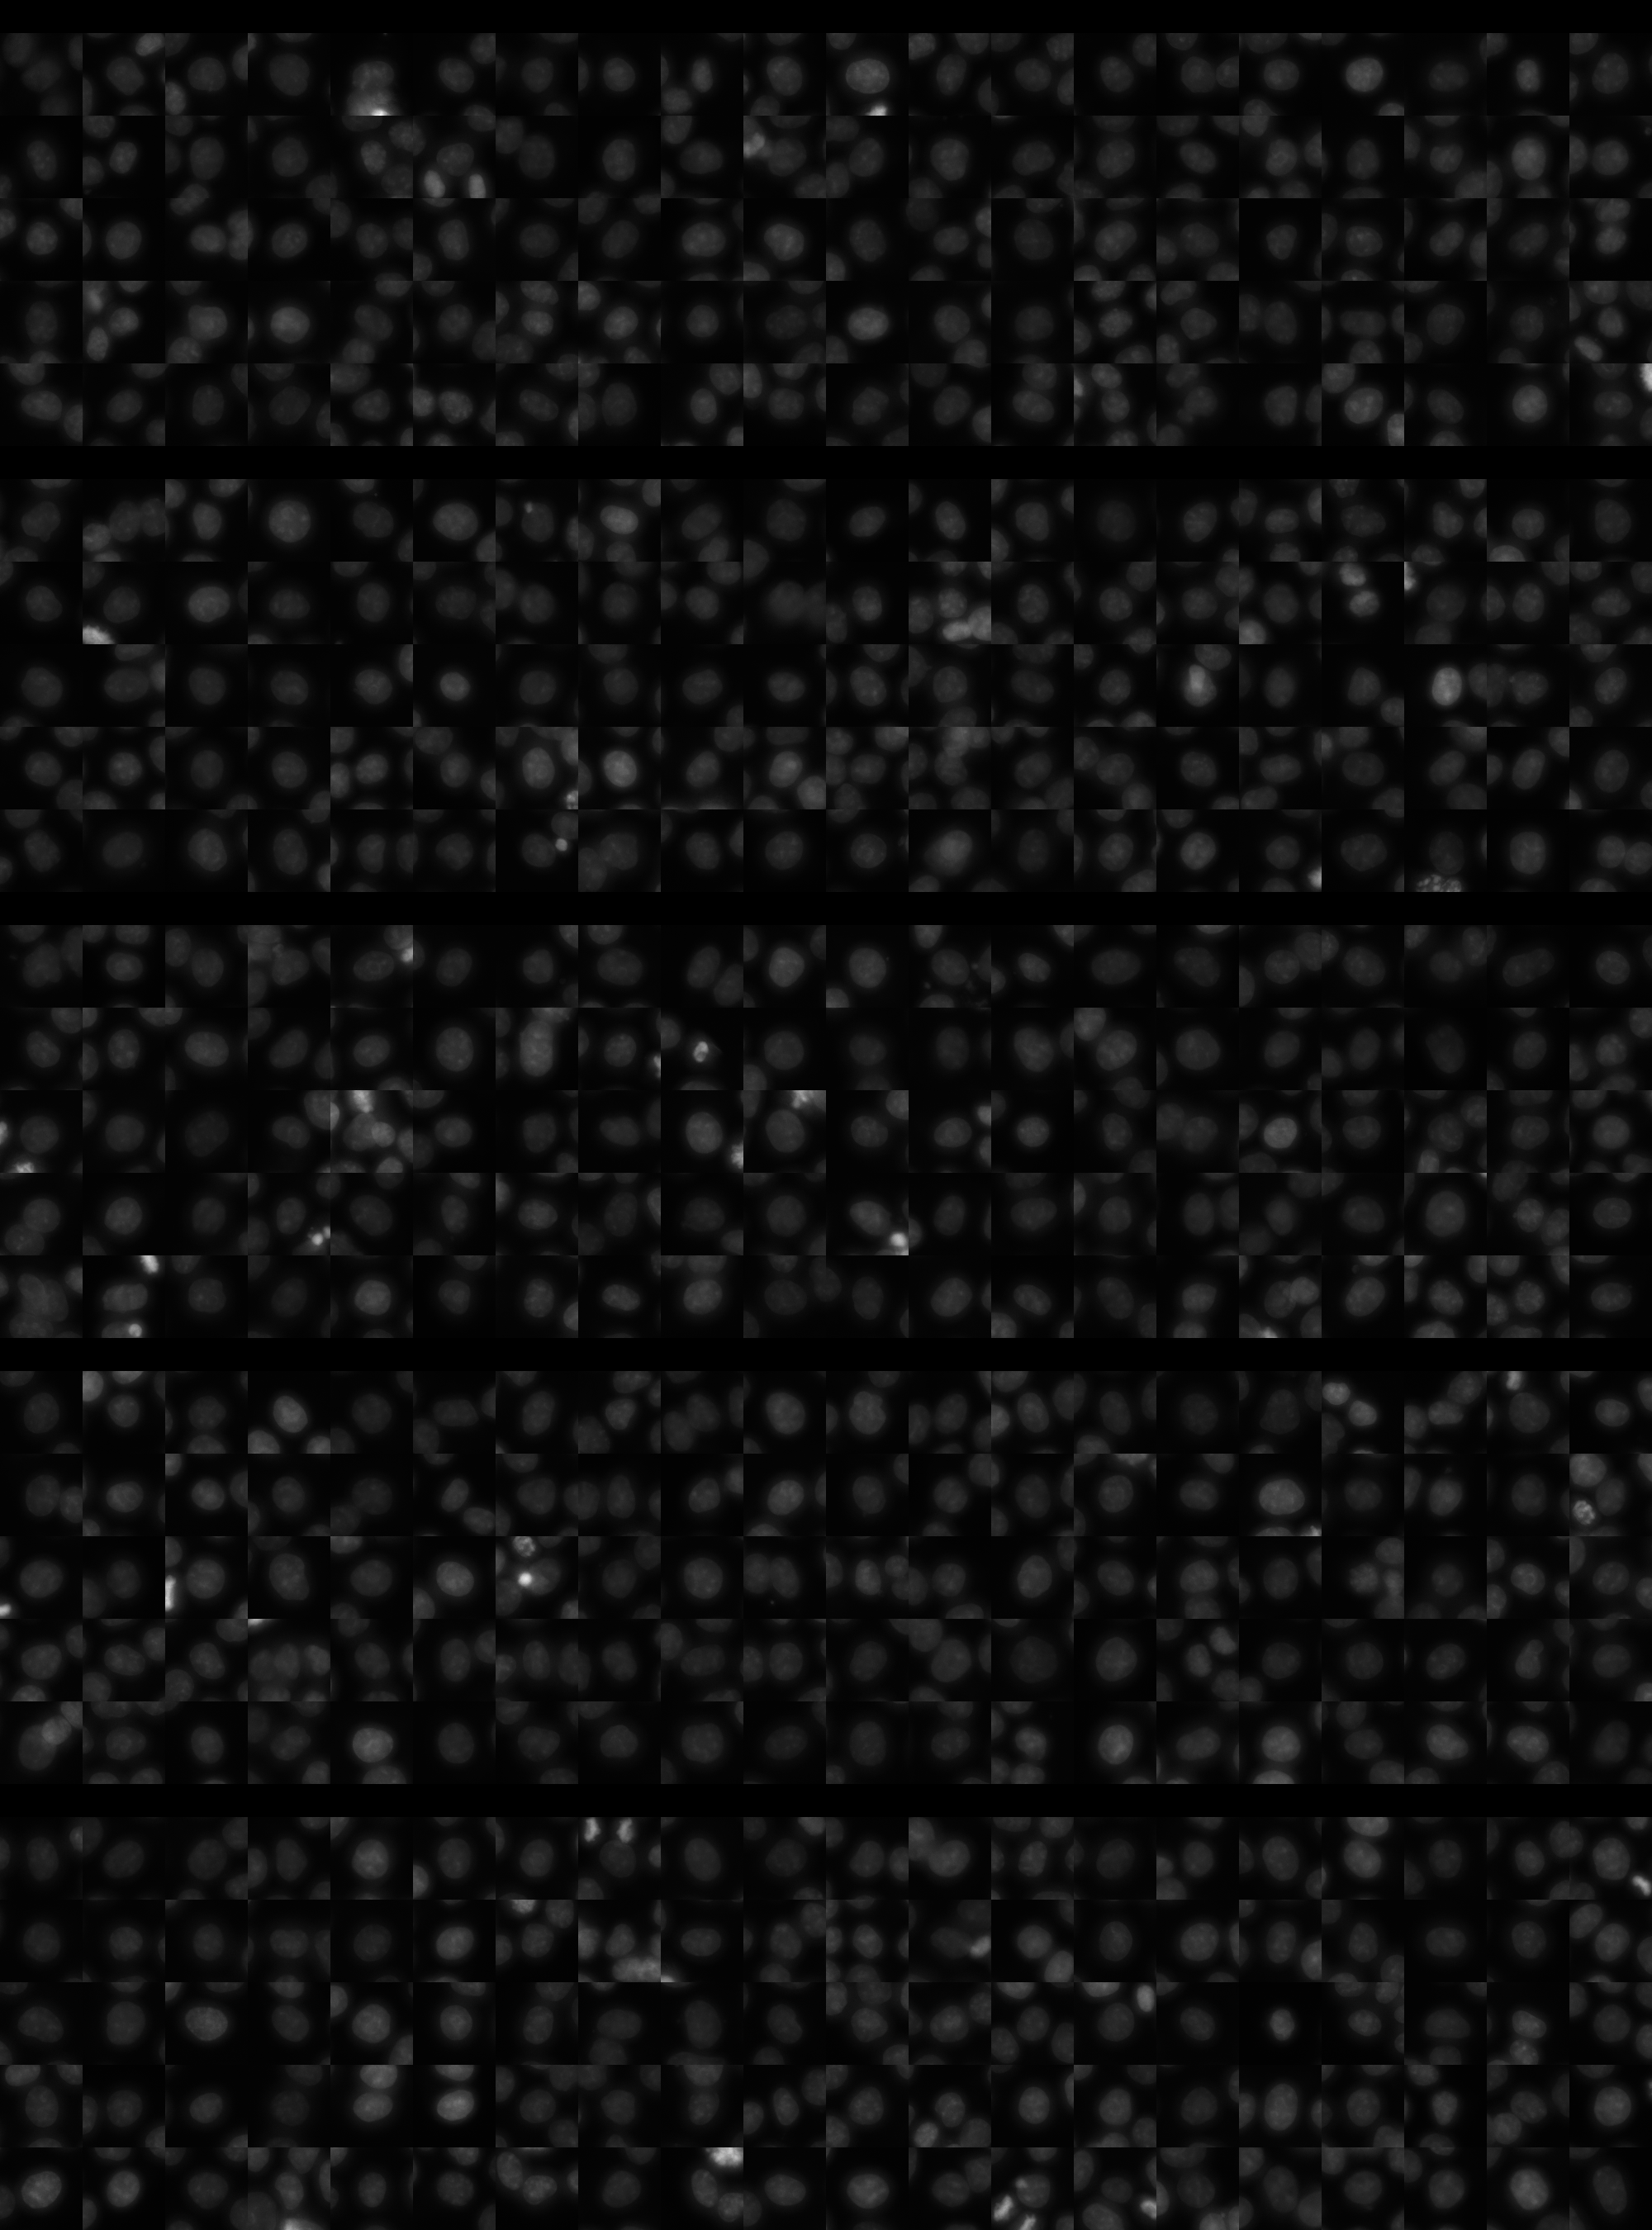
Each montage below shows randomly selected individual cell images for the same target gene separated by sgRNA, along with an example montage of cells expressing a non-targeting negative control sgRNA at the bottom. sgRNA labels in the montages correspond to the numbered sgRNA sequences in the gene info table above. The DNA (blue) and tubulin (green) channels are displayed by default, with gH2AX (grayscale) and actin (yellow) available using the check boxes. Channel brightness, contrast, and opacity are adjustable by clicking the arrow next to the channel name. When only one channel is selected, the display defaults to grayscale. Click the “Zoom” checkbox above the channel controls to enable image zooming (via scrolling) and panning (via click-and-drag).

The cell boxes displayed for this gene are square, 30.36 μm per side for the interphase montage and 30.36 μm per side for the mitotic montage.

Features

Interphase Score Rank FDR q-value
Nucleus DNA Integrated 0.012 2524 of 5322 0.912
Nucleus DNA Mean -6.654e-02 4015 of 5322 0.105
Nucleus gH2AX Mean 0.102 1896 of 5322 0.011
Nucleus DNA - gH2AX Correlation -7.689e-02 3334 of 5322 0.006
Nucleus Shape Area 0.081 967 of 5322 0.112
Nucleus Shape Eccentricity 0.066 555 of 5322 0.064
Nucleus Shape Form Factor -6.080e-02 3201 of 5322 0.109
Nucleus Shape Solidity -1.126e-02 977 of 5322 0.772
Cell DNA Mass Displacement 0.025 2653 of 5322 0.693
Cell Tubulin Mean -1.959e-02 3516 of 5322 0.754
Cell Tubulin Mass Displacement 0.008 2497 of 5322 0.916
Cell Actin Mean -1.189e-02 3387 of 5322 0.873
Cell Tubulin - Actin Correlation 0.011 3202 of 5322 0.829
Cell DNA - Tubulin Correlation -1.003e-02 4170 of 5322 0.825
Cell Shape Area 0.075 935 of 5322 0.179
Cell Shape Eccentricity 0.022 1956 of 5322 0.763
Mitotic Score Rank FDR q-value
Nucleus DNA Integrated -6.226e-03 4025 of 5322 0.996
Nucleus DNA Mean -1.302e-01 4567 of 5322 1.000
Nucleus DNA Mass Displacement -9.734e-02 4692 of 5322 0.999
Nucleus DNA Mean Frac 3 0.100 1582 of 5322 1.000
Nucleus gH2AX Mean 0.148 1144 of 5322 1.000
Nucleus gH2AX Mean Frac 0 -3.682e-02 2870 of 5322 1.000
Nucleus Tubulin Mean Frac 0 -3.327e-02 3958 of 5322 0.999
Nucleus Tubulin Mean Edge 0.155 1219 of 5322 0.999
Nucleus Tubulin Std Edge 0.099 1281 of 5322 0.999
Nucleus Shape Area 0.060 3203 of 5322 0.990
Nucleus Shape Eccentricity -5.727e-02 2987 of 5322 1.000
Nucleus Shape Form Factor 0.022 1115 of 5322 0.998
Cell Tubulin Mean 0.042 2926 of 5322 0.997
Cell Tubulin Mean Frac 3 -1.544e-01 3593 of 5322 0.999
Cell Actin Mean 0.018 2971 of 5322 0.999
Cell Shape Area 0.094 2703 of 5322 0.998
( Reset Zoom )
Brightness
Contrast
Opacity
Brightness
Contrast
Opacity
Brightness
Contrast
Opacity
Brightness
Contrast
Opacity
Brightness
Contrast
Opacity

( Reset Zoom )
Brightness
Contrast
Opacity
Brightness
Contrast
Opacity
Brightness
Contrast
Opacity
Brightness
Contrast
Opacity
Brightness
Contrast
Opacity

MIT Central Accessability