PPP2R2A

Gene symbol: PPP2R2A
Gene: 5520
Uniprot Function: The B regulatory subunit might modulate substrate selectivity and catalytic activity, and also might direct the localization of the catalytic enzyme to a particular subcellular compartment. Essential for serine/threonine-protein phosphatase 2A-mediated dephosphorylation of WEE1, preventing its ubiquitin-mediated proteolysis, increasing WEE1 protein levels, and promoting the G2/M checkpoint (PubMed:33108758).
Mitotic Index 0.0267
Interphase Cluster: #220 (6 genes)
Mitotic Cluster: #53 (29 genes)
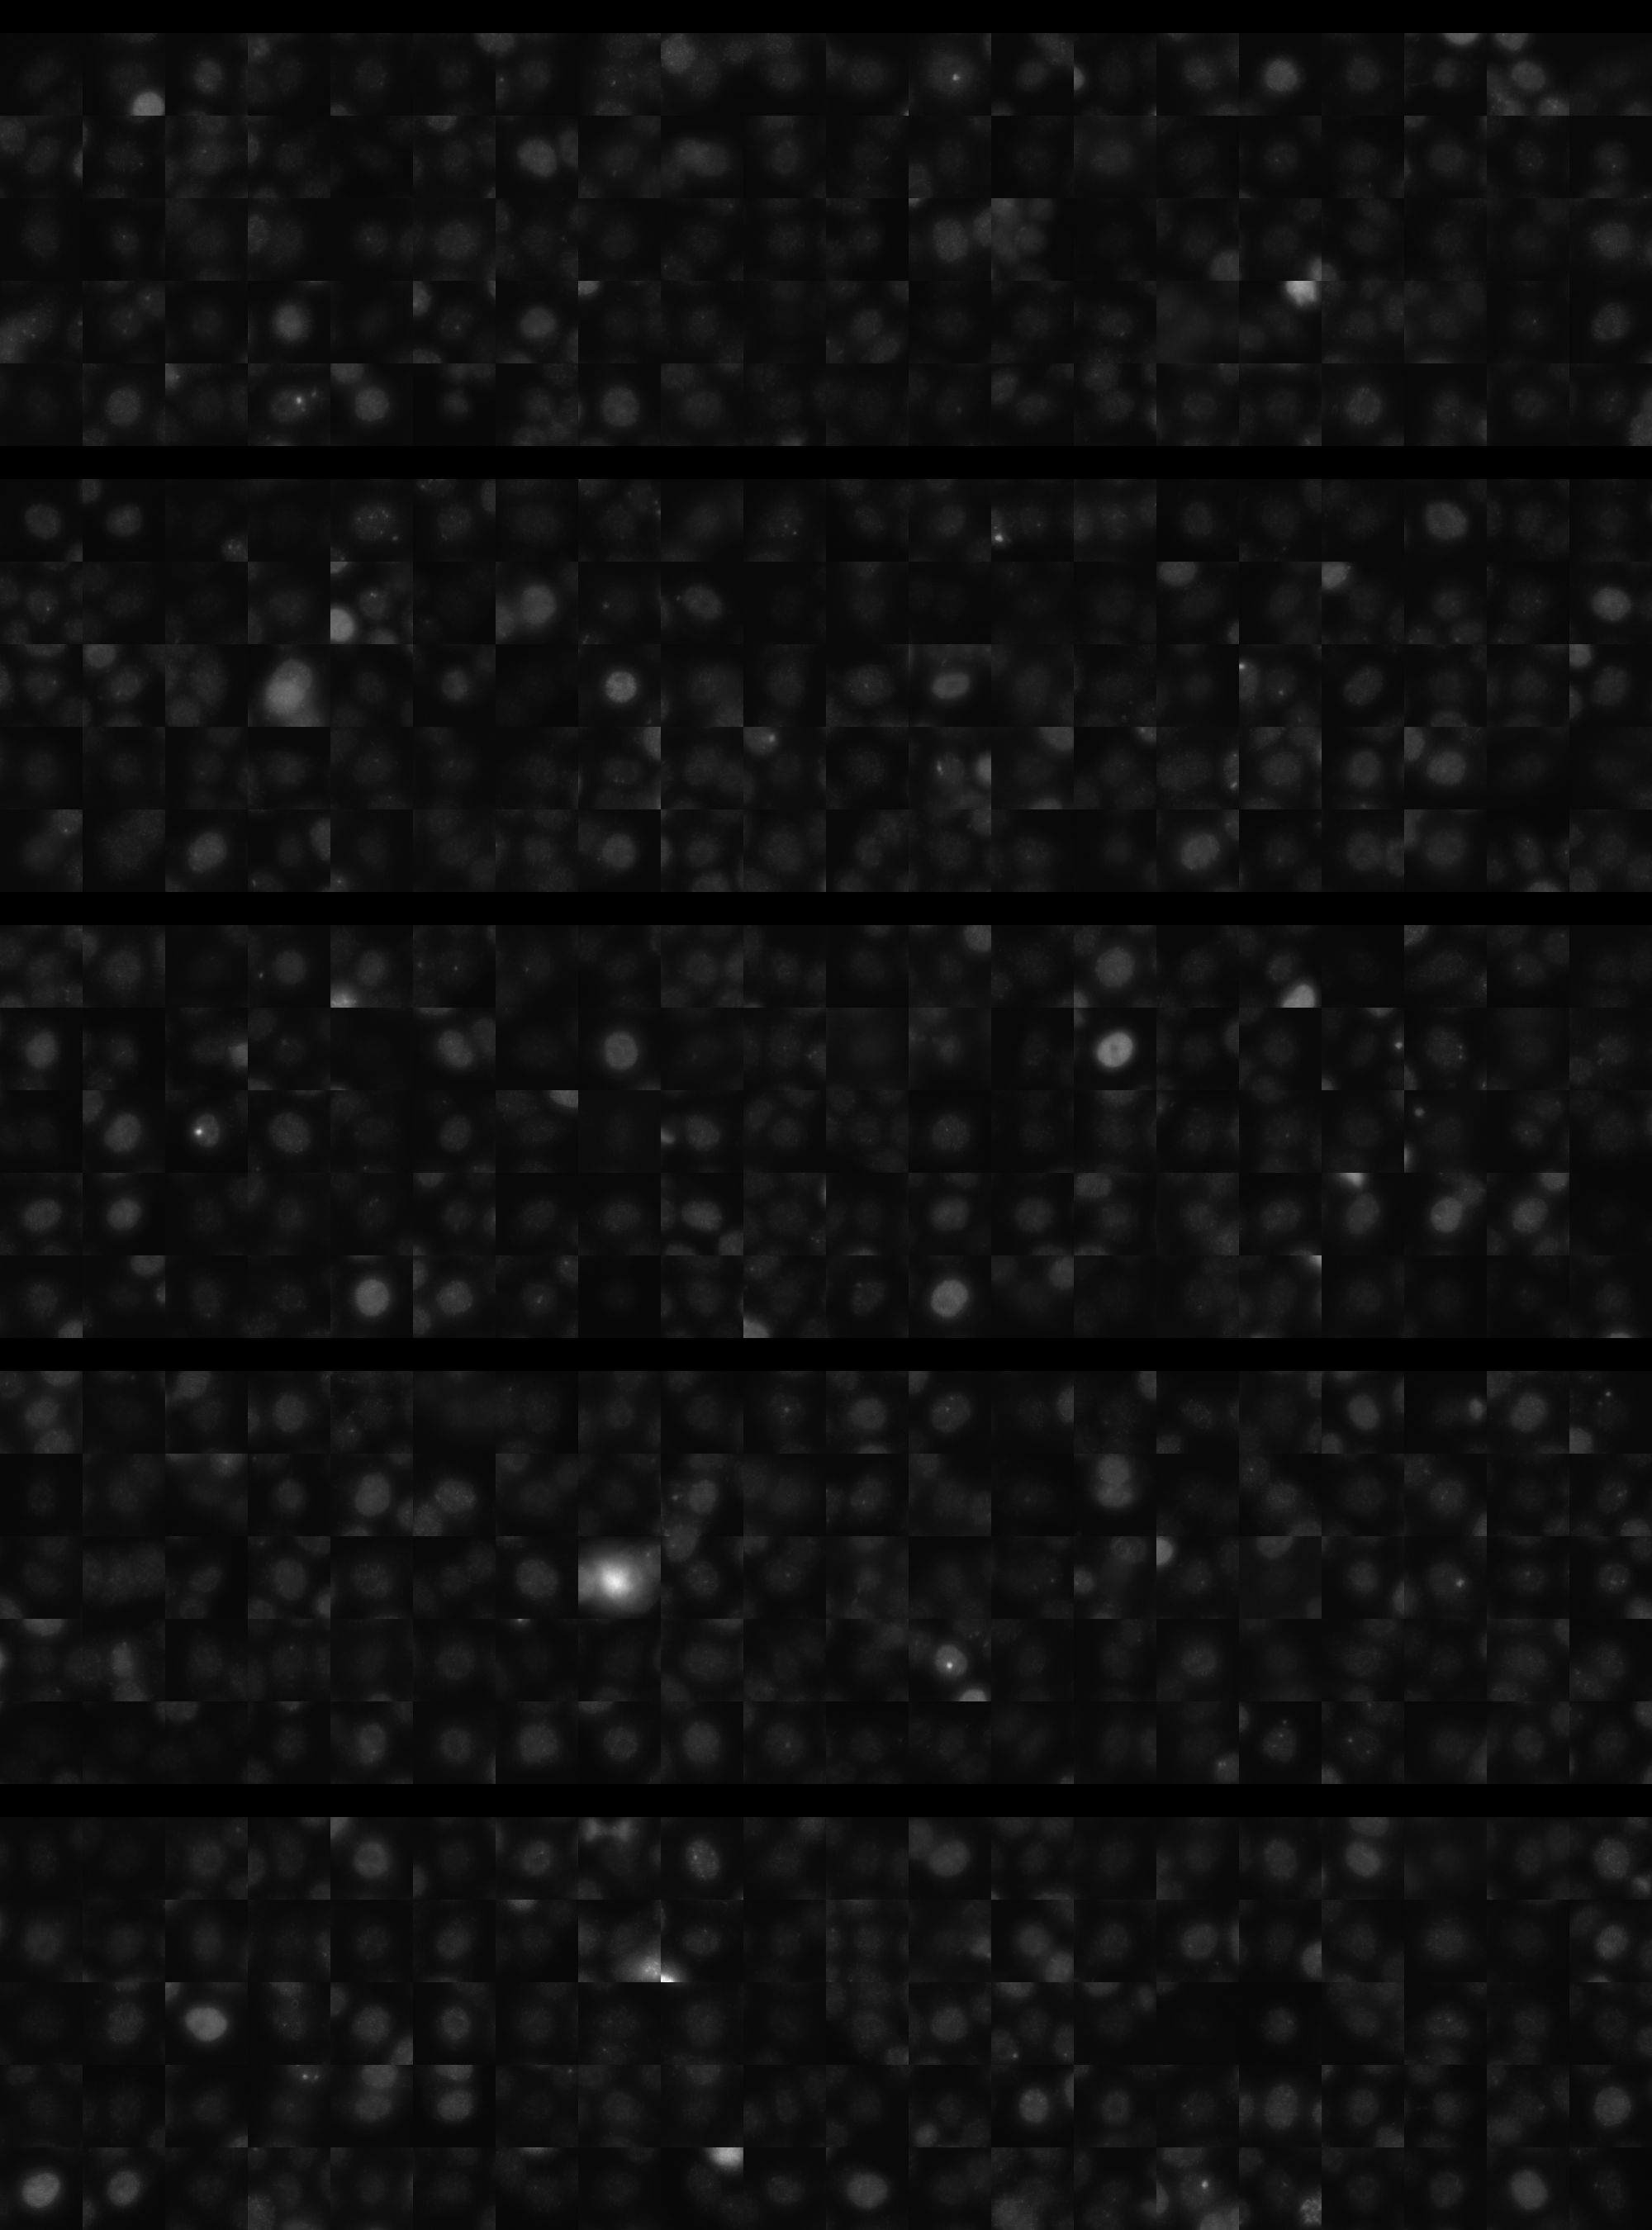
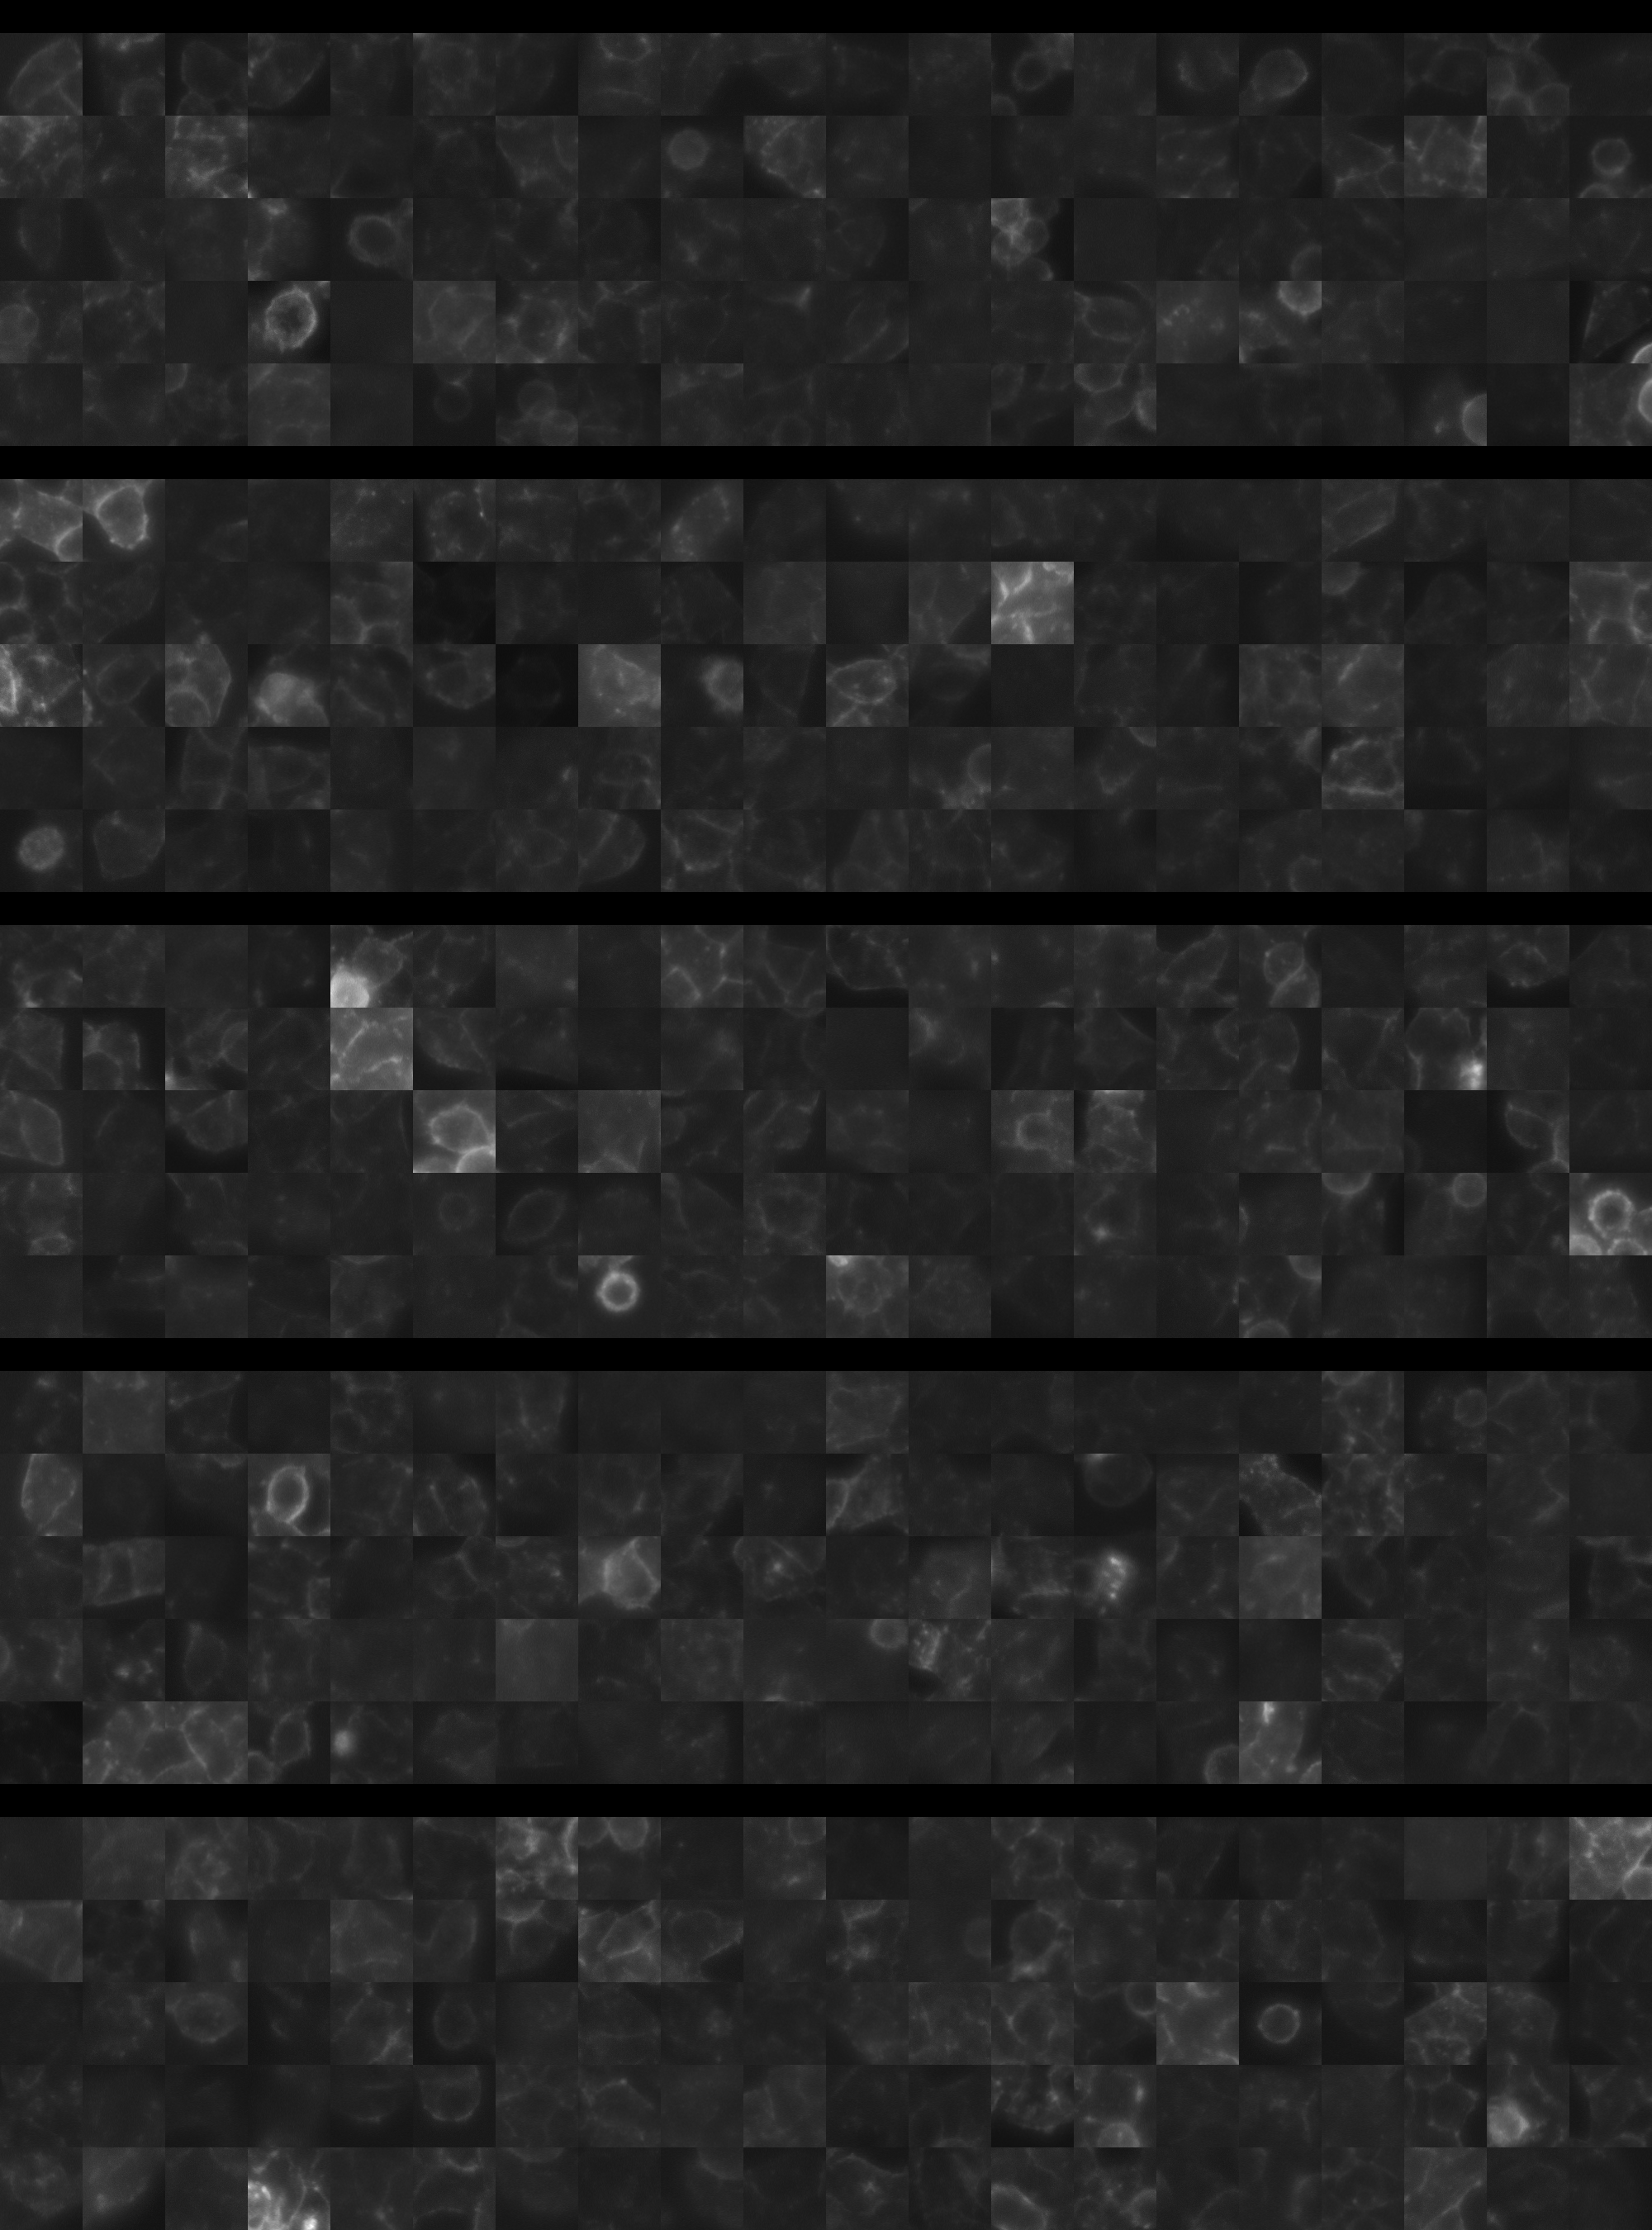
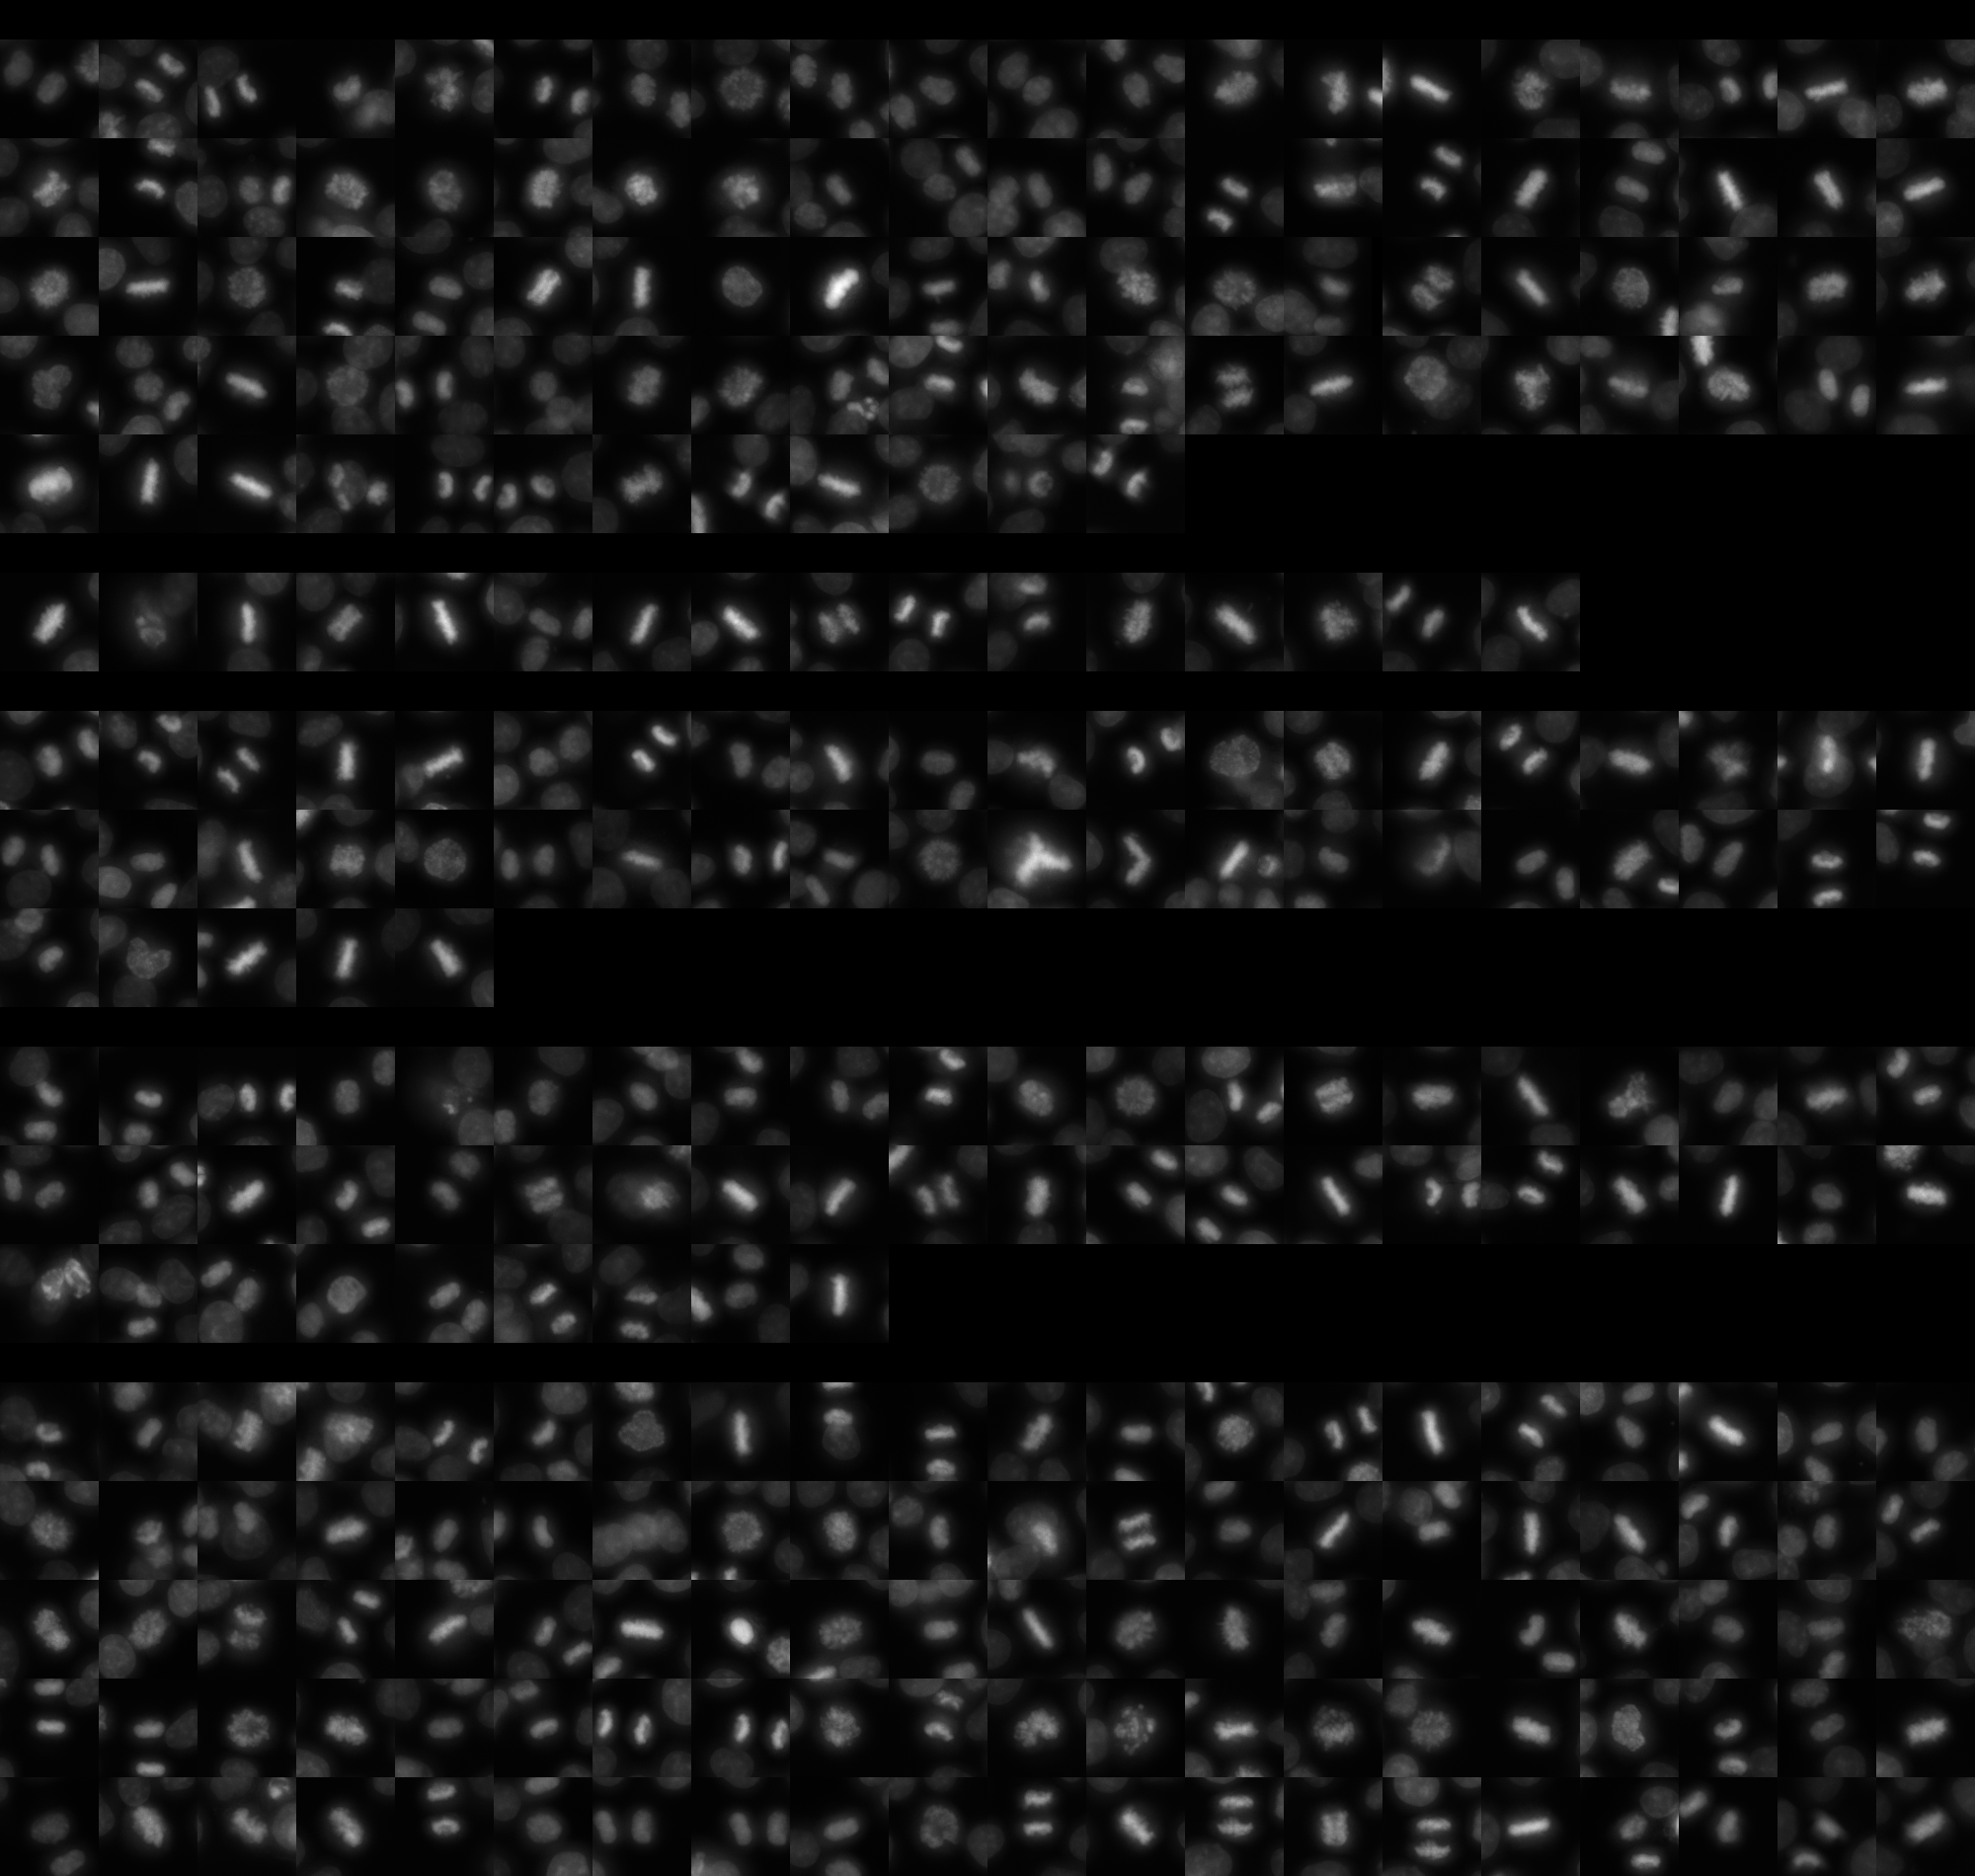
sgRNA 1: AAAATCCAGTCTCATAGCAG (interphase cells: 3121, mitotic cells: 92)
sgRNA 2: AGGGTATAACTTGAAAGAGG (interphase cells: 1043, mitotic cells: 16)
sgRNA 3: GTAGATGATGATGTAGCAGA (interphase cells: 1578, mitotic cells: 45)
sgRNA 4: TATTCGGCTATGTGACATGA (interphase cells: 1629, mitotic cells: 49)

Interphase Cluster

Mitotic Cluster

Overview

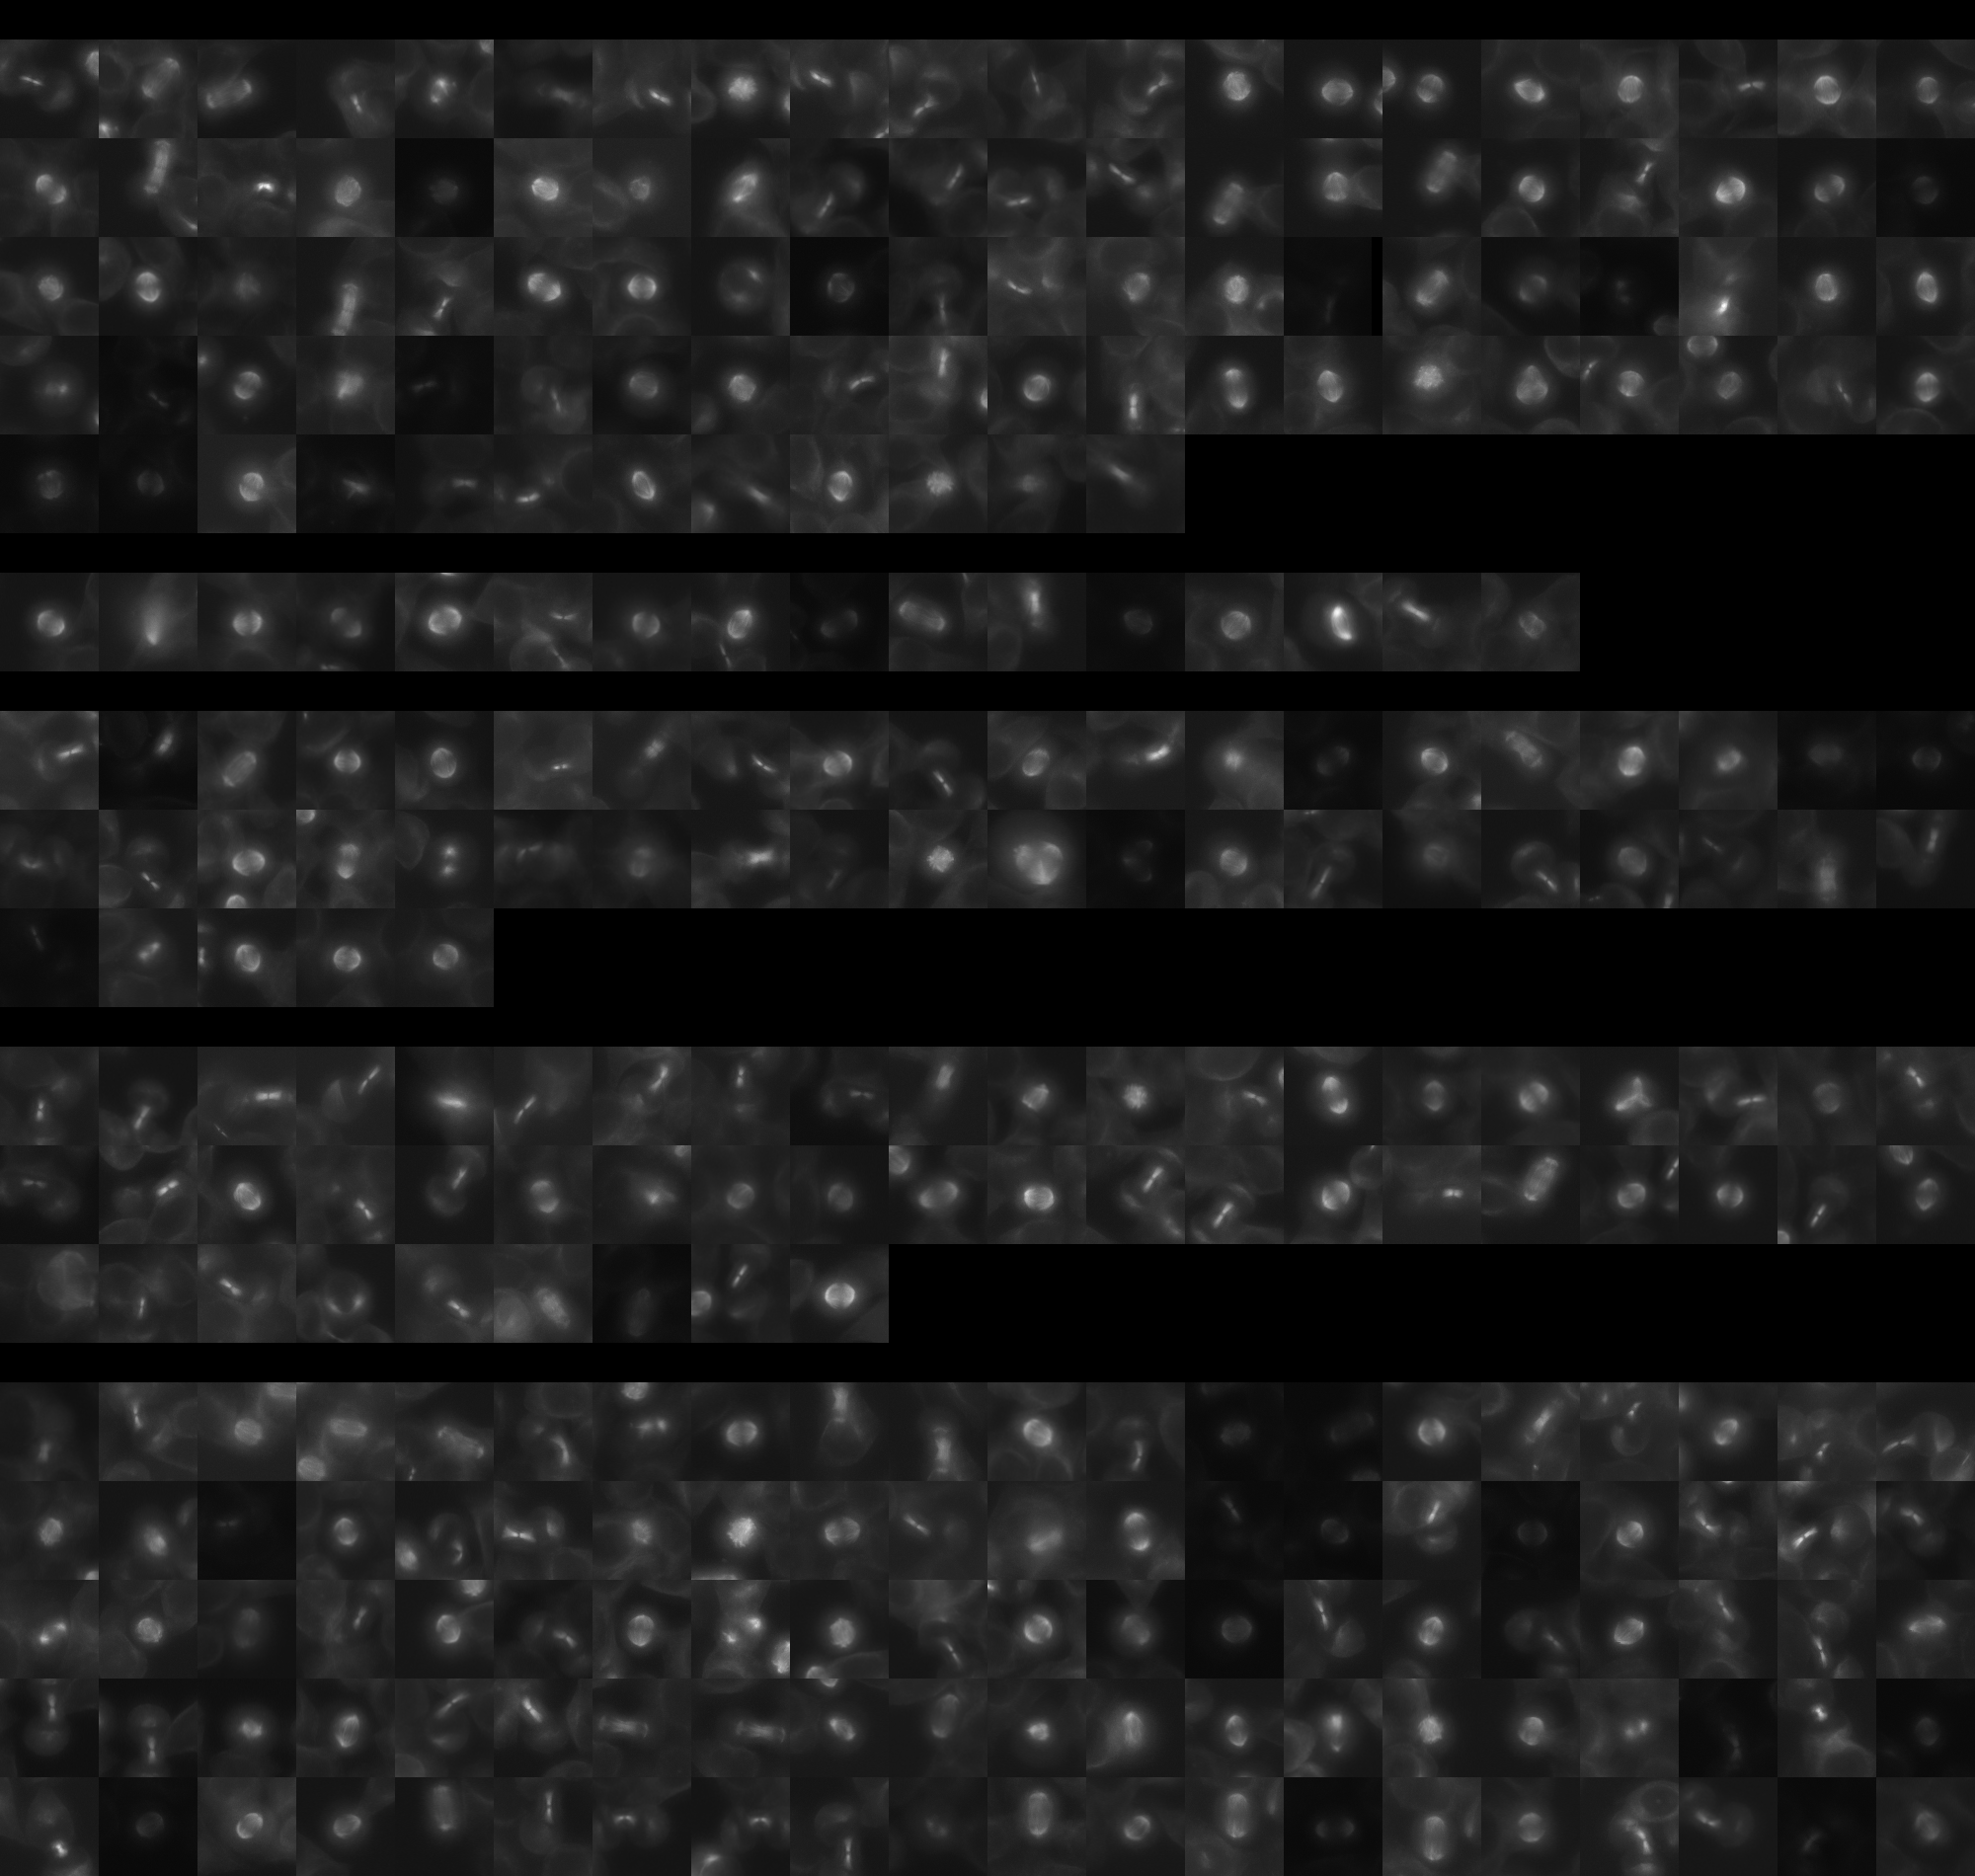
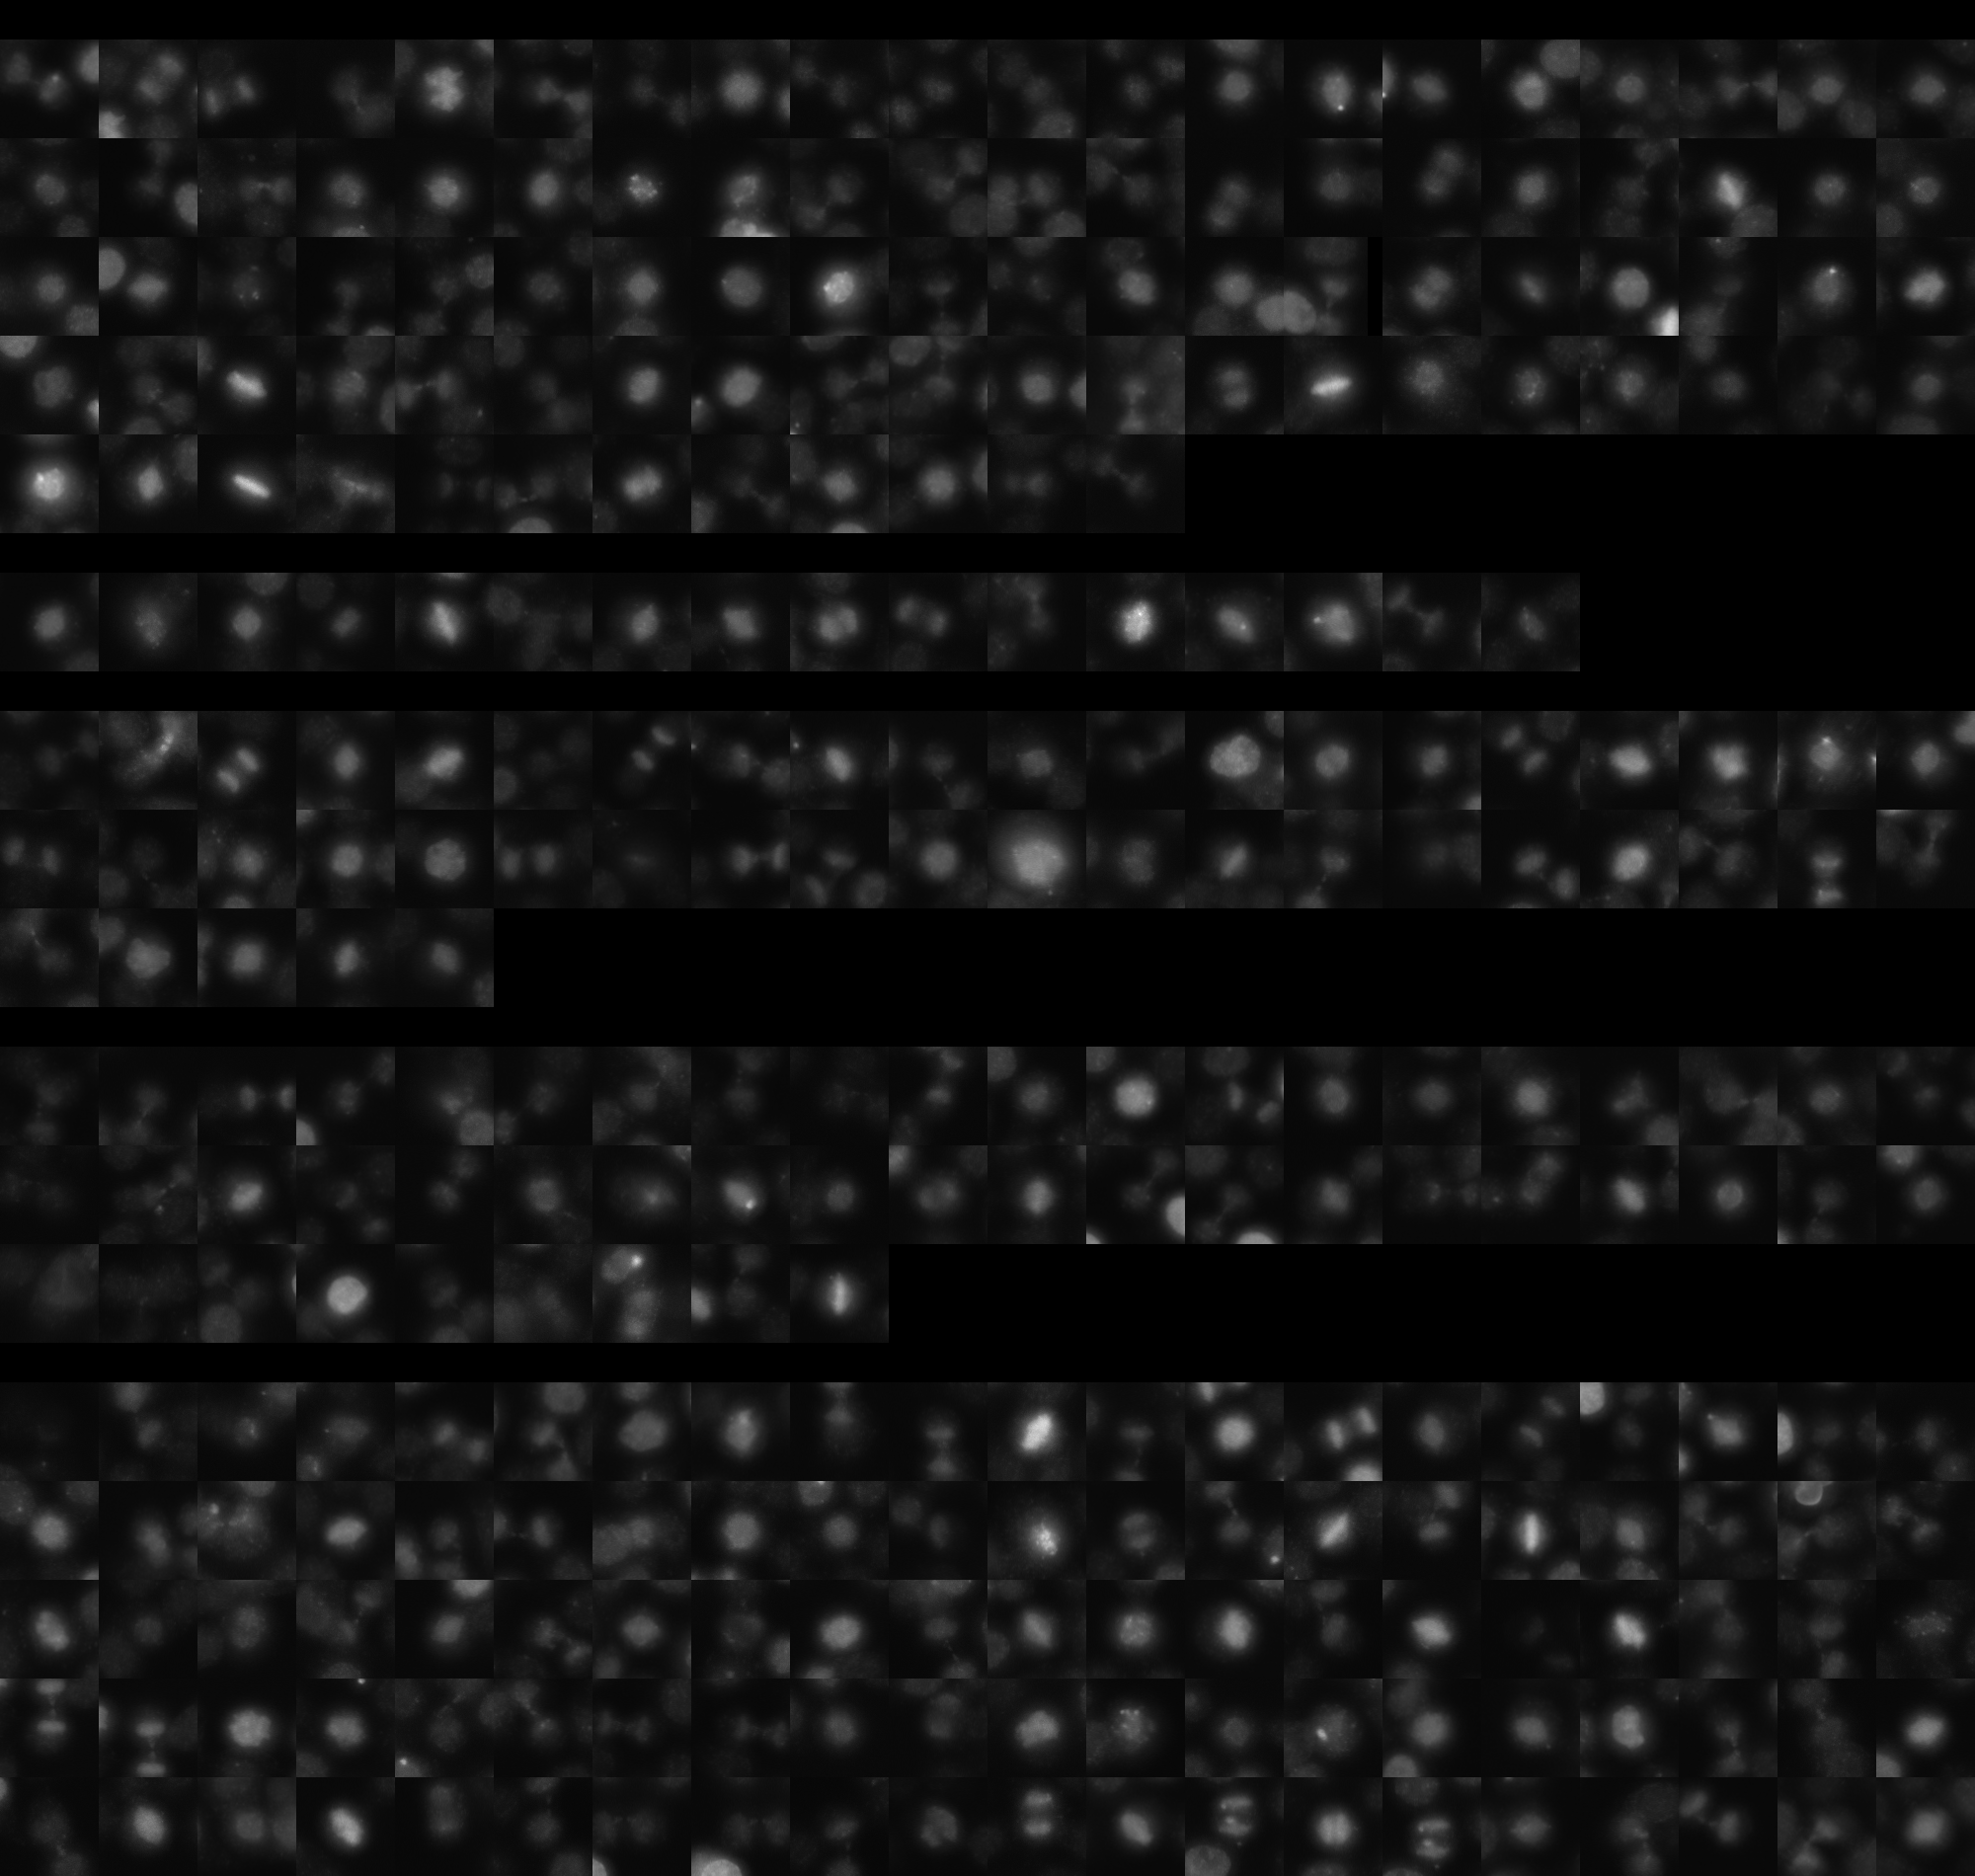
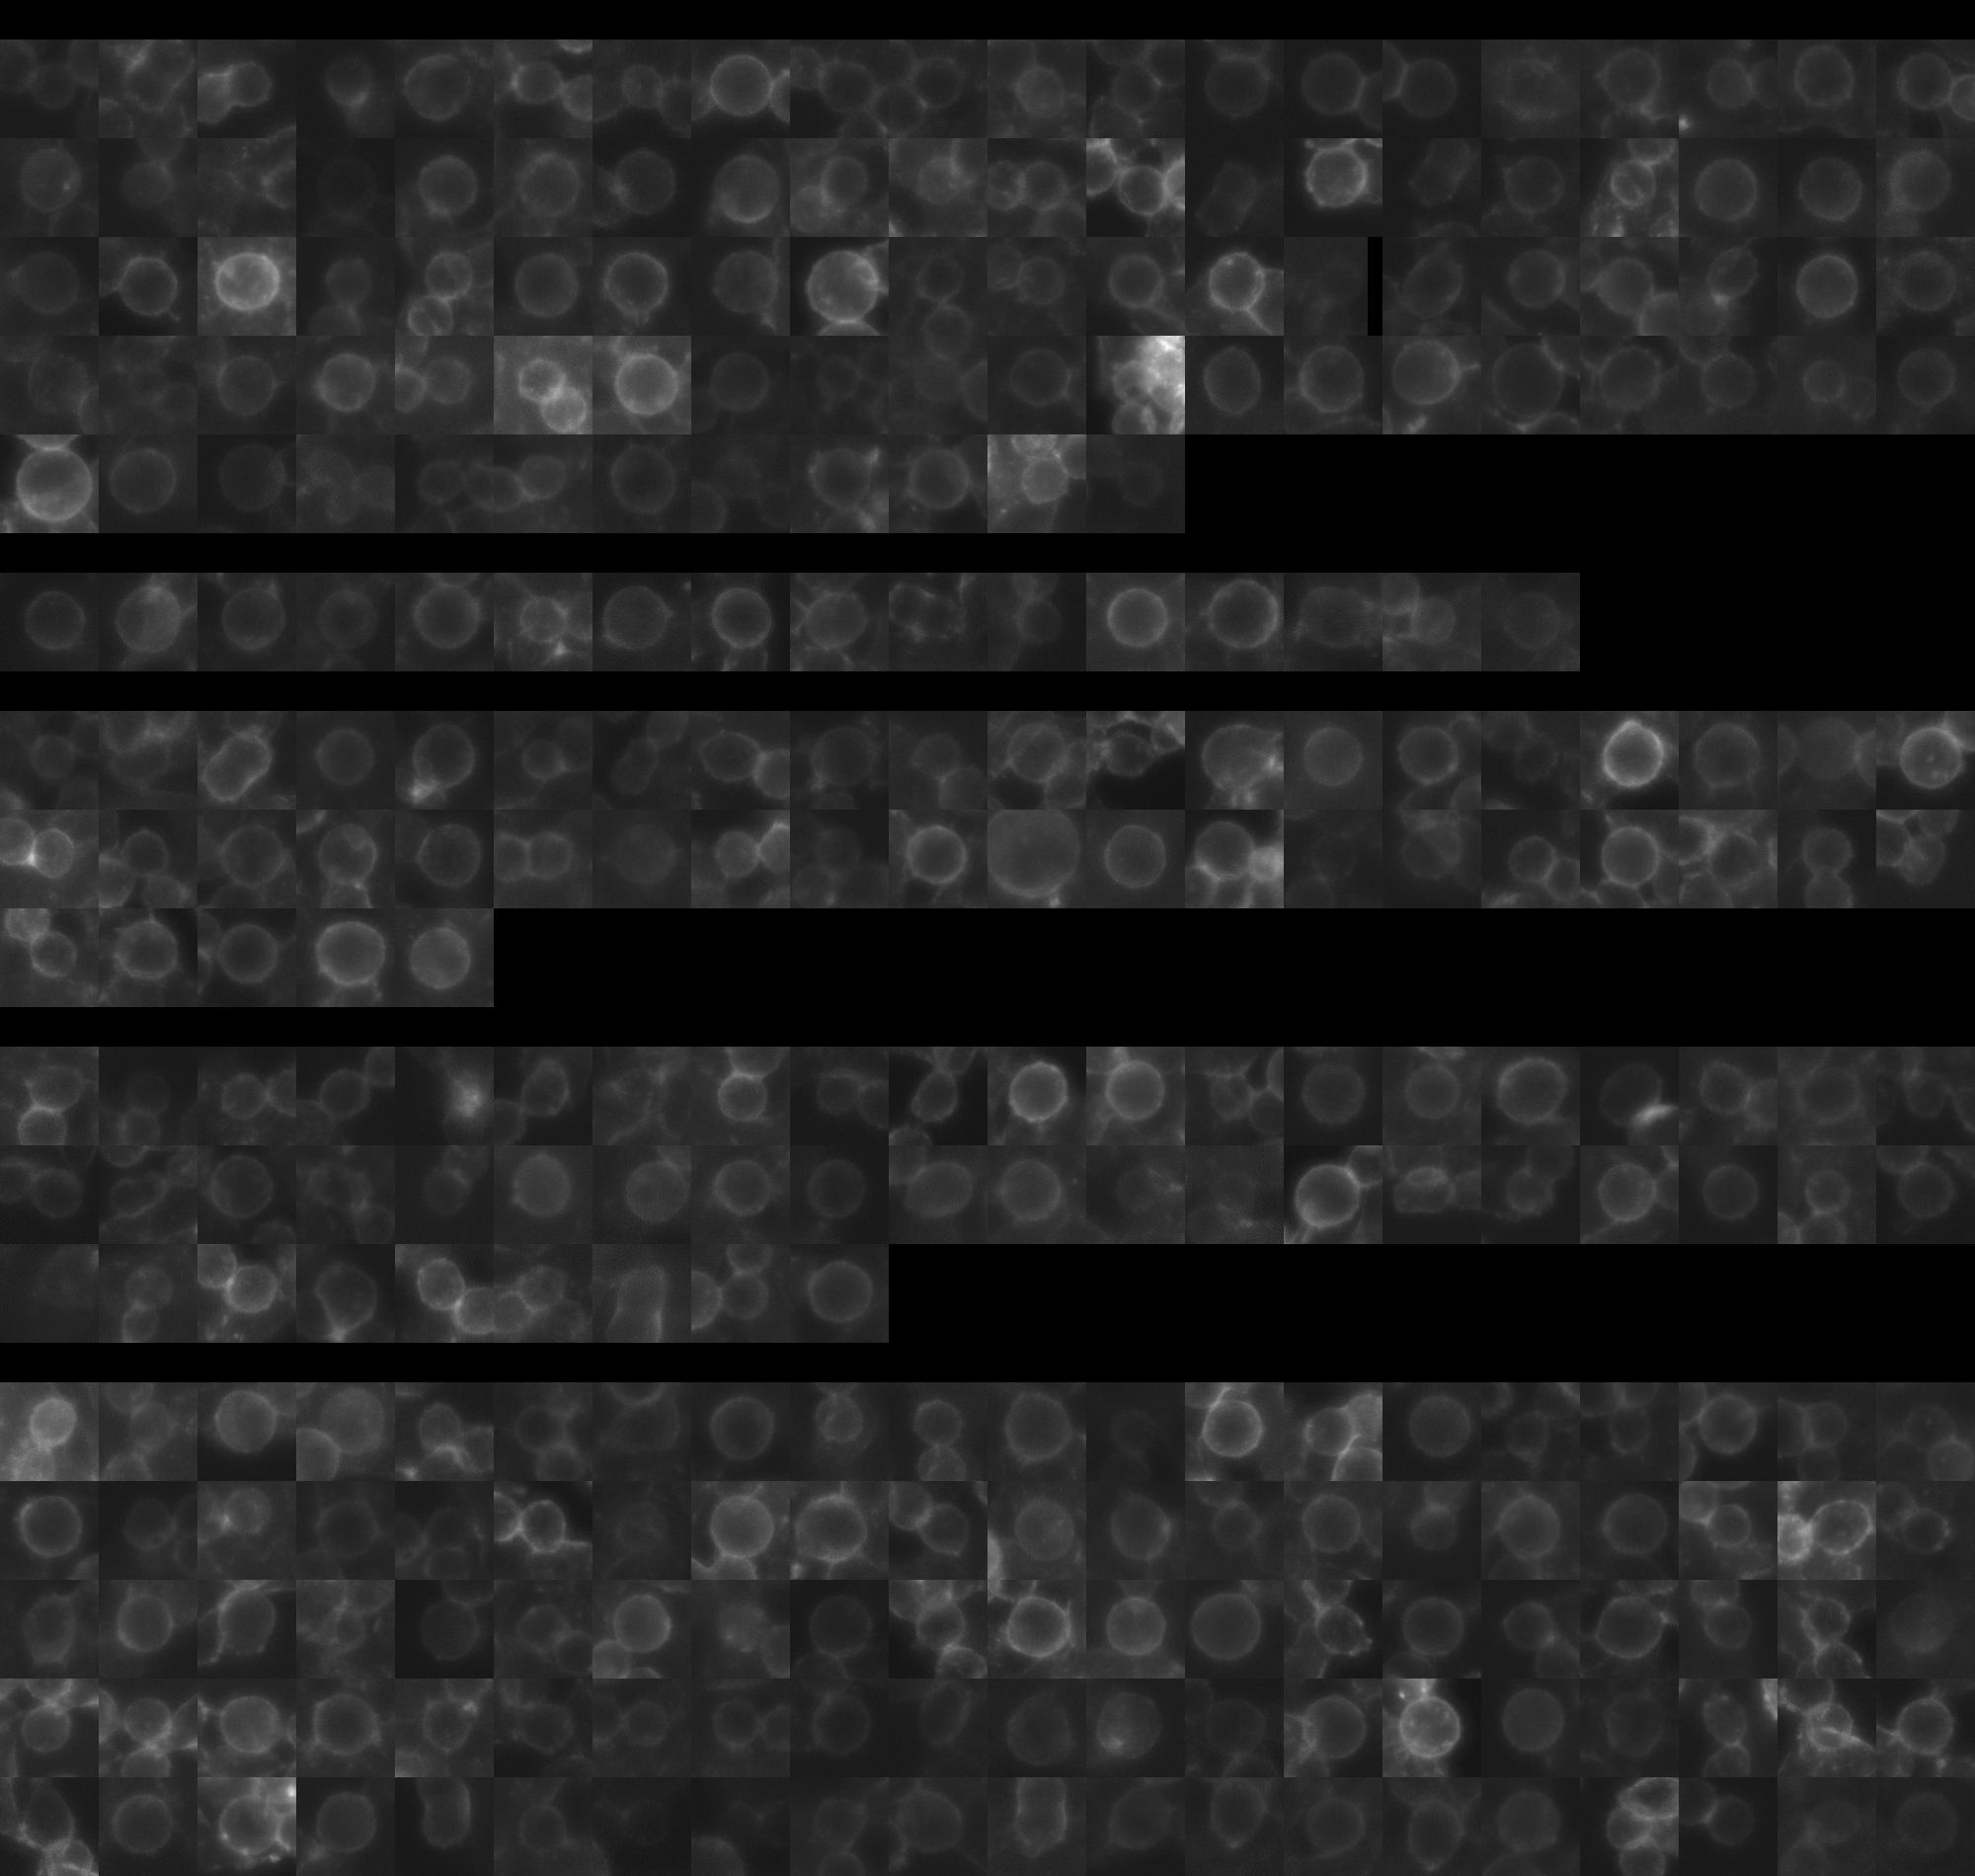
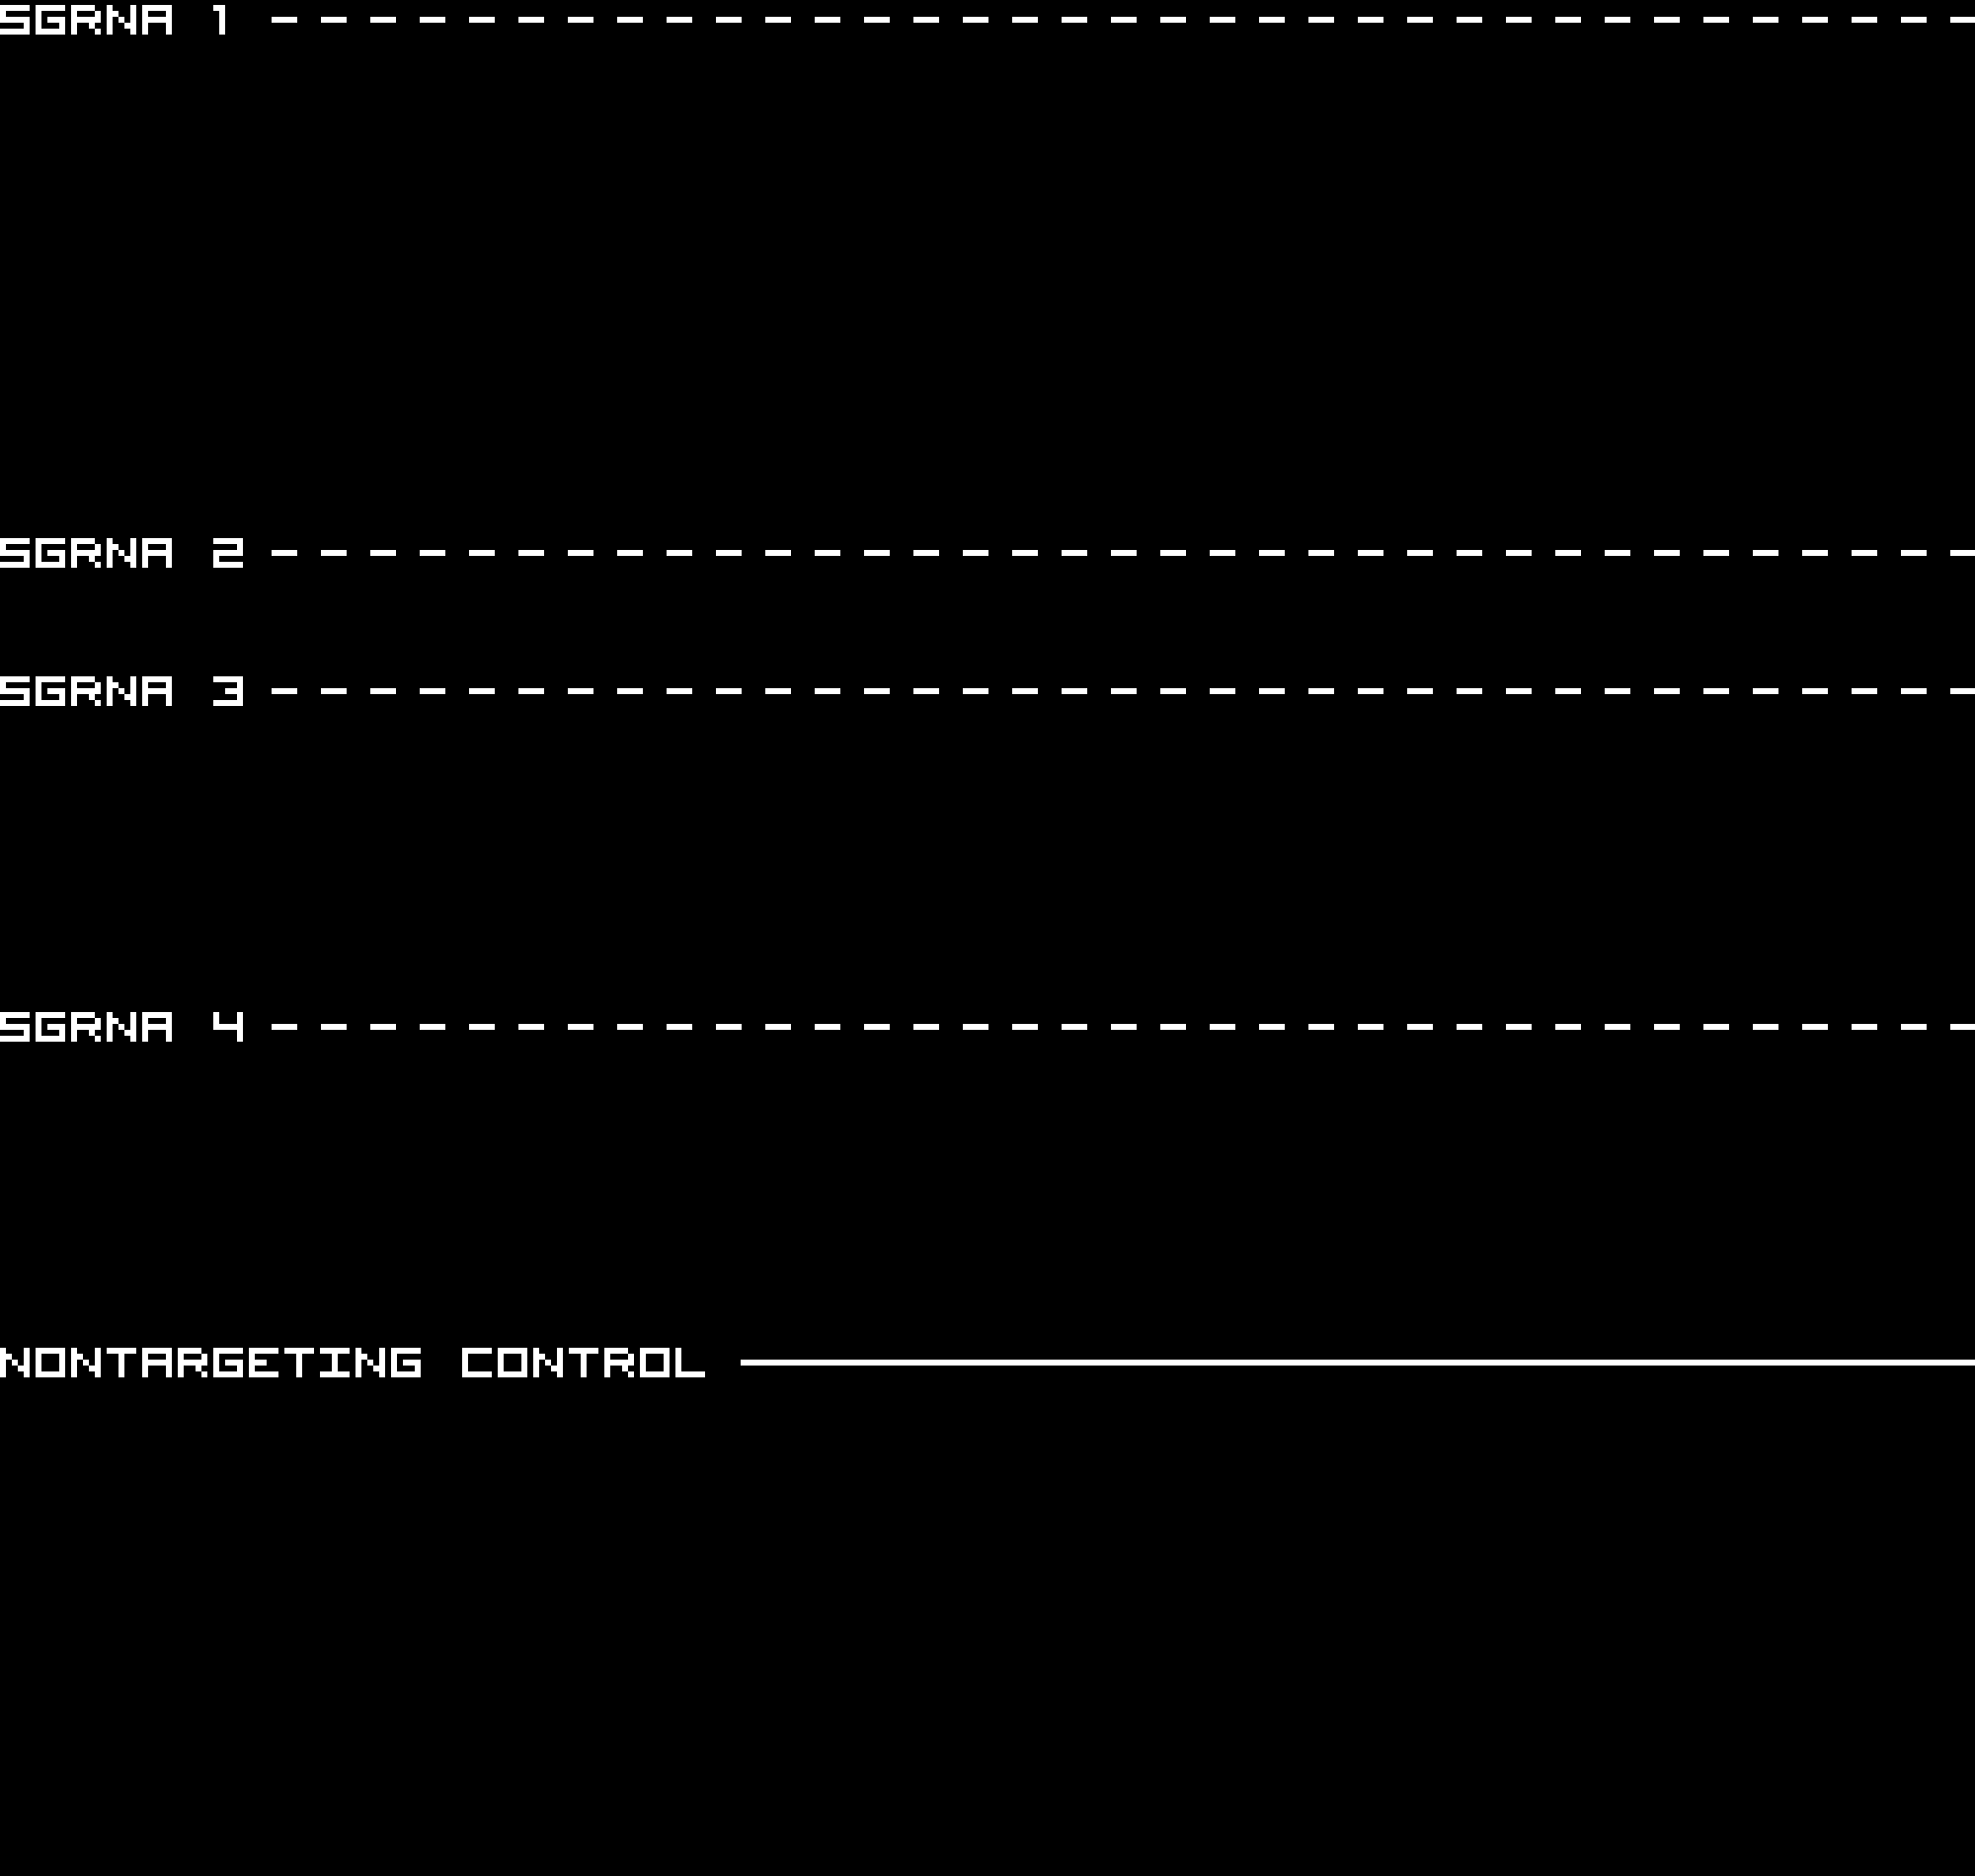
Each montage below shows randomly selected individual cell images for the same target gene separated by sgRNA, along with an example montage of cells expressing a non-targeting negative control sgRNA at the bottom. sgRNA labels in the montages correspond to the numbered sgRNA sequences in the gene info table above. The DNA (blue) and tubulin (green) channels are displayed by default, with gH2AX (grayscale) and actin (yellow) available using the check boxes. Channel brightness, contrast, and opacity are adjustable by clicking the arrow next to the channel name. When only one channel is selected, the display defaults to grayscale. Click the “Zoom” checkbox above the channel controls to enable image zooming (via scrolling) and panning (via click-and-drag).

The cell boxes displayed for this gene are square, 30.36 μm per side for the interphase montage and 30.36 μm per side for the mitotic montage.
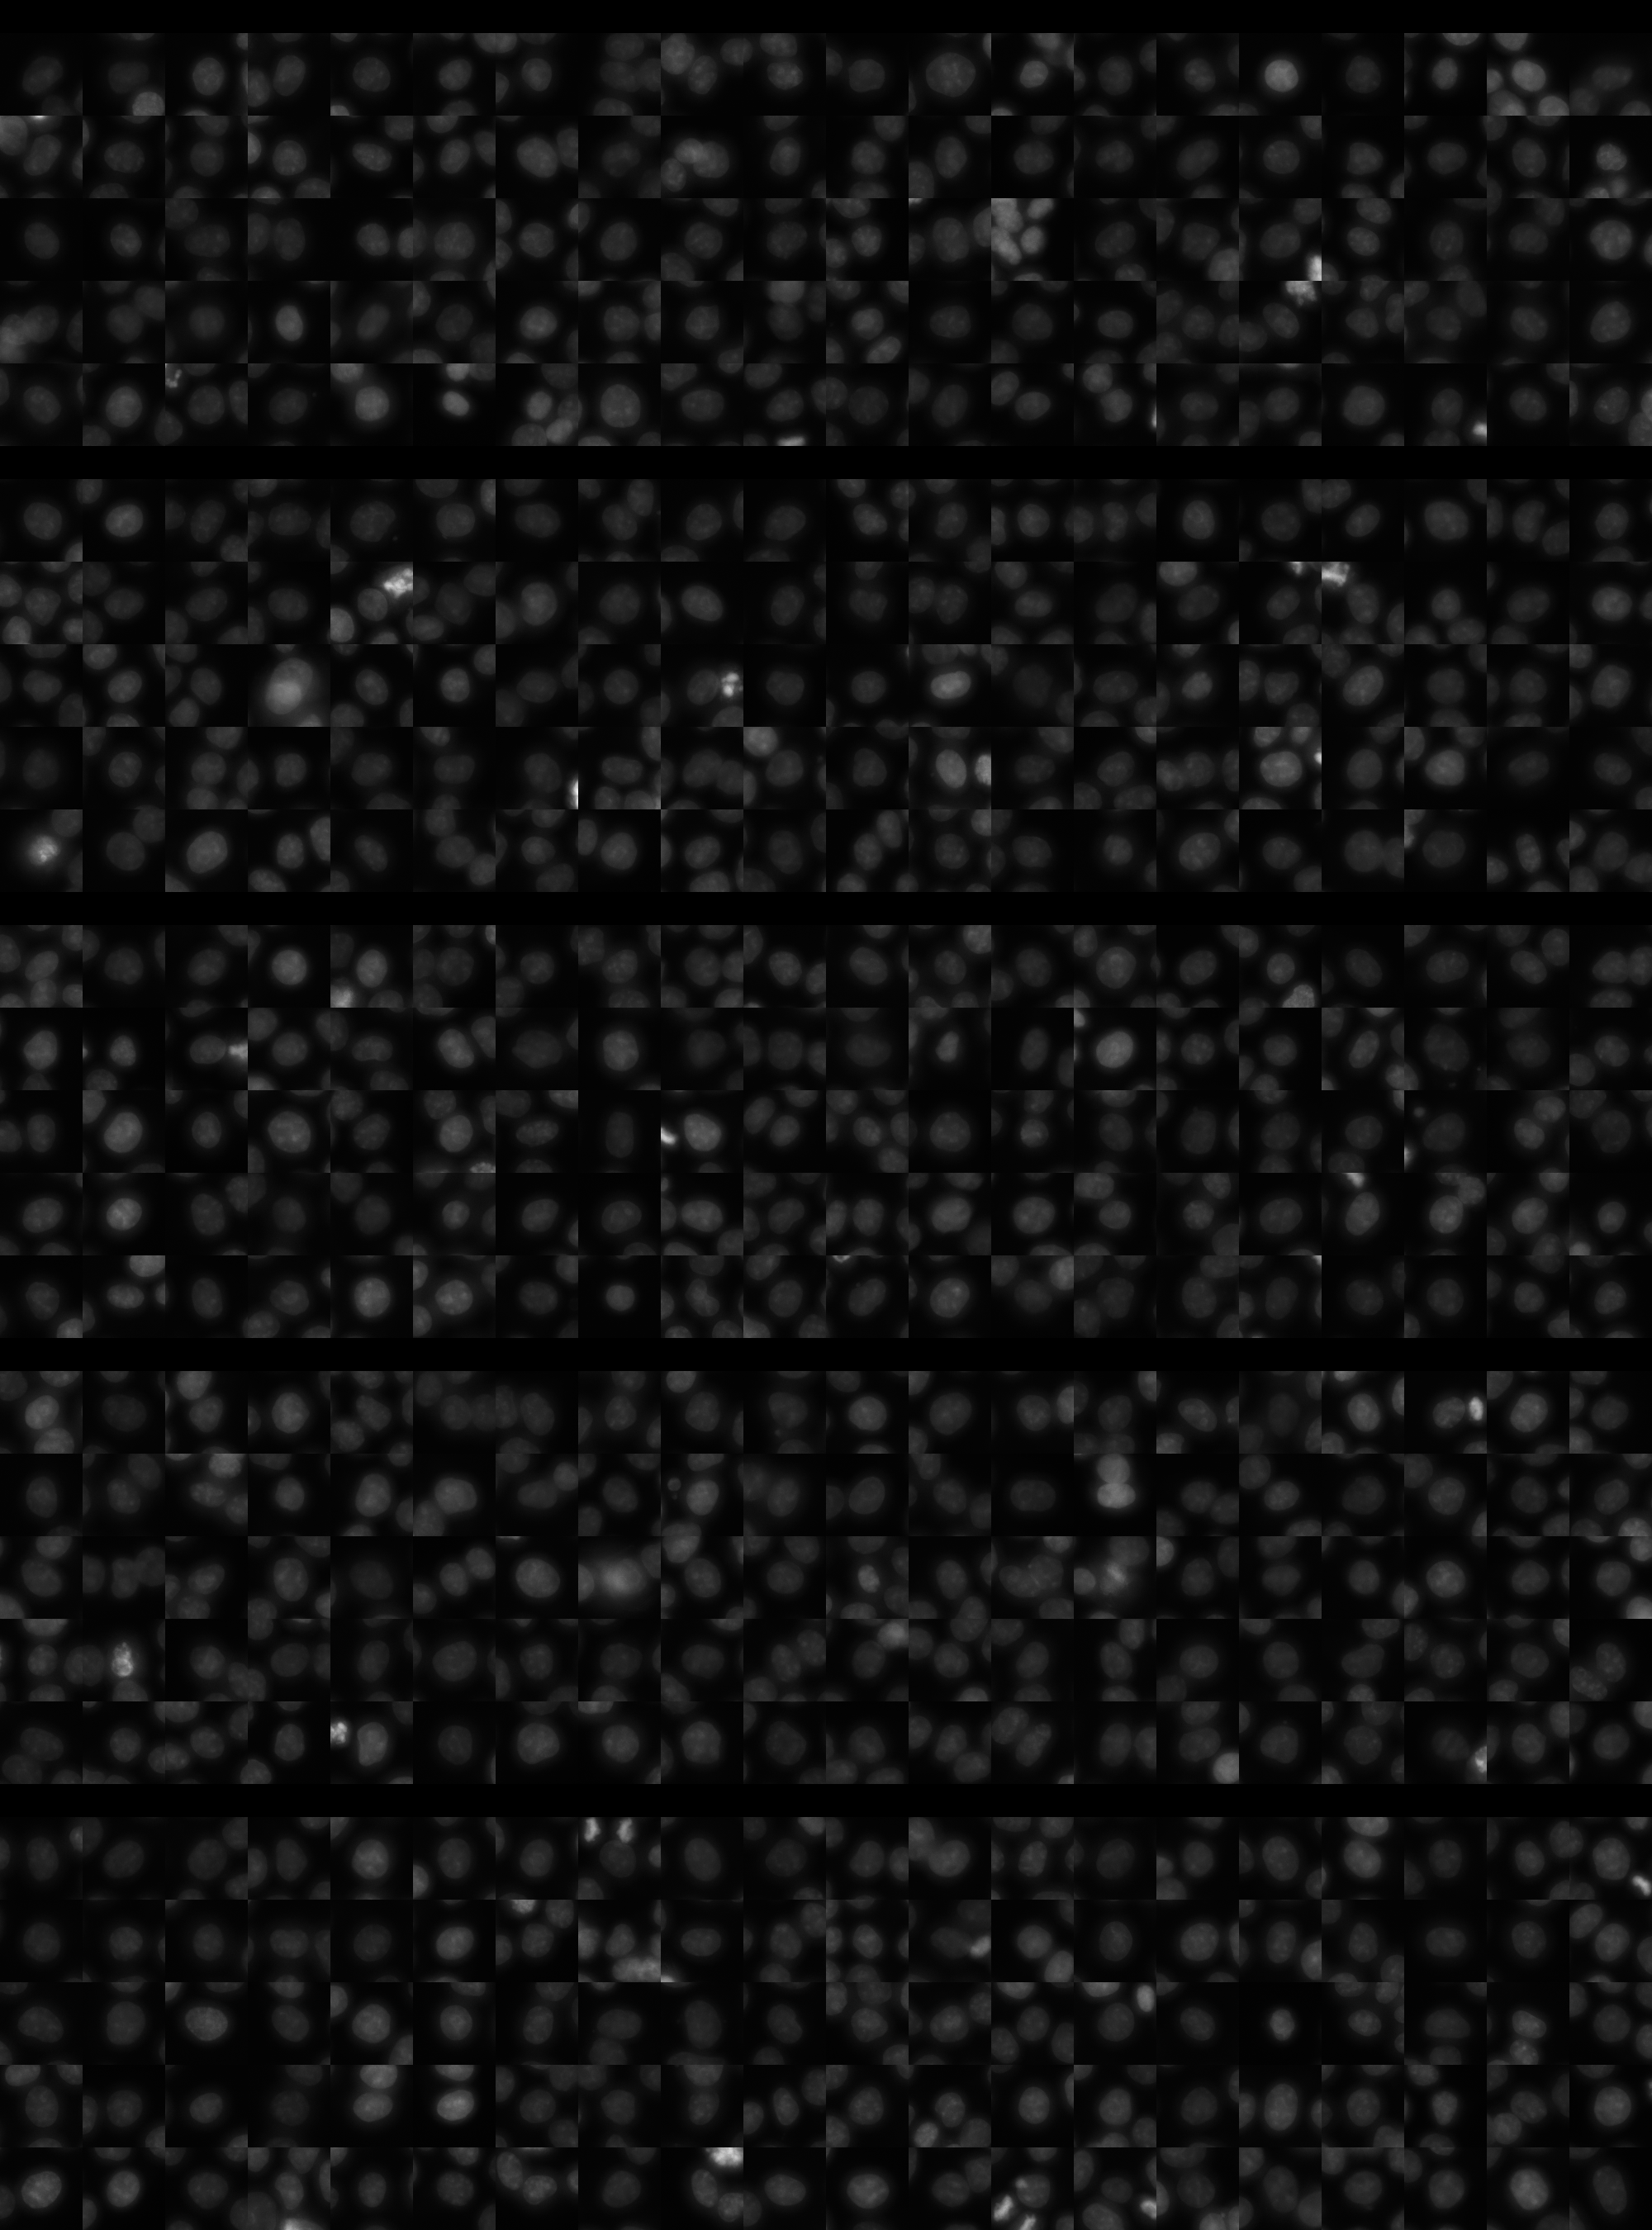
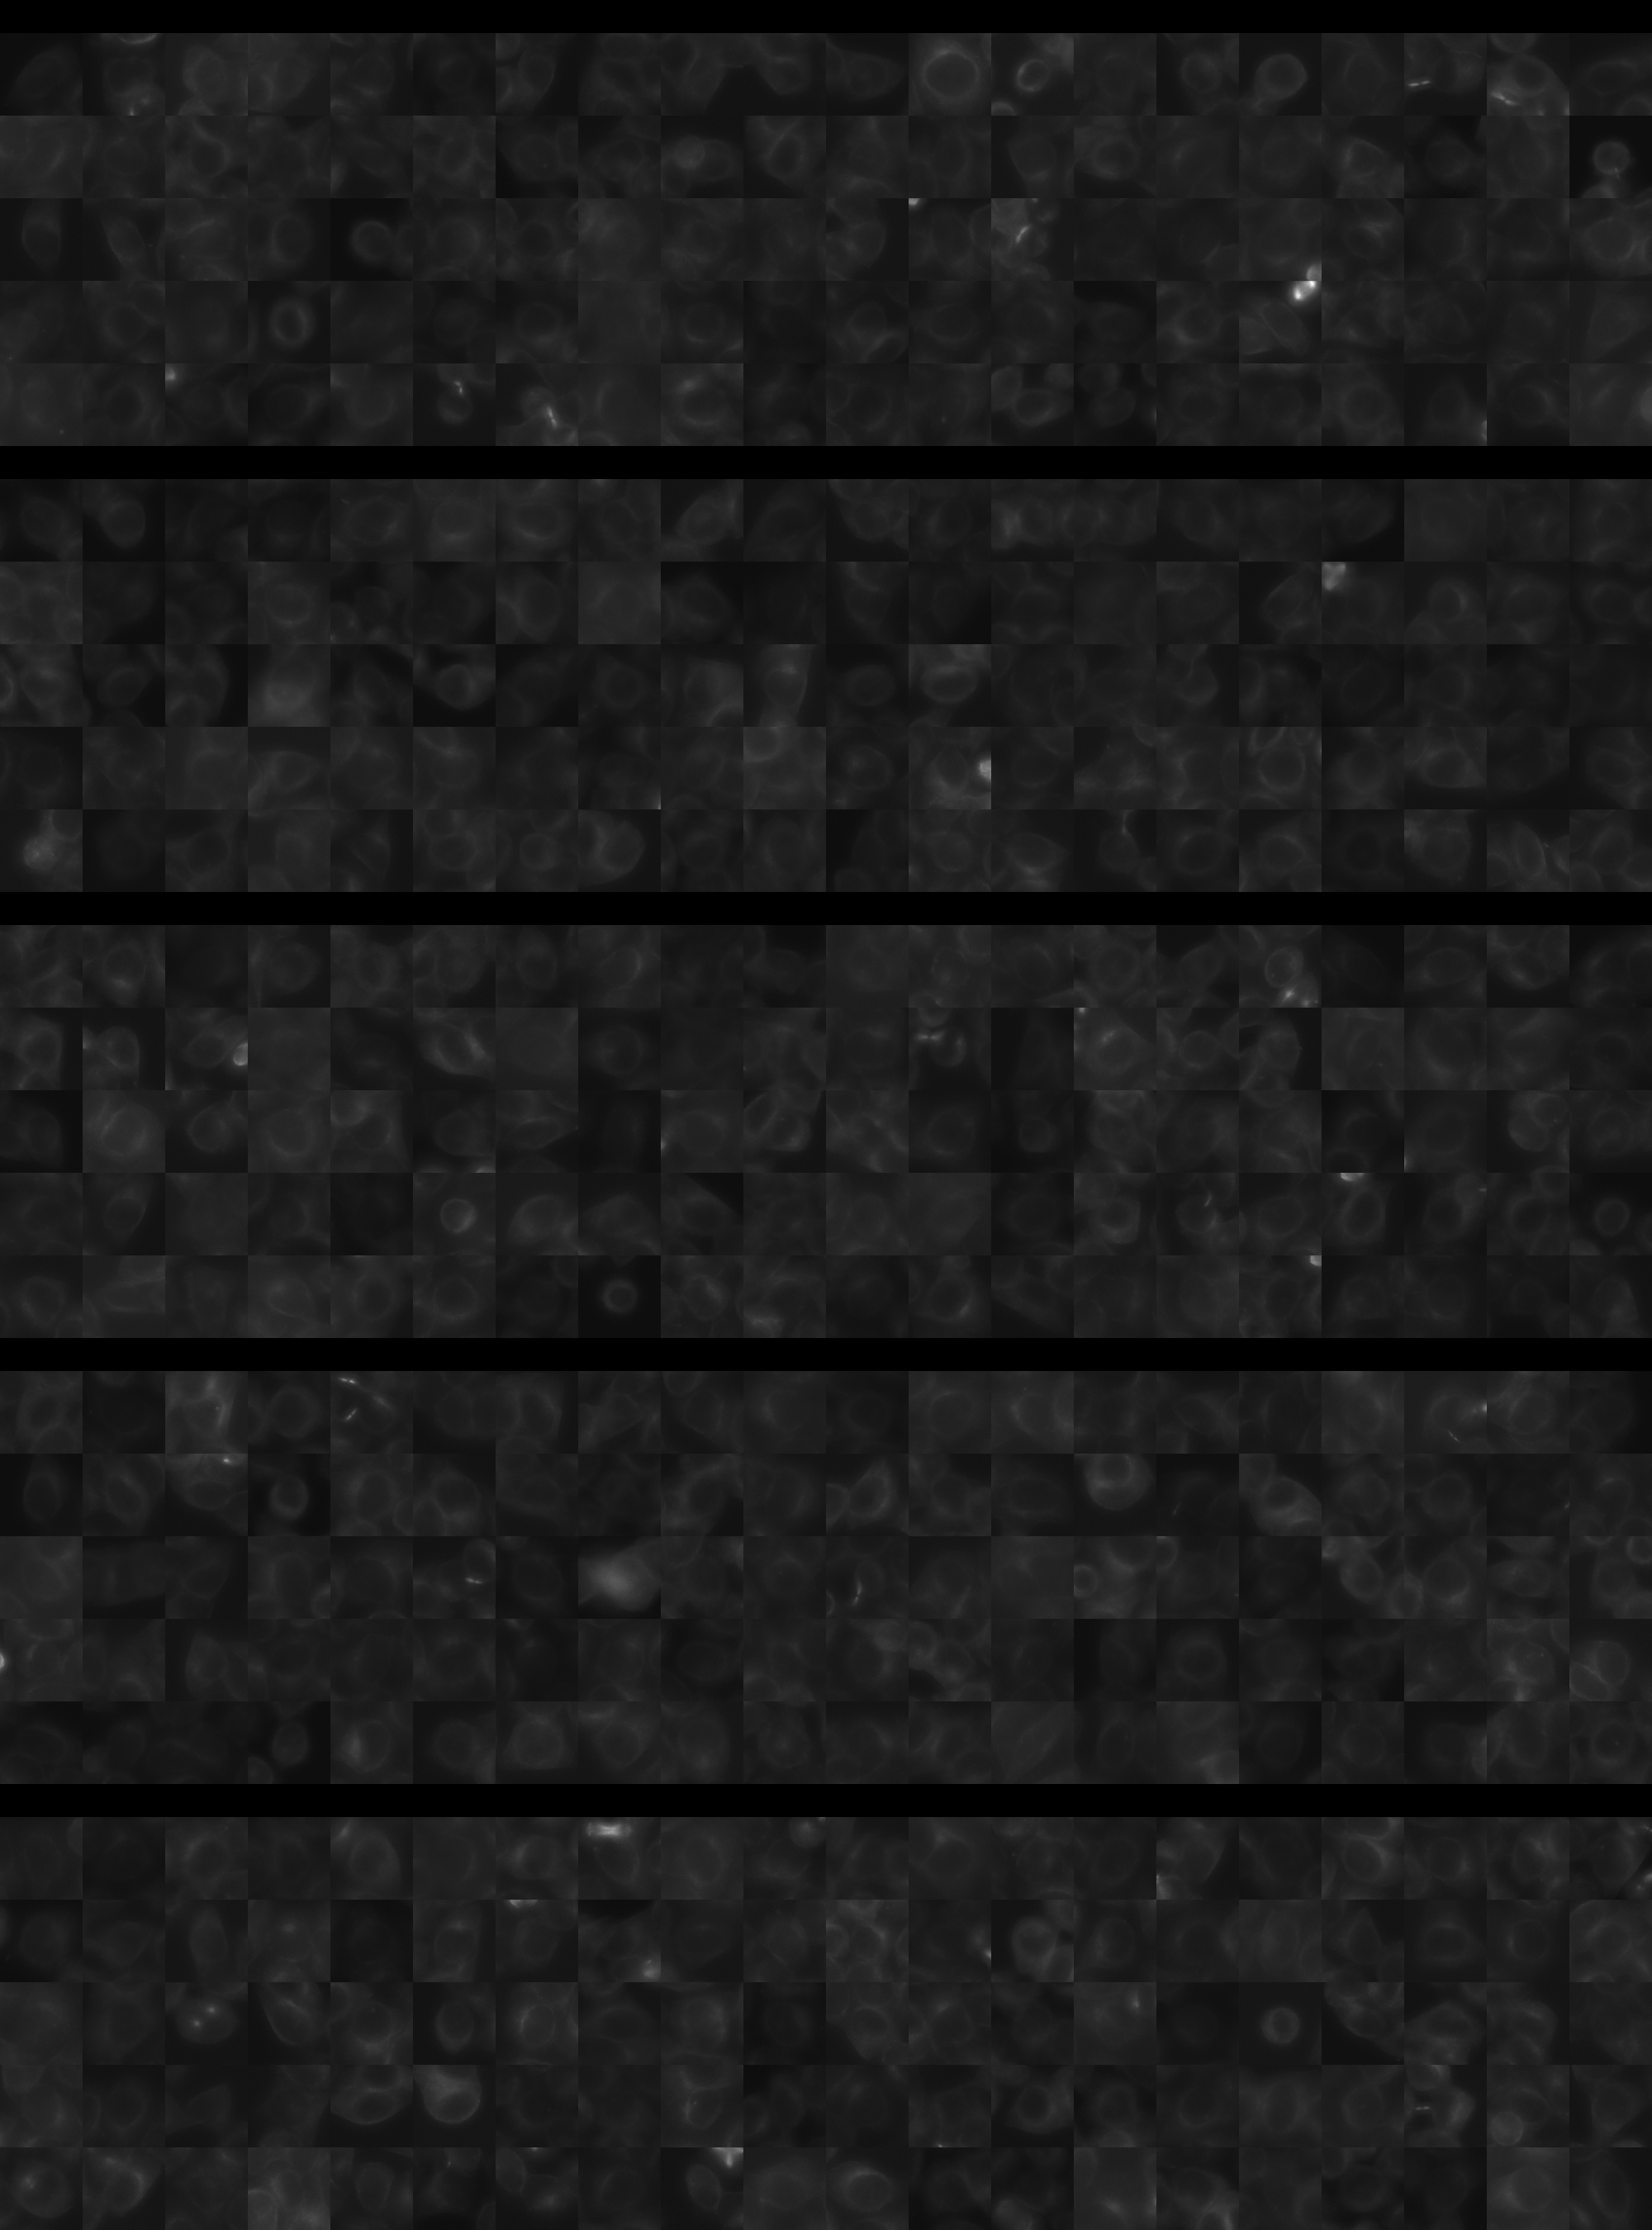
Features

Interphase Score Rank FDR q-value
Nucleus DNA Integrated -1.212e-01 5293 of 5322 5.407e-04
Nucleus DNA Mean -1.823e-01 5073 of 5322 1.505e-04
Nucleus gH2AX Mean -1.288e-01 5256 of 5322 1.367e-04
Nucleus DNA - gH2AX Correlation -2.210e-01 5169 of 5322 1.021e-04
Nucleus Shape Area -1.884e-02 3867 of 5322 0.643
Nucleus Shape Eccentricity 0.019 2258 of 5322 0.652
Nucleus Shape Form Factor -9.606e-02 4295 of 5322 0.013
Nucleus Shape Solidity -1.180e-01 4579 of 5322 6.243e-04
Cell DNA Mass Displacement -1.262e-03 4438 of 5322 0.960
Cell Tubulin Mean -1.280e-01 5022 of 5322 0.002
Cell Tubulin Mass Displacement -8.528e-02 5069 of 5322 0.011
Cell Actin Mean -1.927e-01 5214 of 5322 1.723e-04
Cell Tubulin - Actin Correlation 0.038 1867 of 5322 0.357
Cell DNA - Tubulin Correlation -3.995e-02 4844 of 5322 0.269
Cell Shape Area -1.355e-01 4899 of 5322 6.126e-04
Cell Shape Eccentricity 0.039 977 of 5322 0.502
Mitotic Score Rank FDR q-value
Nucleus DNA Integrated -2.421e-02 4215 of 5322 0.995
Nucleus DNA Mean -1.912e-02 3252 of 5322 1.000
Nucleus DNA Mass Displacement -7.386e-02 4453 of 5322 0.999
Nucleus DNA Mean Frac 3 -2.715e-01 5206 of 5322 1.000
Nucleus gH2AX Mean -7.538e-02 3976 of 5322 1.000
Nucleus gH2AX Mean Frac 0 -7.878e-03 2401 of 5322 1.000
Nucleus Tubulin Mean Frac 0 -4.205e-02 4074 of 5322 0.999
Nucleus Tubulin Mean Edge -3.863e-02 3685 of 5322 0.999
Nucleus Tubulin Std Edge 0.279 202 of 5322 0.831
Nucleus Shape Area -3.179e-03 3976 of 5322 0.990
Nucleus Shape Eccentricity 0.124 637 of 5322 1.000
Nucleus Shape Form Factor -9.353e-02 2755 of 5322 0.998
Cell Tubulin Mean -2.790e-02 3857 of 5322 0.997
Cell Tubulin Mean Frac 3 0.046 1192 of 5322 0.999
Cell Actin Mean -1.615e-01 4871 of 5322 0.997
Cell Shape Area -6.671e-02 4572 of 5322 0.998
( Reset Zoom )
Brightness
Contrast
Opacity
Brightness
Contrast
Opacity
Brightness
Contrast
Opacity
Brightness
Contrast
Opacity
Brightness
Contrast
Opacity

( Reset Zoom )
Brightness
Contrast
Opacity
Brightness
Contrast
Opacity
Brightness
Contrast
Opacity
Brightness
Contrast
Opacity
Brightness
Contrast
Opacity

Day 3

Day 4

MIT Central Accessability