PPFIA4

Gene symbol: PPFIA4
Gene: 8497
Uniprot Function: May regulate the disassembly of focal adhesions. May localize receptor-like tyrosine phosphatases type 2A at specific sites on the plasma membrane, possibly regulating their interaction with the extracellular environment and their association with substrates (By similarity).
Mitotic Index 0.023
Interphase Cluster: #89 (25 genes)
Mitotic Cluster: #57 (29 genes)
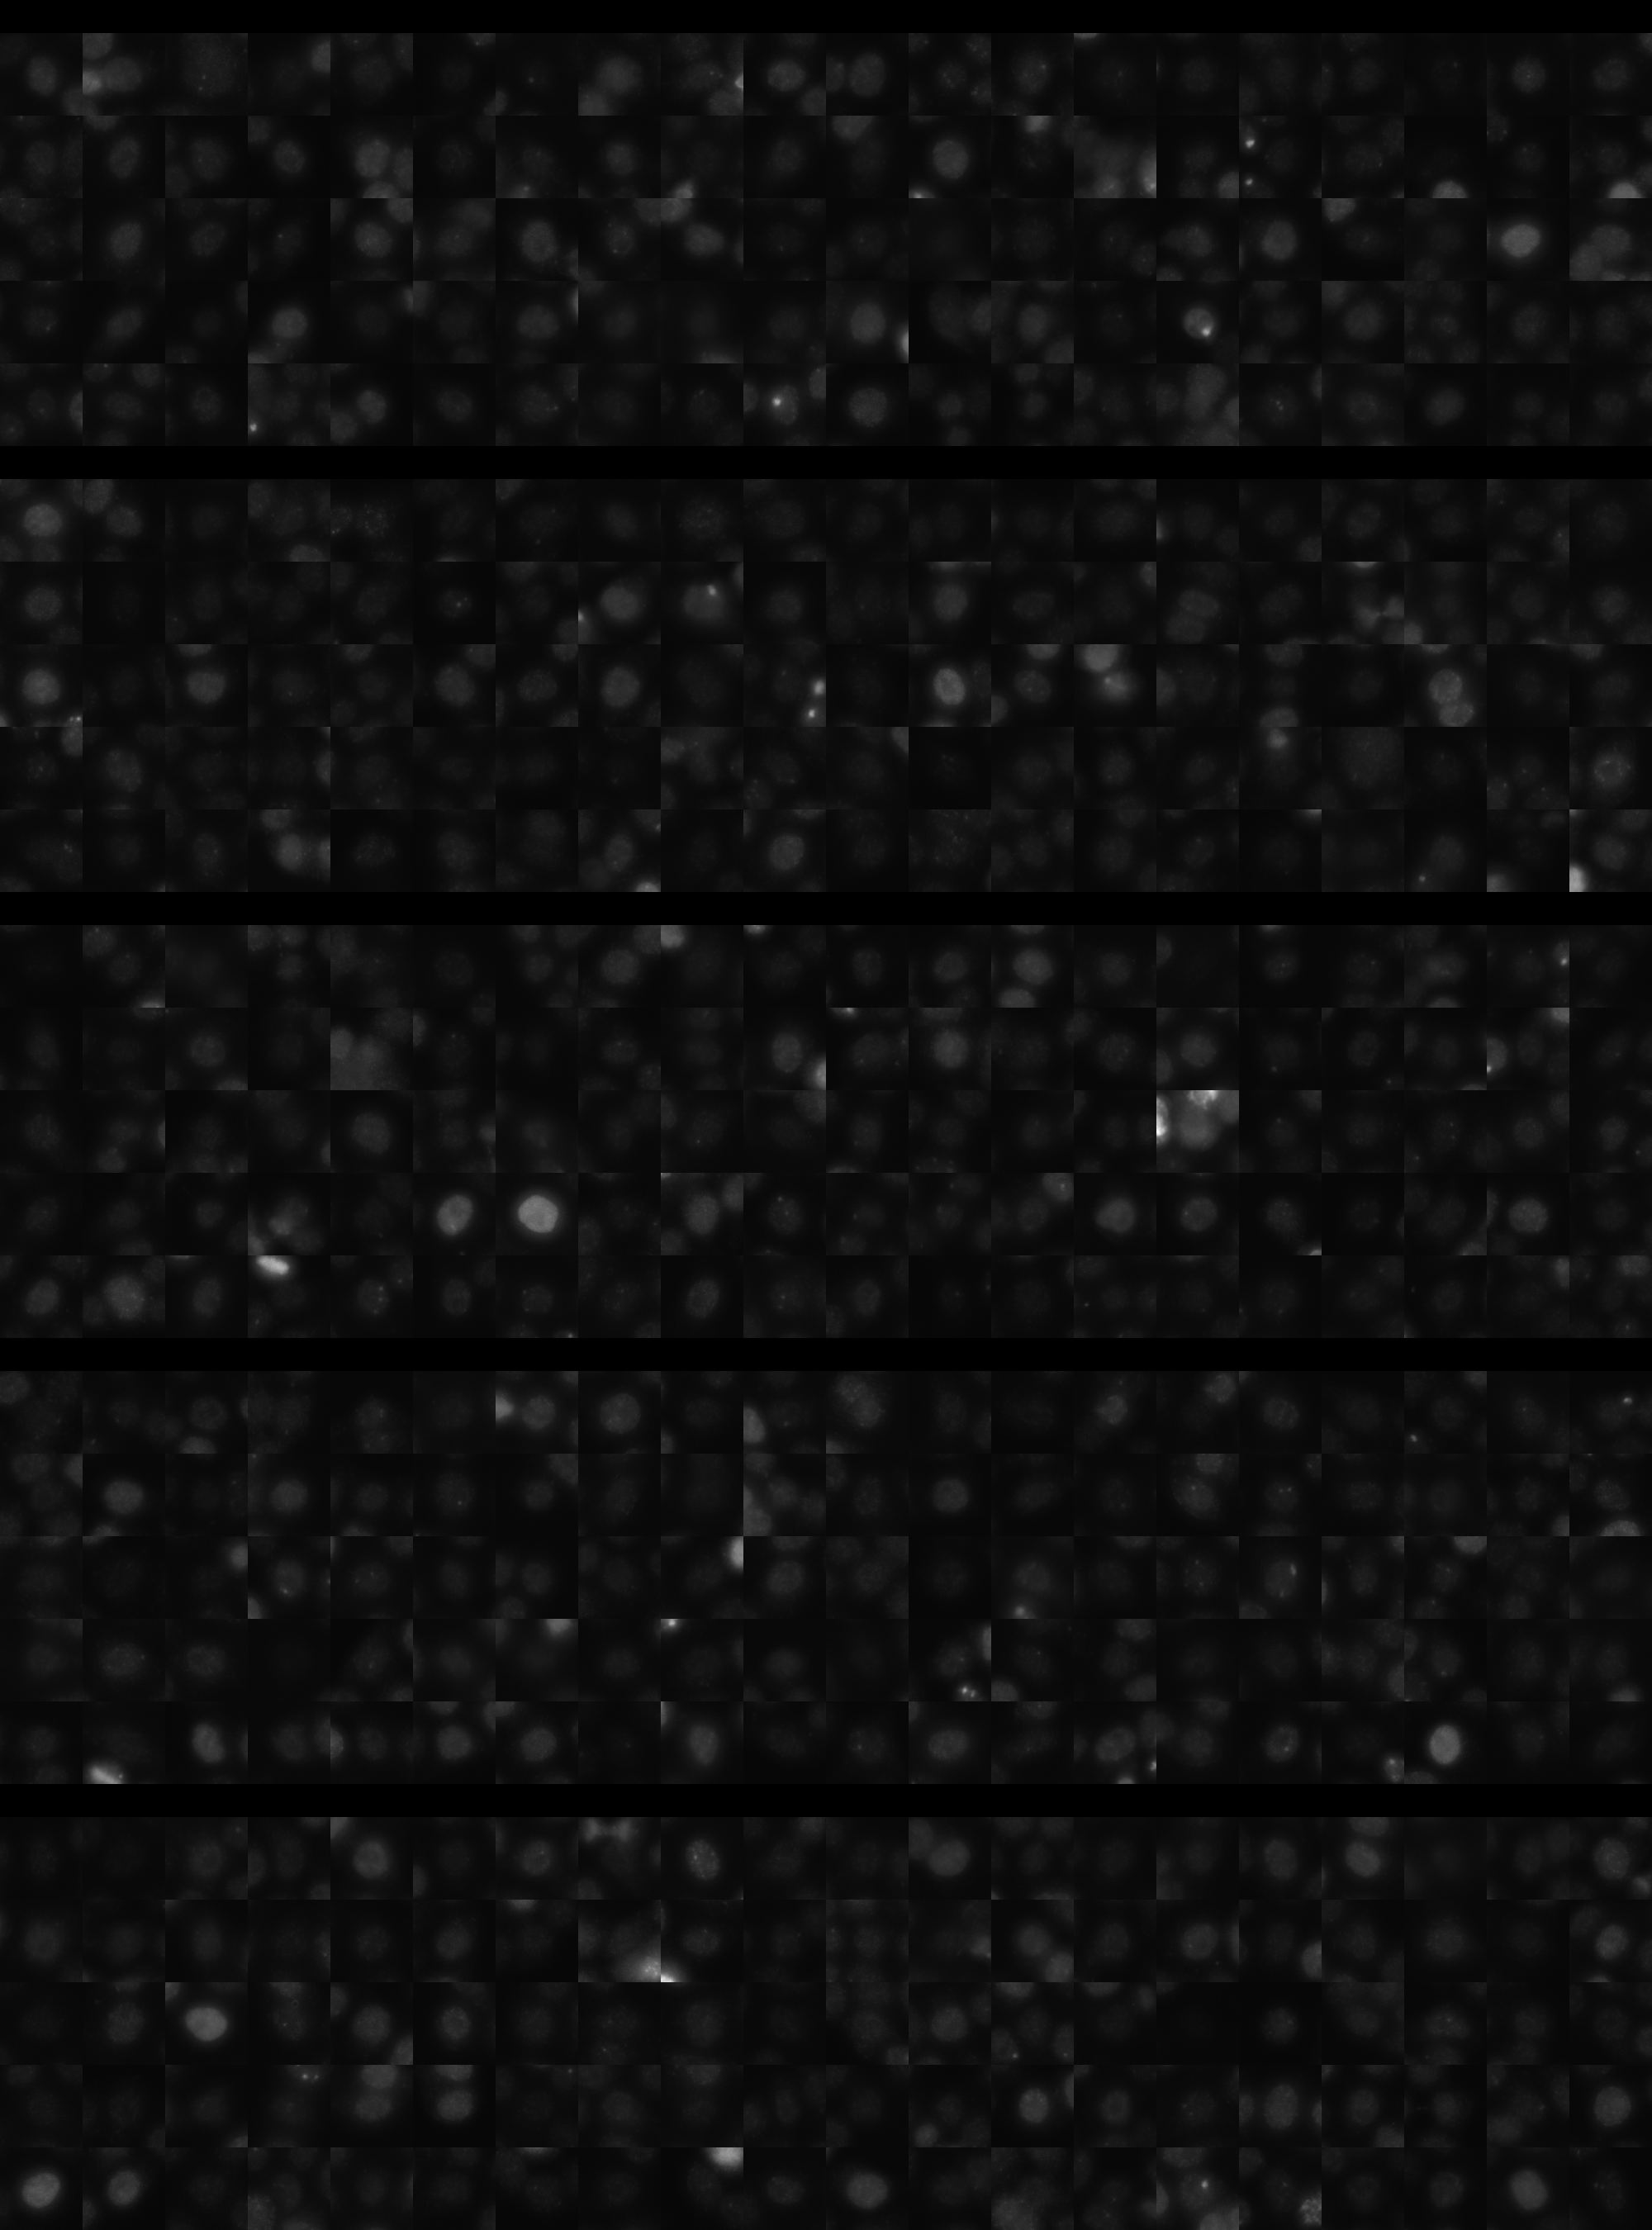
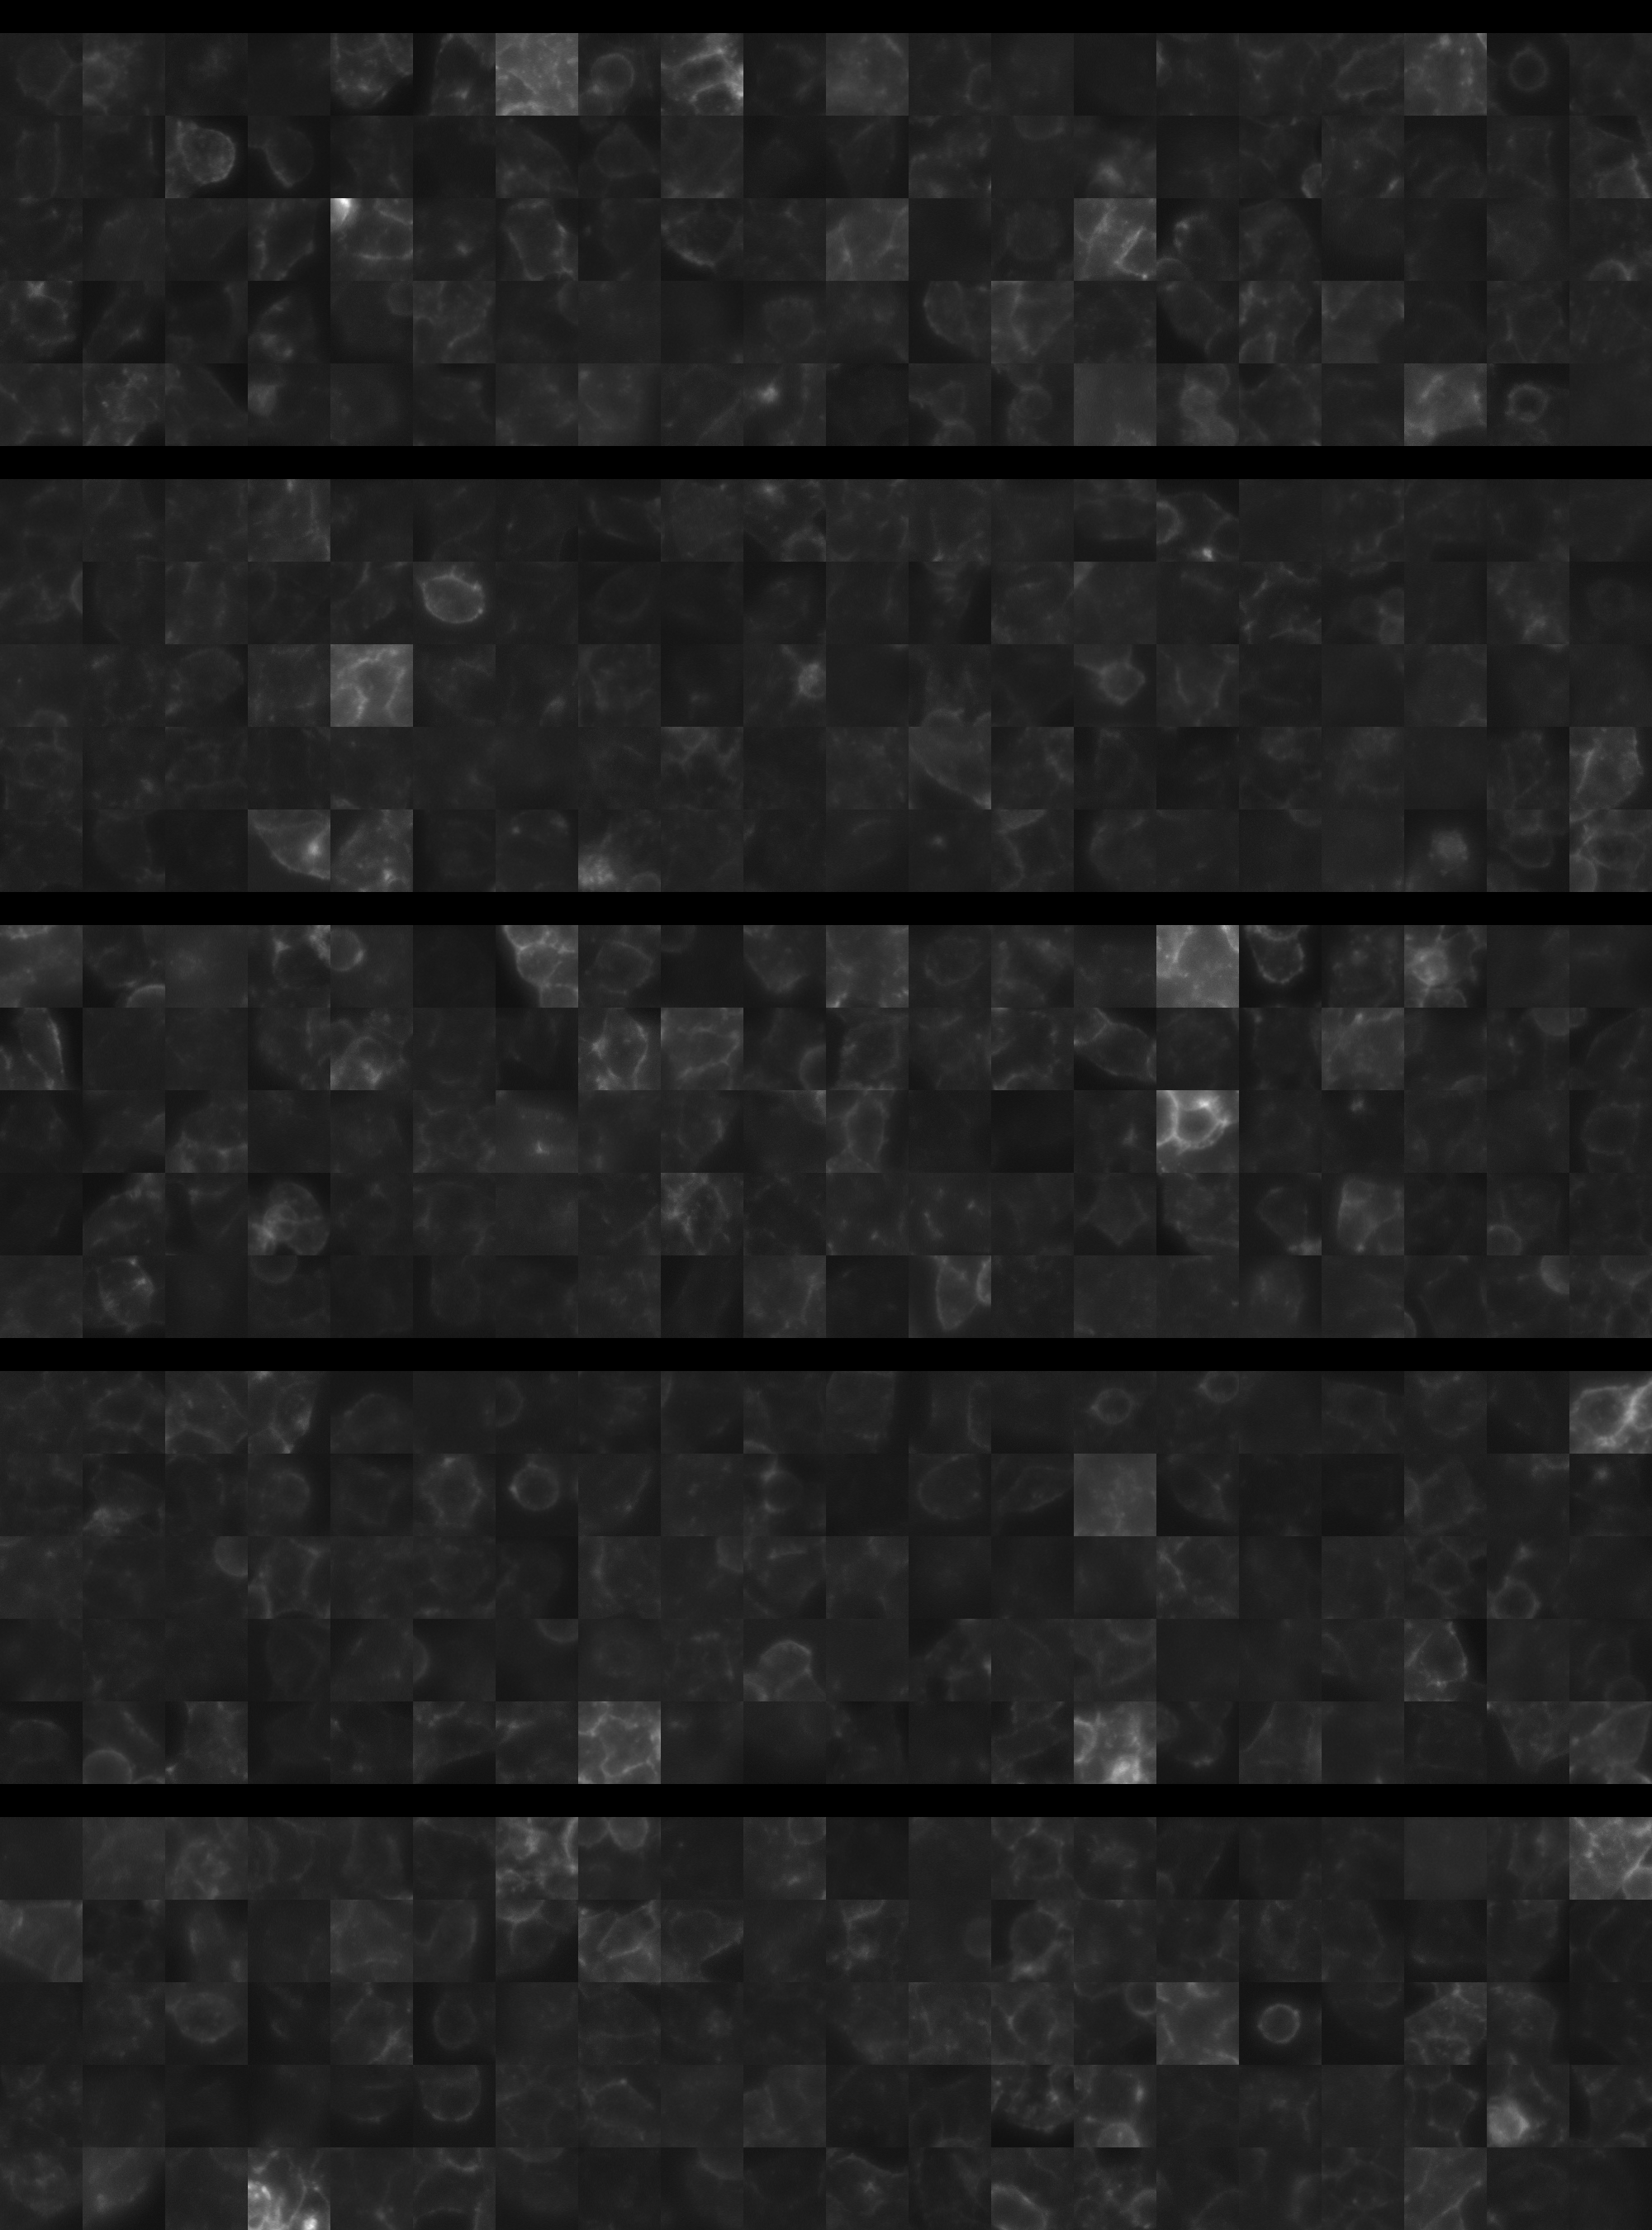
sgRNA 1: AGAACGGCATGGCAACATTG (interphase cells: 1956, mitotic cells: 60)
sgRNA 2: CCCGCCATGAACGGTCACTG (interphase cells: 1968, mitotic cells: 45)
sgRNA 3: CTTCCCTCAATGCCGAGTAG (interphase cells: 2167, mitotic cells: 50)
sgRNA 4: GATCTCTGTGTCCGACAGAG (interphase cells: 954, mitotic cells: 11)

Interphase Cluster

Mitotic Cluster

Overview

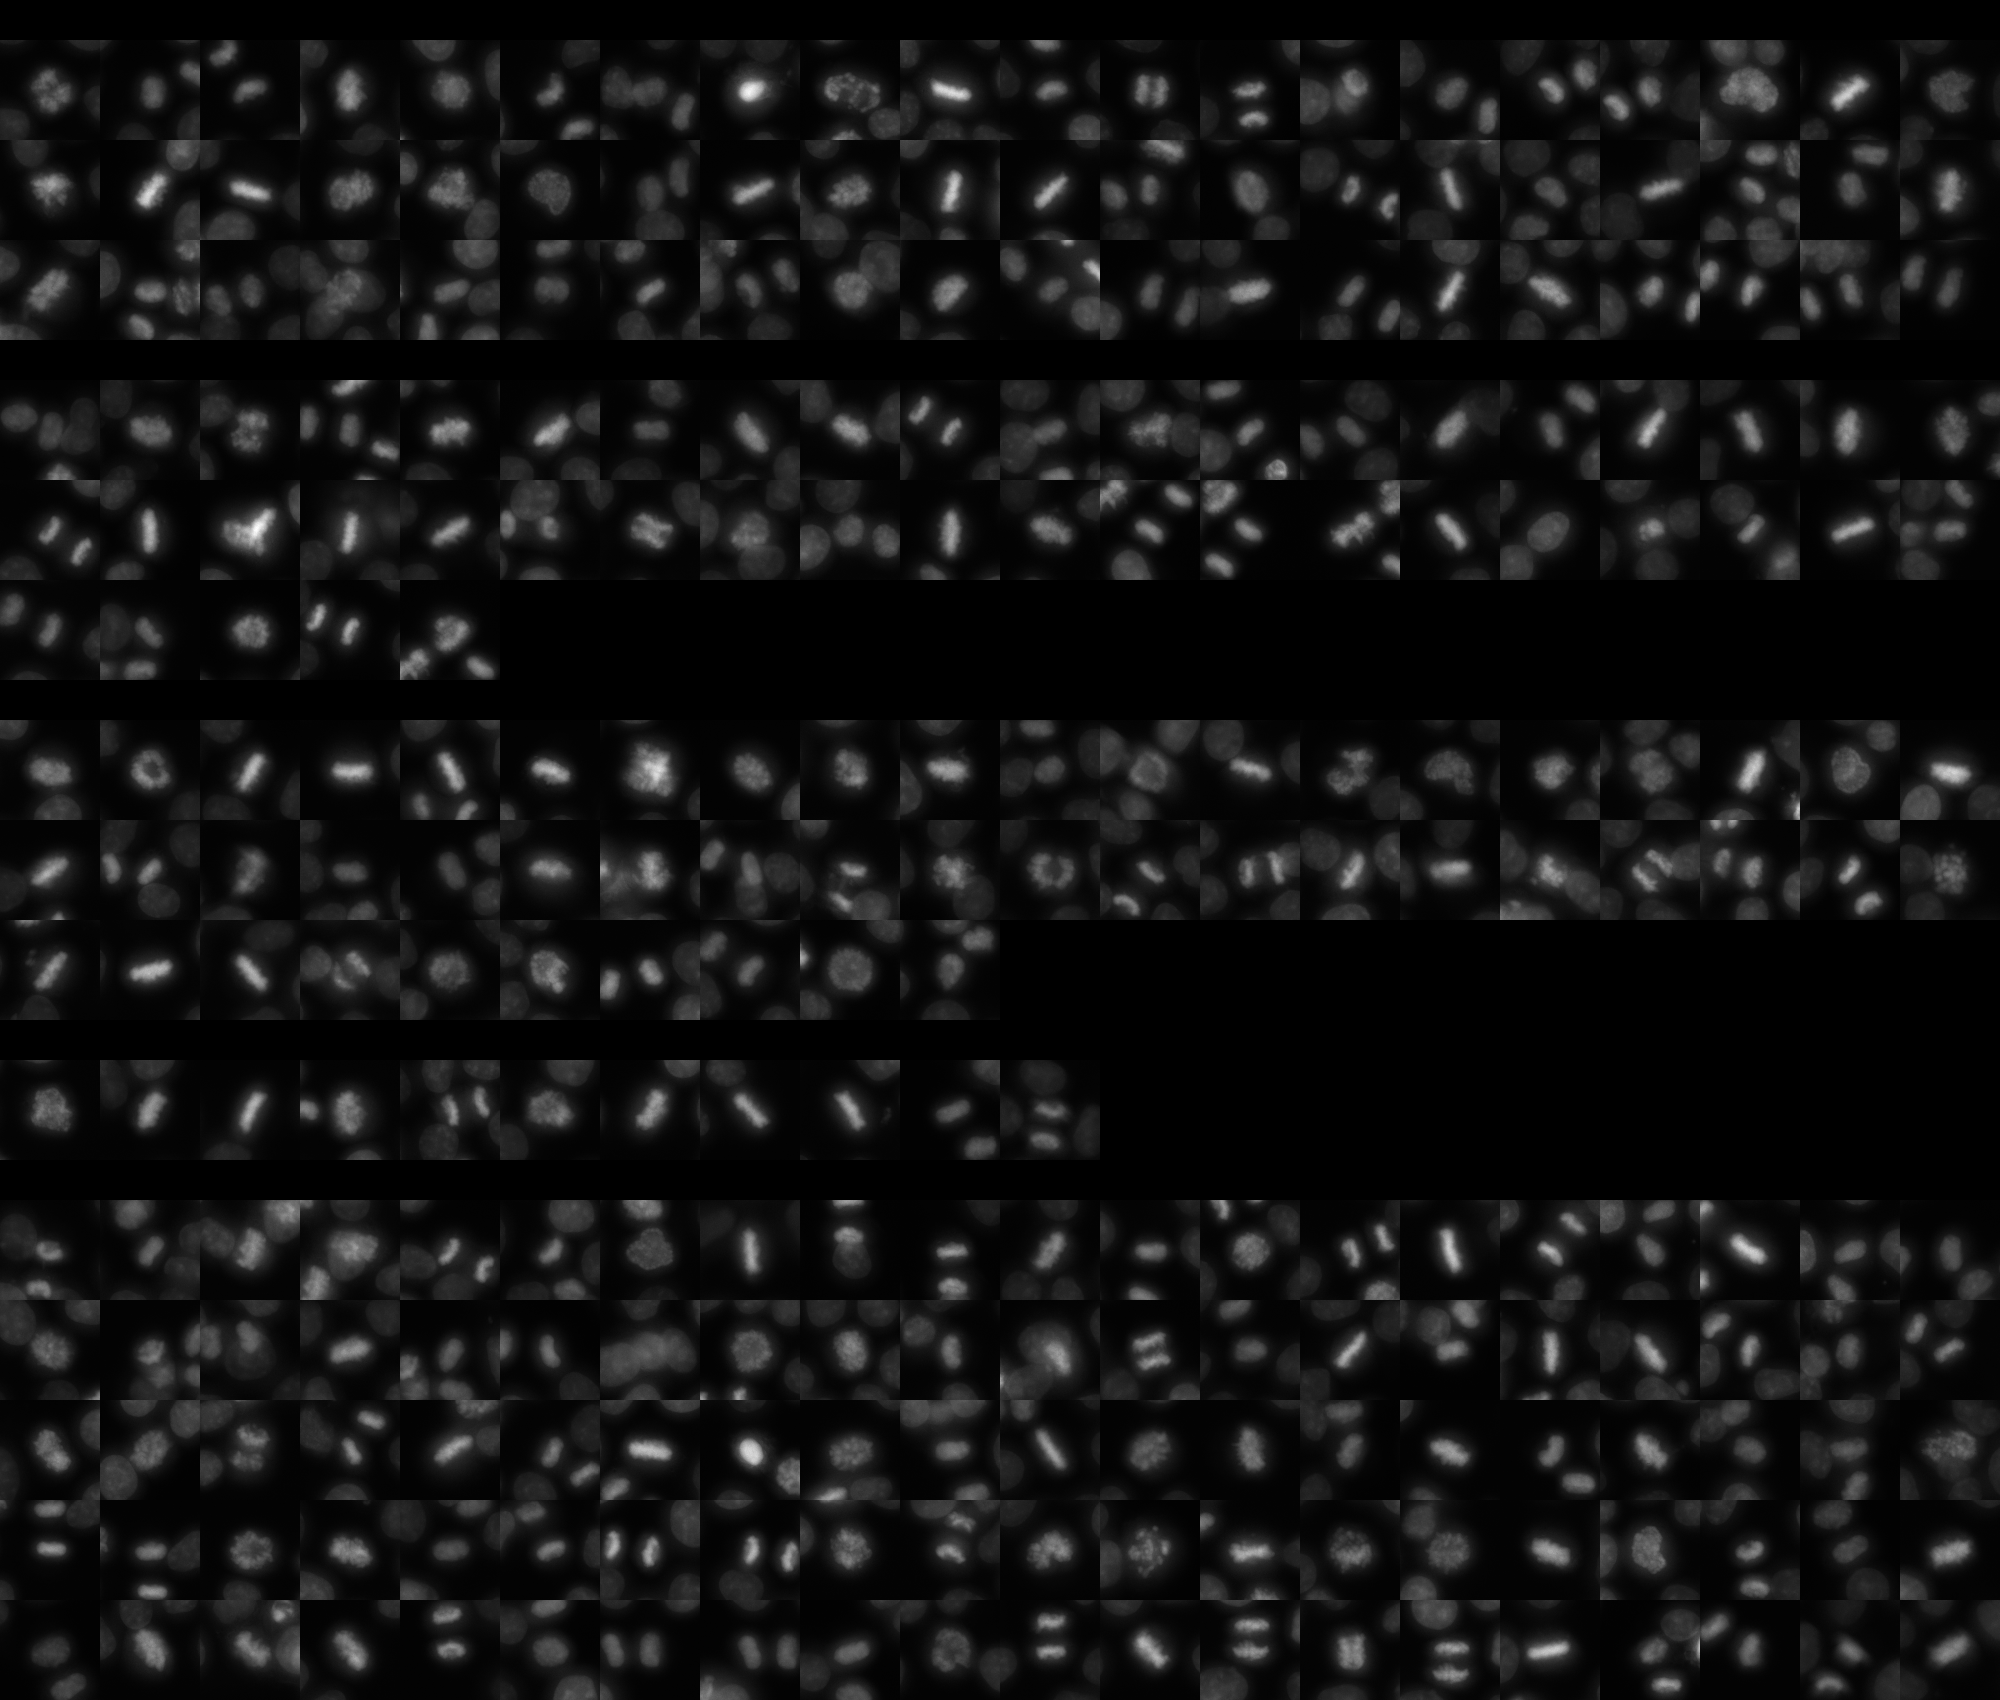
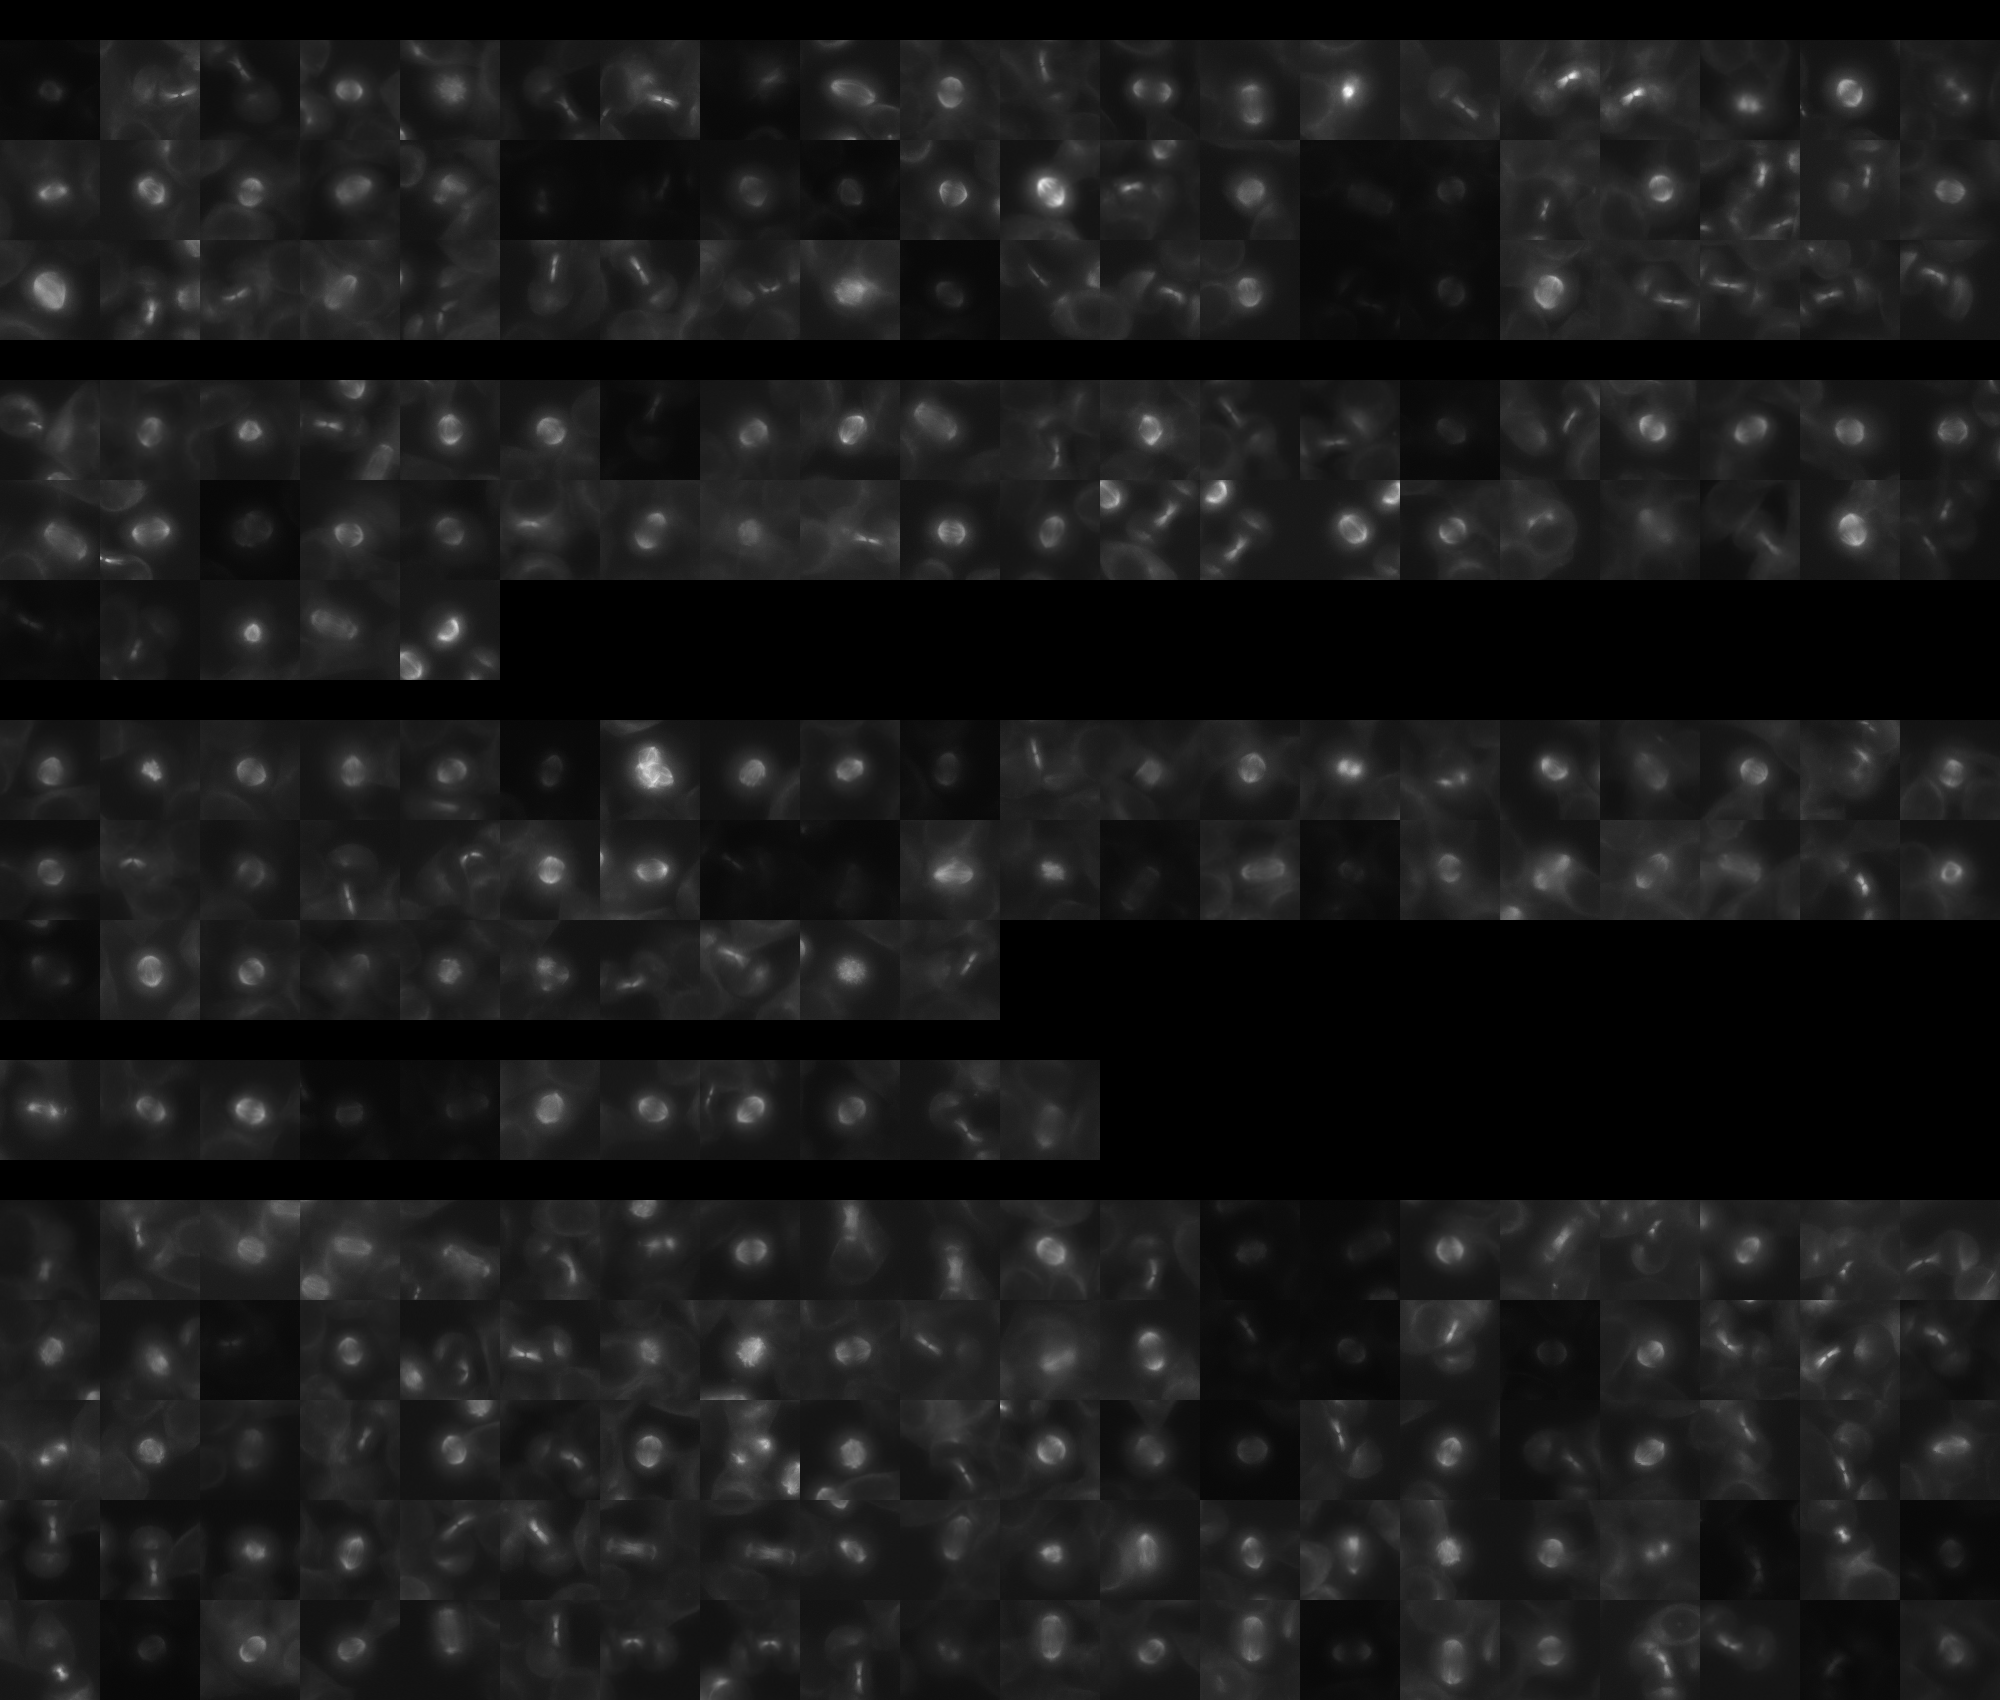
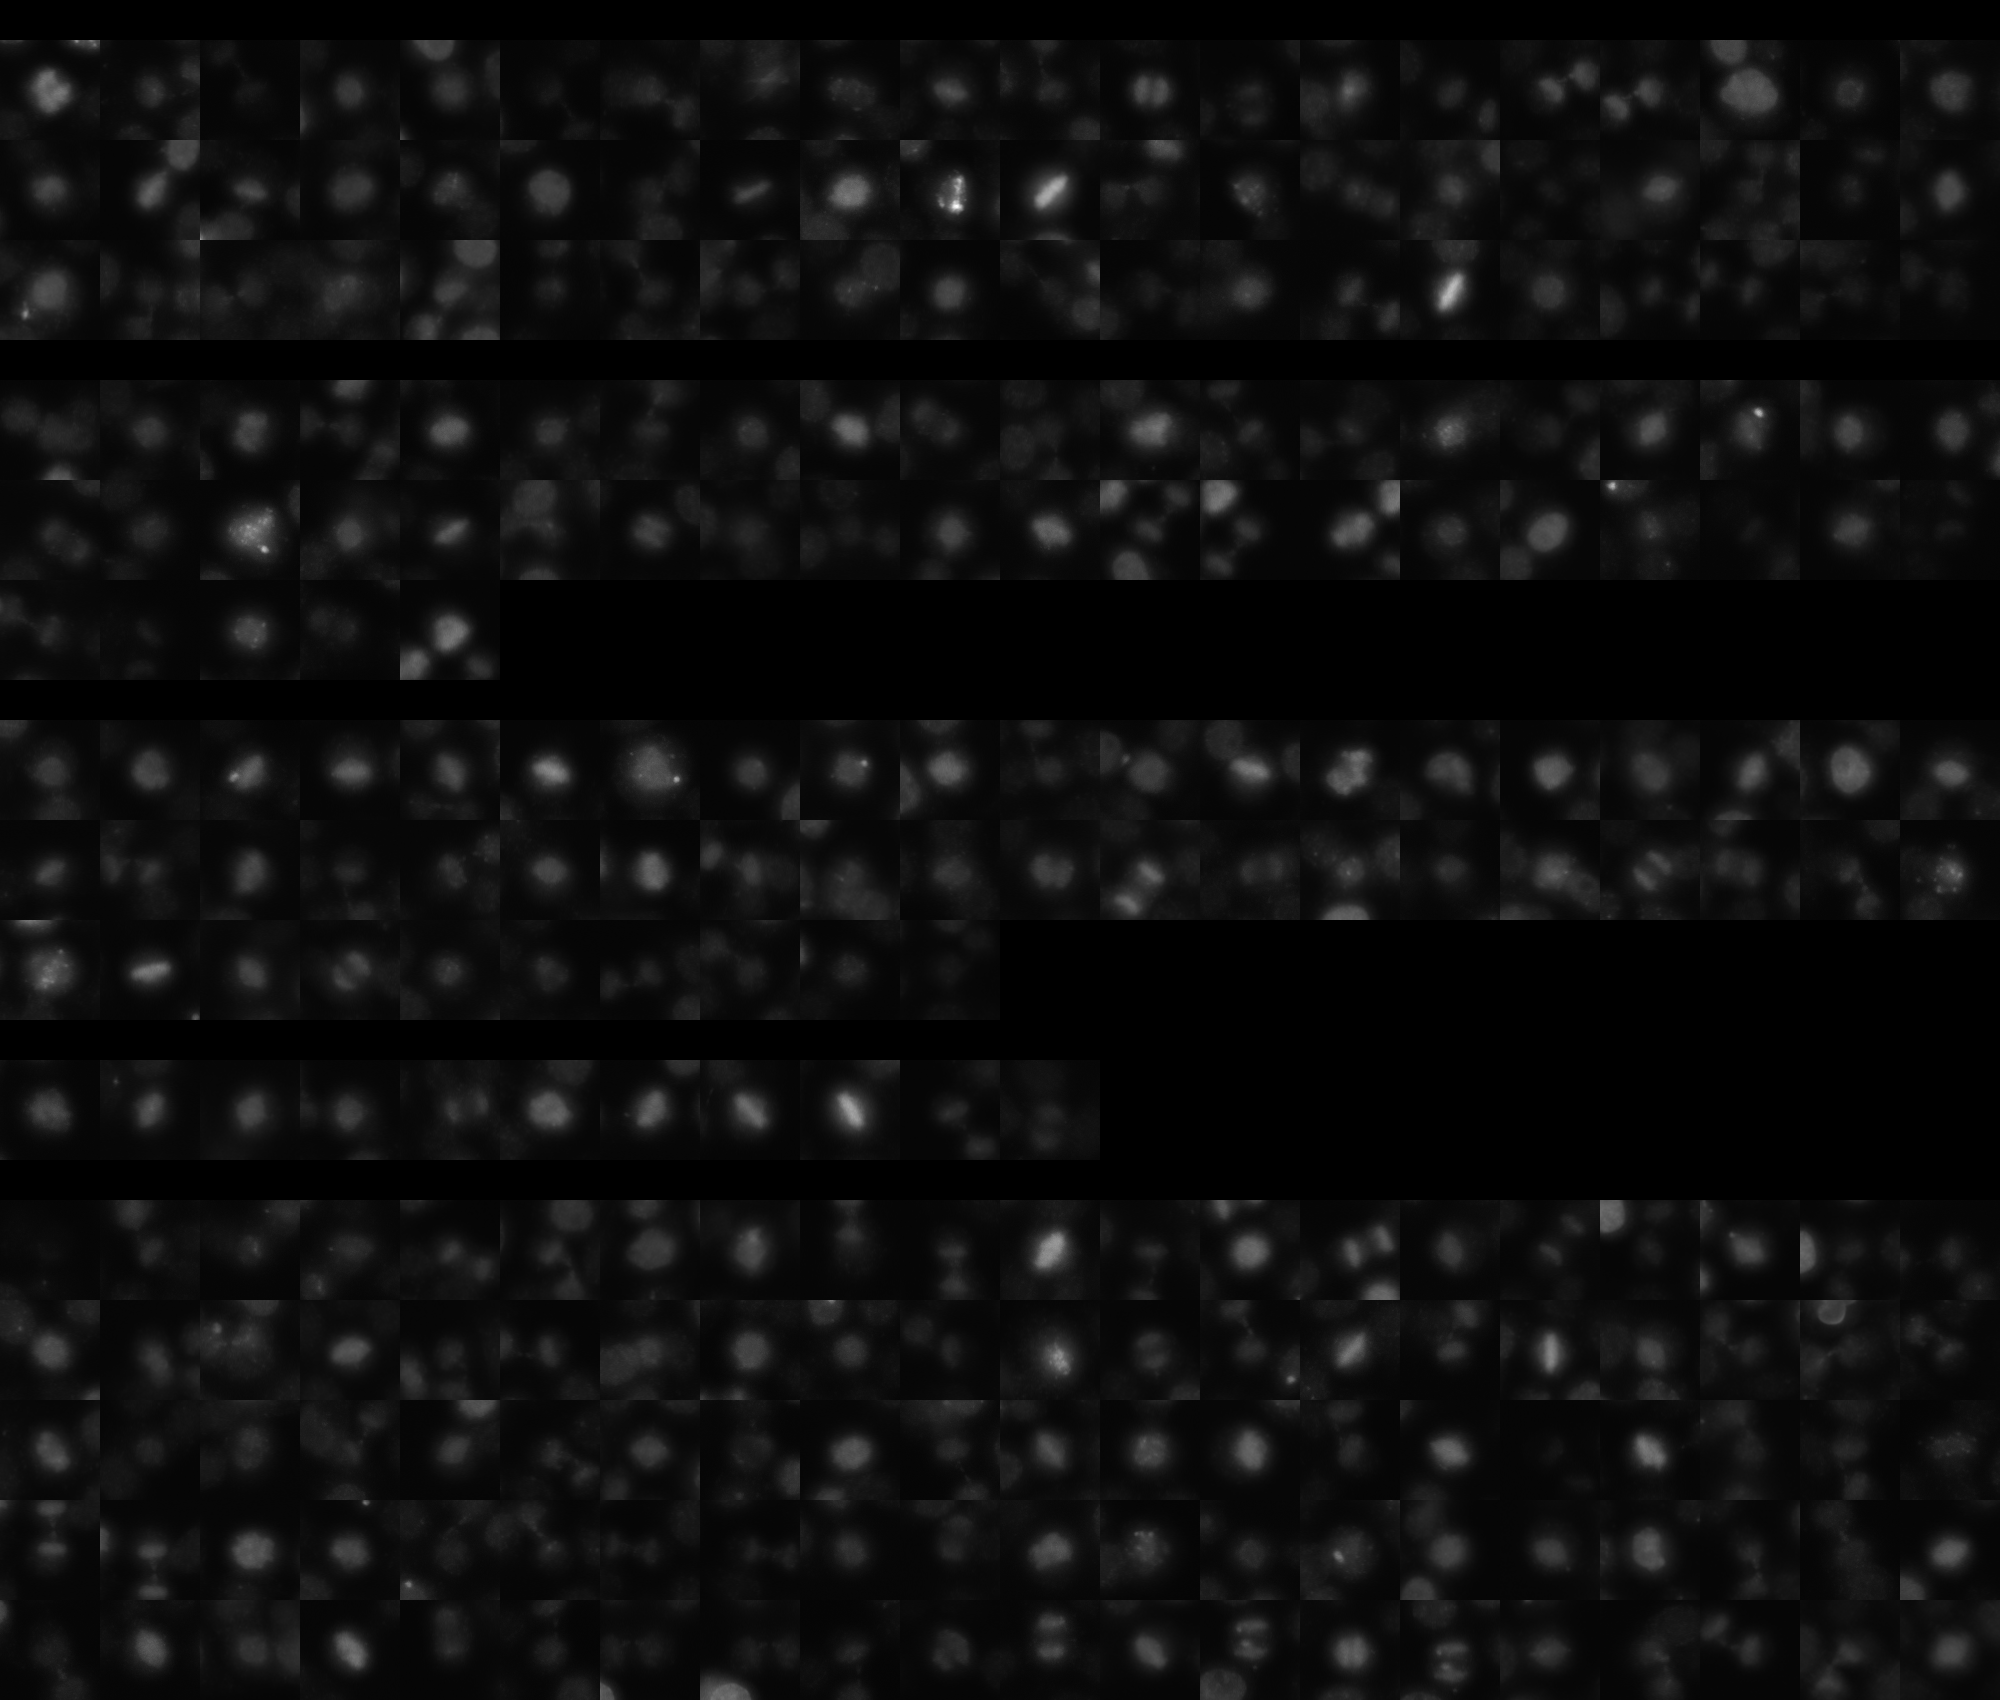
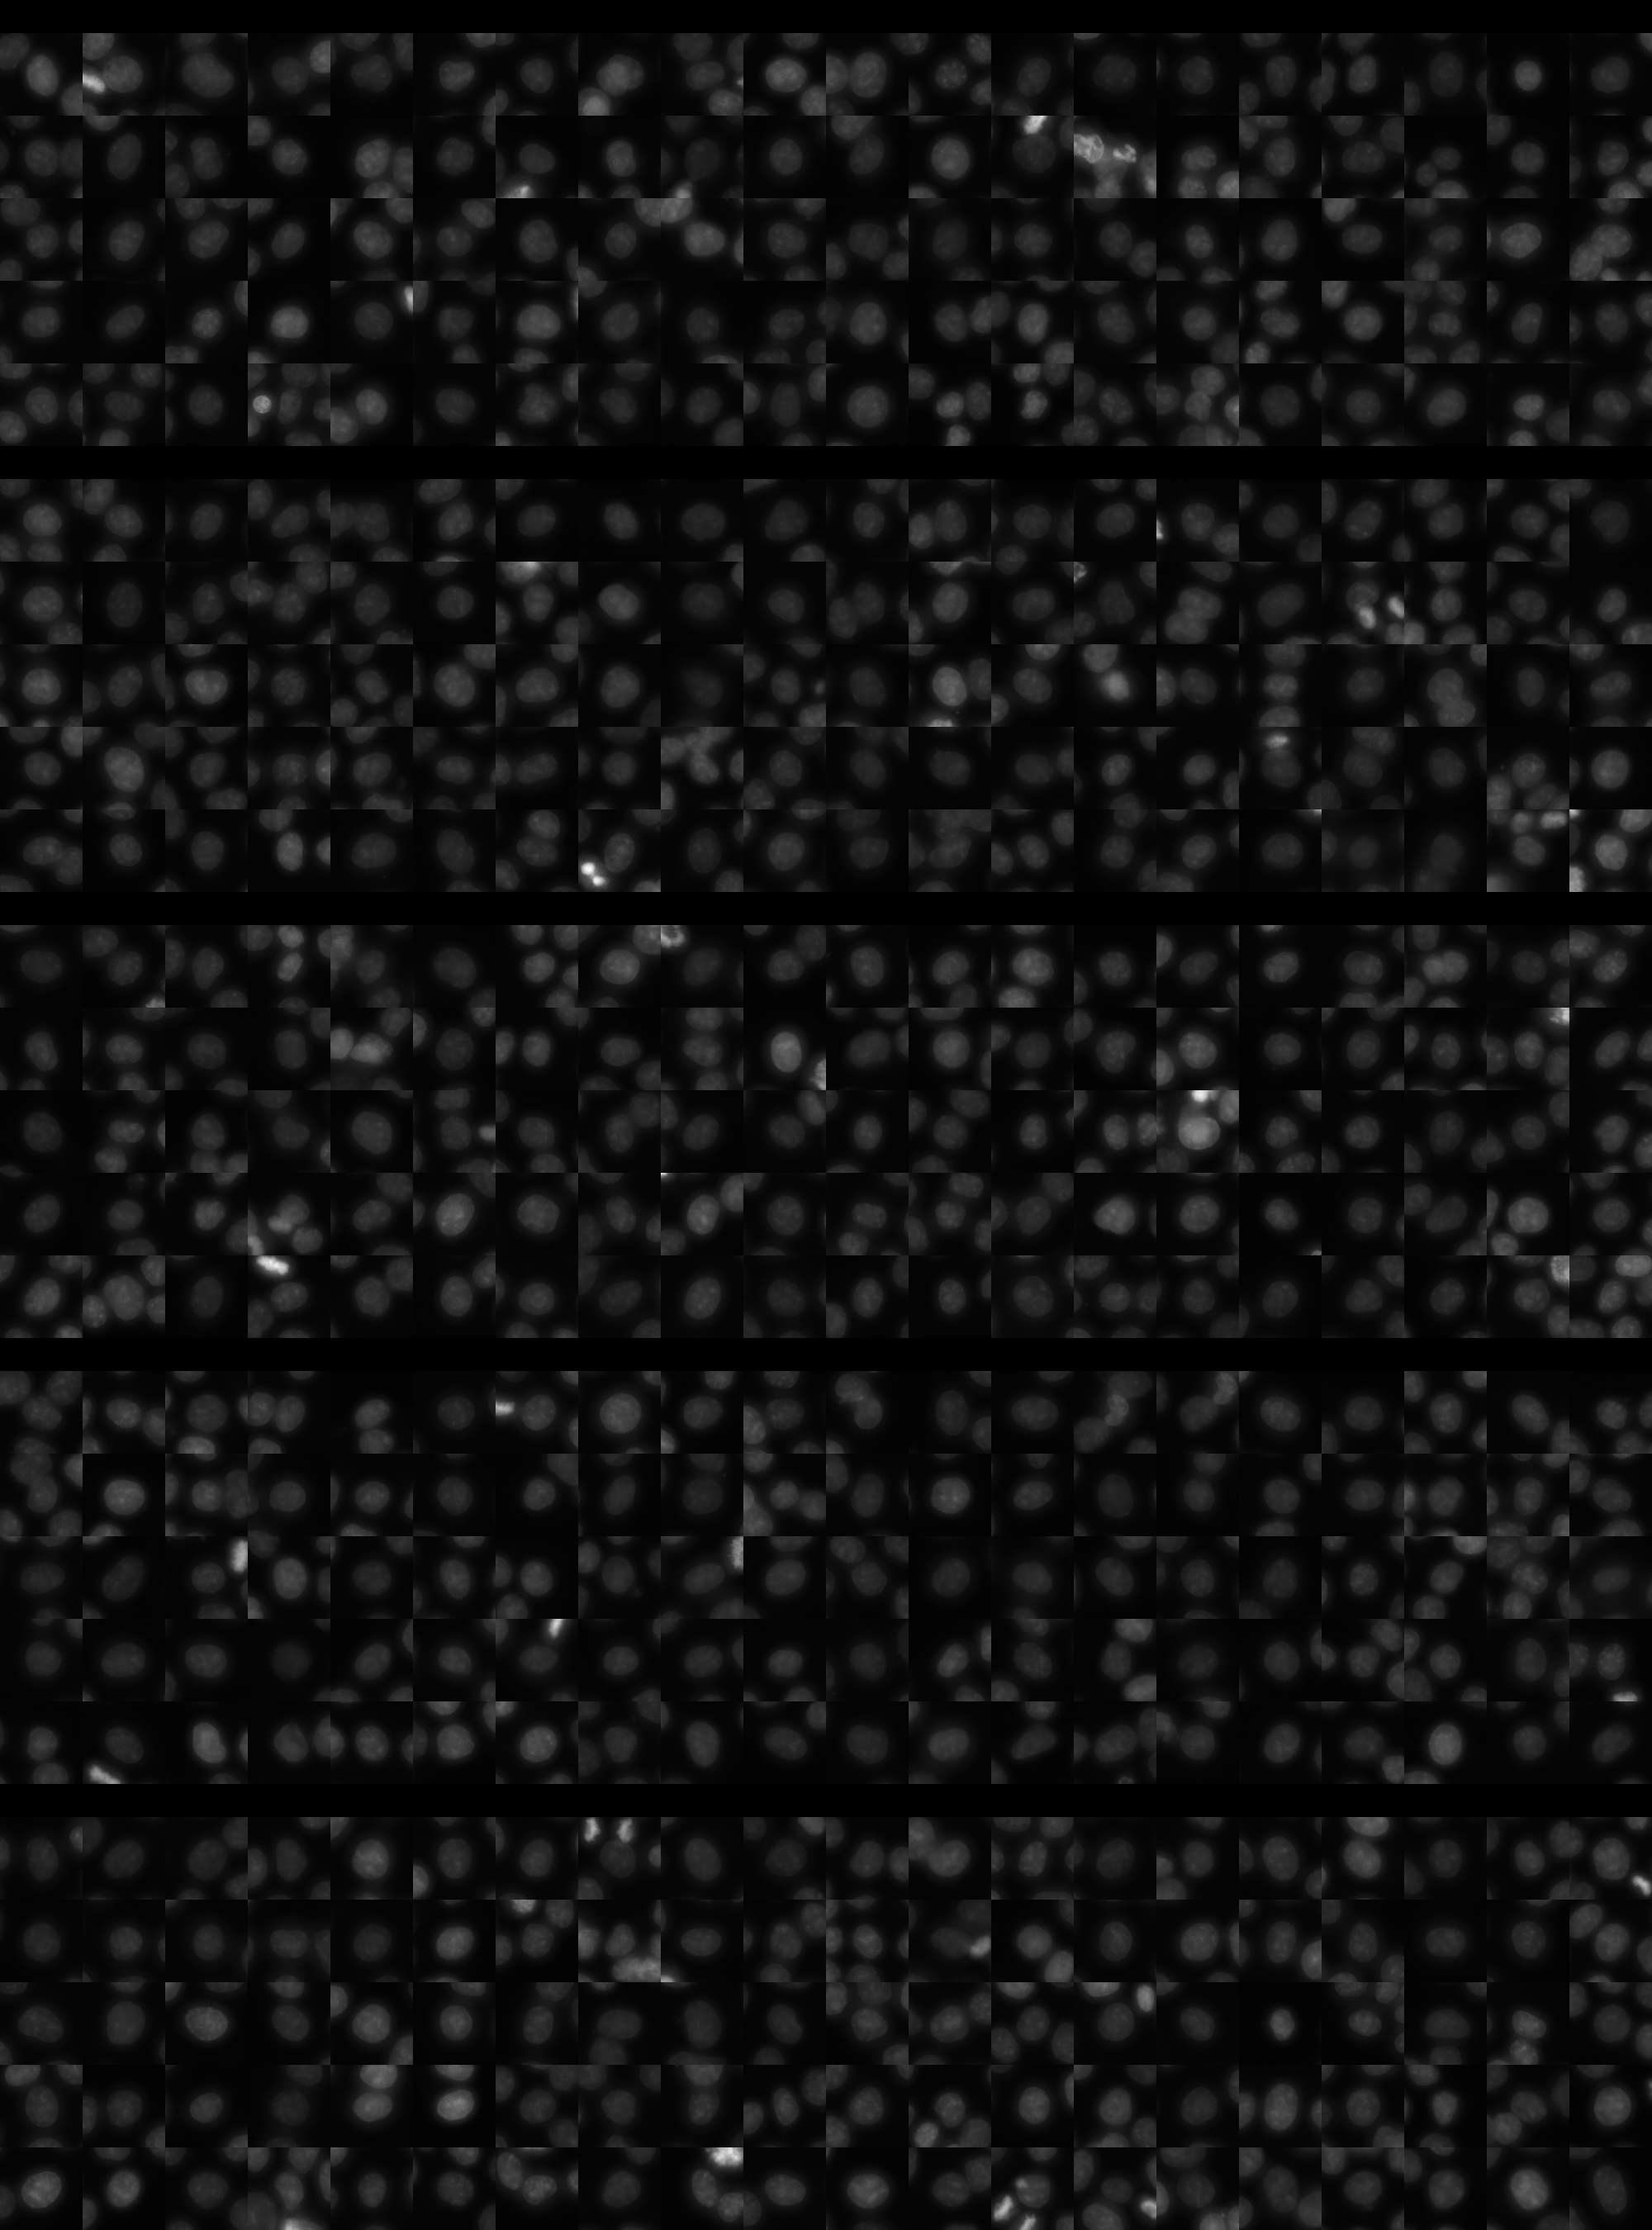
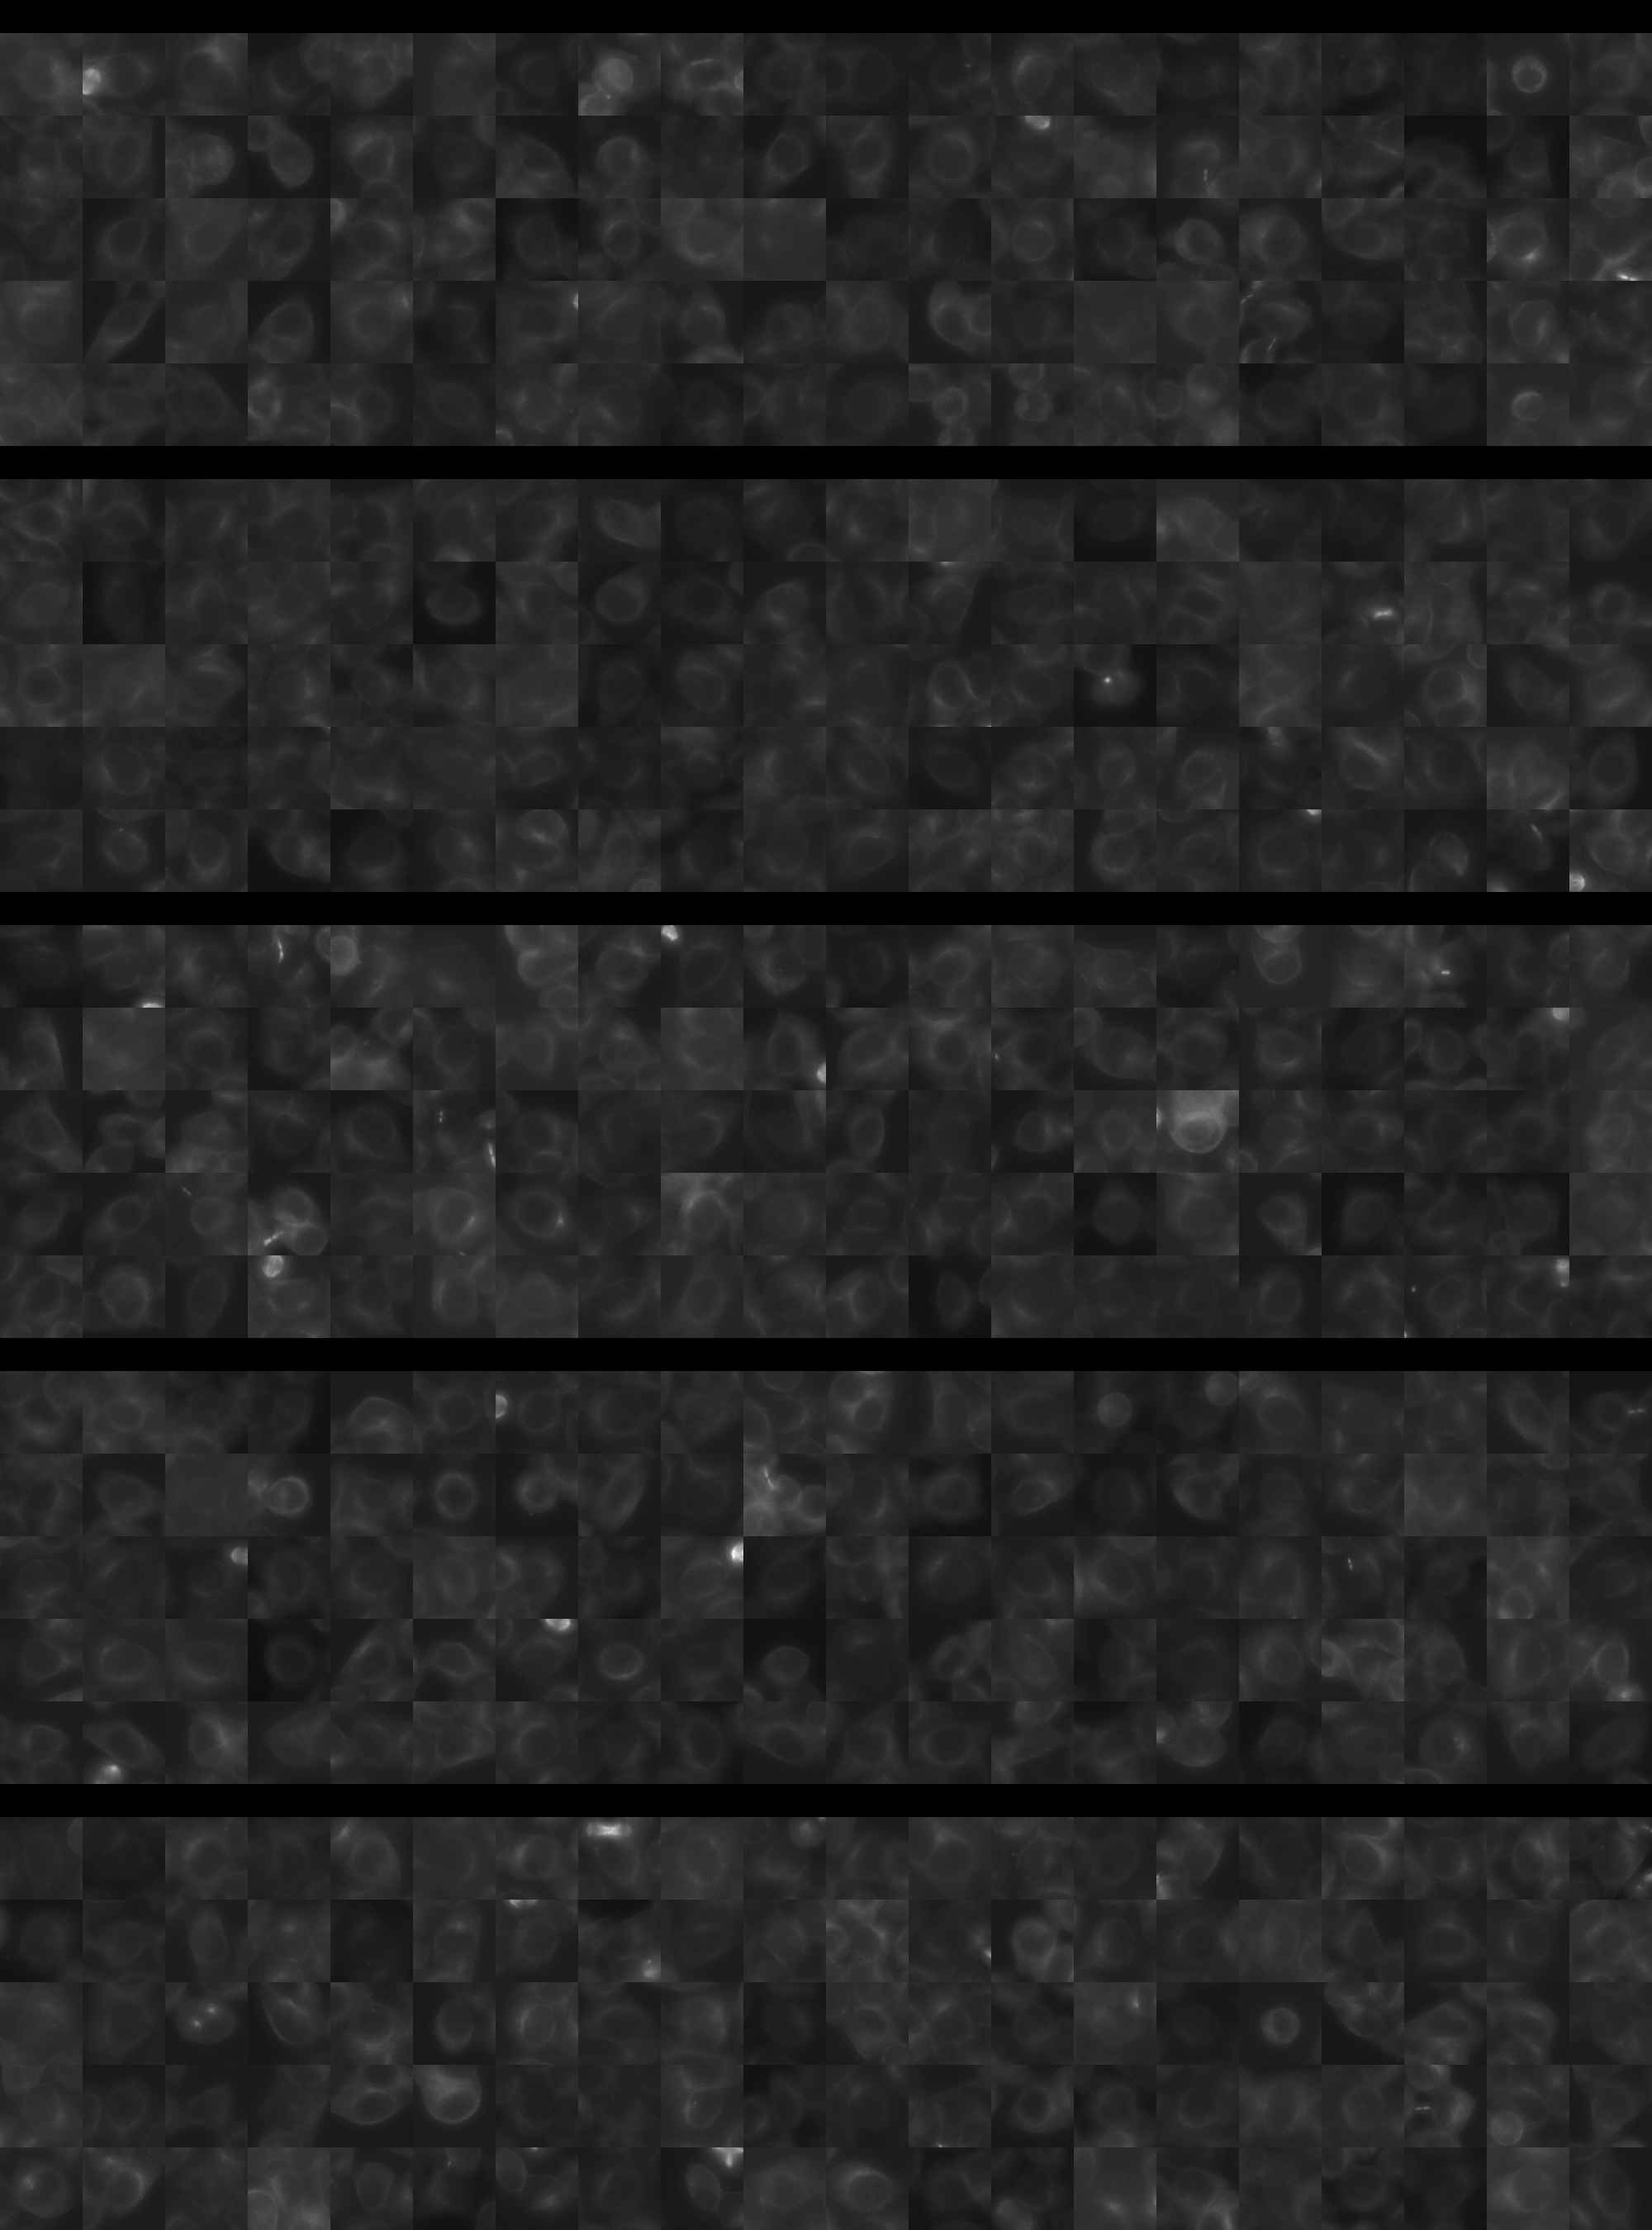
Each montage below shows randomly selected individual cell images for the same target gene separated by sgRNA, along with an example montage of cells expressing a non-targeting negative control sgRNA at the bottom. sgRNA labels in the montages correspond to the numbered sgRNA sequences in the gene info table above. The DNA (blue) and tubulin (green) channels are displayed by default, with gH2AX (grayscale) and actin (yellow) available using the check boxes. Channel brightness, contrast, and opacity are adjustable by clicking the arrow next to the channel name. When only one channel is selected, the display defaults to grayscale. Click the “Zoom” checkbox above the channel controls to enable image zooming (via scrolling) and panning (via click-and-drag).

The cell boxes displayed for this gene are square, 30.36 μm per side for the interphase montage and 30.36 μm per side for the mitotic montage.
Features

Interphase Score Rank FDR q-value
Nucleus DNA Integrated -4.289e-03 3335 of 5322 0.939
Nucleus DNA Mean -7.393e-02 4171 of 5322 0.066
Nucleus gH2AX Mean 0.052 3432 of 5322 0.164
Nucleus DNA - gH2AX Correlation -1.831e-02 1361 of 5322 0.498
Nucleus Shape Area 0.010 2933 of 5322 0.966
Nucleus Shape Eccentricity 0.011 2739 of 5322 0.804
Nucleus Shape Form Factor -3.168e-02 1801 of 5322 0.437
Nucleus Shape Solidity -3.656e-02 2073 of 5322 0.273
Cell DNA Mass Displacement 0.026 2634 of 5322 0.688
Cell Tubulin Mean -2.429e-02 3662 of 5322 0.667
Cell Tubulin Mass Displacement 0.035 1037 of 5322 0.455
Cell Actin Mean -7.728e-02 4743 of 5322 0.086
Cell Tubulin - Actin Correlation -2.241e-02 4563 of 5322 0.643
Cell DNA - Tubulin Correlation -7.033e-03 4079 of 5322 0.879
Cell Shape Area 0.014 2727 of 5322 0.961
Cell Shape Eccentricity 0.002 3561 of 5322 0.981
Mitotic Score Rank FDR q-value
Nucleus DNA Integrated 0.170 1575 of 5322 0.906
Nucleus DNA Mean 0.155 904 of 5322 1.000
Nucleus DNA Mass Displacement 0.127 1530 of 5322 0.999
Nucleus DNA Mean Frac 3 0.067 2056 of 5322 1.000
Nucleus gH2AX Mean 0.112 1477 of 5322 1.000
Nucleus gH2AX Mean Frac 0 -8.148e-02 3537 of 5322 1.000
Nucleus Tubulin Mean Frac 0 0.060 2575 of 5322 0.999
Nucleus Tubulin Mean Edge 0.131 1477 of 5322 0.999
Nucleus Tubulin Std Edge 0.054 1811 of 5322 0.999
Nucleus Shape Area 0.244 1120 of 5322 0.847
Nucleus Shape Eccentricity 0.122 655 of 5322 1.000
Nucleus Shape Form Factor -1.817e-01 3960 of 5322 0.998
Cell Tubulin Mean 0.055 2720 of 5322 0.997
Cell Tubulin Mean Frac 3 -5.971e-02 2441 of 5322 0.999
Cell Actin Mean 0.291 400 of 5322 0.927
Cell Shape Area 0.138 2103 of 5322 0.998
( Reset Zoom )
Brightness
Contrast
Opacity
Brightness
Contrast
Opacity
Brightness
Contrast
Opacity
Brightness
Contrast
Opacity
Brightness
Contrast
Opacity

( Reset Zoom )
Brightness
Contrast
Opacity
Brightness
Contrast
Opacity
Brightness
Contrast
Opacity
Brightness
Contrast
Opacity
Brightness
Contrast
Opacity

MIT Central Accessability