PLEC

Gene symbol: PLEC
Gene: 5339
Uniprot Function: Interlinks intermediate filaments with microtubules and microfilaments and anchors intermediate filaments to desmosomes or hemidesmosomes. Could also bind muscle proteins such as actin to membrane complexes in muscle. May be involved not only in the filaments network, but also in the regulation of their dynamics. Structural component of muscle. Isoform 9 plays a major role in the maintenance of myofiber integrity.
Mitotic Index 0.0235
Interphase Cluster: #89 (25 genes)
Mitotic Cluster: #140 (20 genes)
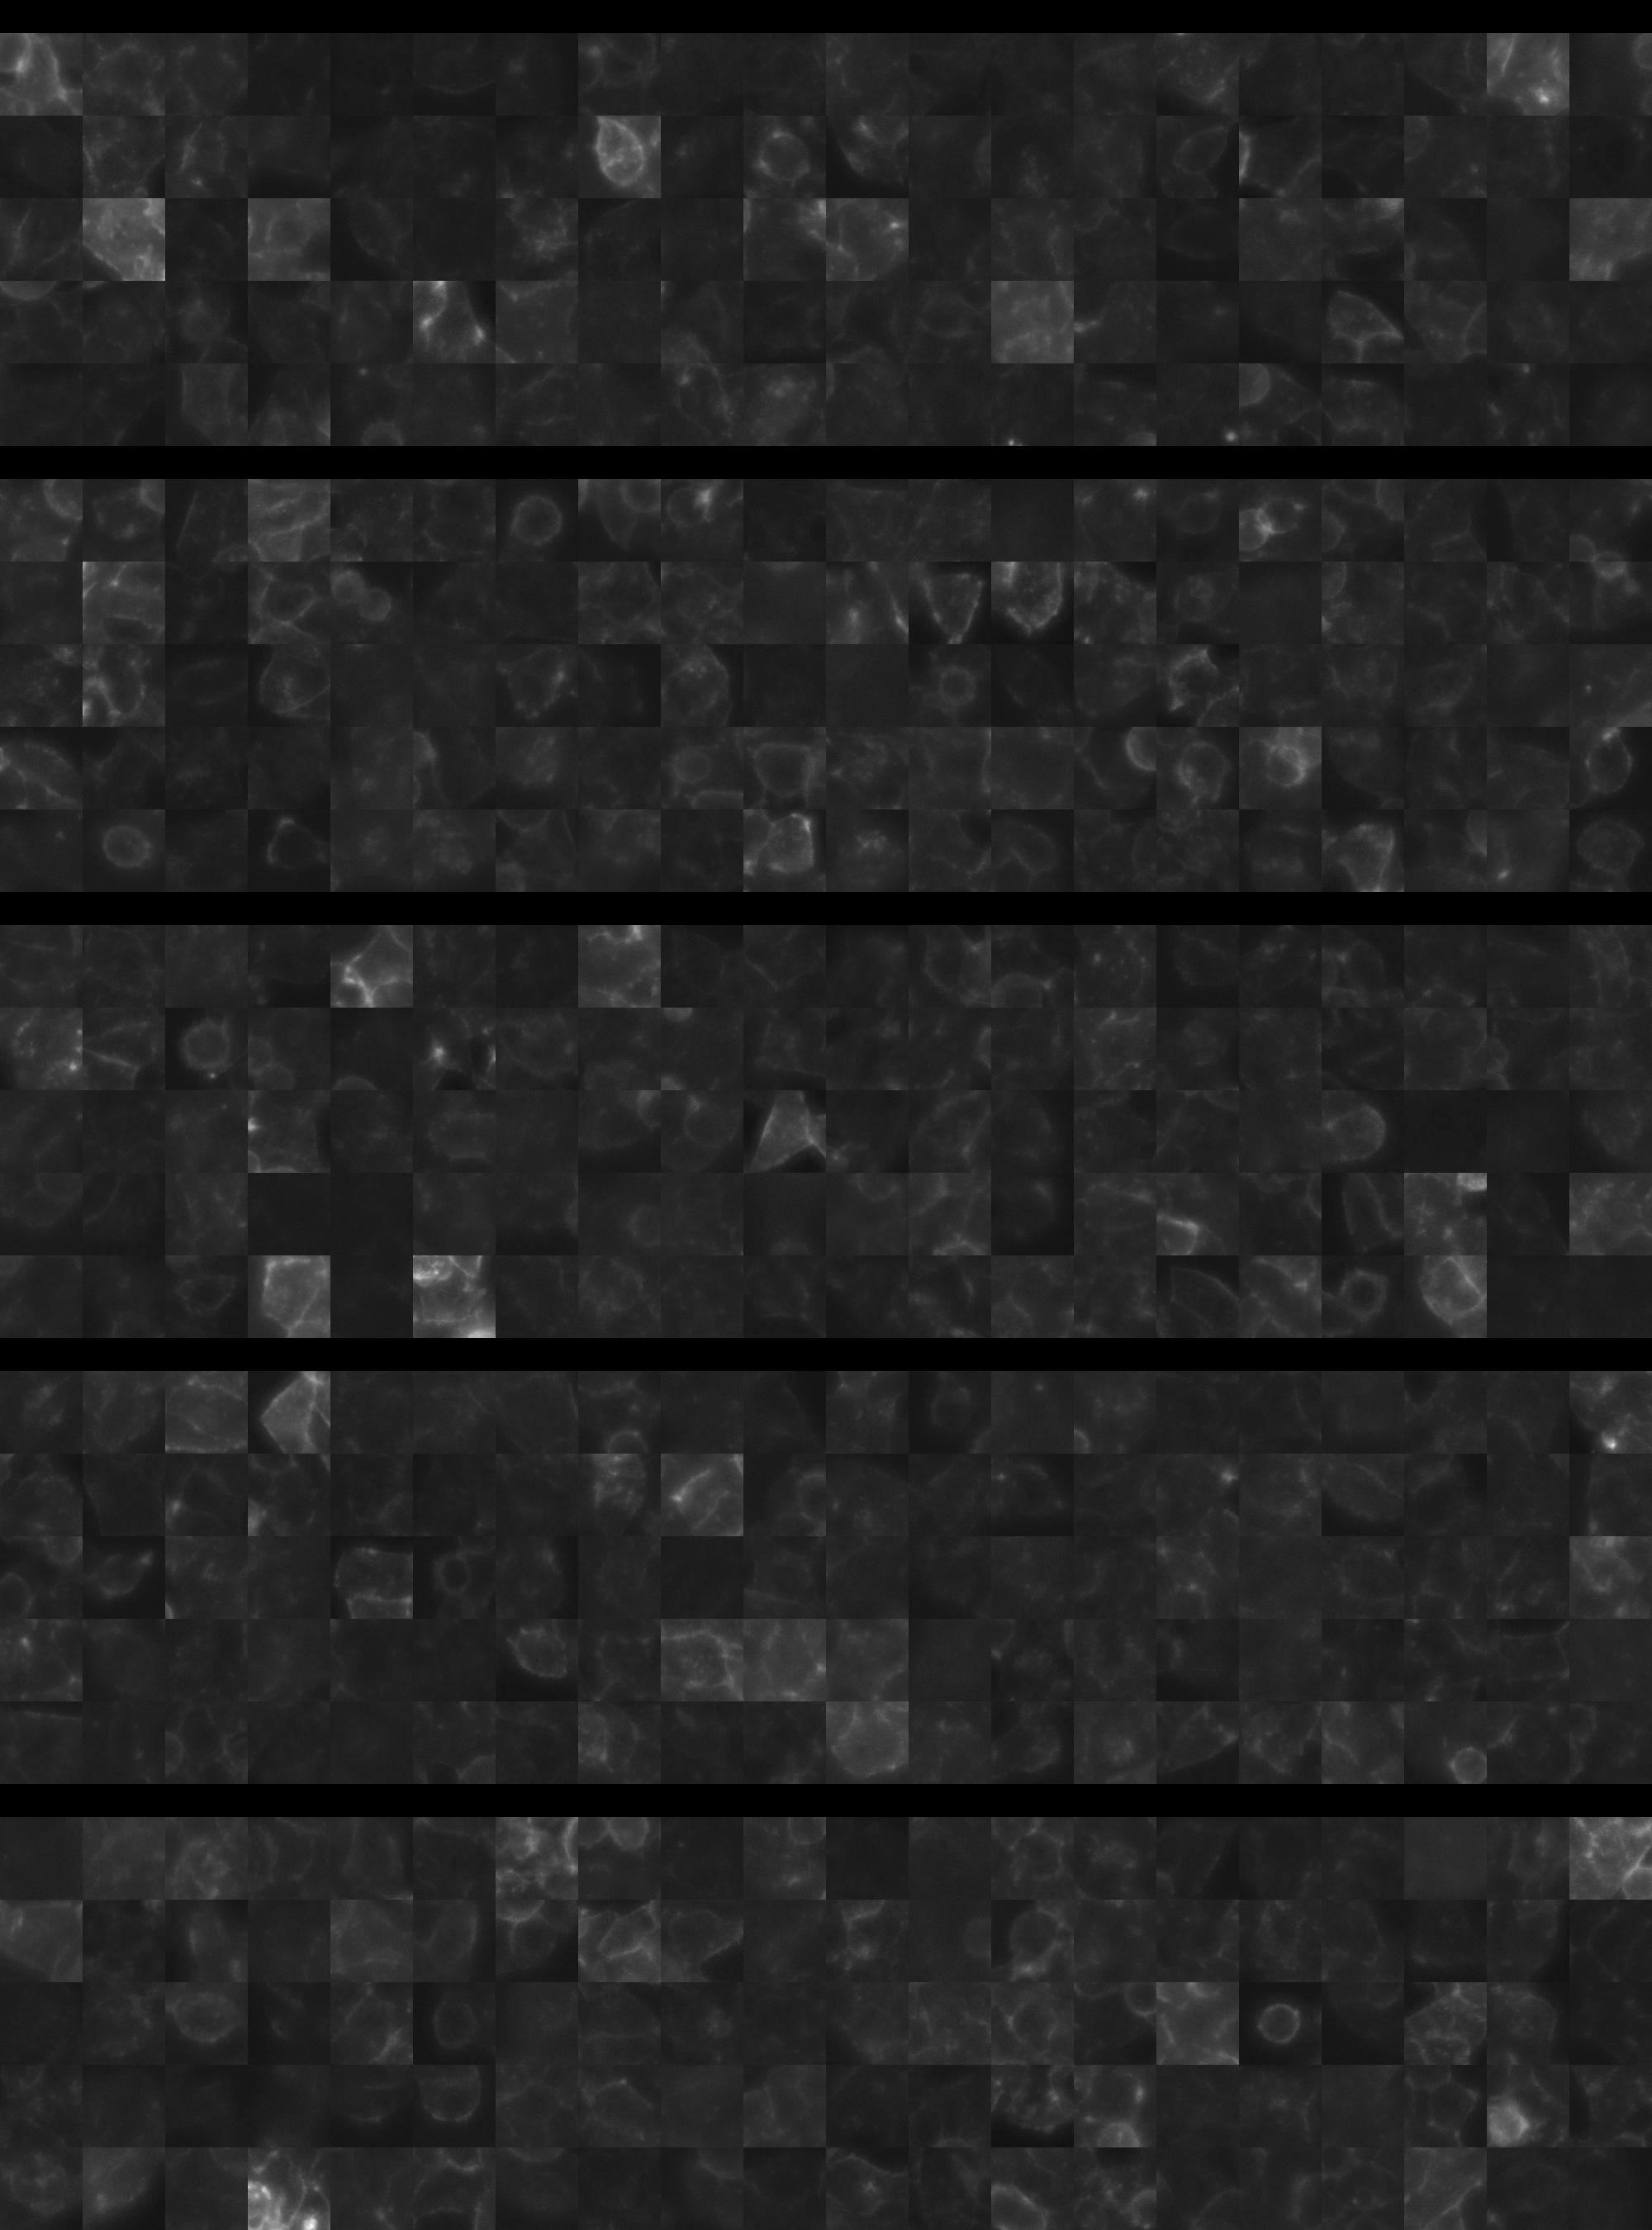
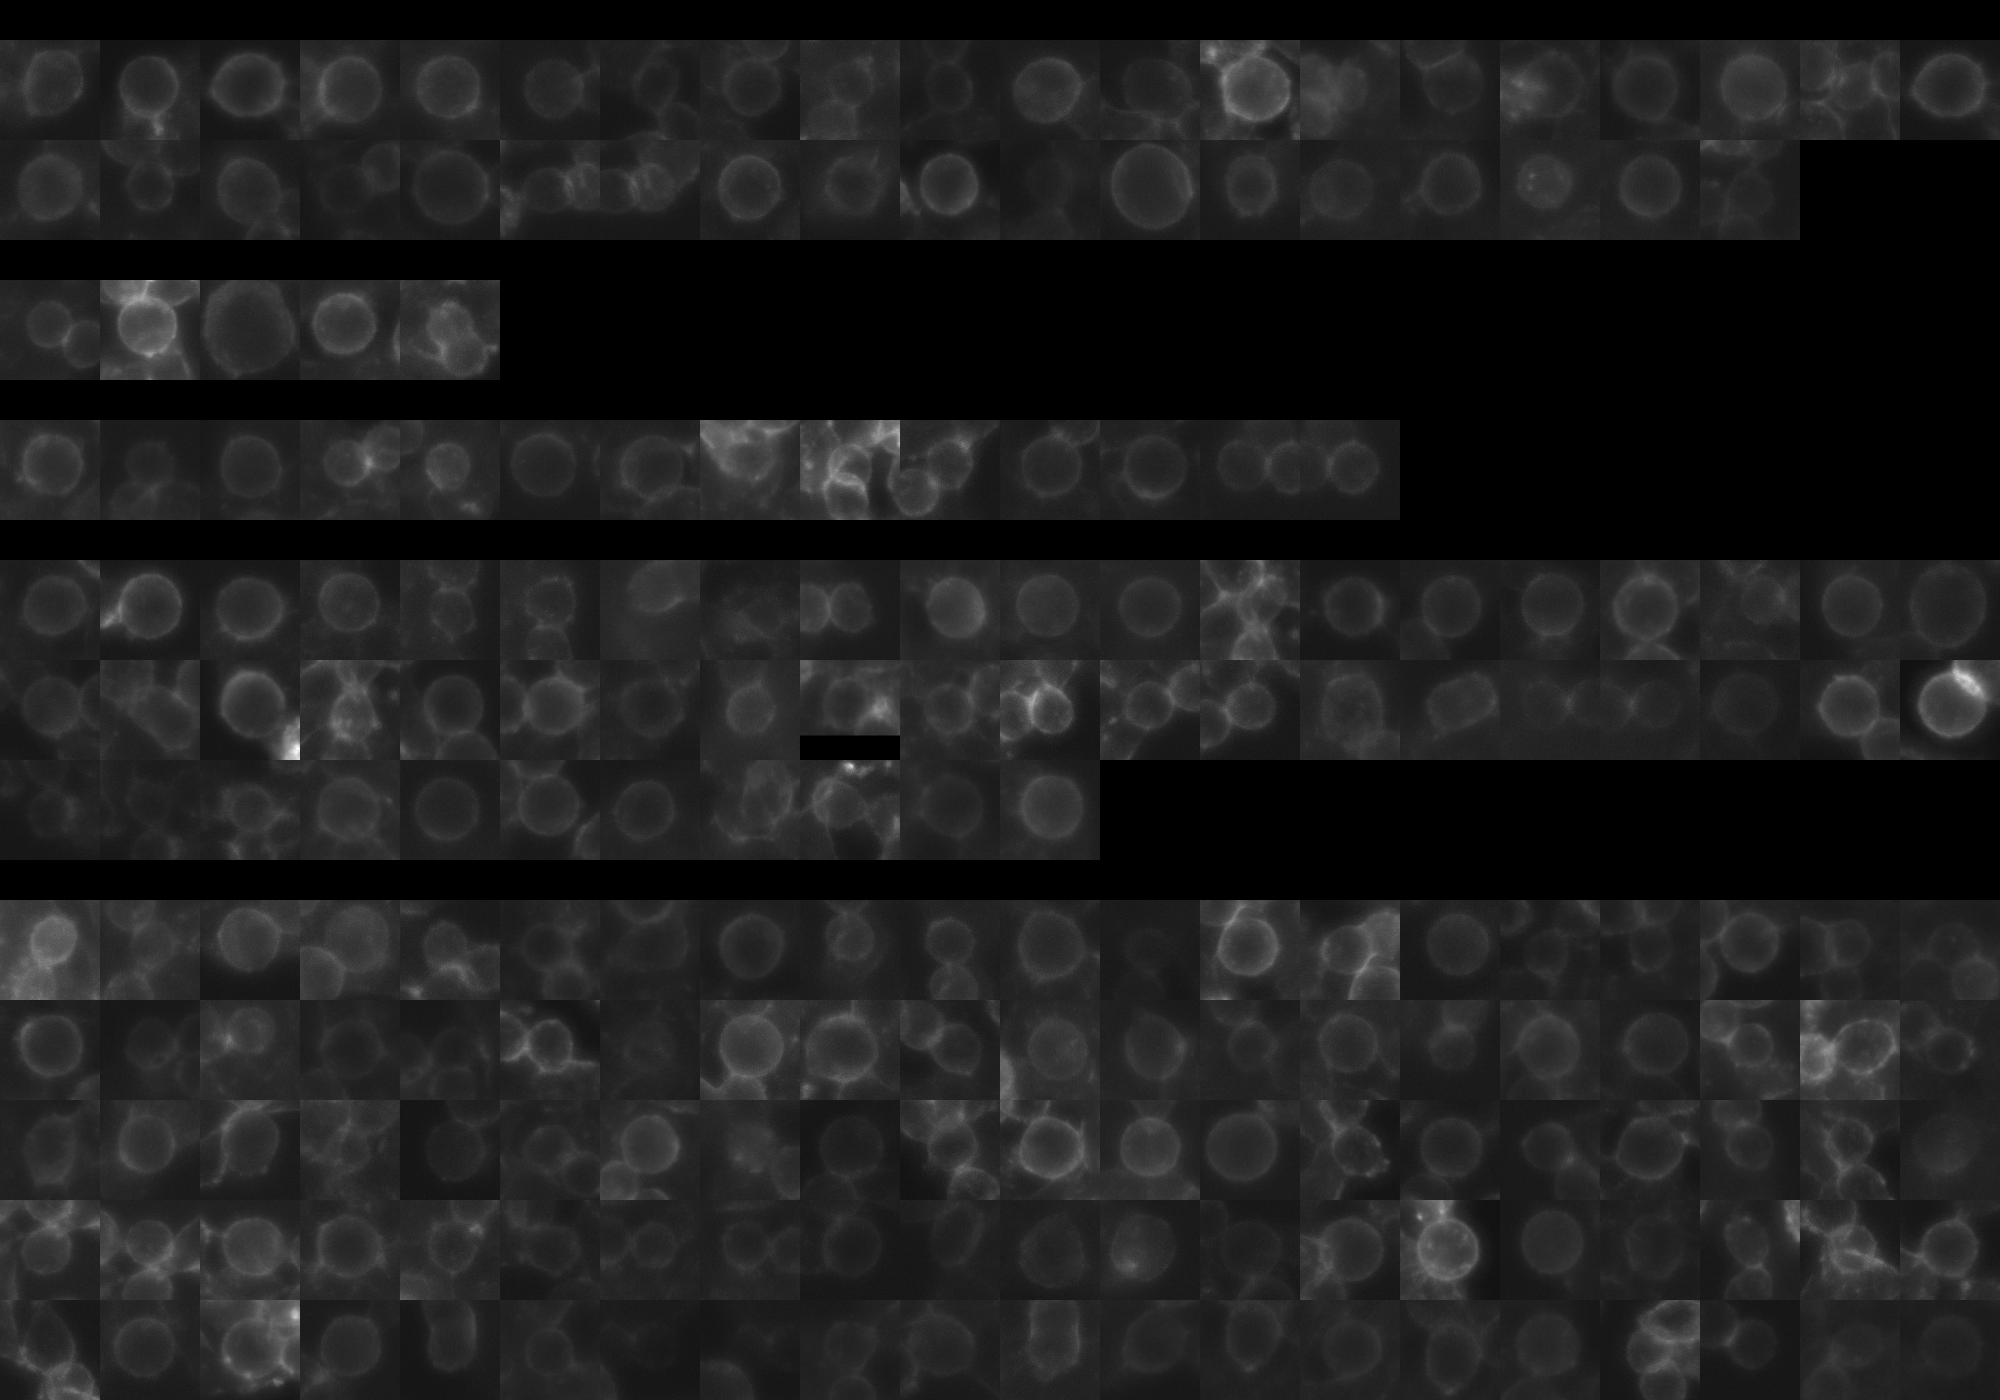
sgRNA 1: CACCTGCTTATAGTCGCACA (interphase cells: 1525, mitotic cells: 38)
sgRNA 2: CCGTGCGAGCTCGTCCACCG (interphase cells: 280, mitotic cells: 5)
sgRNA 3: TATGAGGTGCTCTTCCGCGA (interphase cells: 718, mitotic cells: 14)
sgRNA 4: TCGAAACGATACCTTCAGAG (interphase cells: 1956, mitotic cells: 51)

Interphase Cluster

Mitotic Cluster

Overview

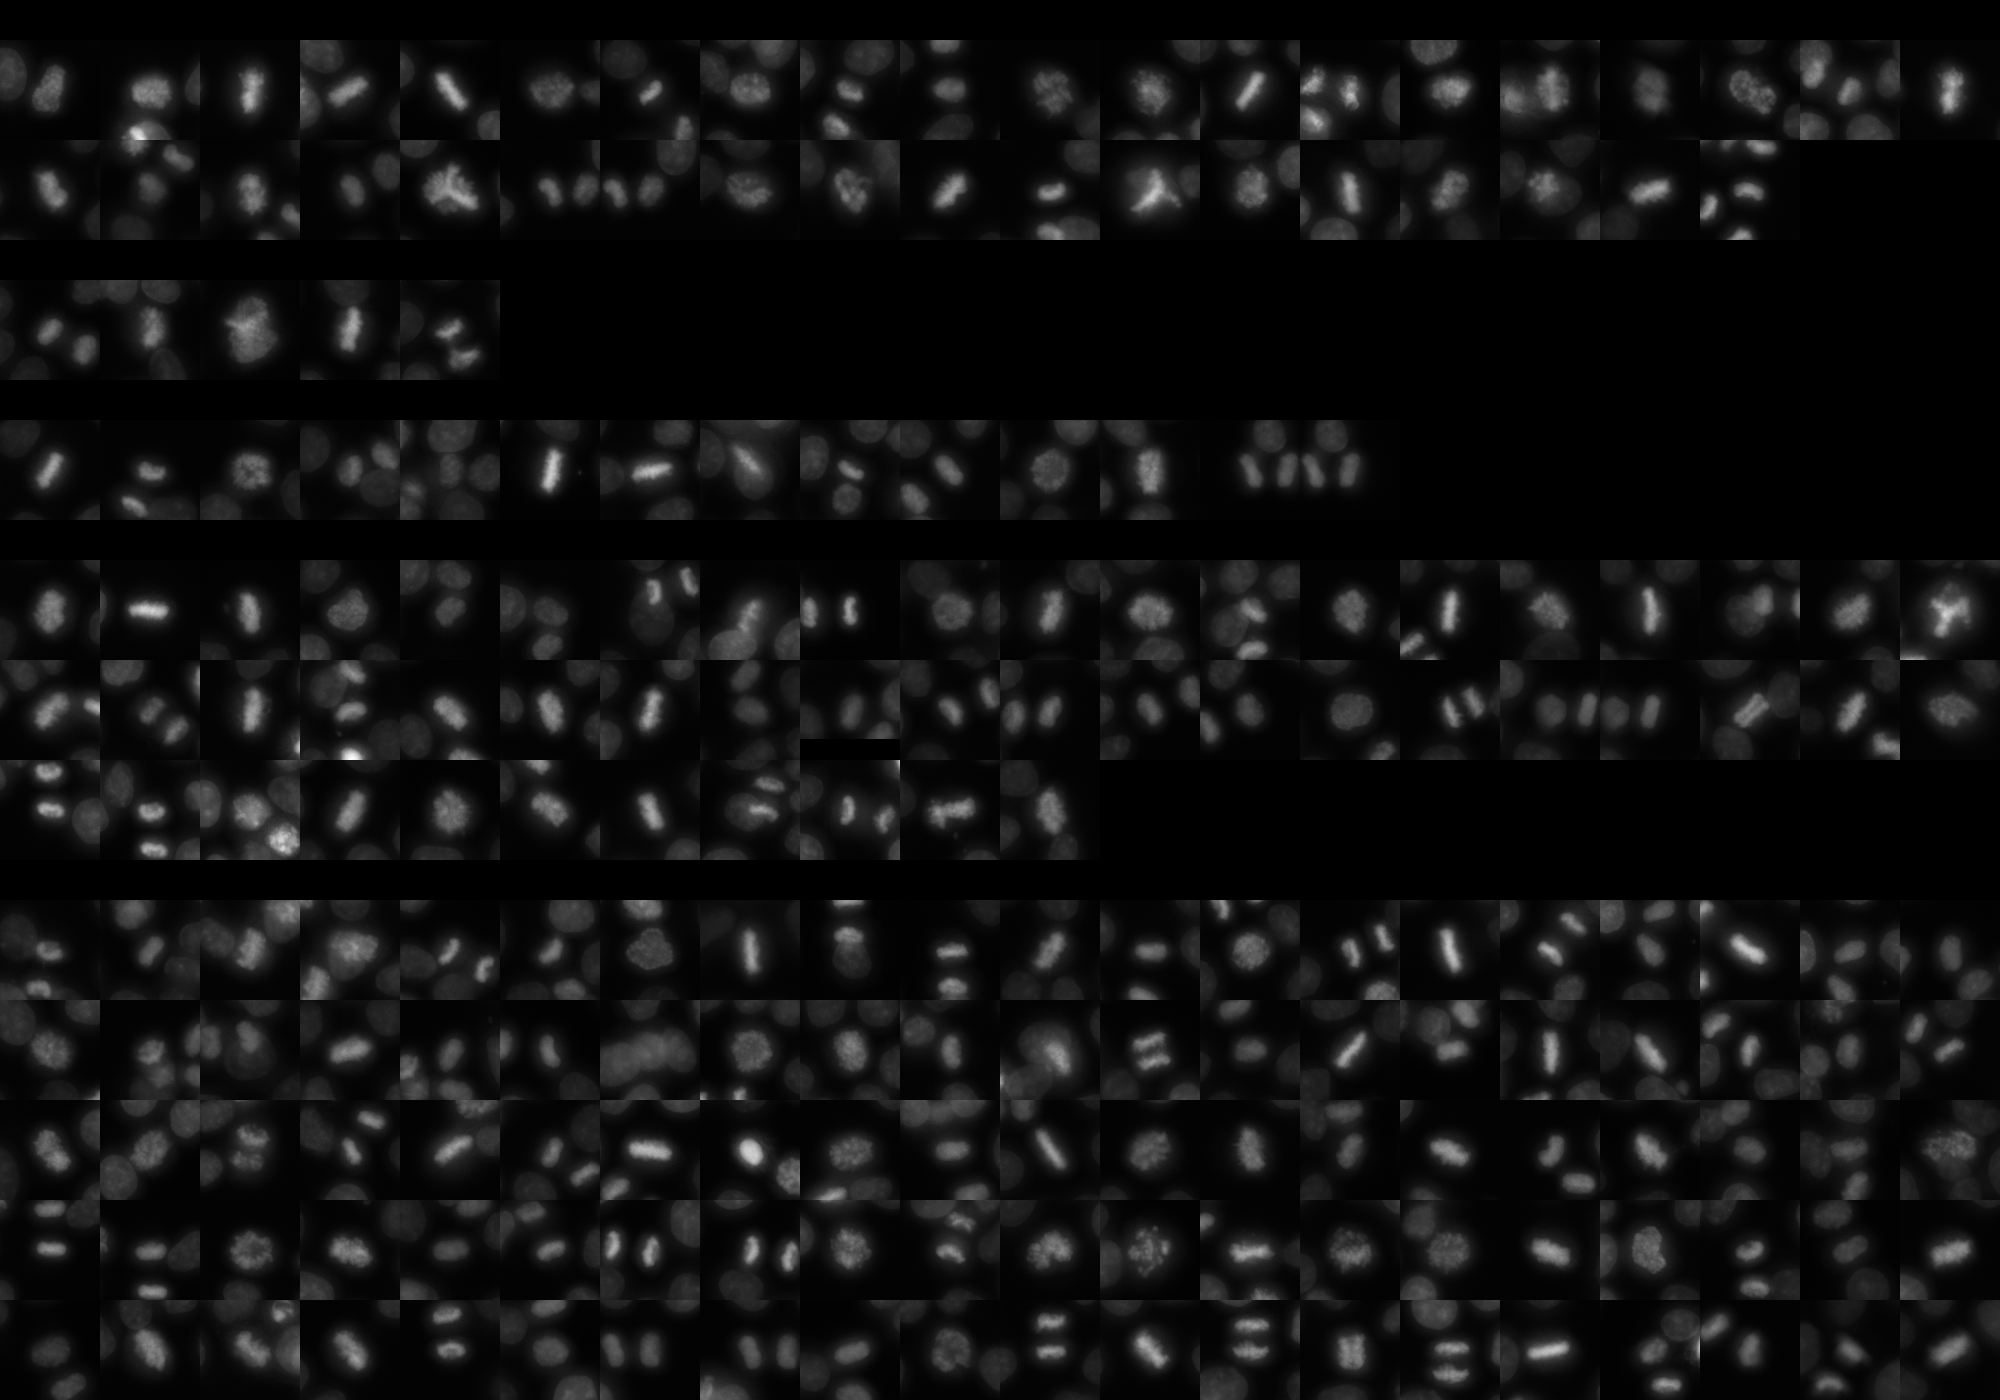
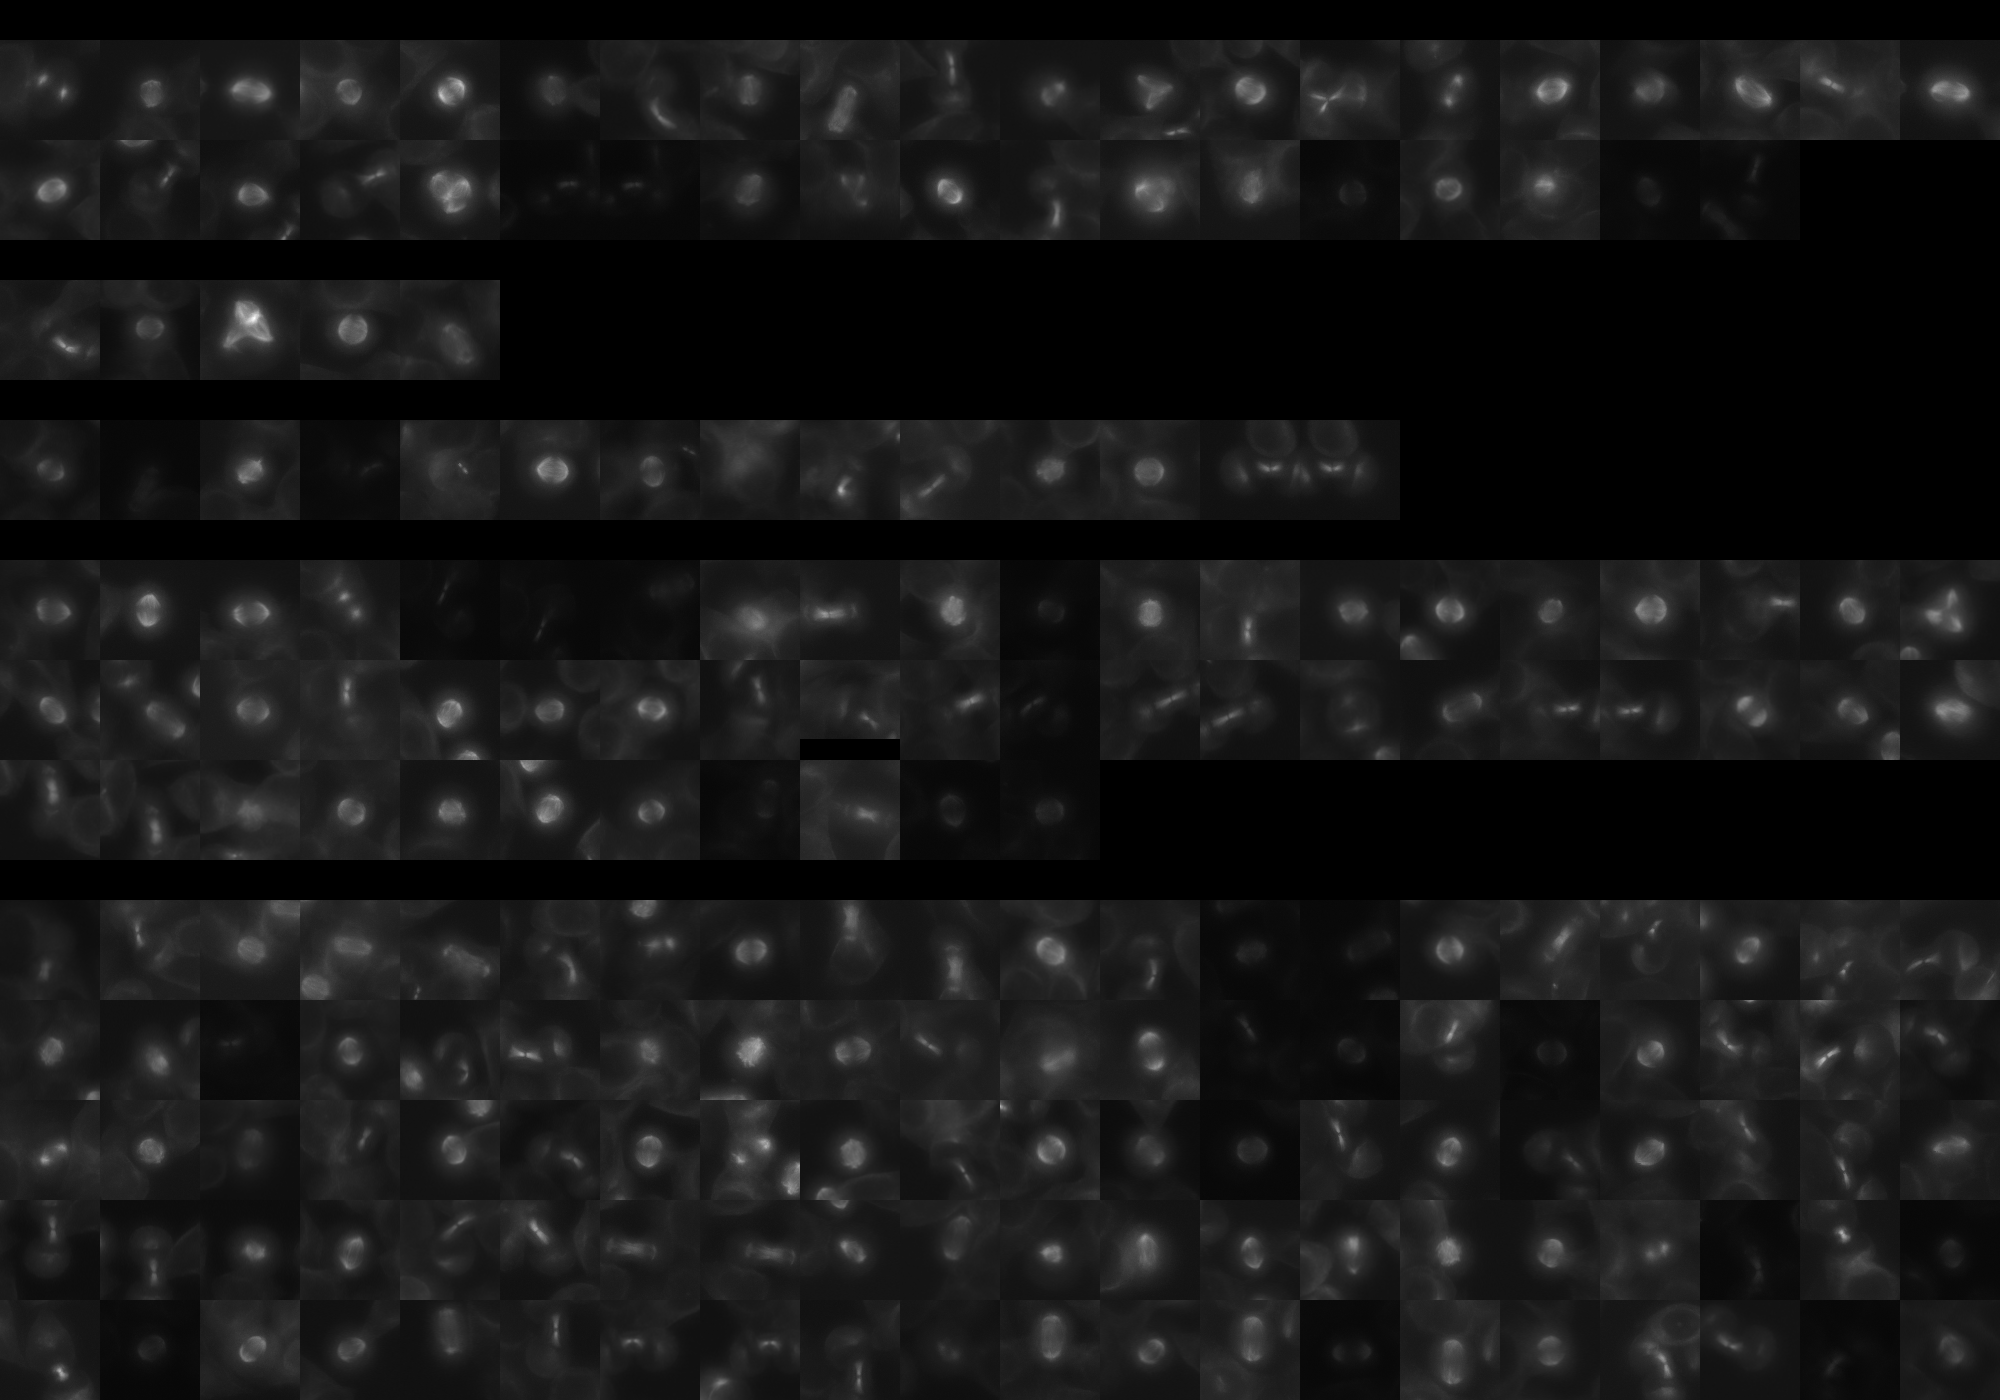
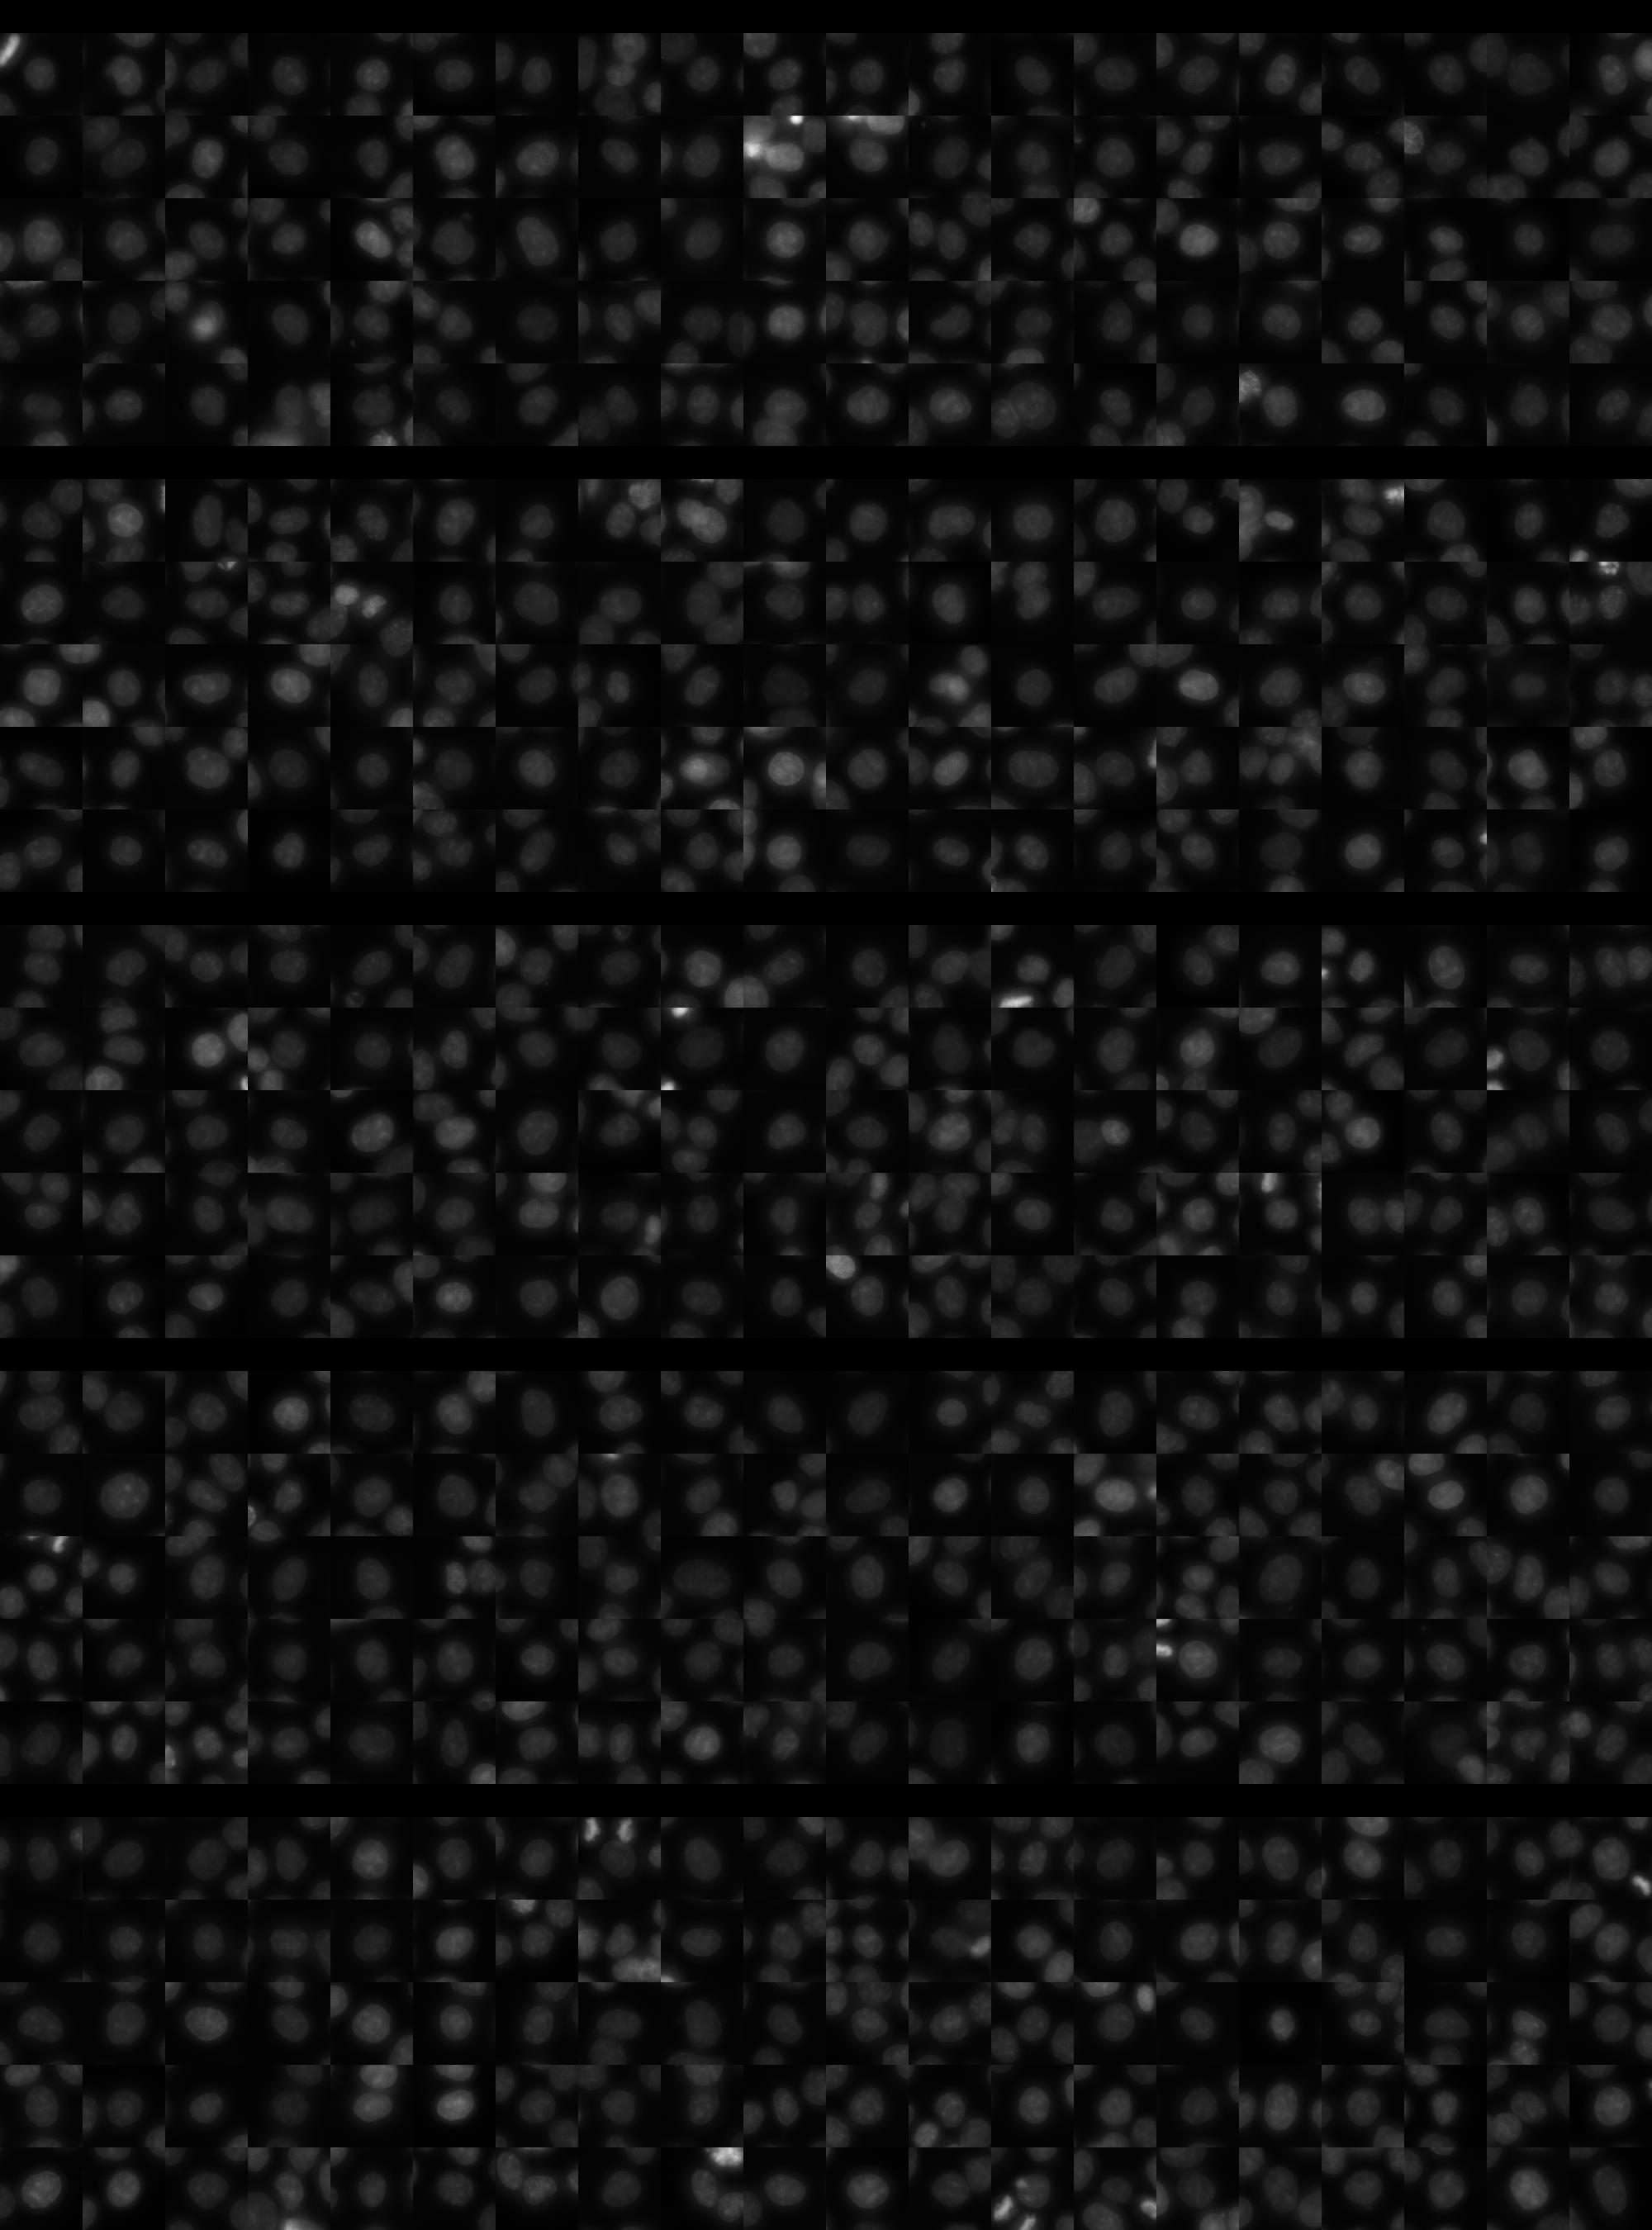
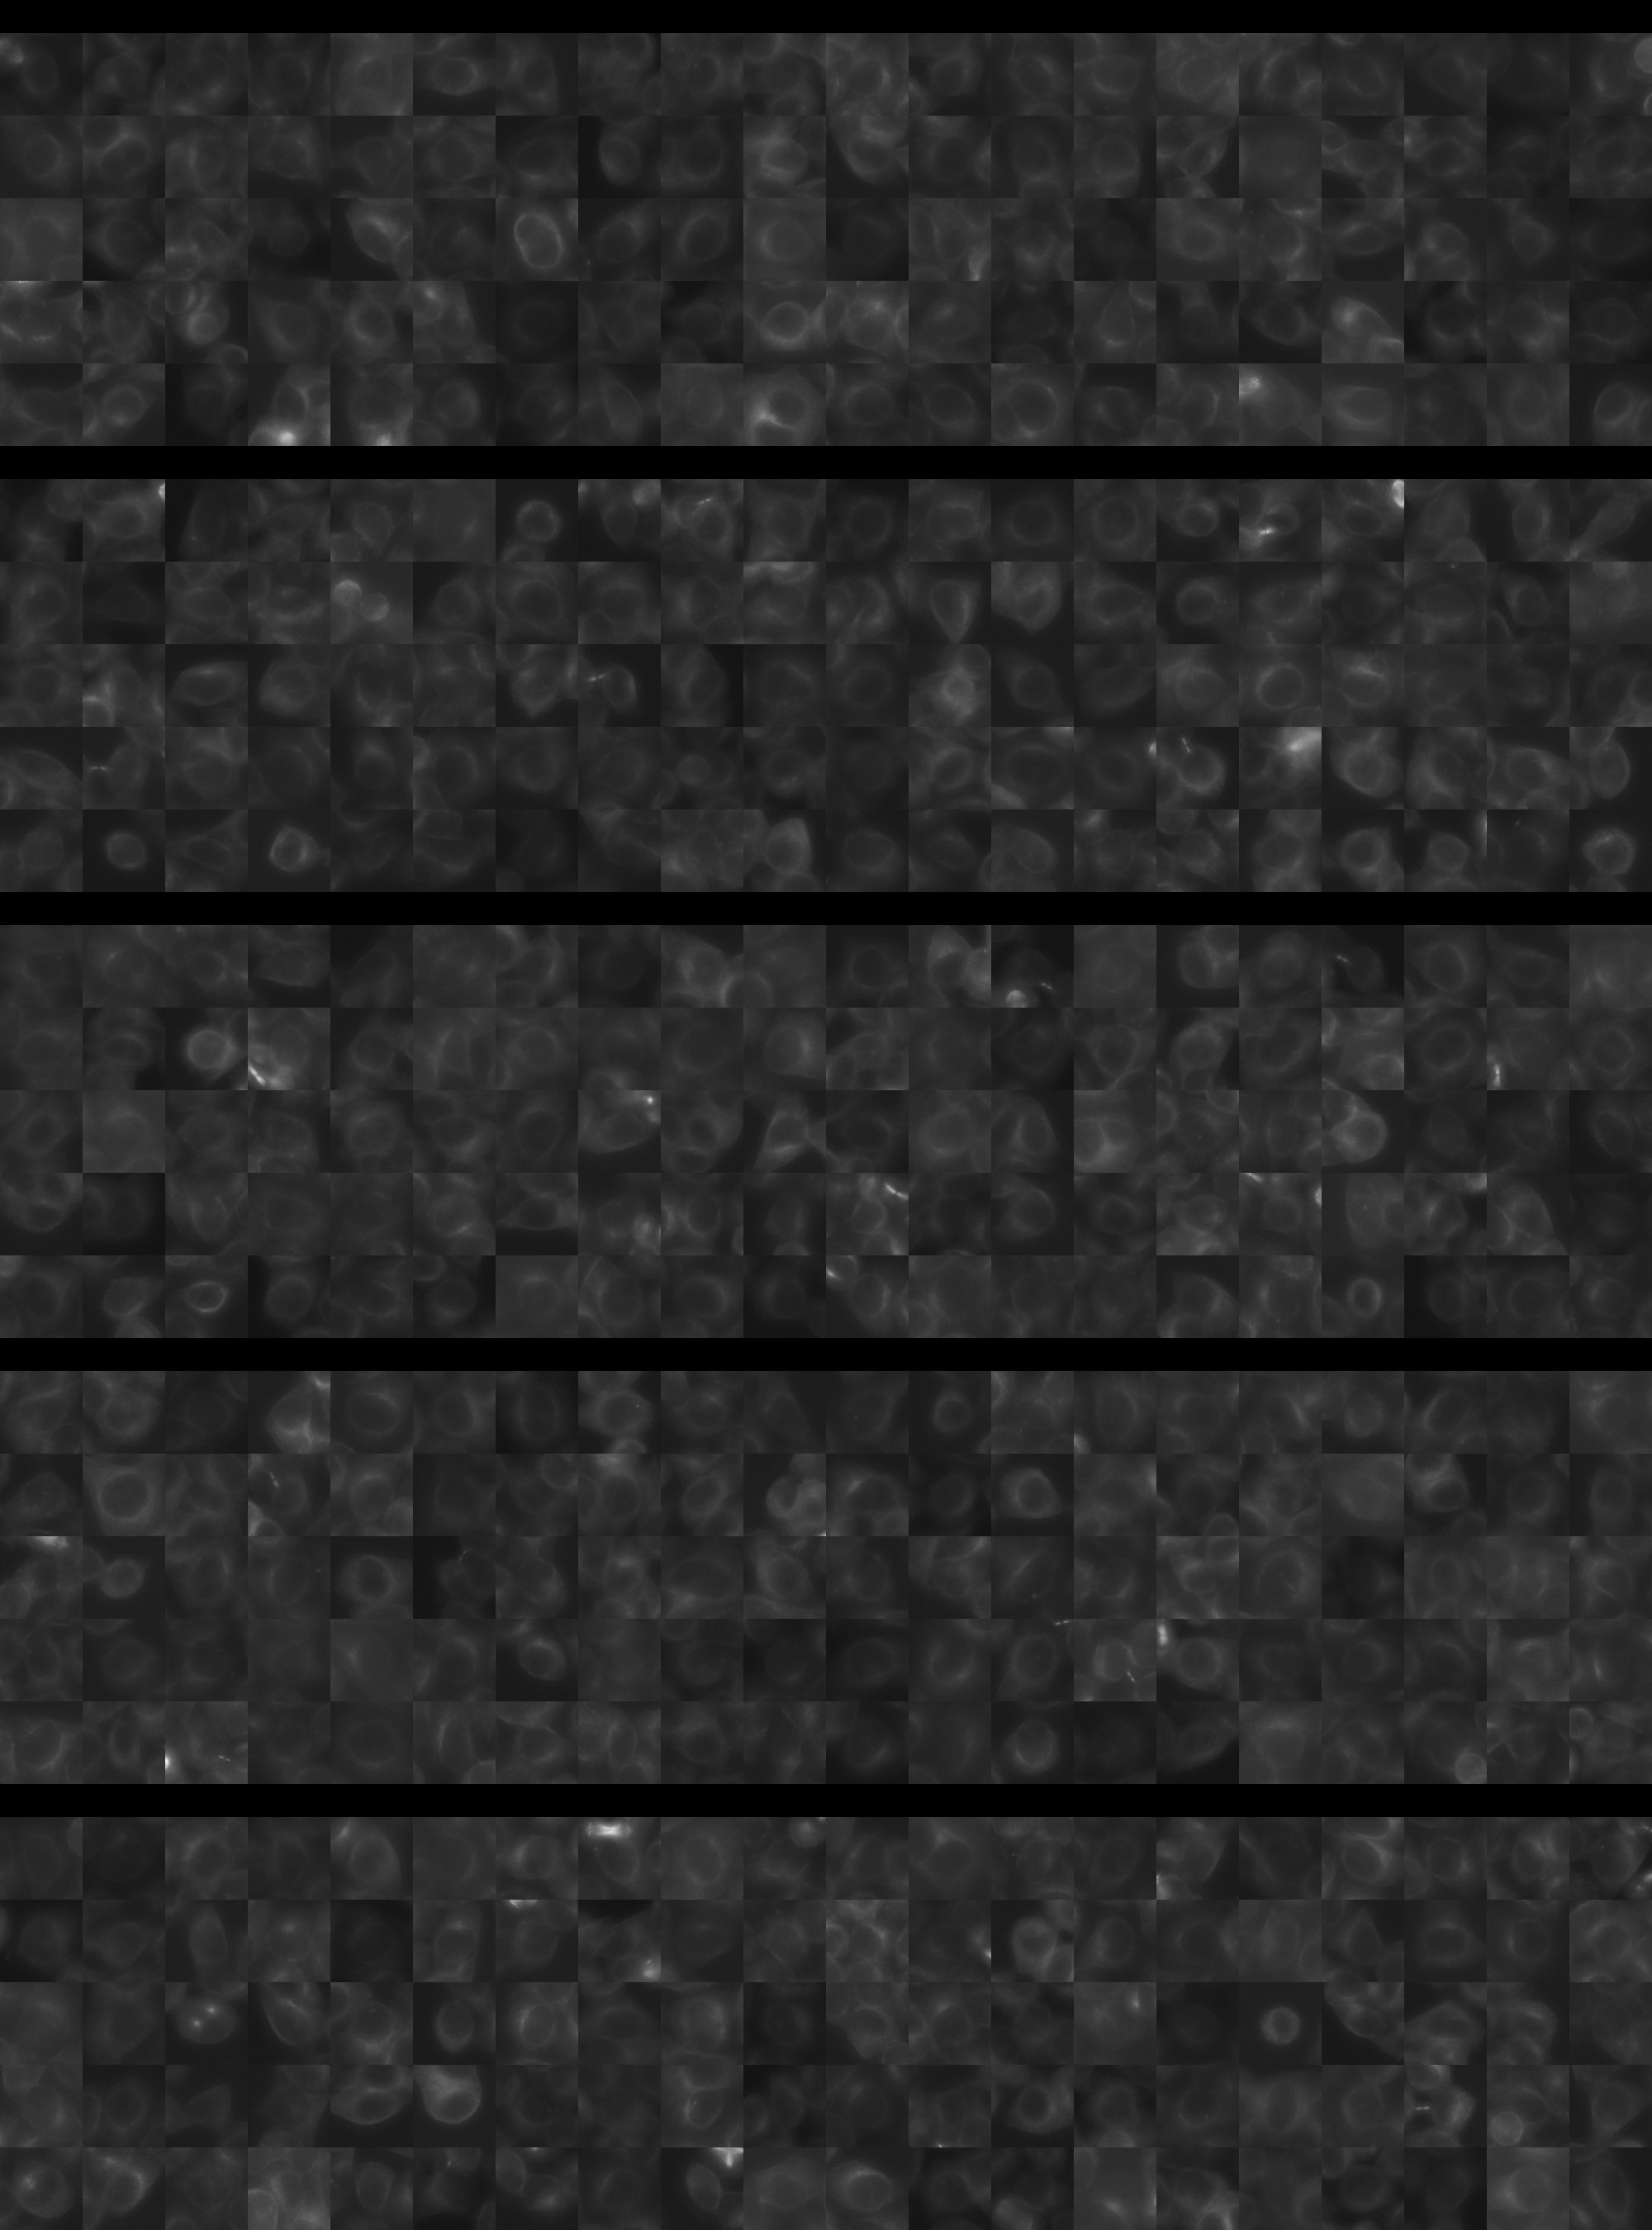
Each montage below shows randomly selected individual cell images for the same target gene separated by sgRNA, along with an example montage of cells expressing a non-targeting negative control sgRNA at the bottom. sgRNA labels in the montages correspond to the numbered sgRNA sequences in the gene info table above. The DNA (blue) and tubulin (green) channels are displayed by default, with gH2AX (grayscale) and actin (yellow) available using the check boxes. Channel brightness, contrast, and opacity are adjustable by clicking the arrow next to the channel name. When only one channel is selected, the display defaults to grayscale. Click the “Zoom” checkbox above the channel controls to enable image zooming (via scrolling) and panning (via click-and-drag).

The cell boxes displayed for this gene are square, 30.36 μm per side for the interphase montage and 30.36 μm per side for the mitotic montage.
Features

Interphase Score Rank FDR q-value
Nucleus DNA Integrated 0.014 2426 of 5322 0.911
Nucleus DNA Mean -4.739e-02 3516 of 5322 0.359
Nucleus gH2AX Mean 0.054 3377 of 5322 0.220
Nucleus DNA - gH2AX Correlation -1.911e-02 1382 of 5322 0.569
Nucleus Shape Area 0.084 920 of 5322 0.155
Nucleus Shape Eccentricity 0.109 152 of 5322 0.006
Nucleus Shape Form Factor -1.047e-01 4471 of 5322 0.020
Nucleus Shape Solidity -6.580e-02 3356 of 5322 0.096
Cell DNA Mass Displacement 0.036 1879 of 5322 0.633
Cell Tubulin Mean 0.003 2668 of 5322 0.942
Cell Tubulin Mass Displacement 0.024 1601 of 5322 0.757
Cell Actin Mean 0.021 2310 of 5322 0.743
Cell Tubulin - Actin Correlation -1.162e-02 4169 of 5322 0.866
Cell DNA - Tubulin Correlation 0.006 3609 of 5322 0.935
Cell Shape Area 0.095 654 of 5322 0.107
Cell Shape Eccentricity 0.016 2393 of 5322 0.891
Mitotic Score Rank FDR q-value
Nucleus DNA Integrated 0.078 2802 of 5322 0.979
Nucleus DNA Mean 0.096 1513 of 5322 1.000
Nucleus DNA Mass Displacement -1.760e-01 5125 of 5322 0.999
Nucleus DNA Mean Frac 3 0.123 1286 of 5322 1.000
Nucleus gH2AX Mean 0.123 1366 of 5322 1.000
Nucleus gH2AX Mean Frac 0 0.141 651 of 5322 1.000
Nucleus Tubulin Mean Frac 0 0.052 2707 of 5322 0.999
Nucleus Tubulin Mean Edge 0.067 2294 of 5322 0.999
Nucleus Tubulin Std Edge 0.054 1819 of 5322 0.999
Nucleus Shape Area 0.082 2909 of 5322 0.990
Nucleus Shape Eccentricity -3.327e-02 2618 of 5322 1.000
Nucleus Shape Form Factor -7.997e-02 2563 of 5322 0.998
Cell Tubulin Mean 0.074 2438 of 5322 0.997
Cell Tubulin Mean Frac 3 -3.987e-02 2161 of 5322 0.999
Cell Actin Mean 0.040 2651 of 5322 0.997
Cell Shape Area 0.340 519 of 5322 0.925
( Reset Zoom )
Brightness
Contrast
Opacity
Brightness
Contrast
Opacity
Brightness
Contrast
Opacity
Brightness
Contrast
Opacity
Brightness
Contrast
Opacity

( Reset Zoom )
Brightness
Contrast
Opacity
Brightness
Contrast
Opacity
Brightness
Contrast
Opacity
Brightness
Contrast
Opacity
Brightness
Contrast
Opacity

MIT Central Accessability