NRBP1

Gene symbol: NRBP1
Gene: 29959
Uniprot Function: May play a role in subcellular trafficking between the endoplasmic reticulum and Golgi apparatus through interactions with the Rho-type GTPases. Binding to the NS3 protein of dengue virus type 2 appears to subvert this activity into the alteration of the intracellular membrane structure associated with flaviviral replication.
Mitotic Index 0.0291
Interphase Cluster: #220 (6 genes)
Mitotic Cluster: #140 (20 genes)
sgRNA 1: AGGTATGCACTGTCAATACC (interphase cells: 1105, mitotic cells: 38)
sgRNA 2: CACTAATGTGACAACAGCAG (interphase cells: 2343, mitotic cells: 66)
sgRNA 3: GCACTTCAAACAATGCTGGG (interphase cells: 1401, mitotic cells: 34)
sgRNA 4: TCCCAGACAGTACTTAGCAG (interphase cells: 3272, mitotic cells: 105)

Interphase Cluster

Mitotic Cluster

Overview

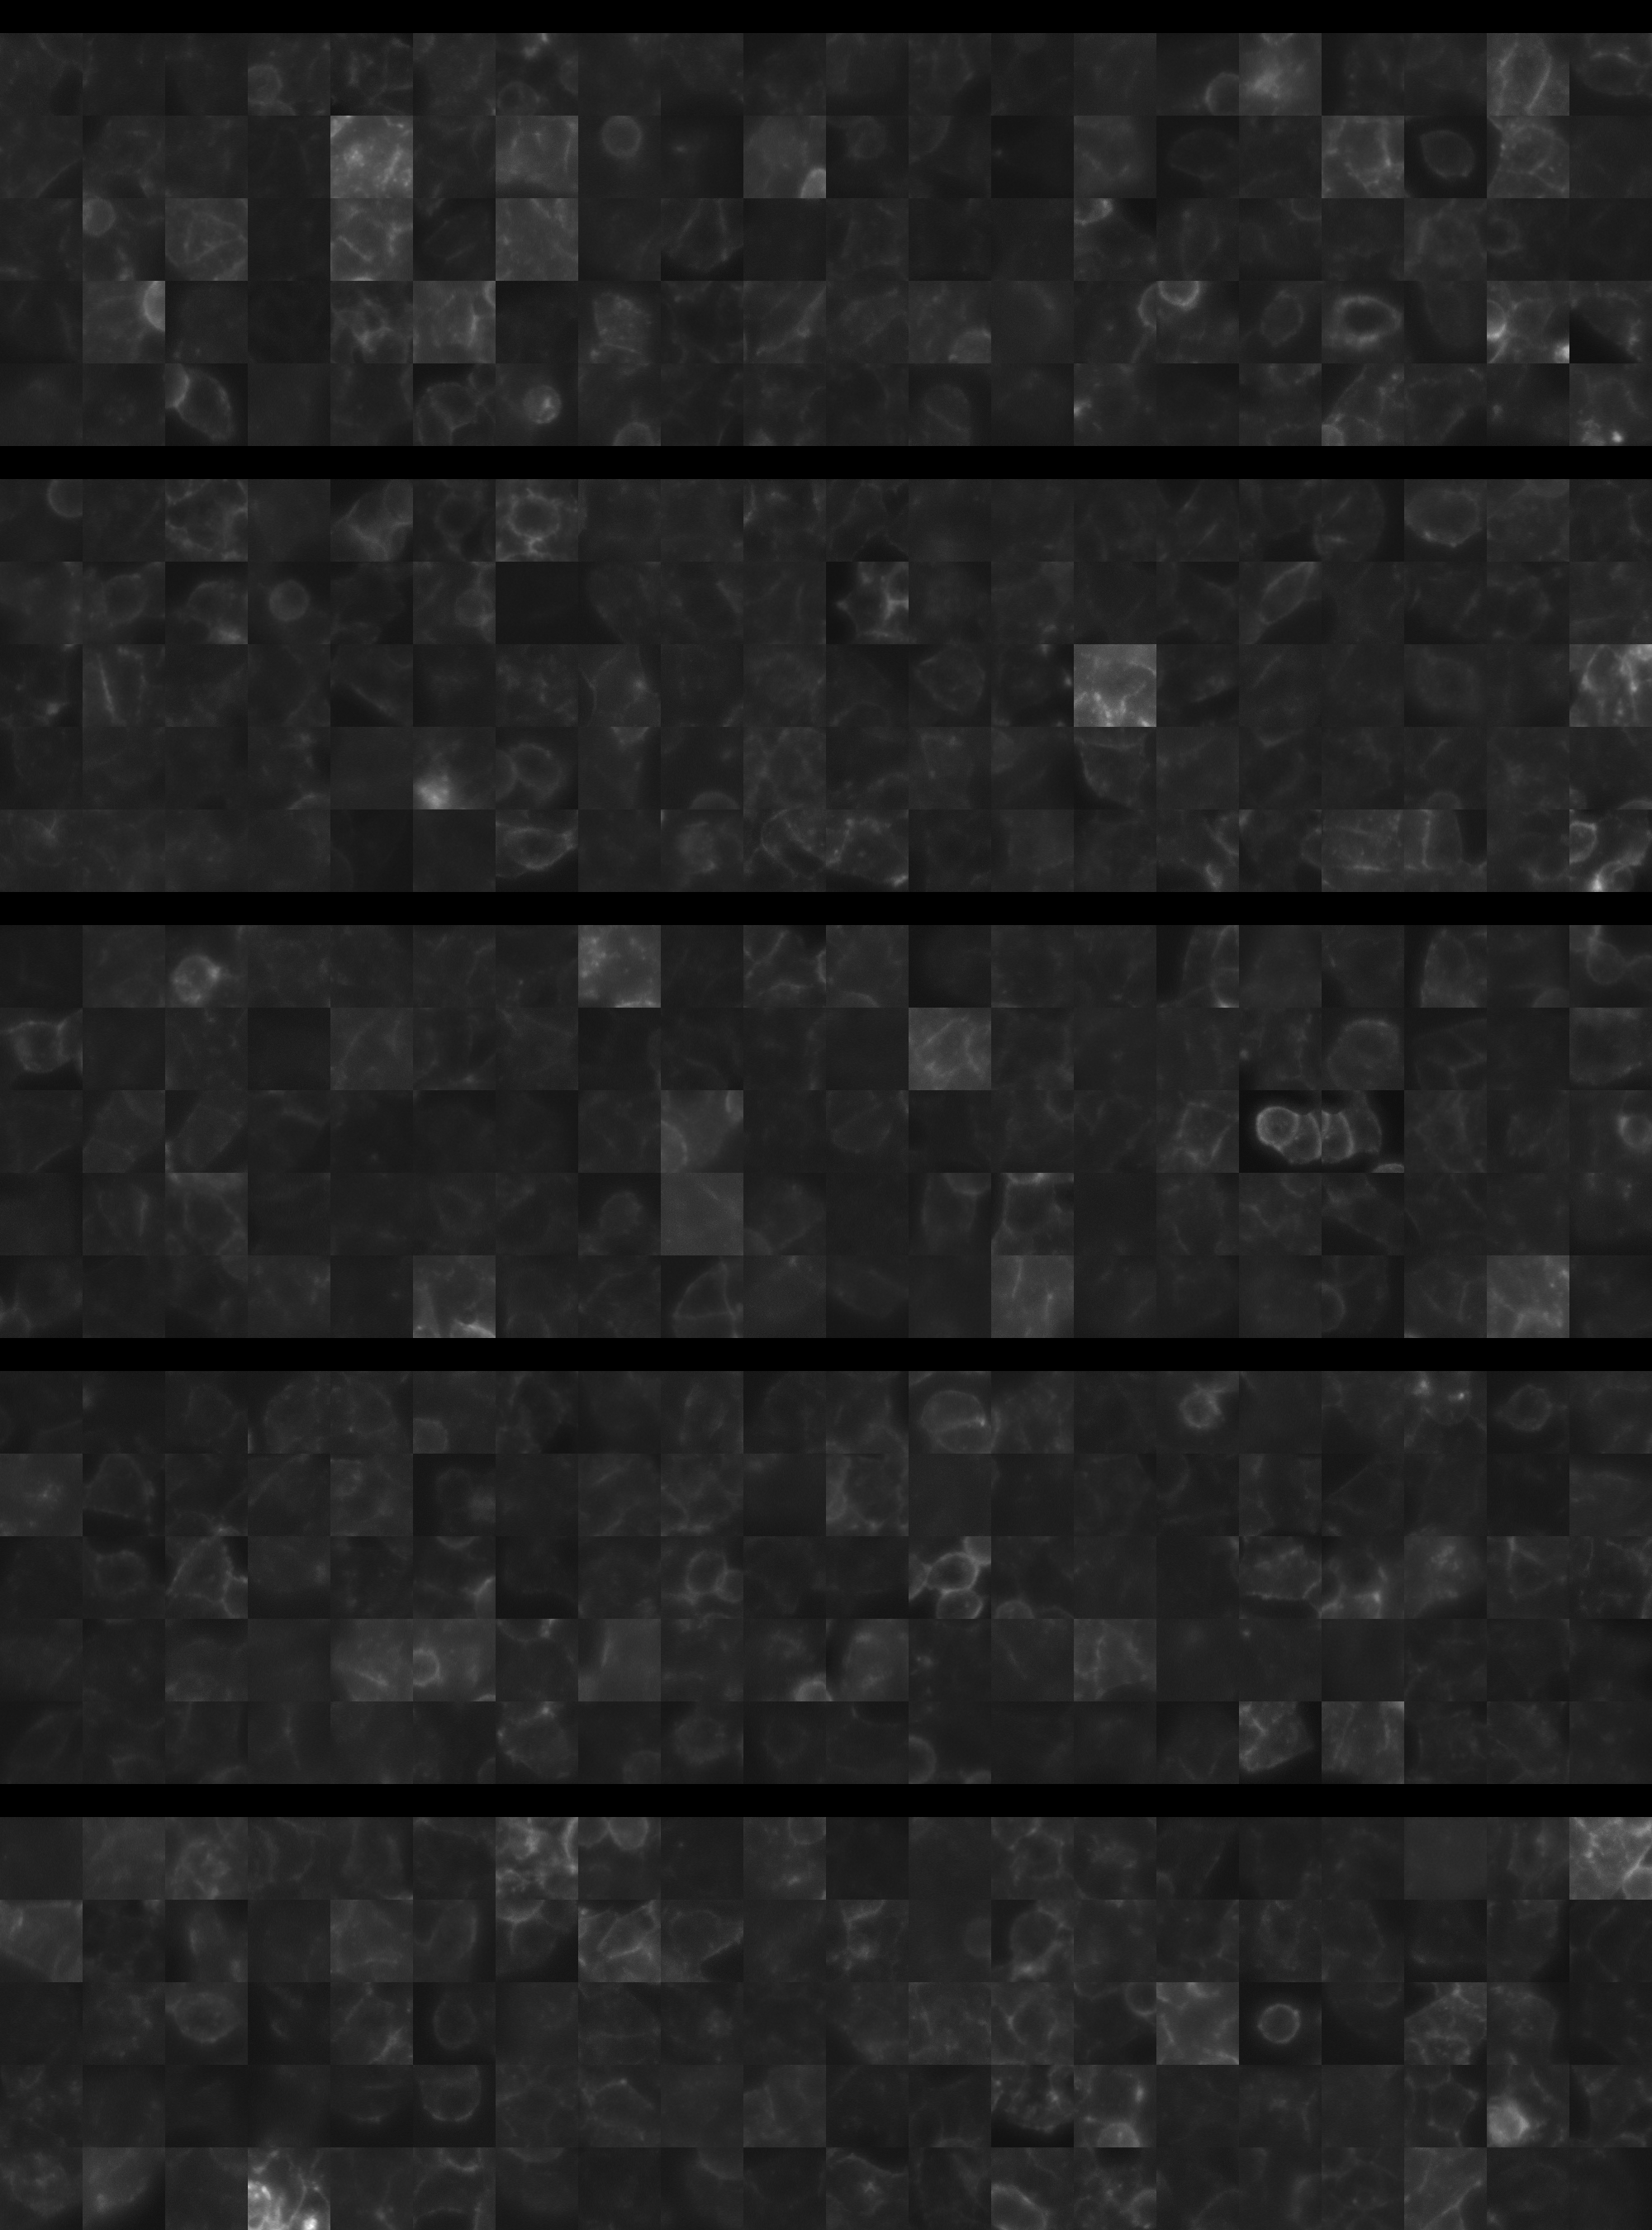
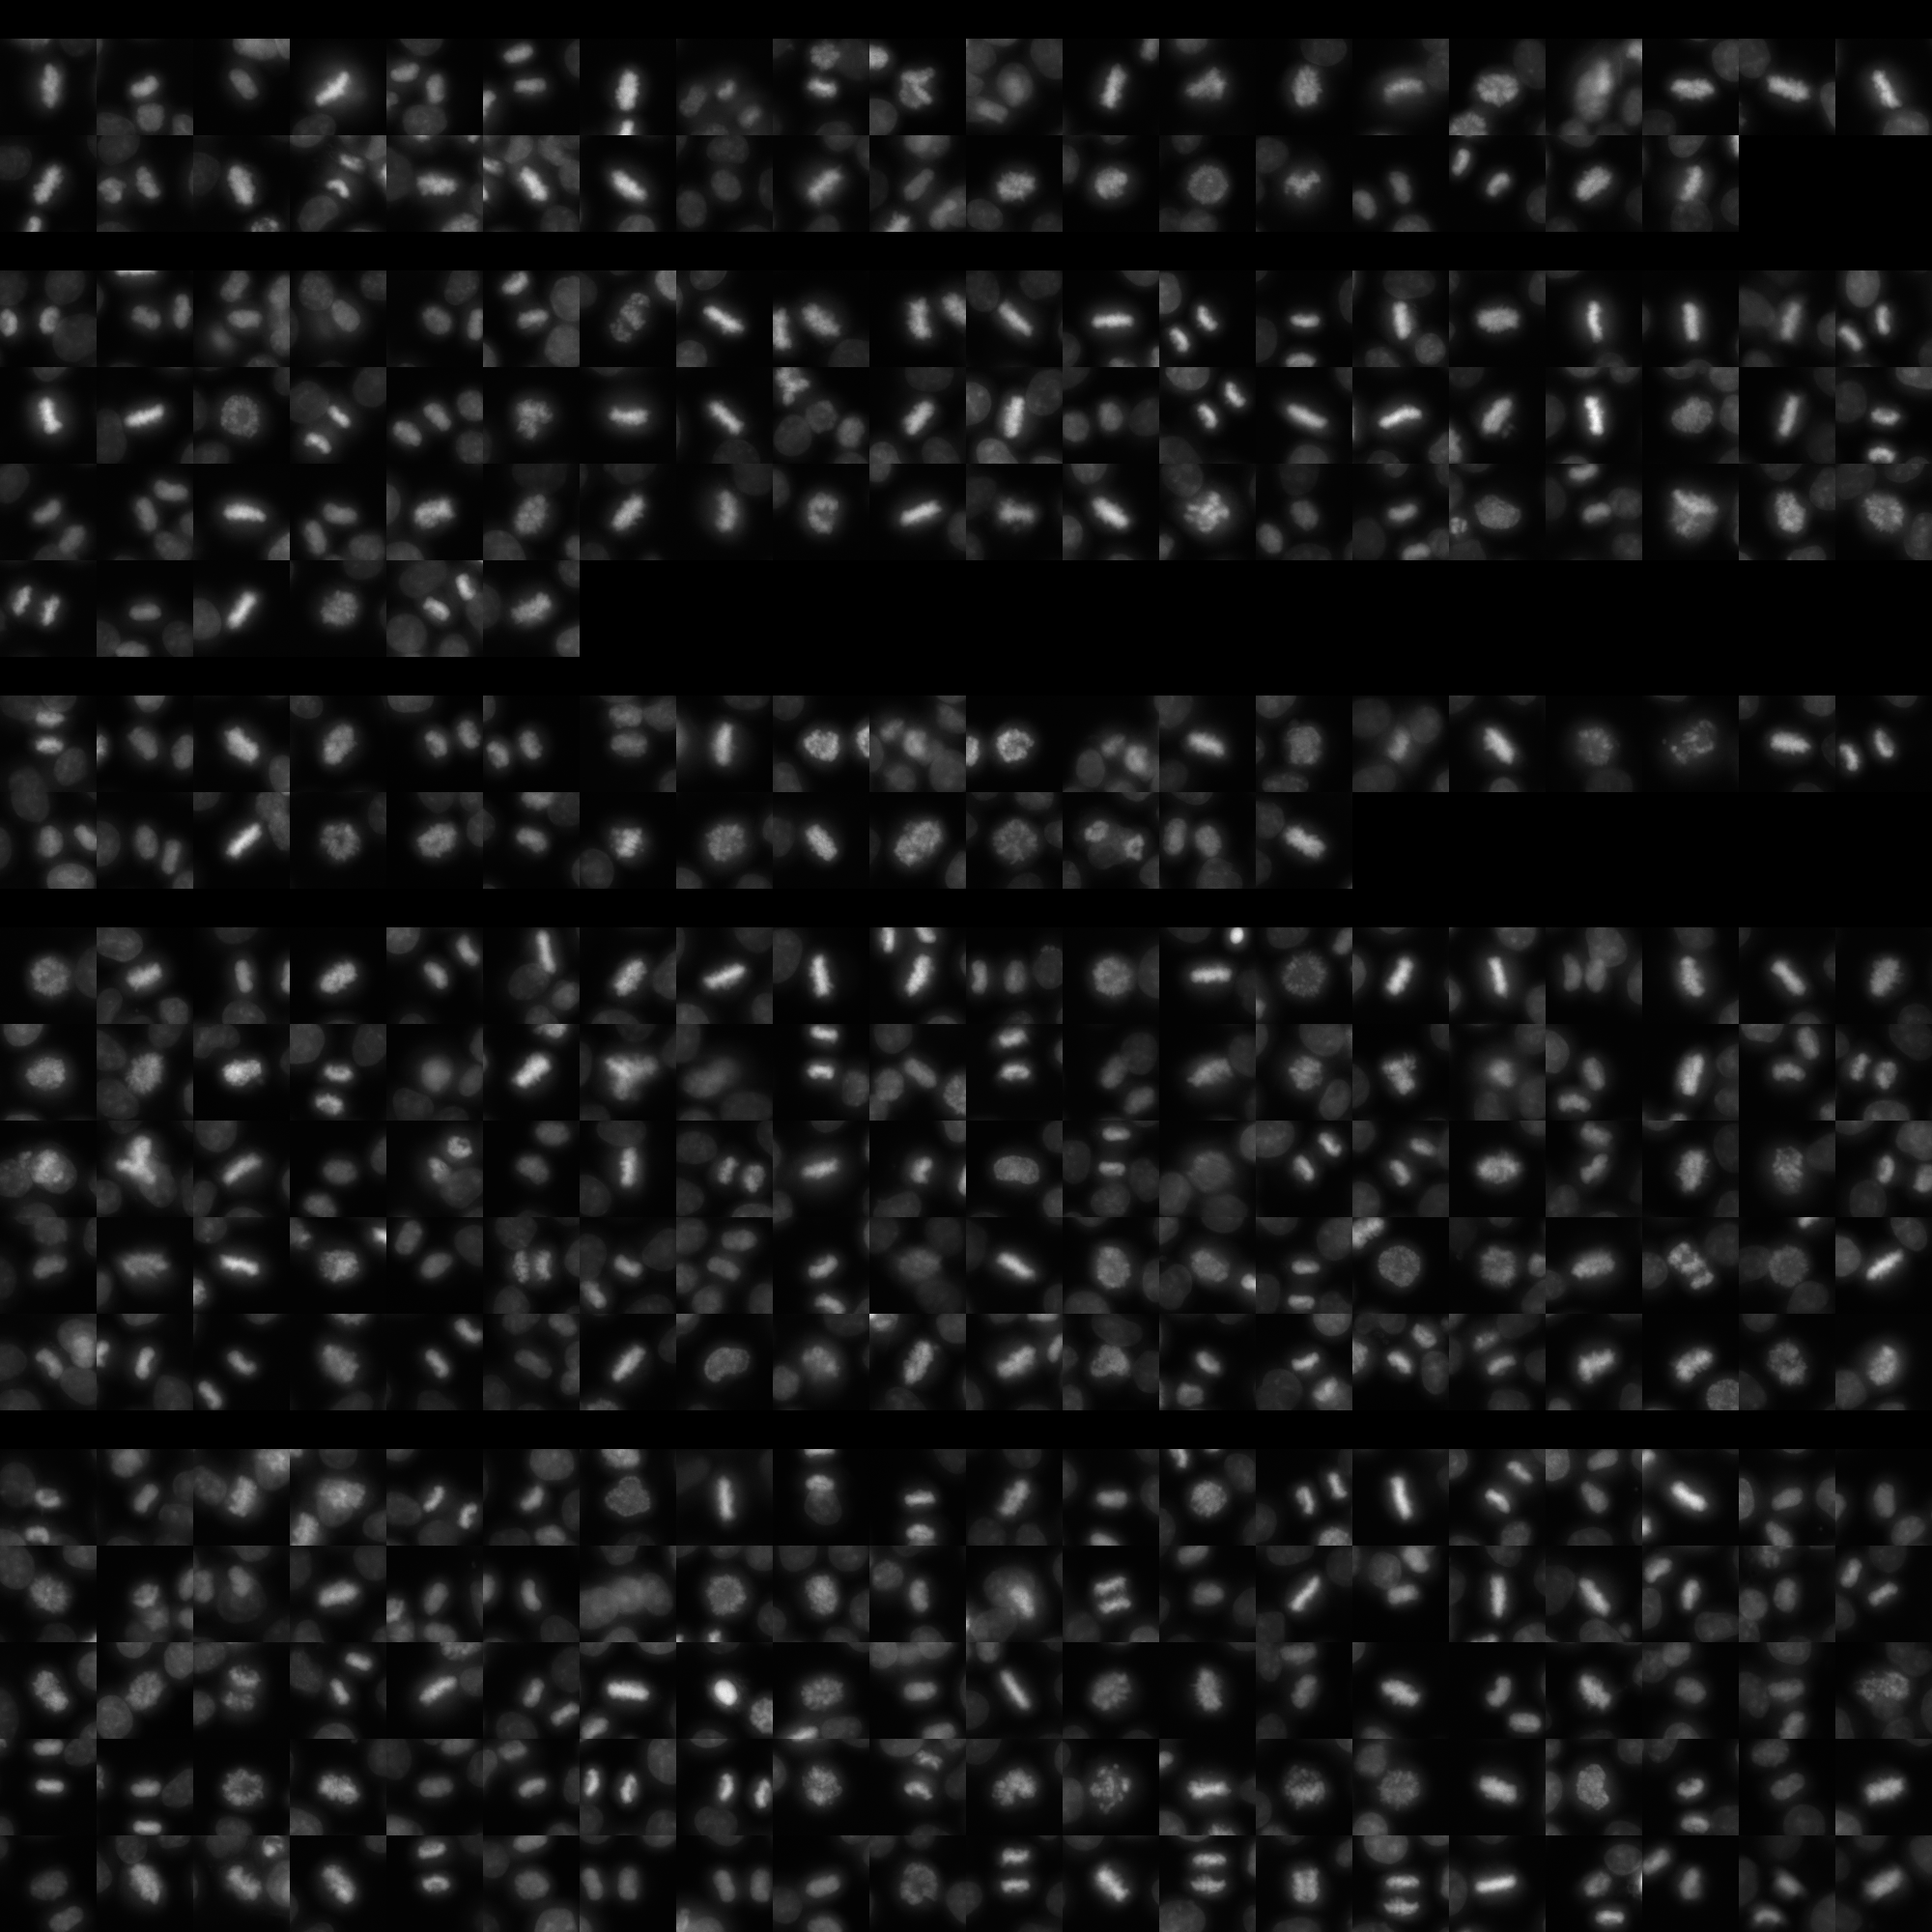
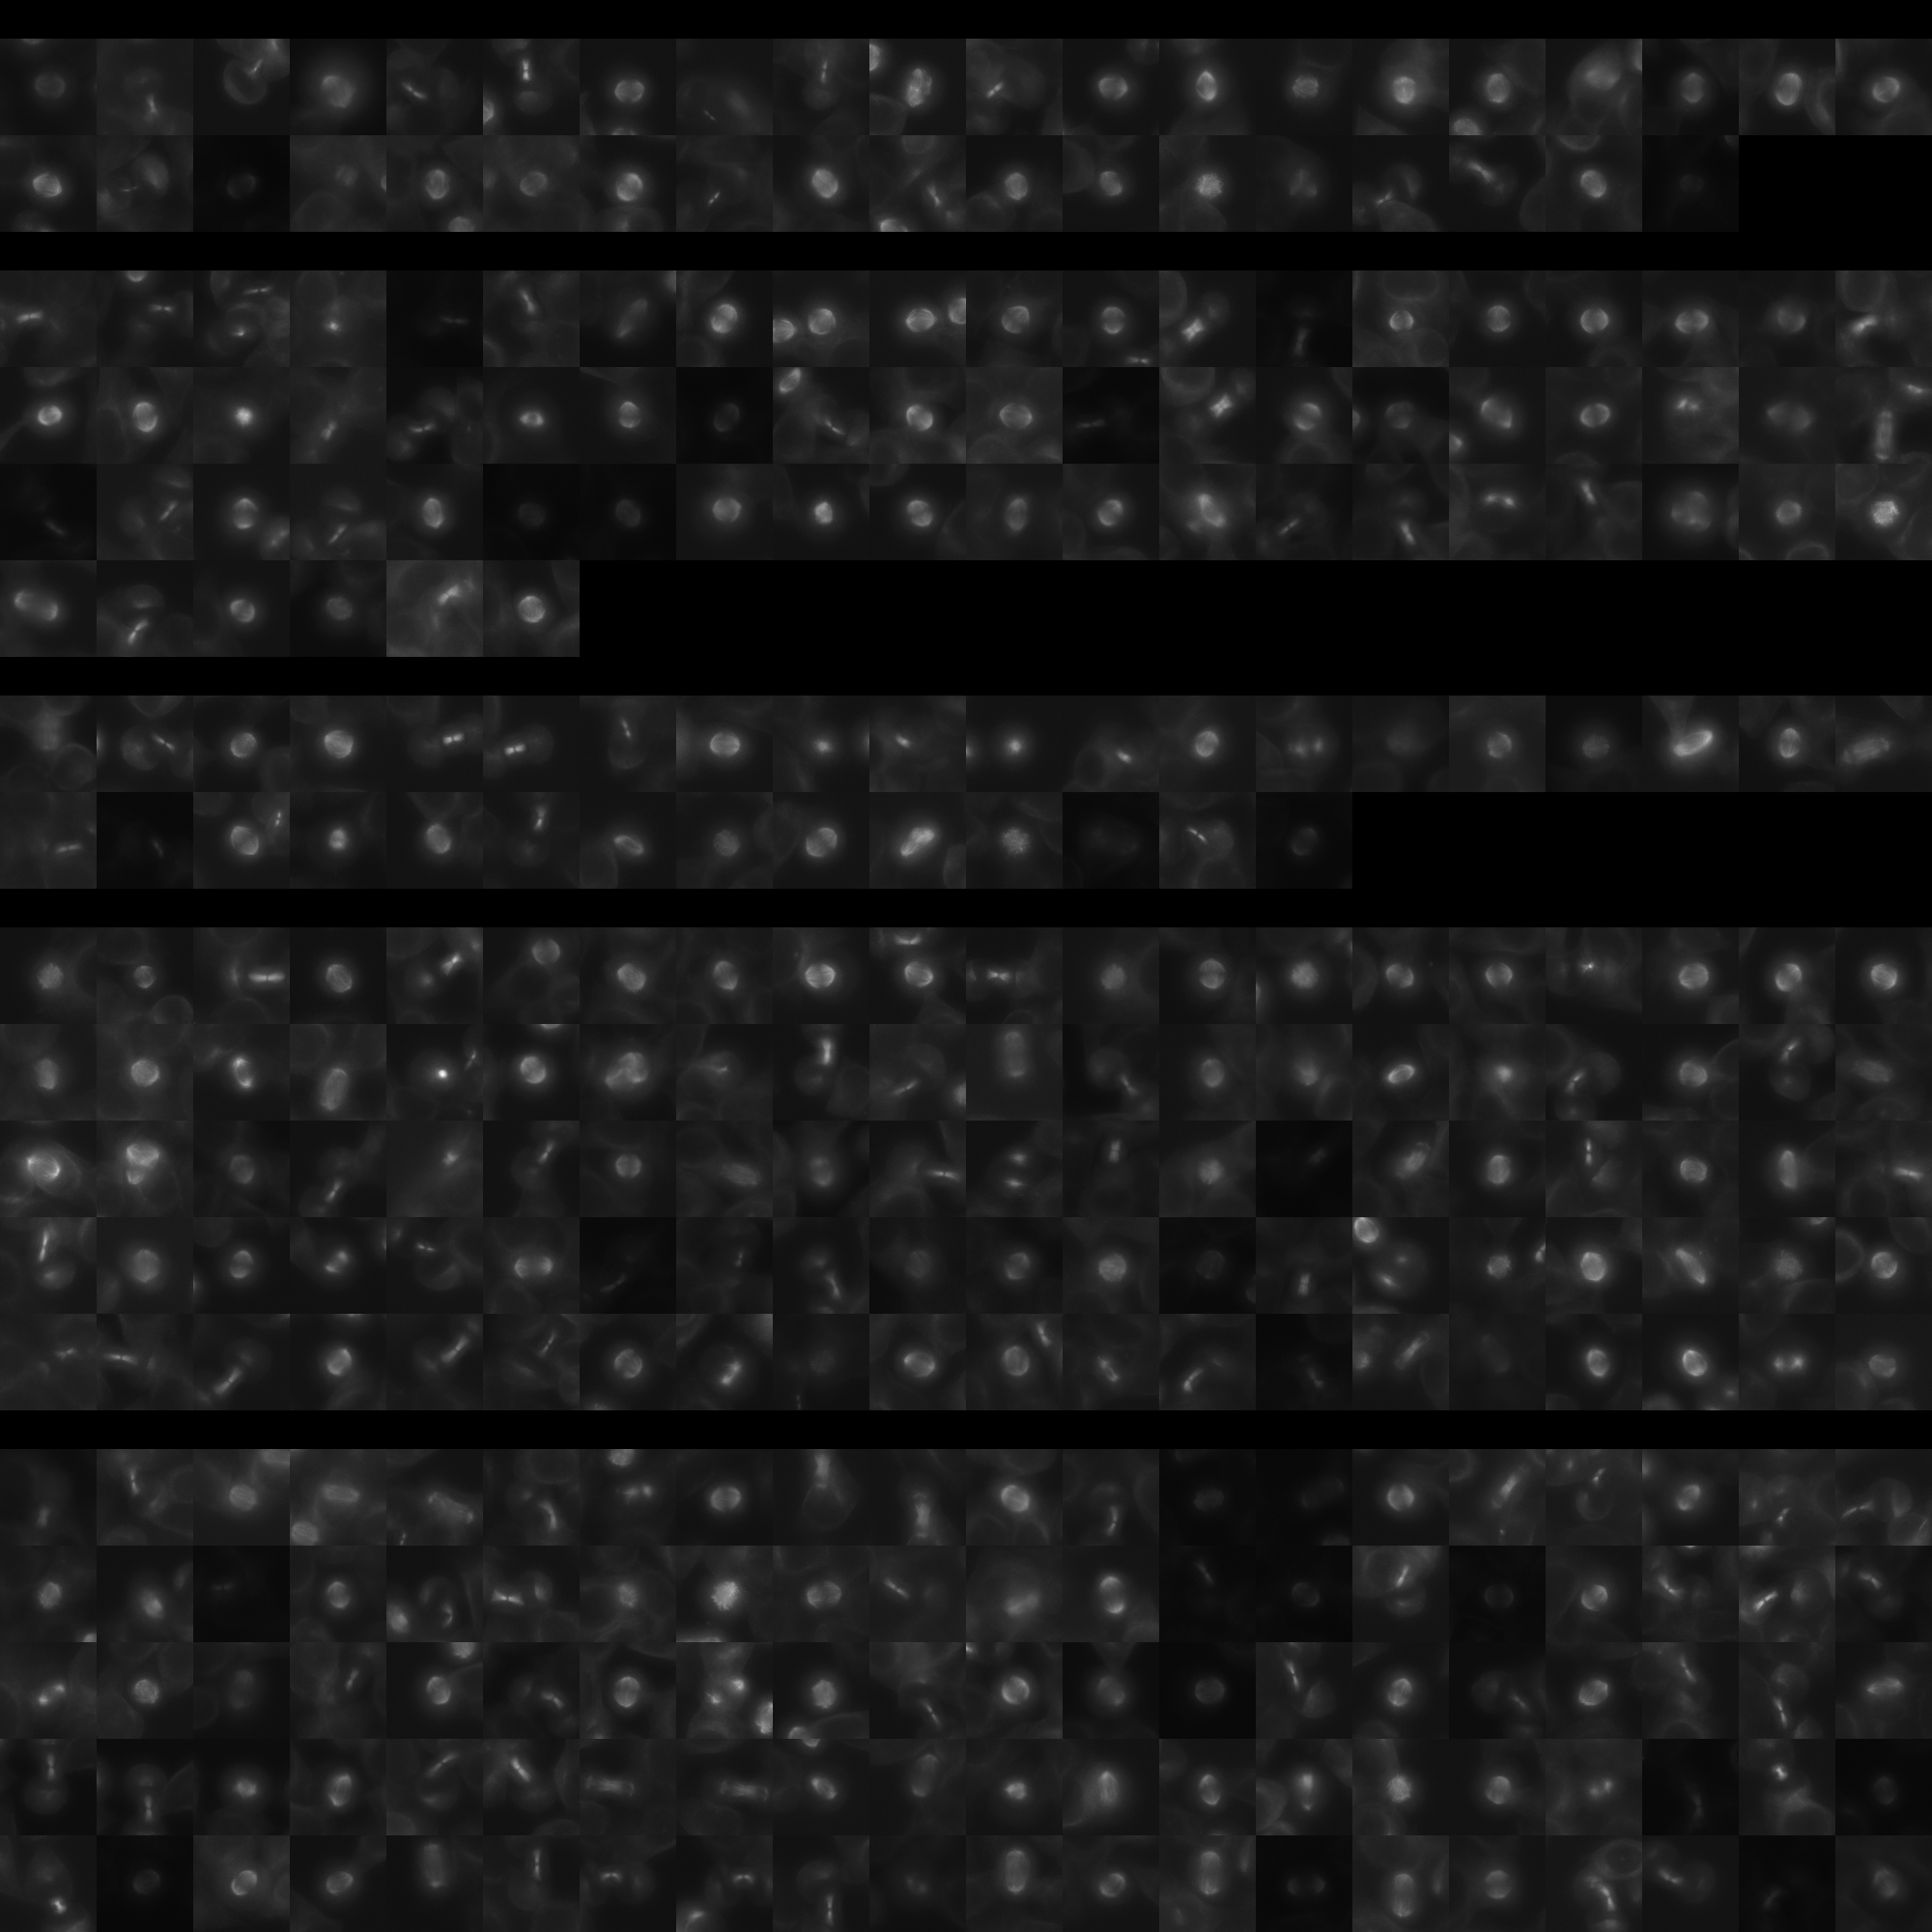
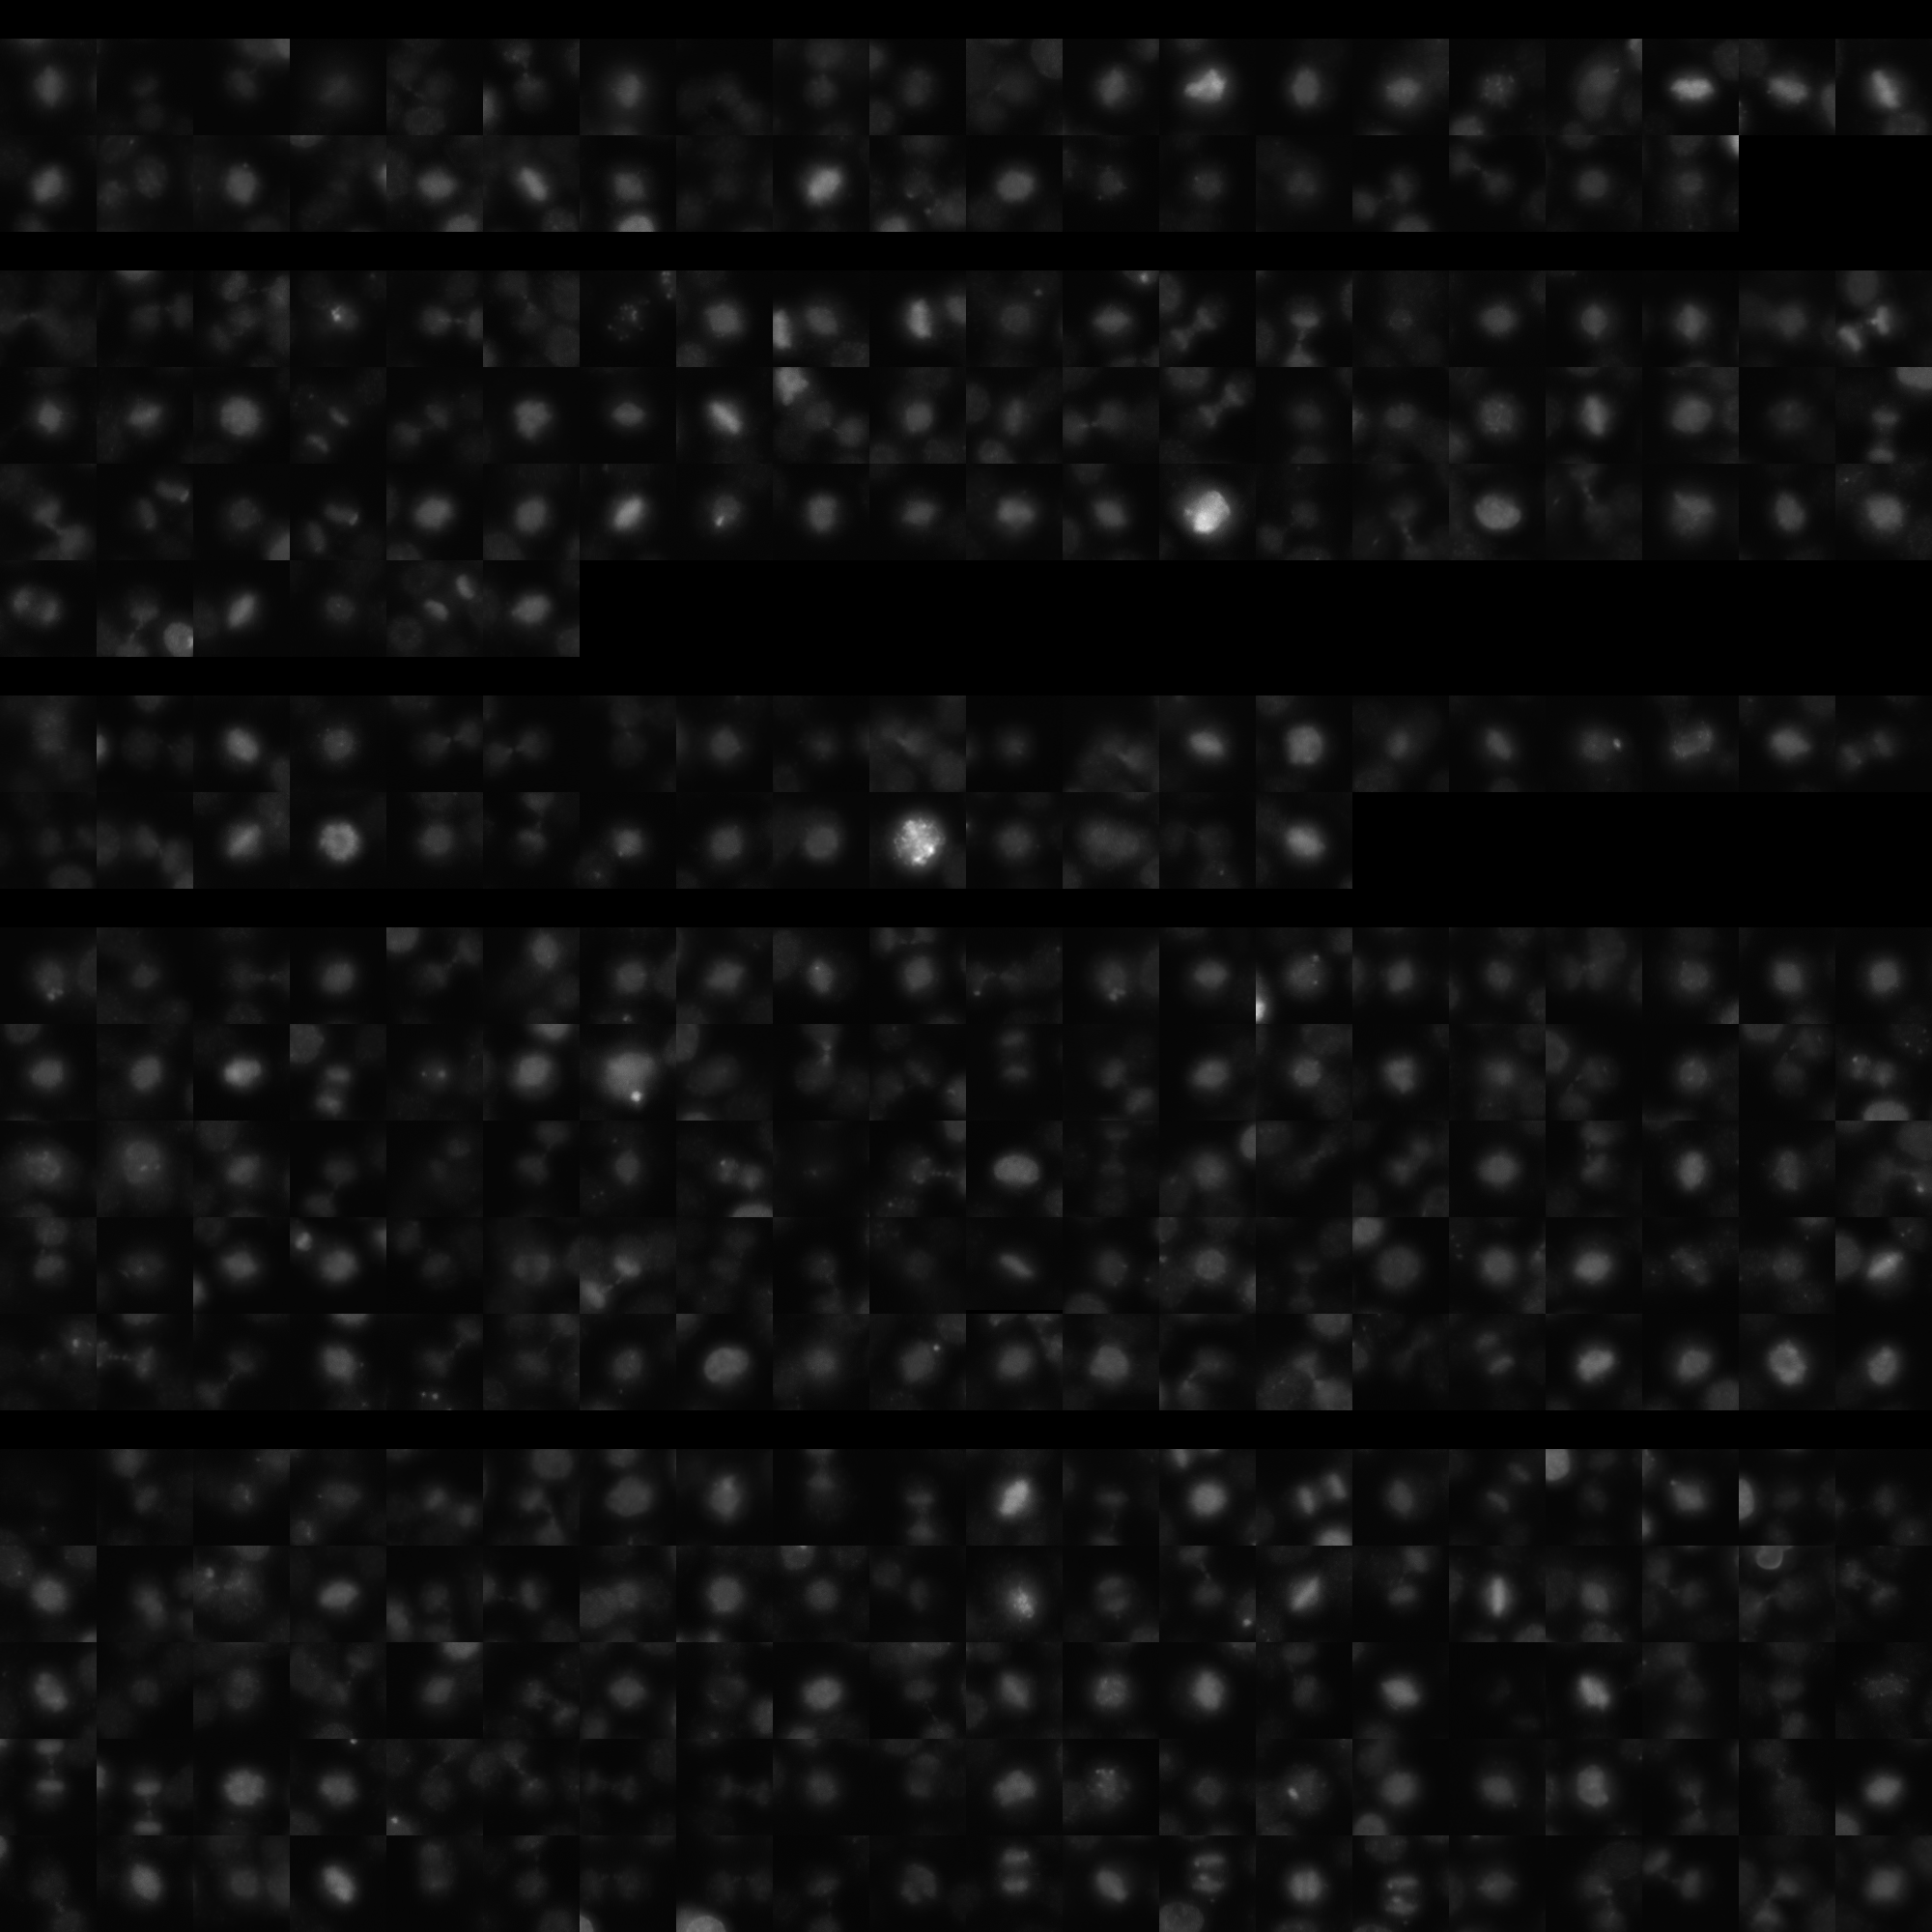
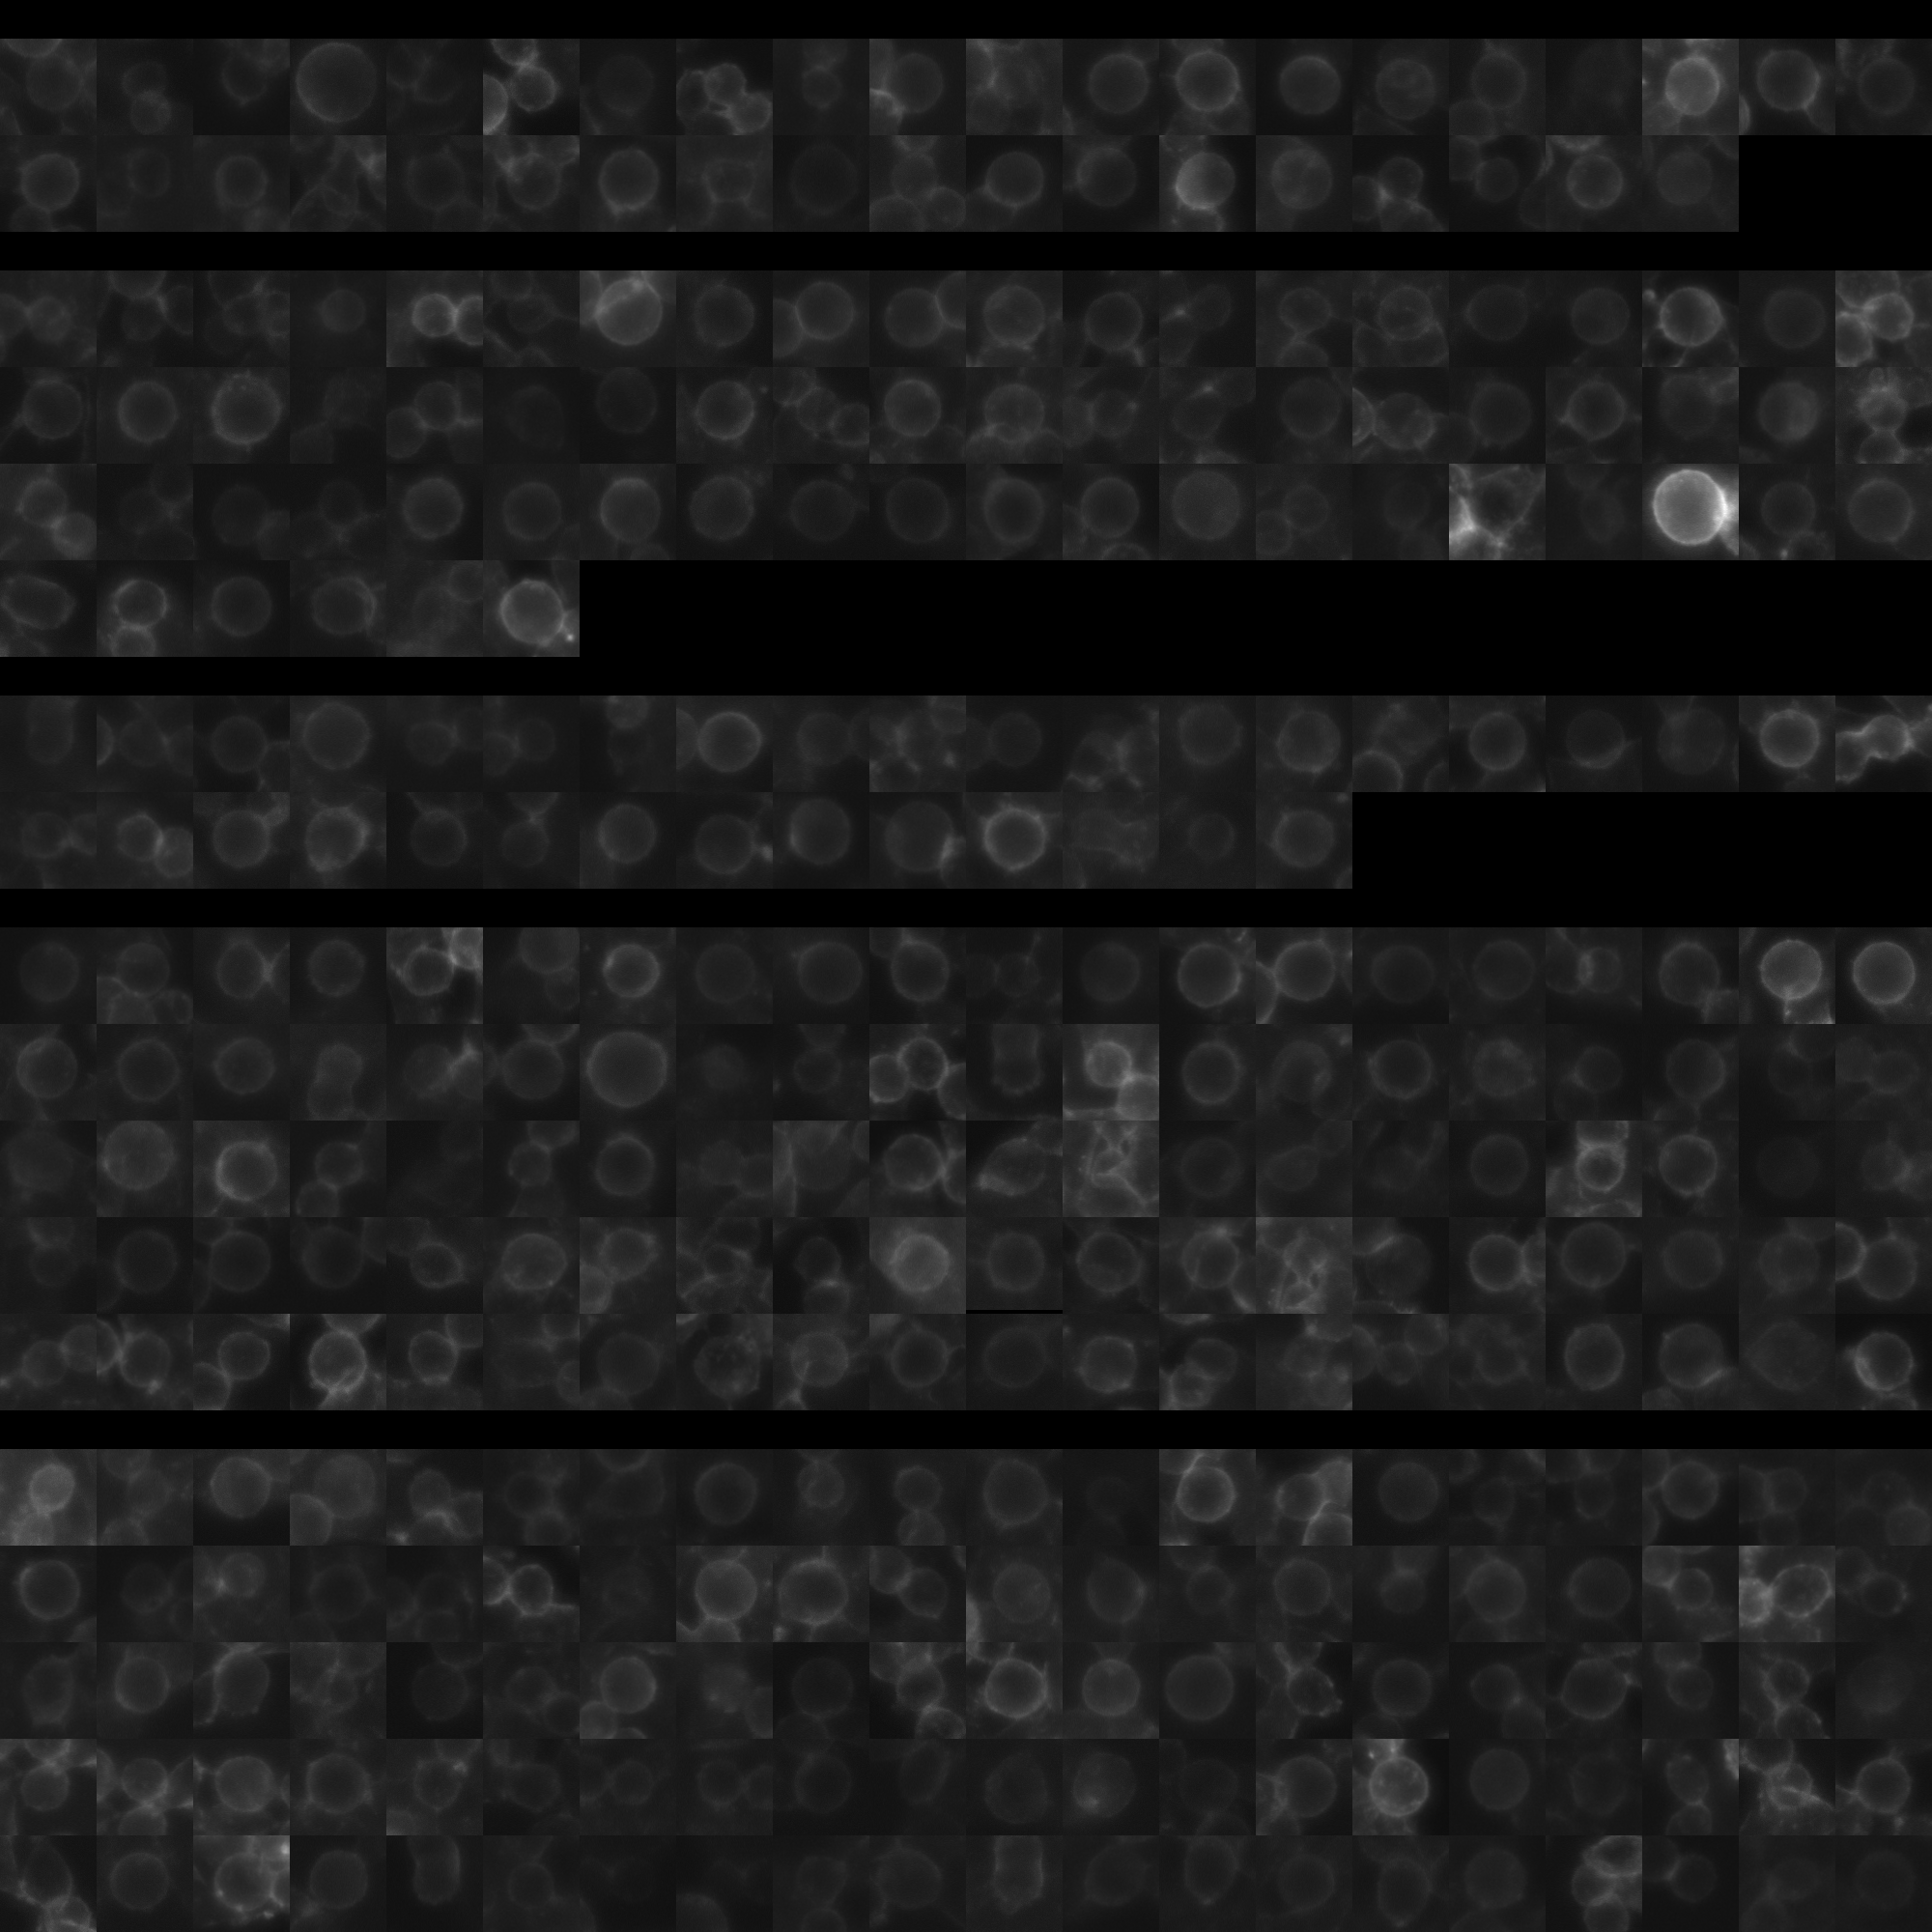
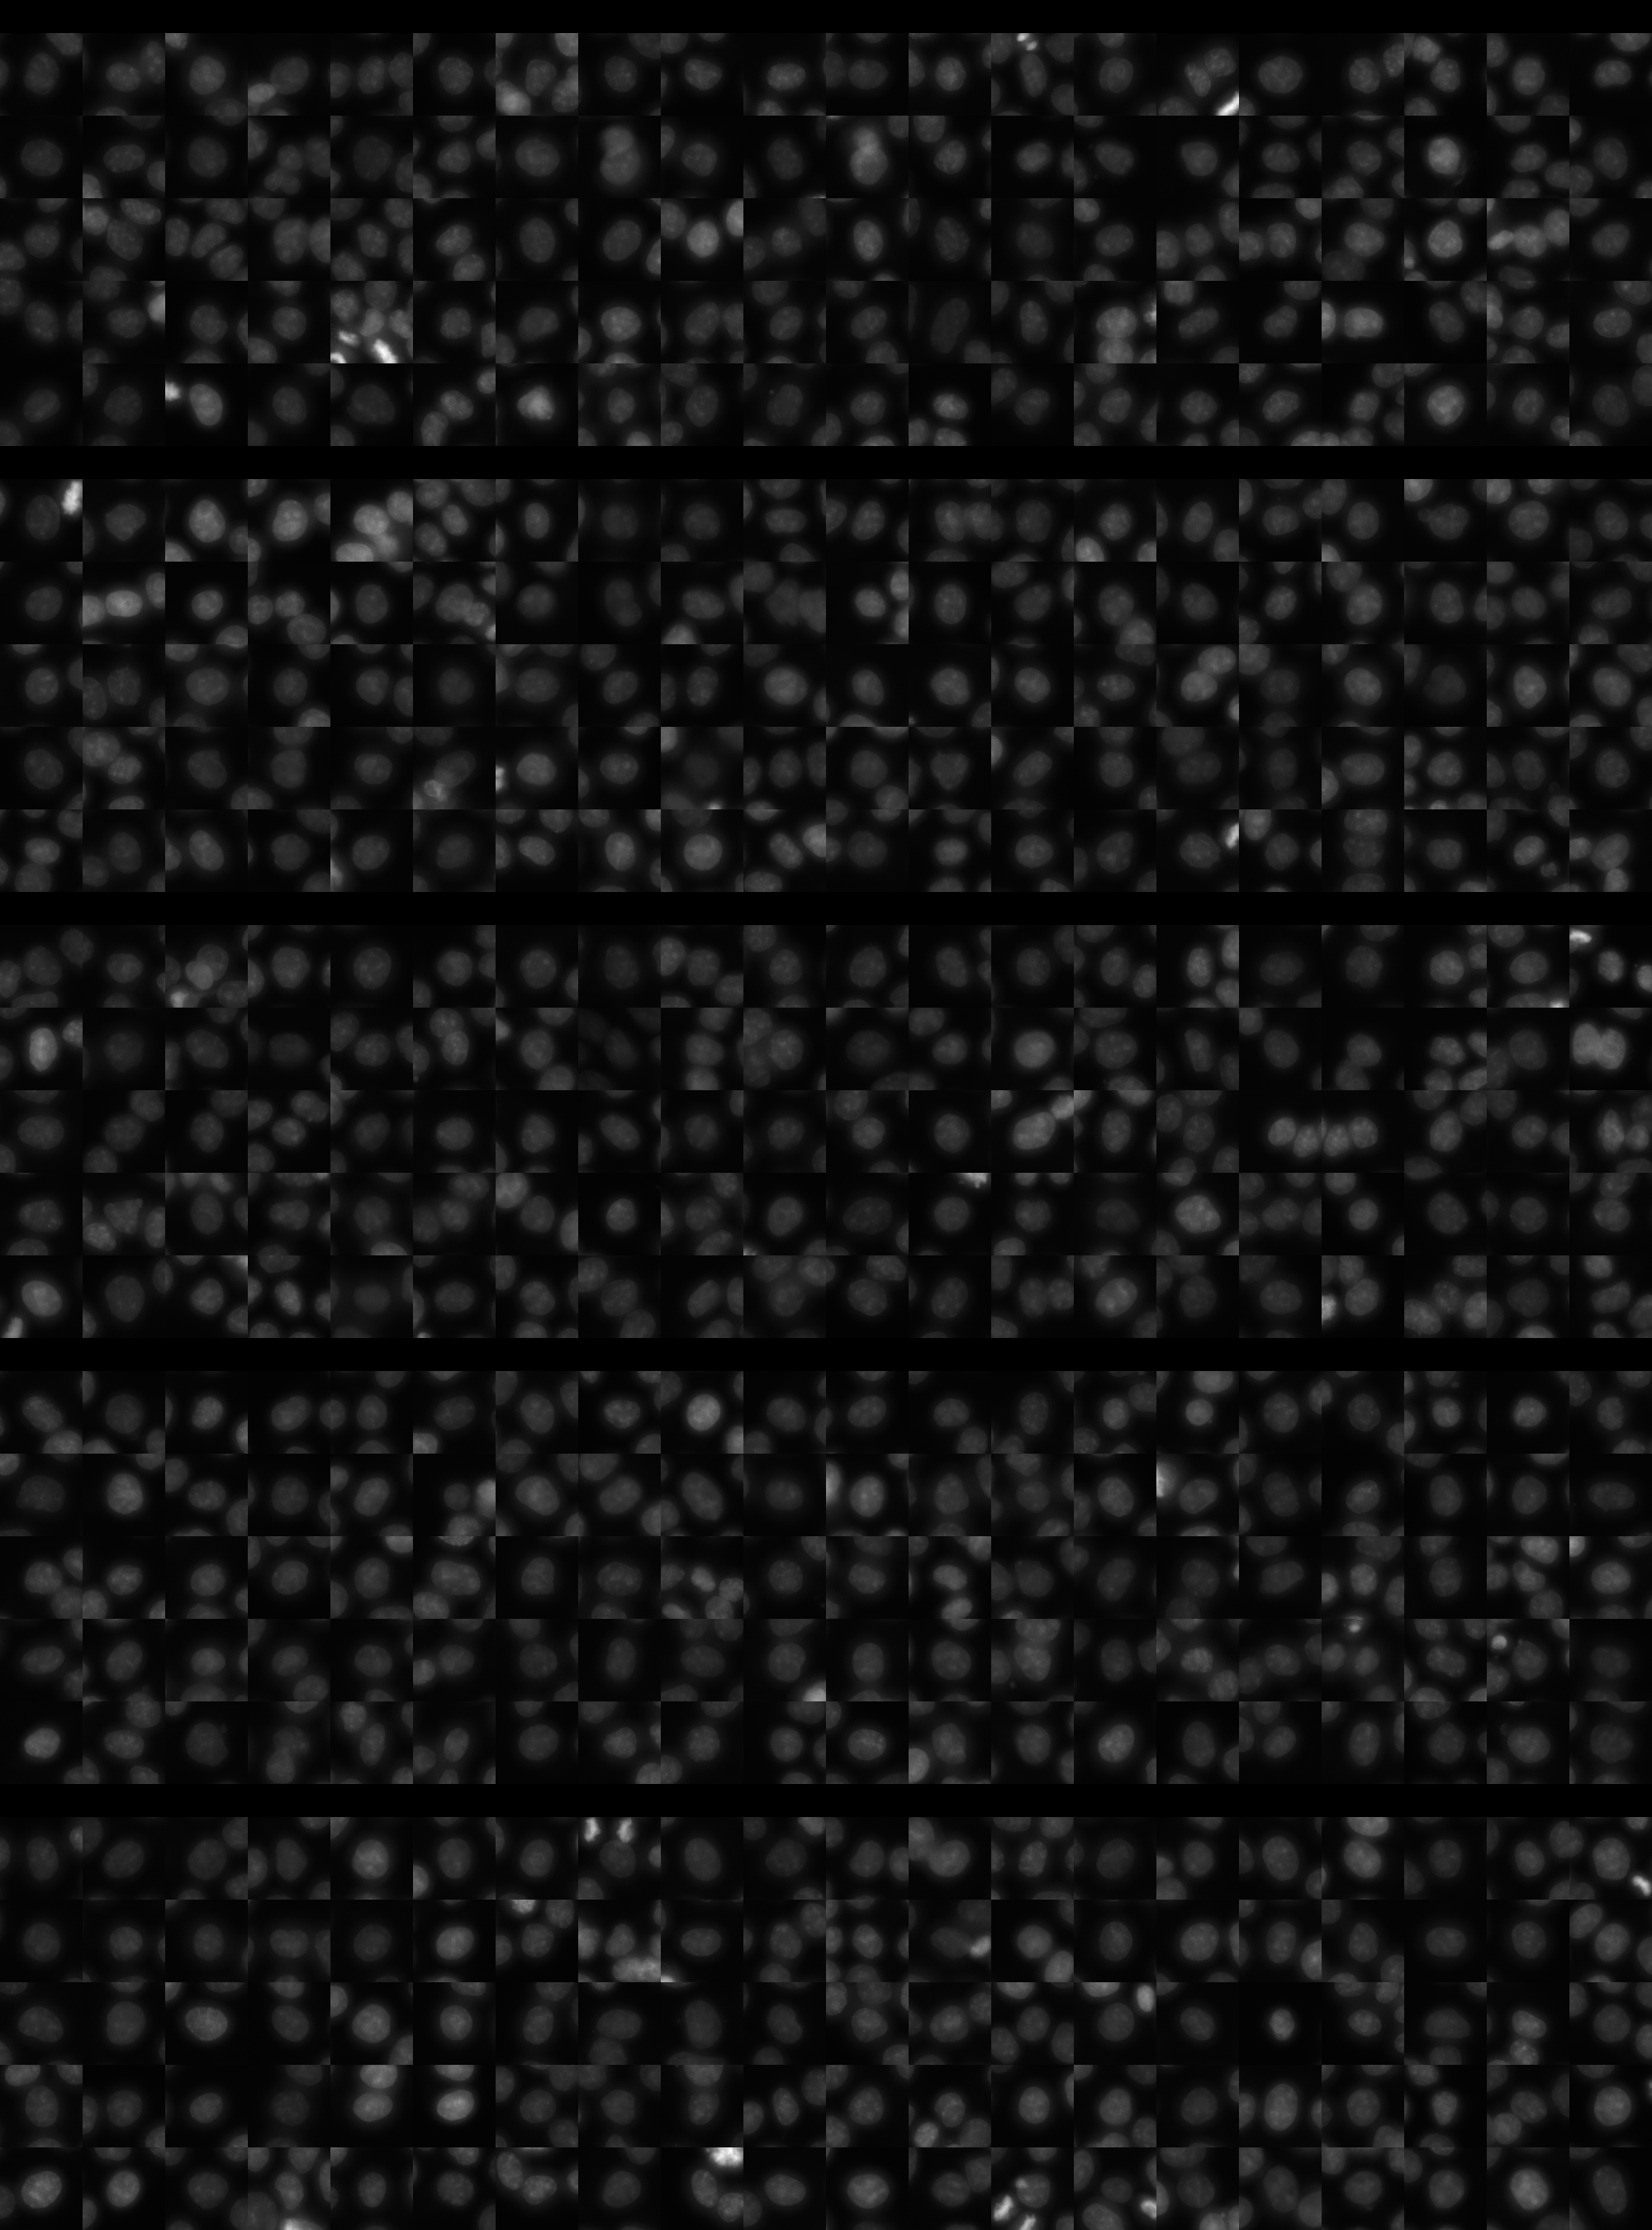
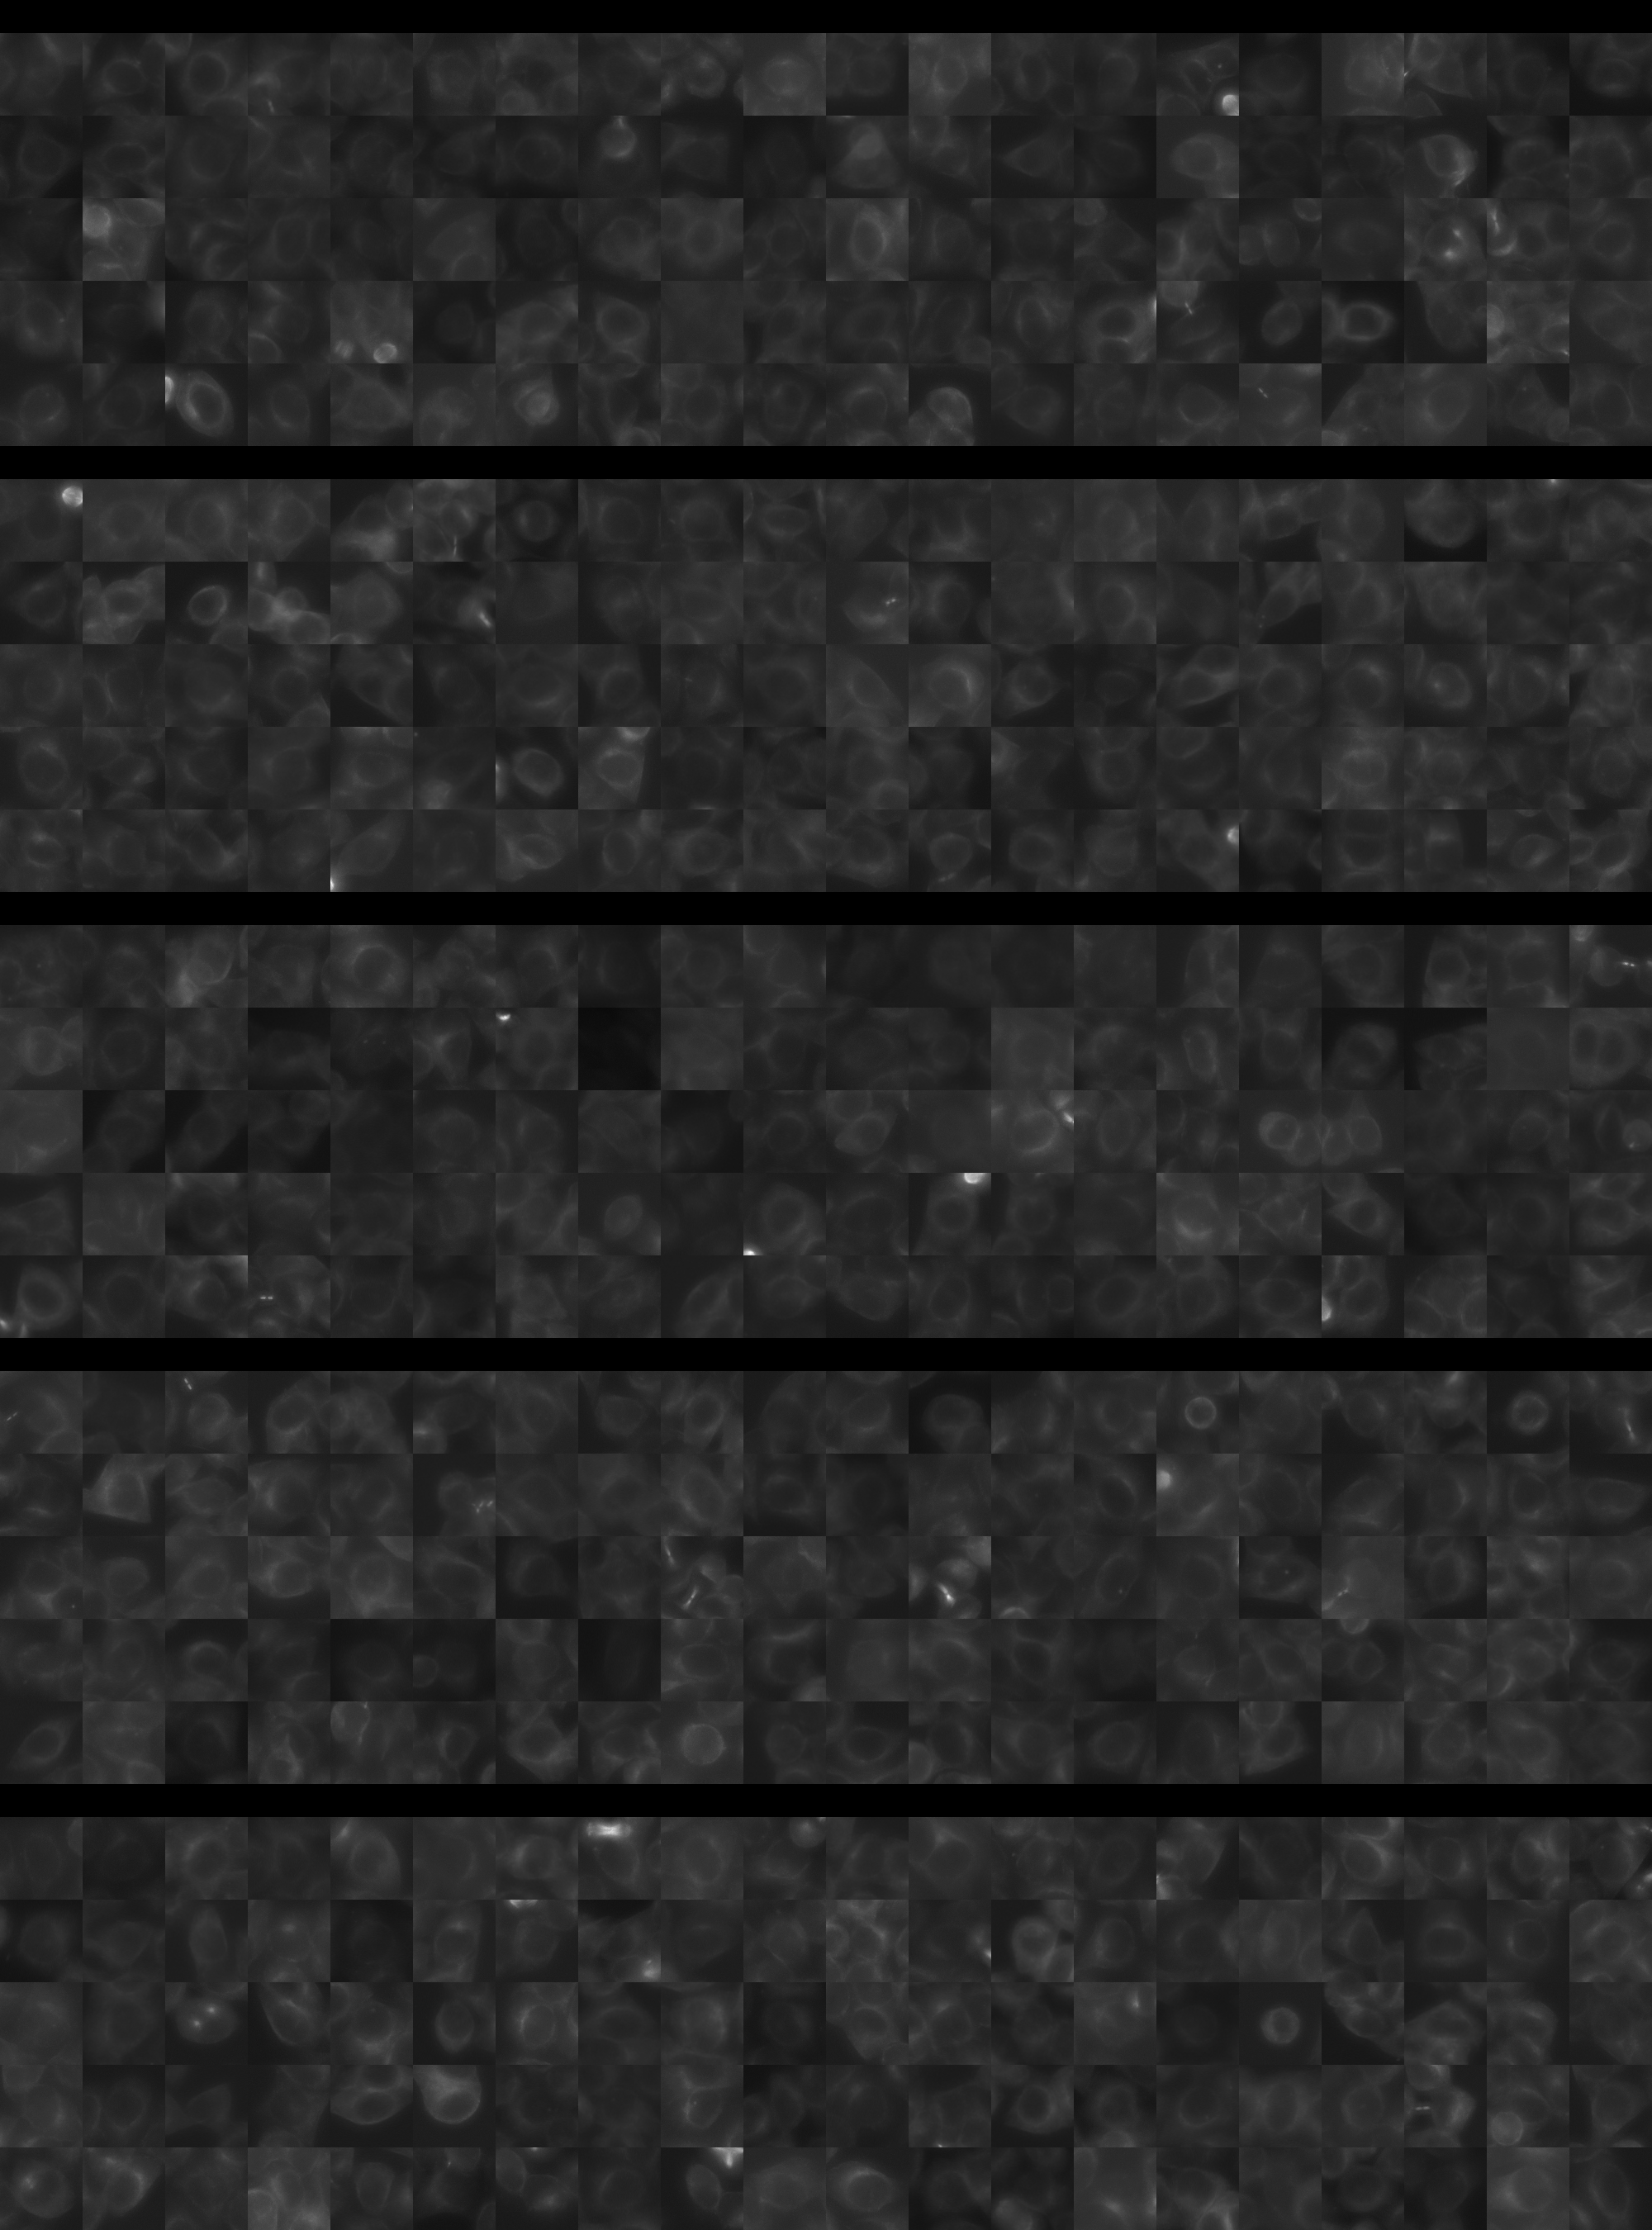
Each montage below shows randomly selected individual cell images for the same target gene separated by sgRNA, along with an example montage of cells expressing a non-targeting negative control sgRNA at the bottom. sgRNA labels in the montages correspond to the numbered sgRNA sequences in the gene info table above. The DNA (blue) and tubulin (green) channels are displayed by default, with gH2AX (grayscale) and actin (yellow) available using the check boxes. Channel brightness, contrast, and opacity are adjustable by clicking the arrow next to the channel name. When only one channel is selected, the display defaults to grayscale. Click the “Zoom” checkbox above the channel controls to enable image zooming (via scrolling) and panning (via click-and-drag).

The cell boxes displayed for this gene are square, 30.36 μm per side for the interphase montage and 30.36 μm per side for the mitotic montage.
Features

Interphase Score Rank FDR q-value
Nucleus DNA Integrated -1.473e-01 5309 of 5322 5.407e-04
Nucleus DNA Mean -7.900e-02 4268 of 5322 0.040
Nucleus gH2AX Mean -6.519e-02 5127 of 5322 0.048
Nucleus DNA - gH2AX Correlation -1.855e-01 5041 of 5322 1.021e-04
Nucleus Shape Area -1.032e-01 4846 of 5322 0.005
Nucleus Shape Eccentricity 0.076 411 of 5322 0.026
Nucleus Shape Form Factor -1.503e-01 4994 of 5322 2.872e-04
Nucleus Shape Solidity -2.323e-01 5188 of 5322 1.903e-04
Cell DNA Mass Displacement 0.059 798 of 5322 0.198
Cell Tubulin Mean -1.882e-01 5154 of 5322 2.141e-04
Cell Tubulin Mass Displacement -1.032e-01 5141 of 5322 0.001
Cell Actin Mean -1.588e-01 5143 of 5322 1.723e-04
Cell Tubulin - Actin Correlation 0.125 401 of 5322 5.491e-04
Cell DNA - Tubulin Correlation -5.798e-03 4034 of 5322 0.896
Cell Shape Area -1.397e-01 4911 of 5322 1.651e-04
Cell Shape Eccentricity 0.092 74 of 5322 0.033
Mitotic Score Rank FDR q-value
Nucleus DNA Integrated 0.134 2004 of 5322 0.927
Nucleus DNA Mean 0.107 1388 of 5322 1.000
Nucleus DNA Mass Displacement 0.135 1439 of 5322 0.999
Nucleus DNA Mean Frac 3 0.064 2115 of 5322 1.000
Nucleus gH2AX Mean 0.046 2310 of 5322 1.000
Nucleus gH2AX Mean Frac 0 0.064 1367 of 5322 1.000
Nucleus Tubulin Mean Frac 0 0.149 1336 of 5322 0.999
Nucleus Tubulin Mean Edge -2.094e-02 3458 of 5322 0.999
Nucleus Tubulin Std Edge 0.027 2187 of 5322 0.999
Nucleus Shape Area 0.089 2815 of 5322 0.990
Nucleus Shape Eccentricity -4.377e-02 2794 of 5322 1.000
Nucleus Shape Form Factor -1.365e-01 3373 of 5322 0.998
Cell Tubulin Mean 0.020 3227 of 5322 1.000
Cell Tubulin Mean Frac 3 -2.781e-01 4607 of 5322 0.944
Cell Actin Mean 0.077 2196 of 5322 0.997
Cell Shape Area 0.037 3443 of 5322 0.999
( Reset Zoom )
Brightness
Contrast
Opacity
Brightness
Contrast
Opacity
Brightness
Contrast
Opacity
Brightness
Contrast
Opacity
Brightness
Contrast
Opacity

( Reset Zoom )
Brightness
Contrast
Opacity
Brightness
Contrast
Opacity
Brightness
Contrast
Opacity
Brightness
Contrast
Opacity
Brightness
Contrast
Opacity

MIT Central Accessability