NOP14

Gene symbol: NOP14
Gene: 8602
Uniprot Function: Involved in nucleolar processing of pre-18S ribosomal RNA. Has a role in the nuclear export of 40S pre-ribosomal subunit to the cytoplasm (By similarity).
Mitotic Index 0.0187
Interphase Cluster: #21 (39 genes)
Mitotic Cluster: #140 (20 genes)
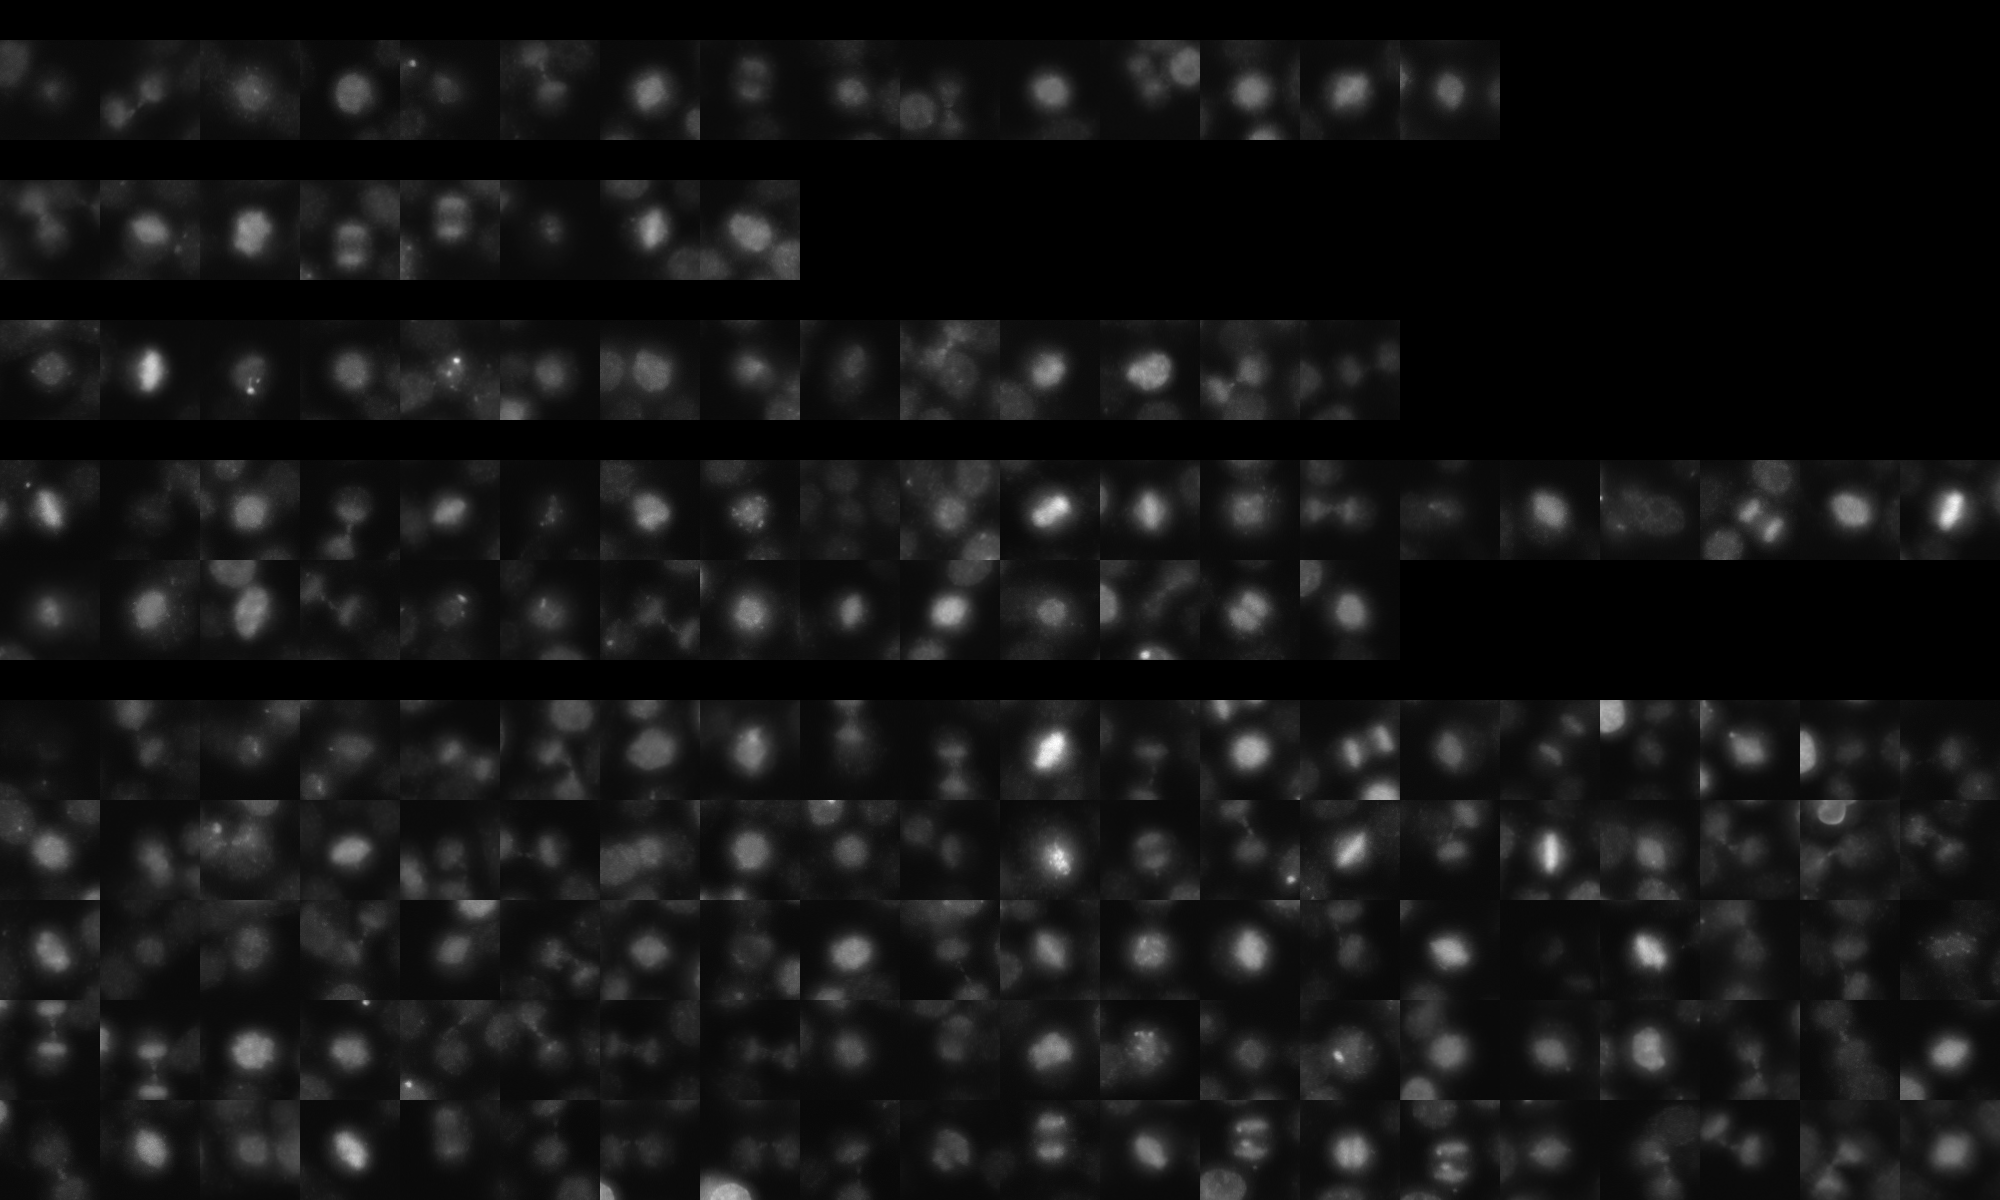
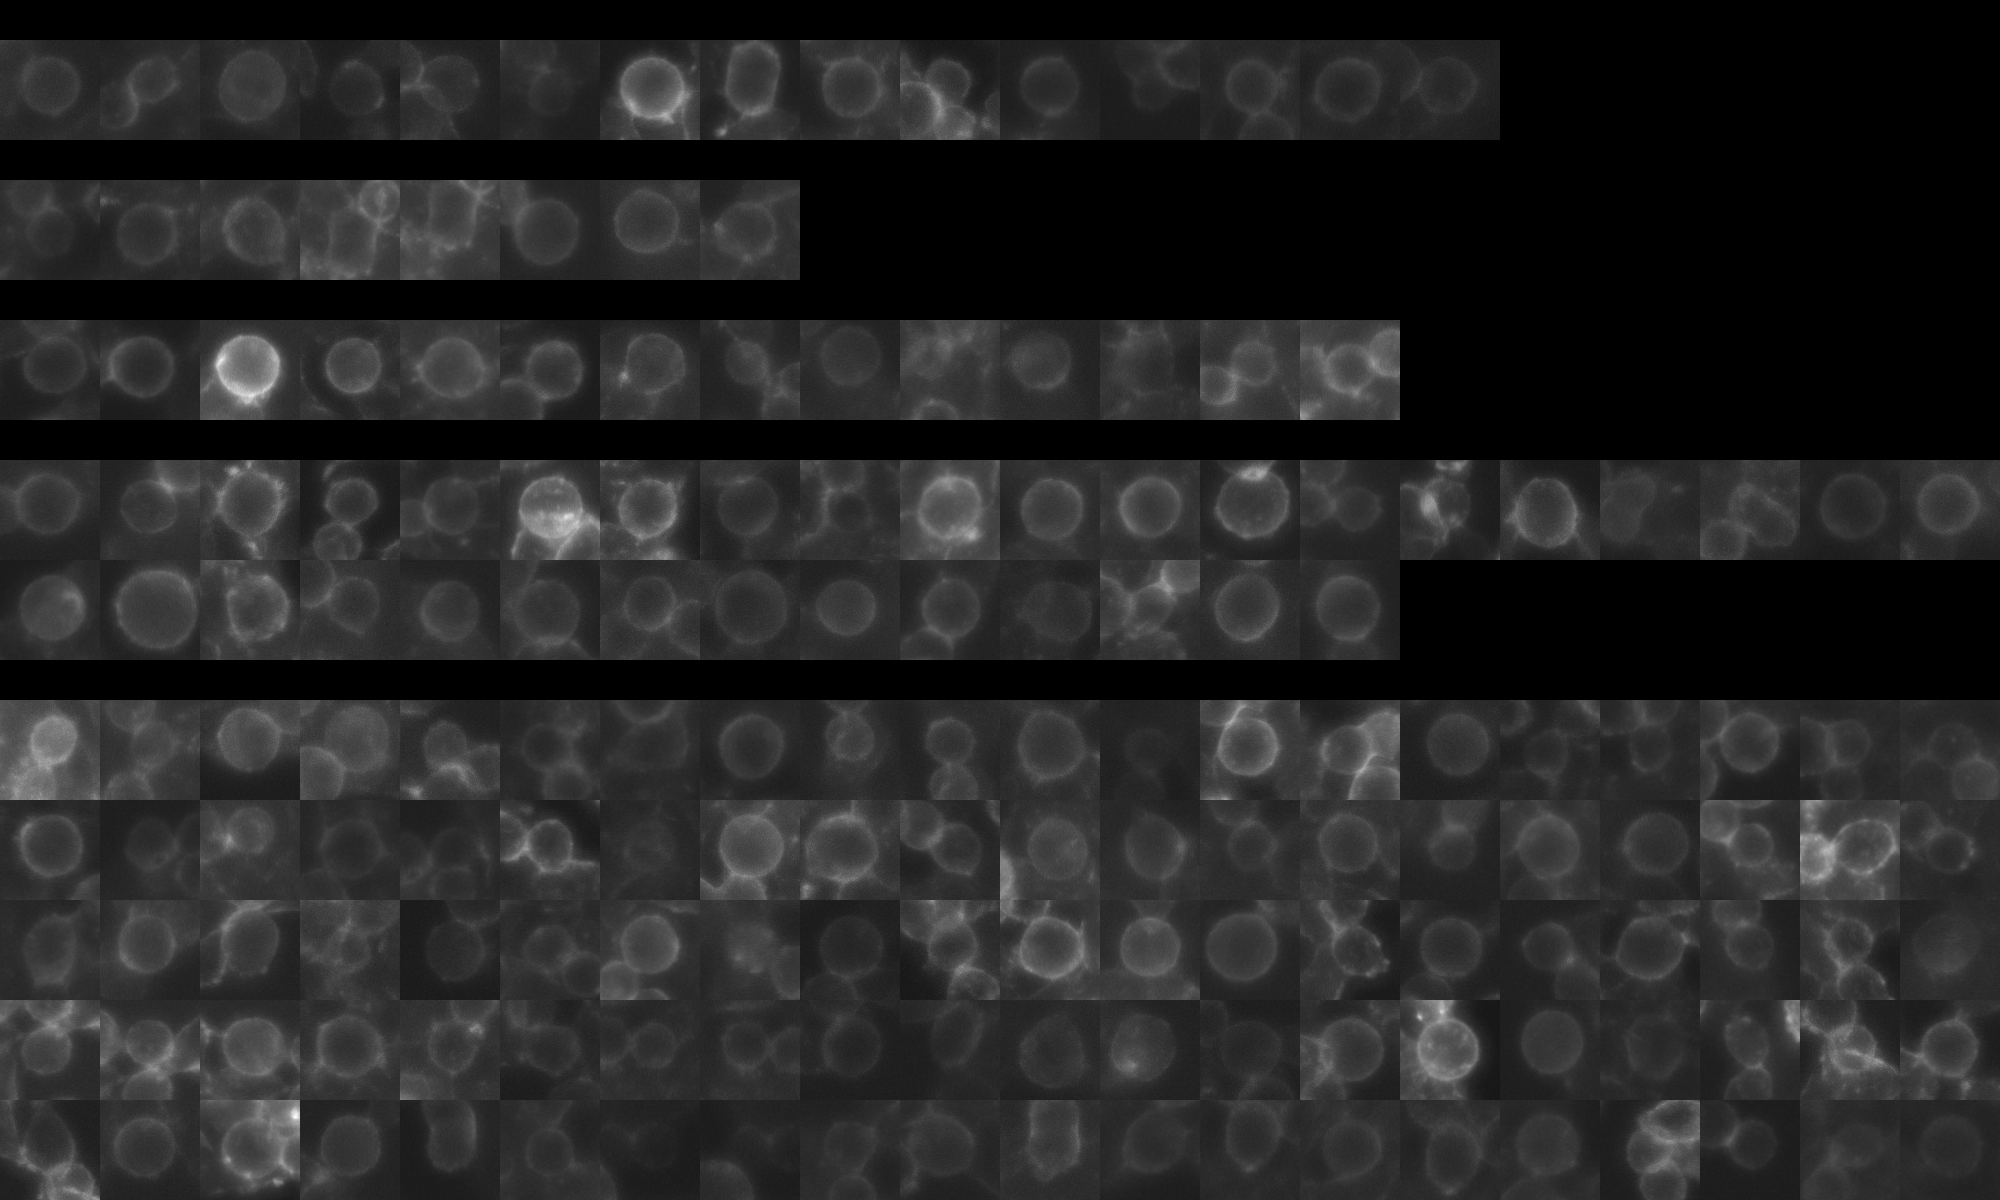
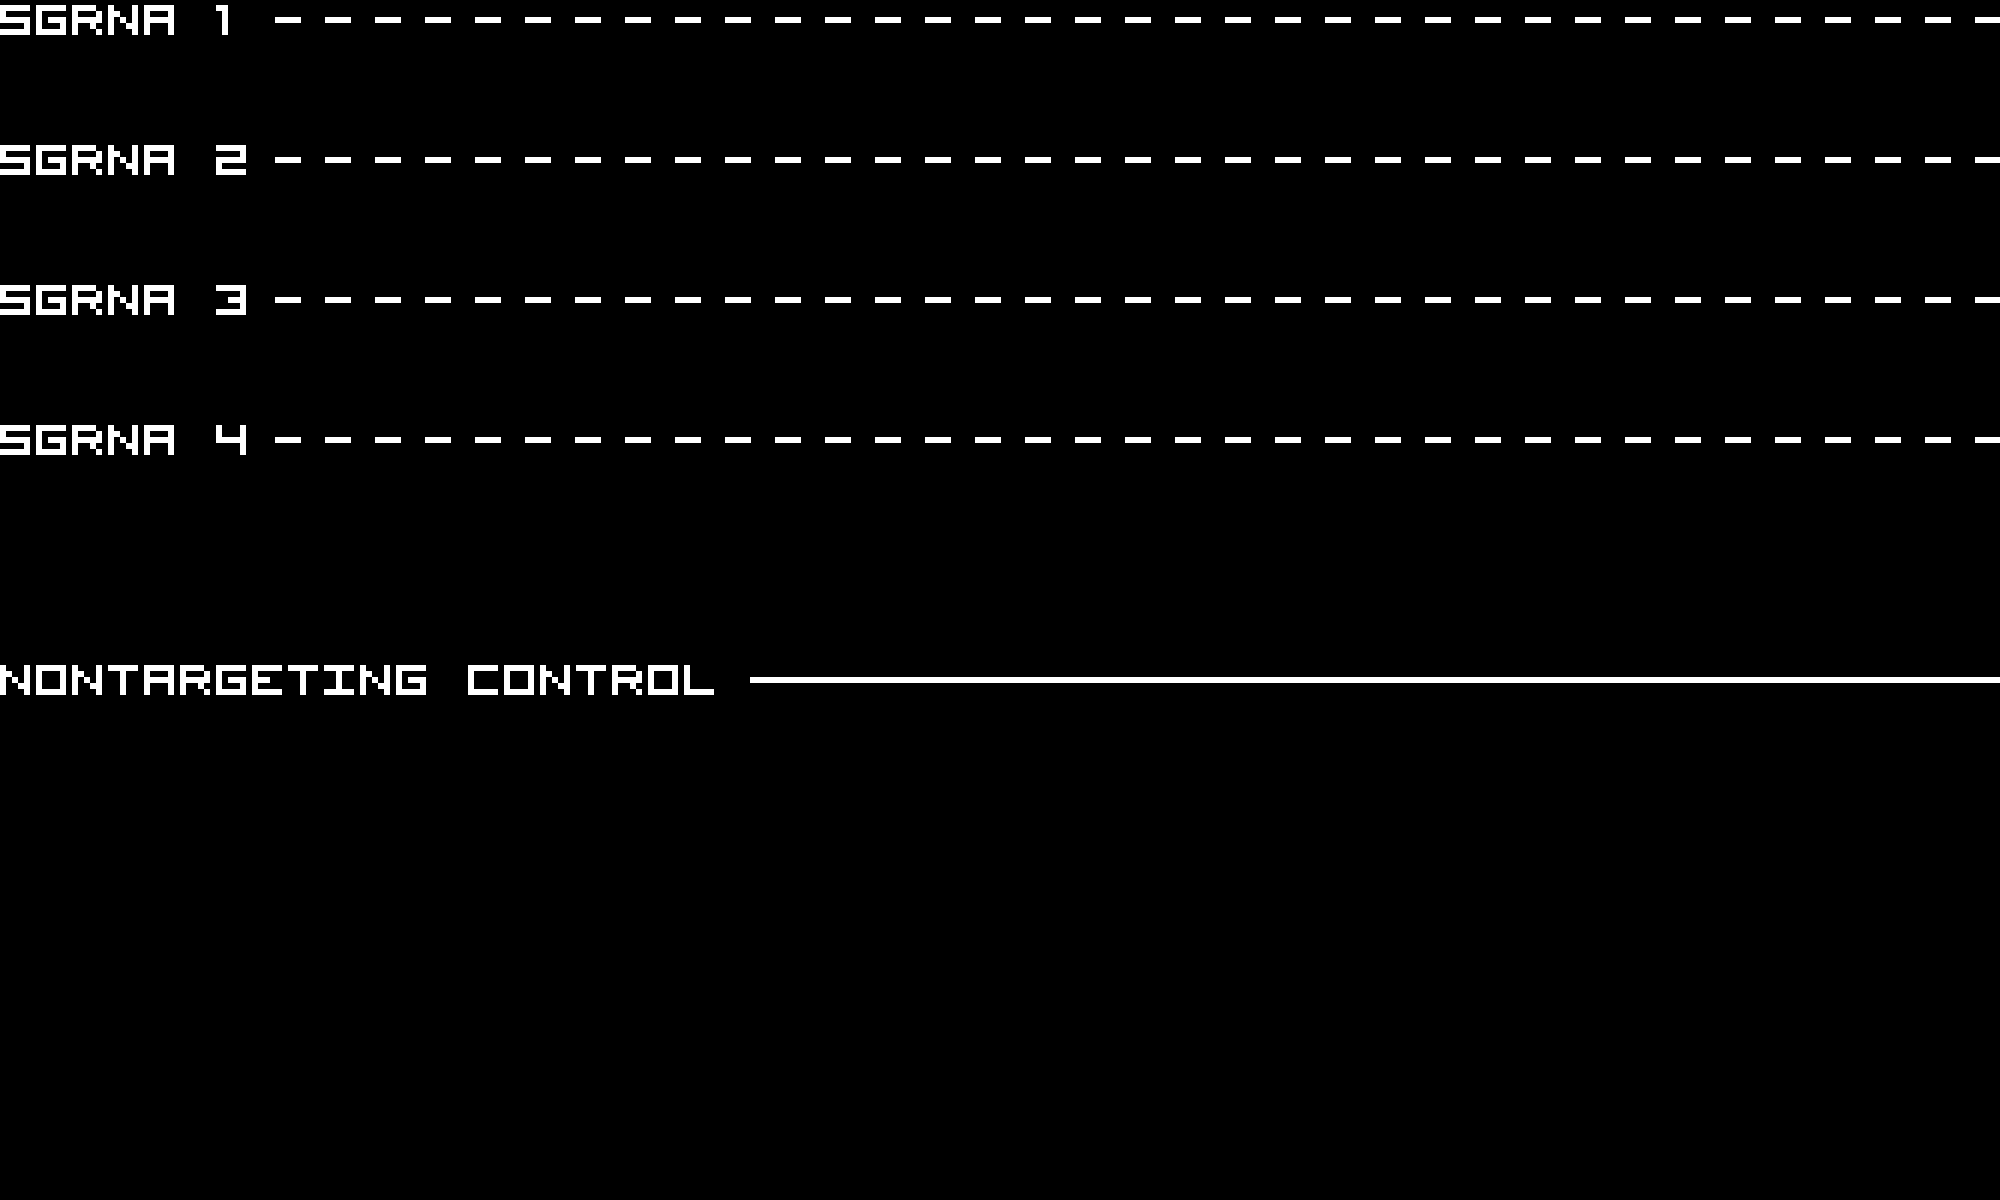
sgRNA 1: CACAAGAAGACTCAACAGGA (interphase cells: 905, mitotic cells: 15)
sgRNA 2: CGGAAGACGCGCCACGACGT (interphase cells: 294, mitotic cells: 8)
sgRNA 3: CTCTAACAGGATGAAGACGG (interphase cells: 834, mitotic cells: 14)
sgRNA 4: GACCTTCTTCGCCTTCGCCA (interphase cells: 1702, mitotic cells: 34)

Interphase Cluster

Mitotic Cluster

Overview

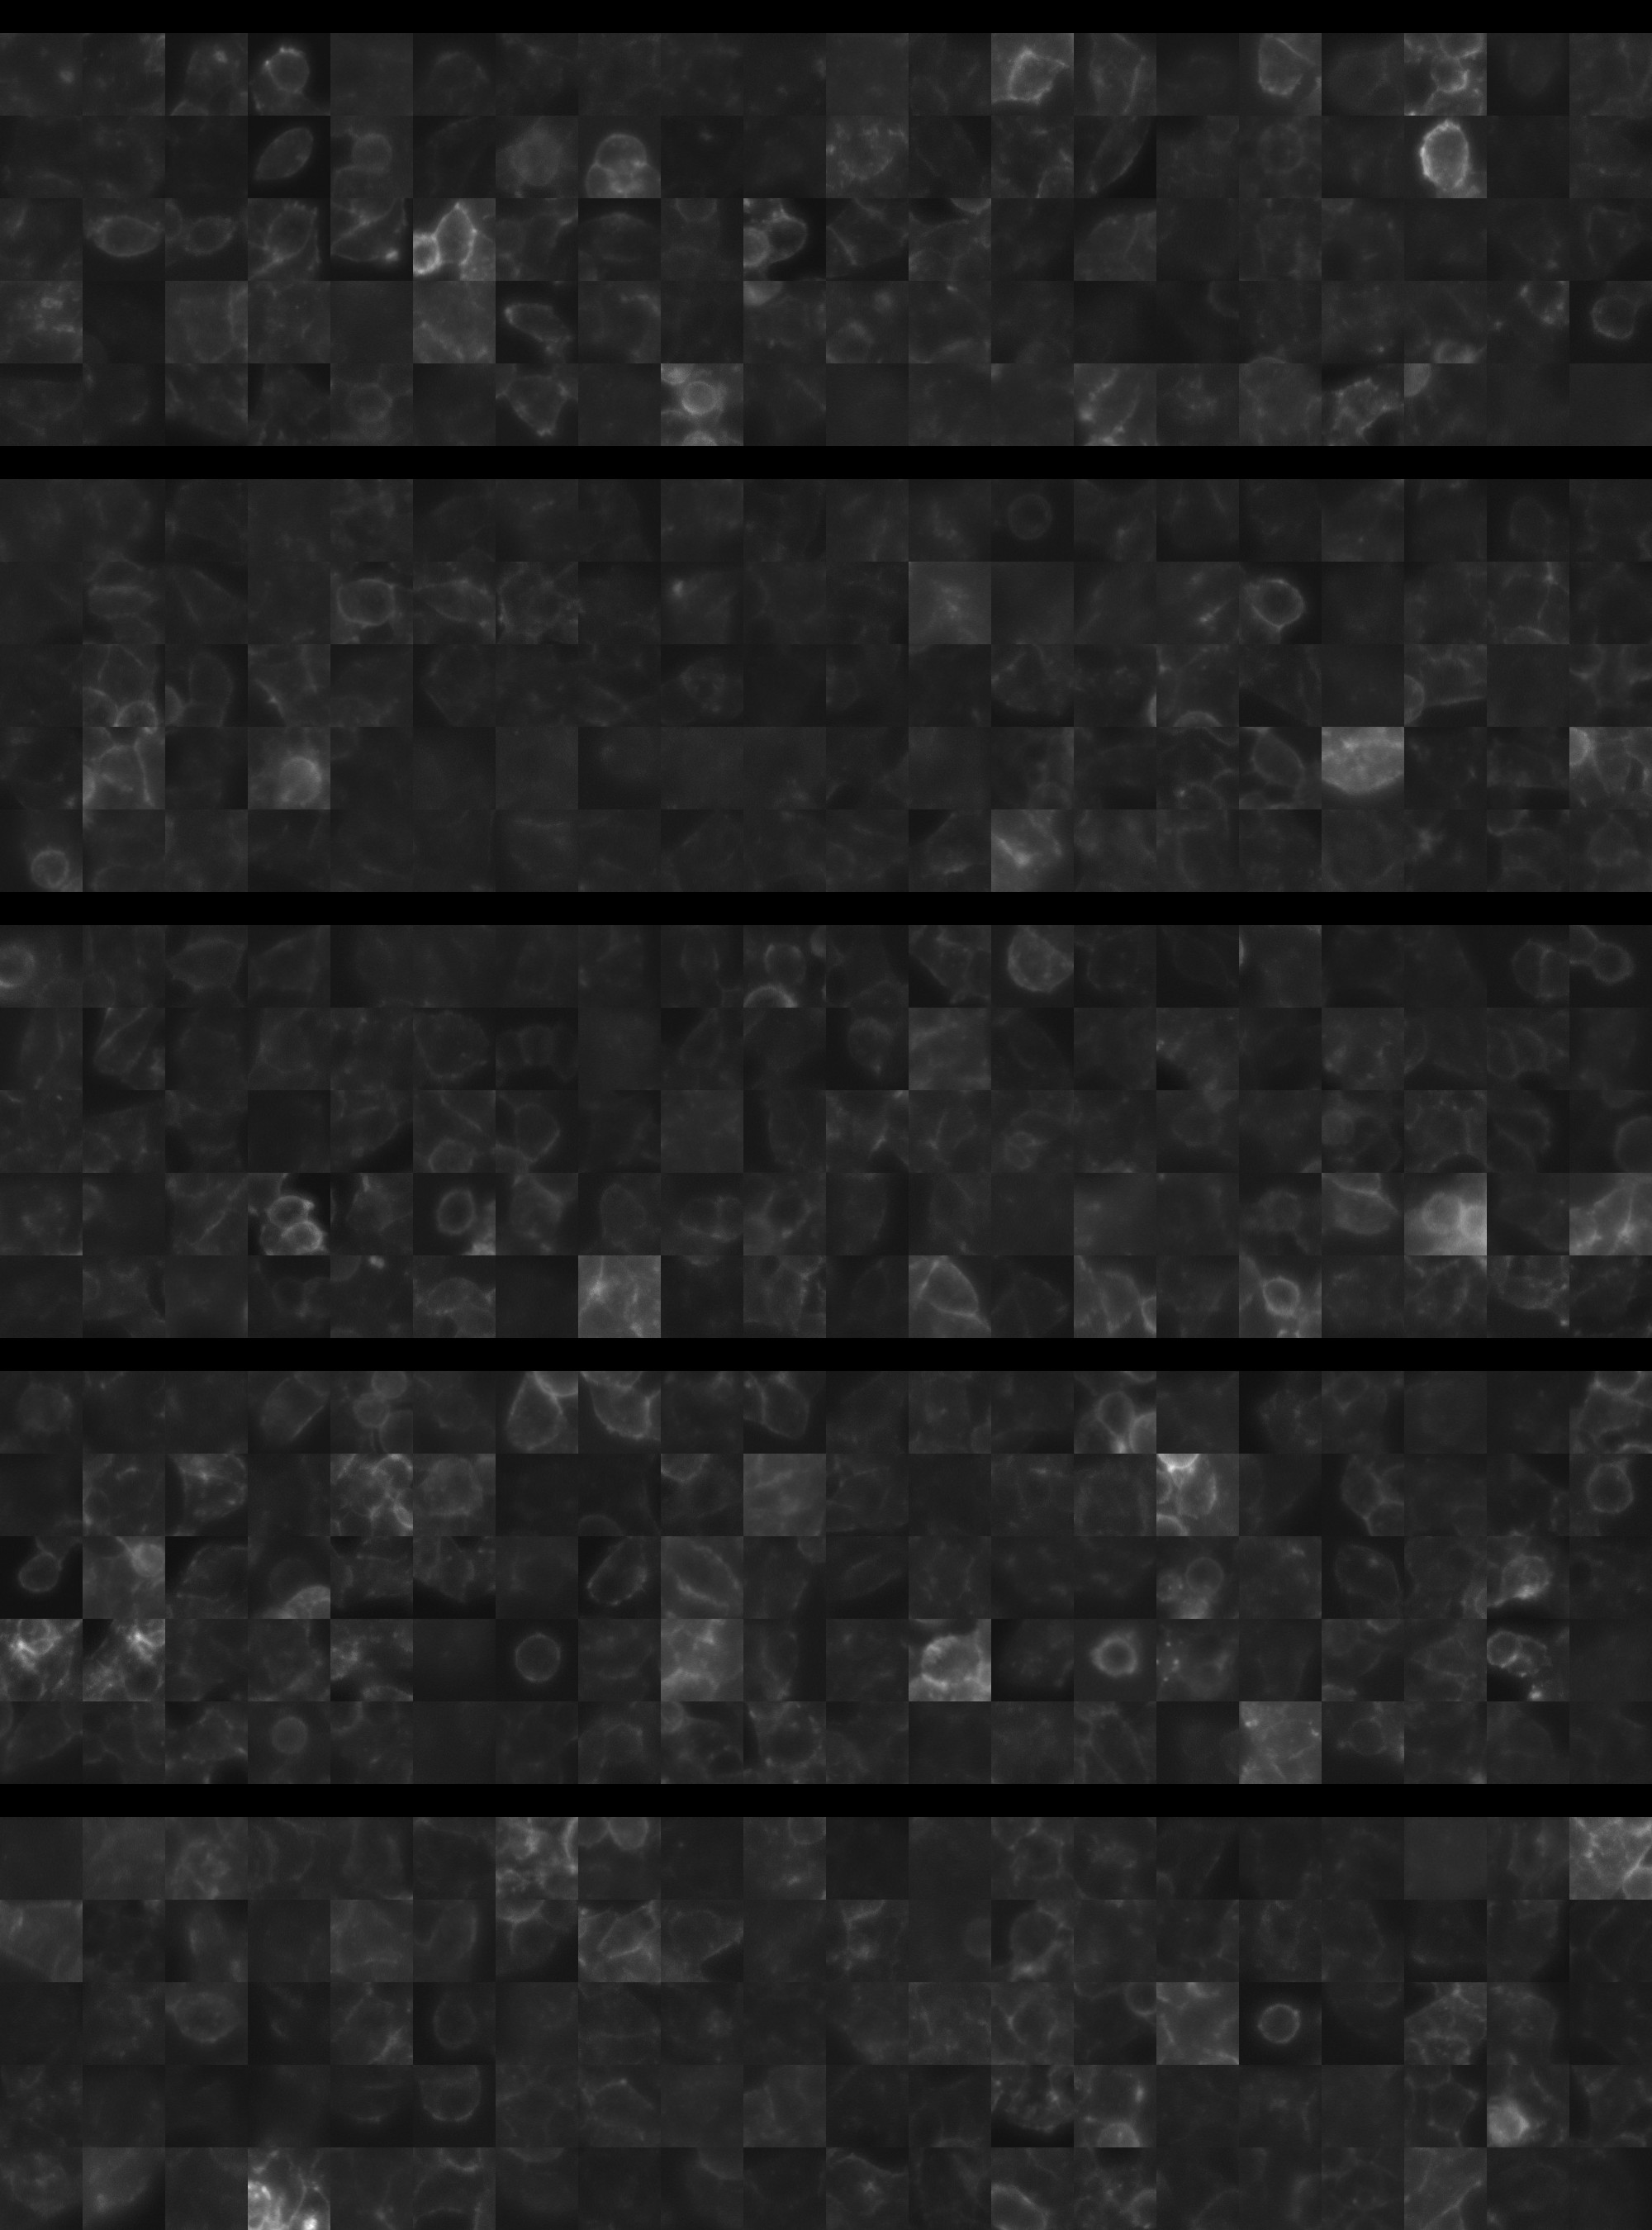
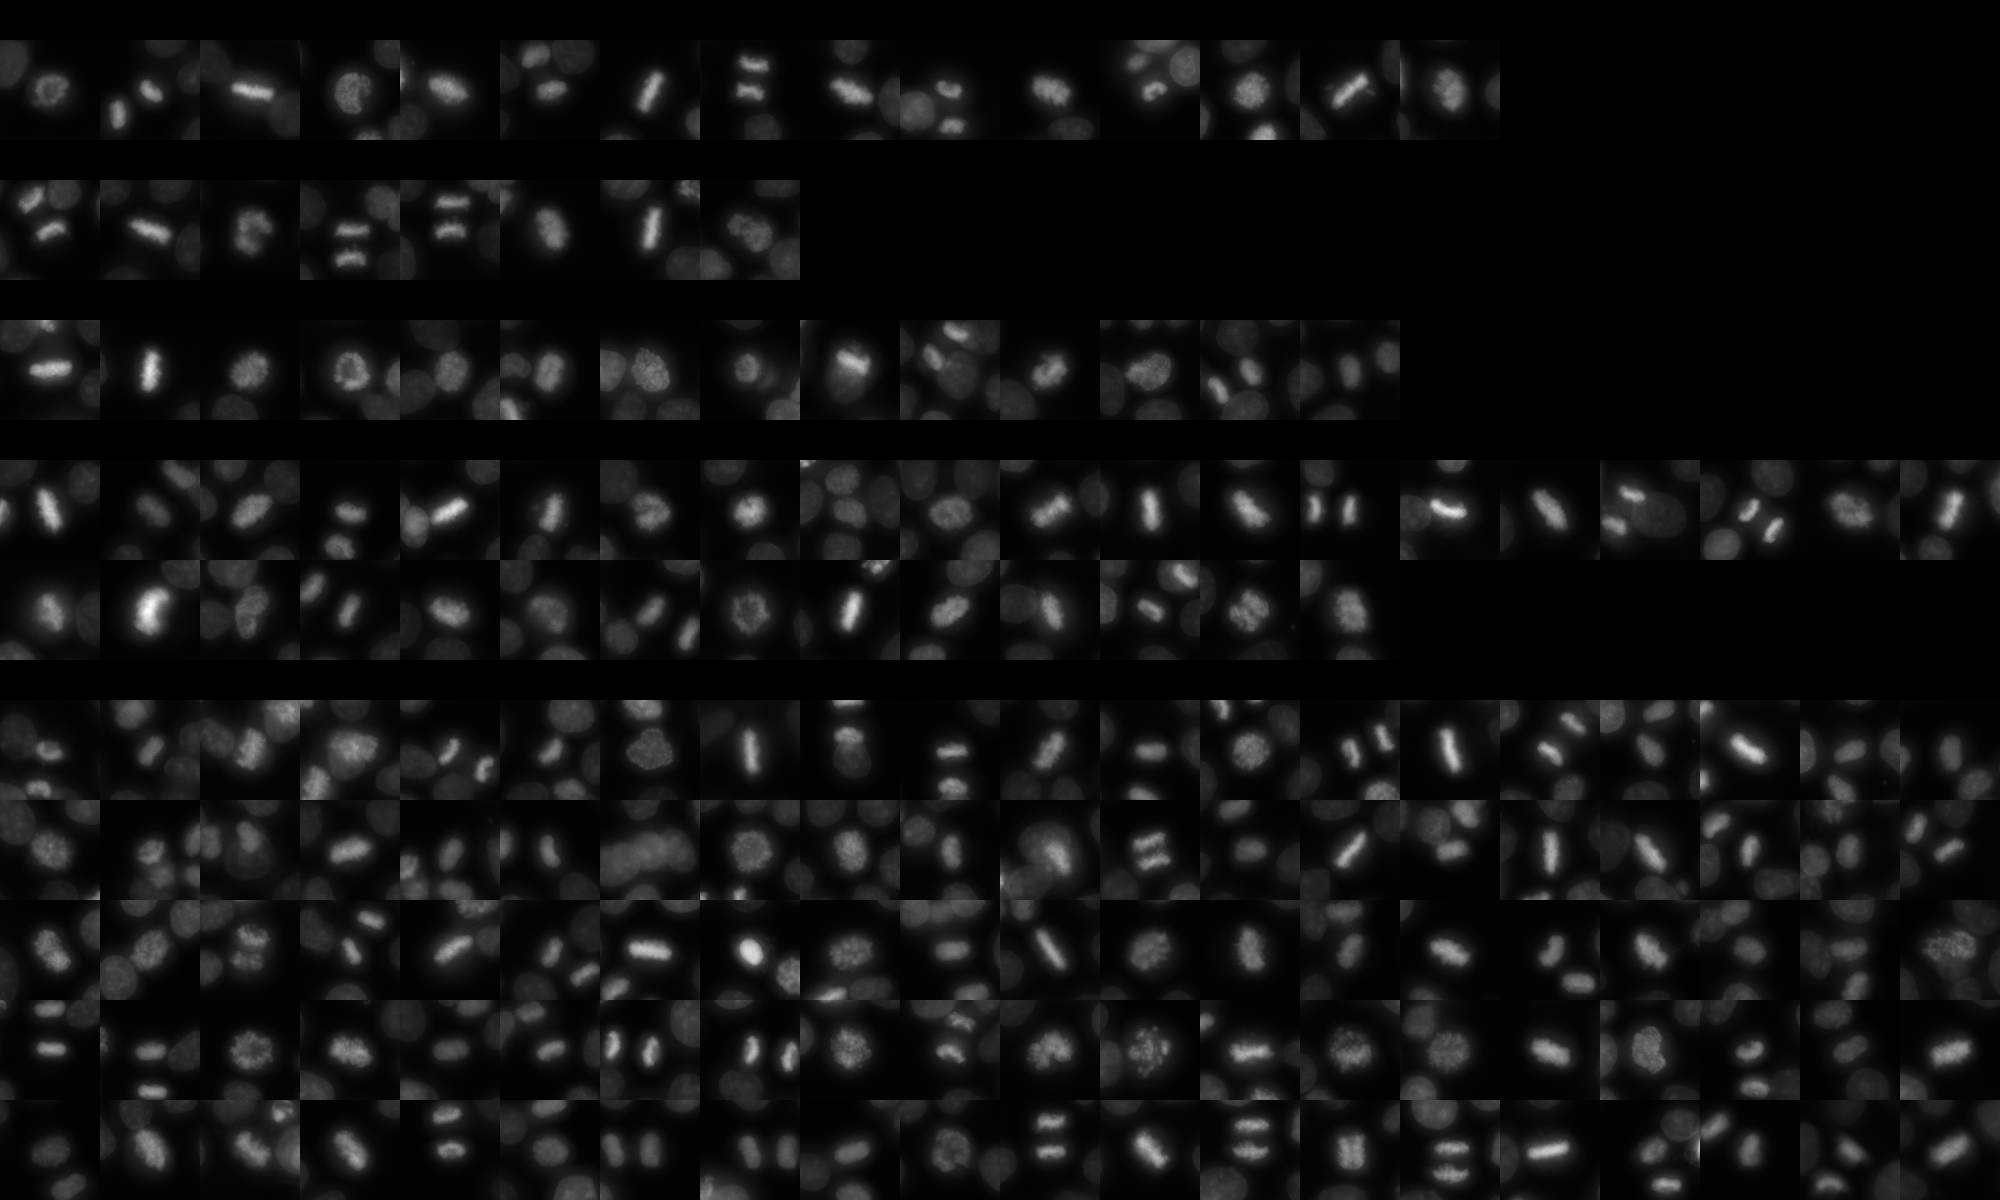
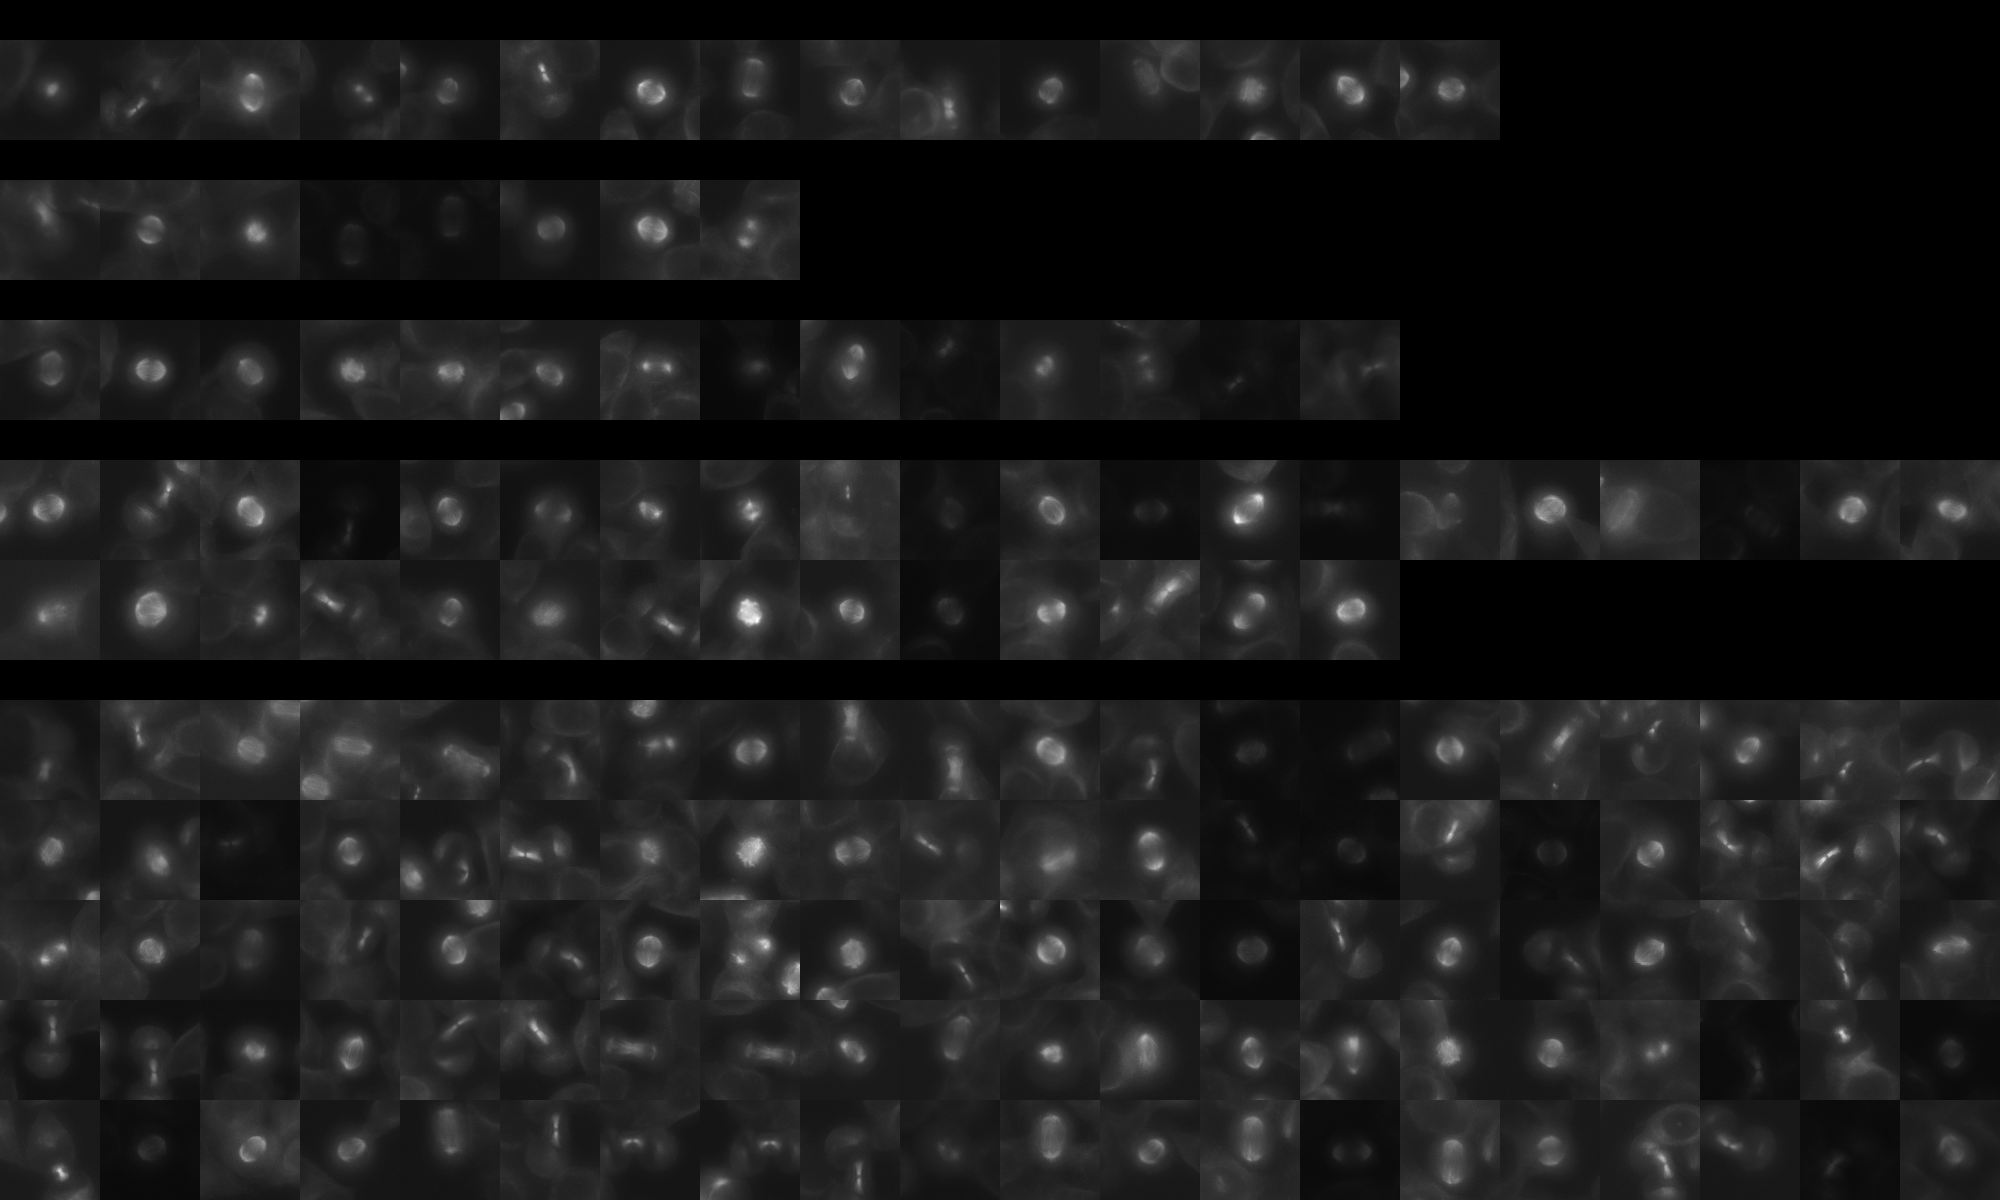
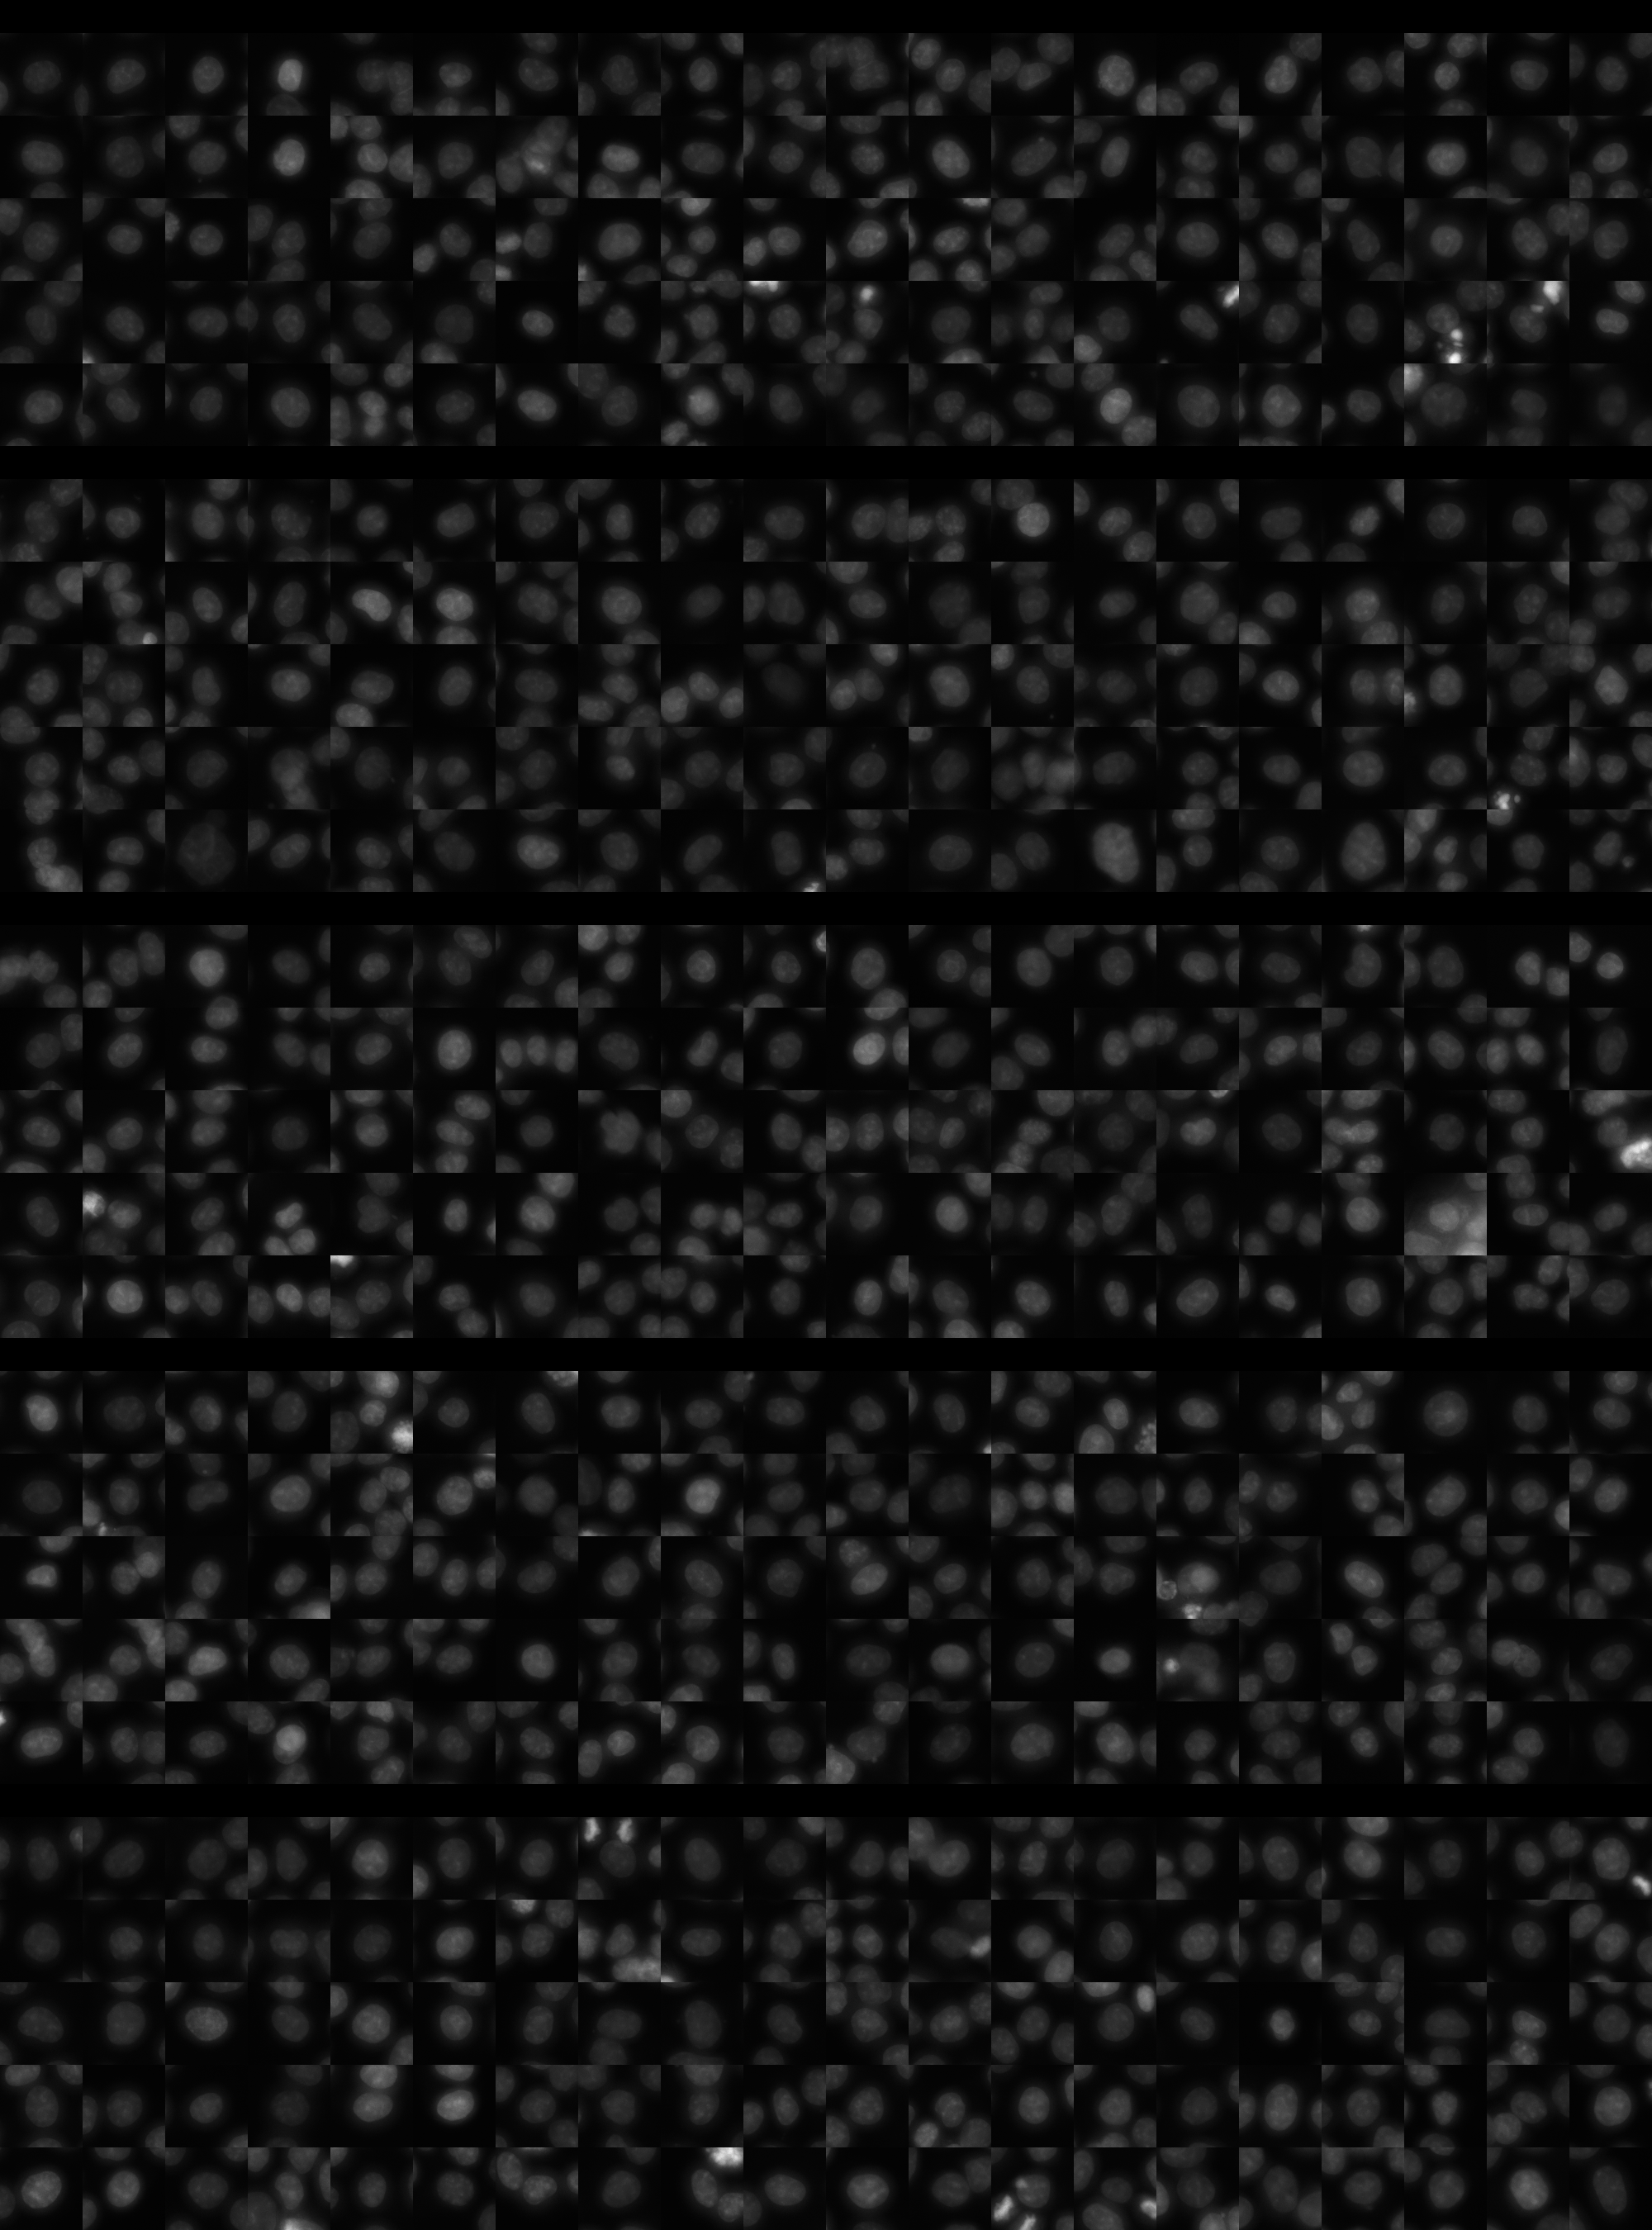
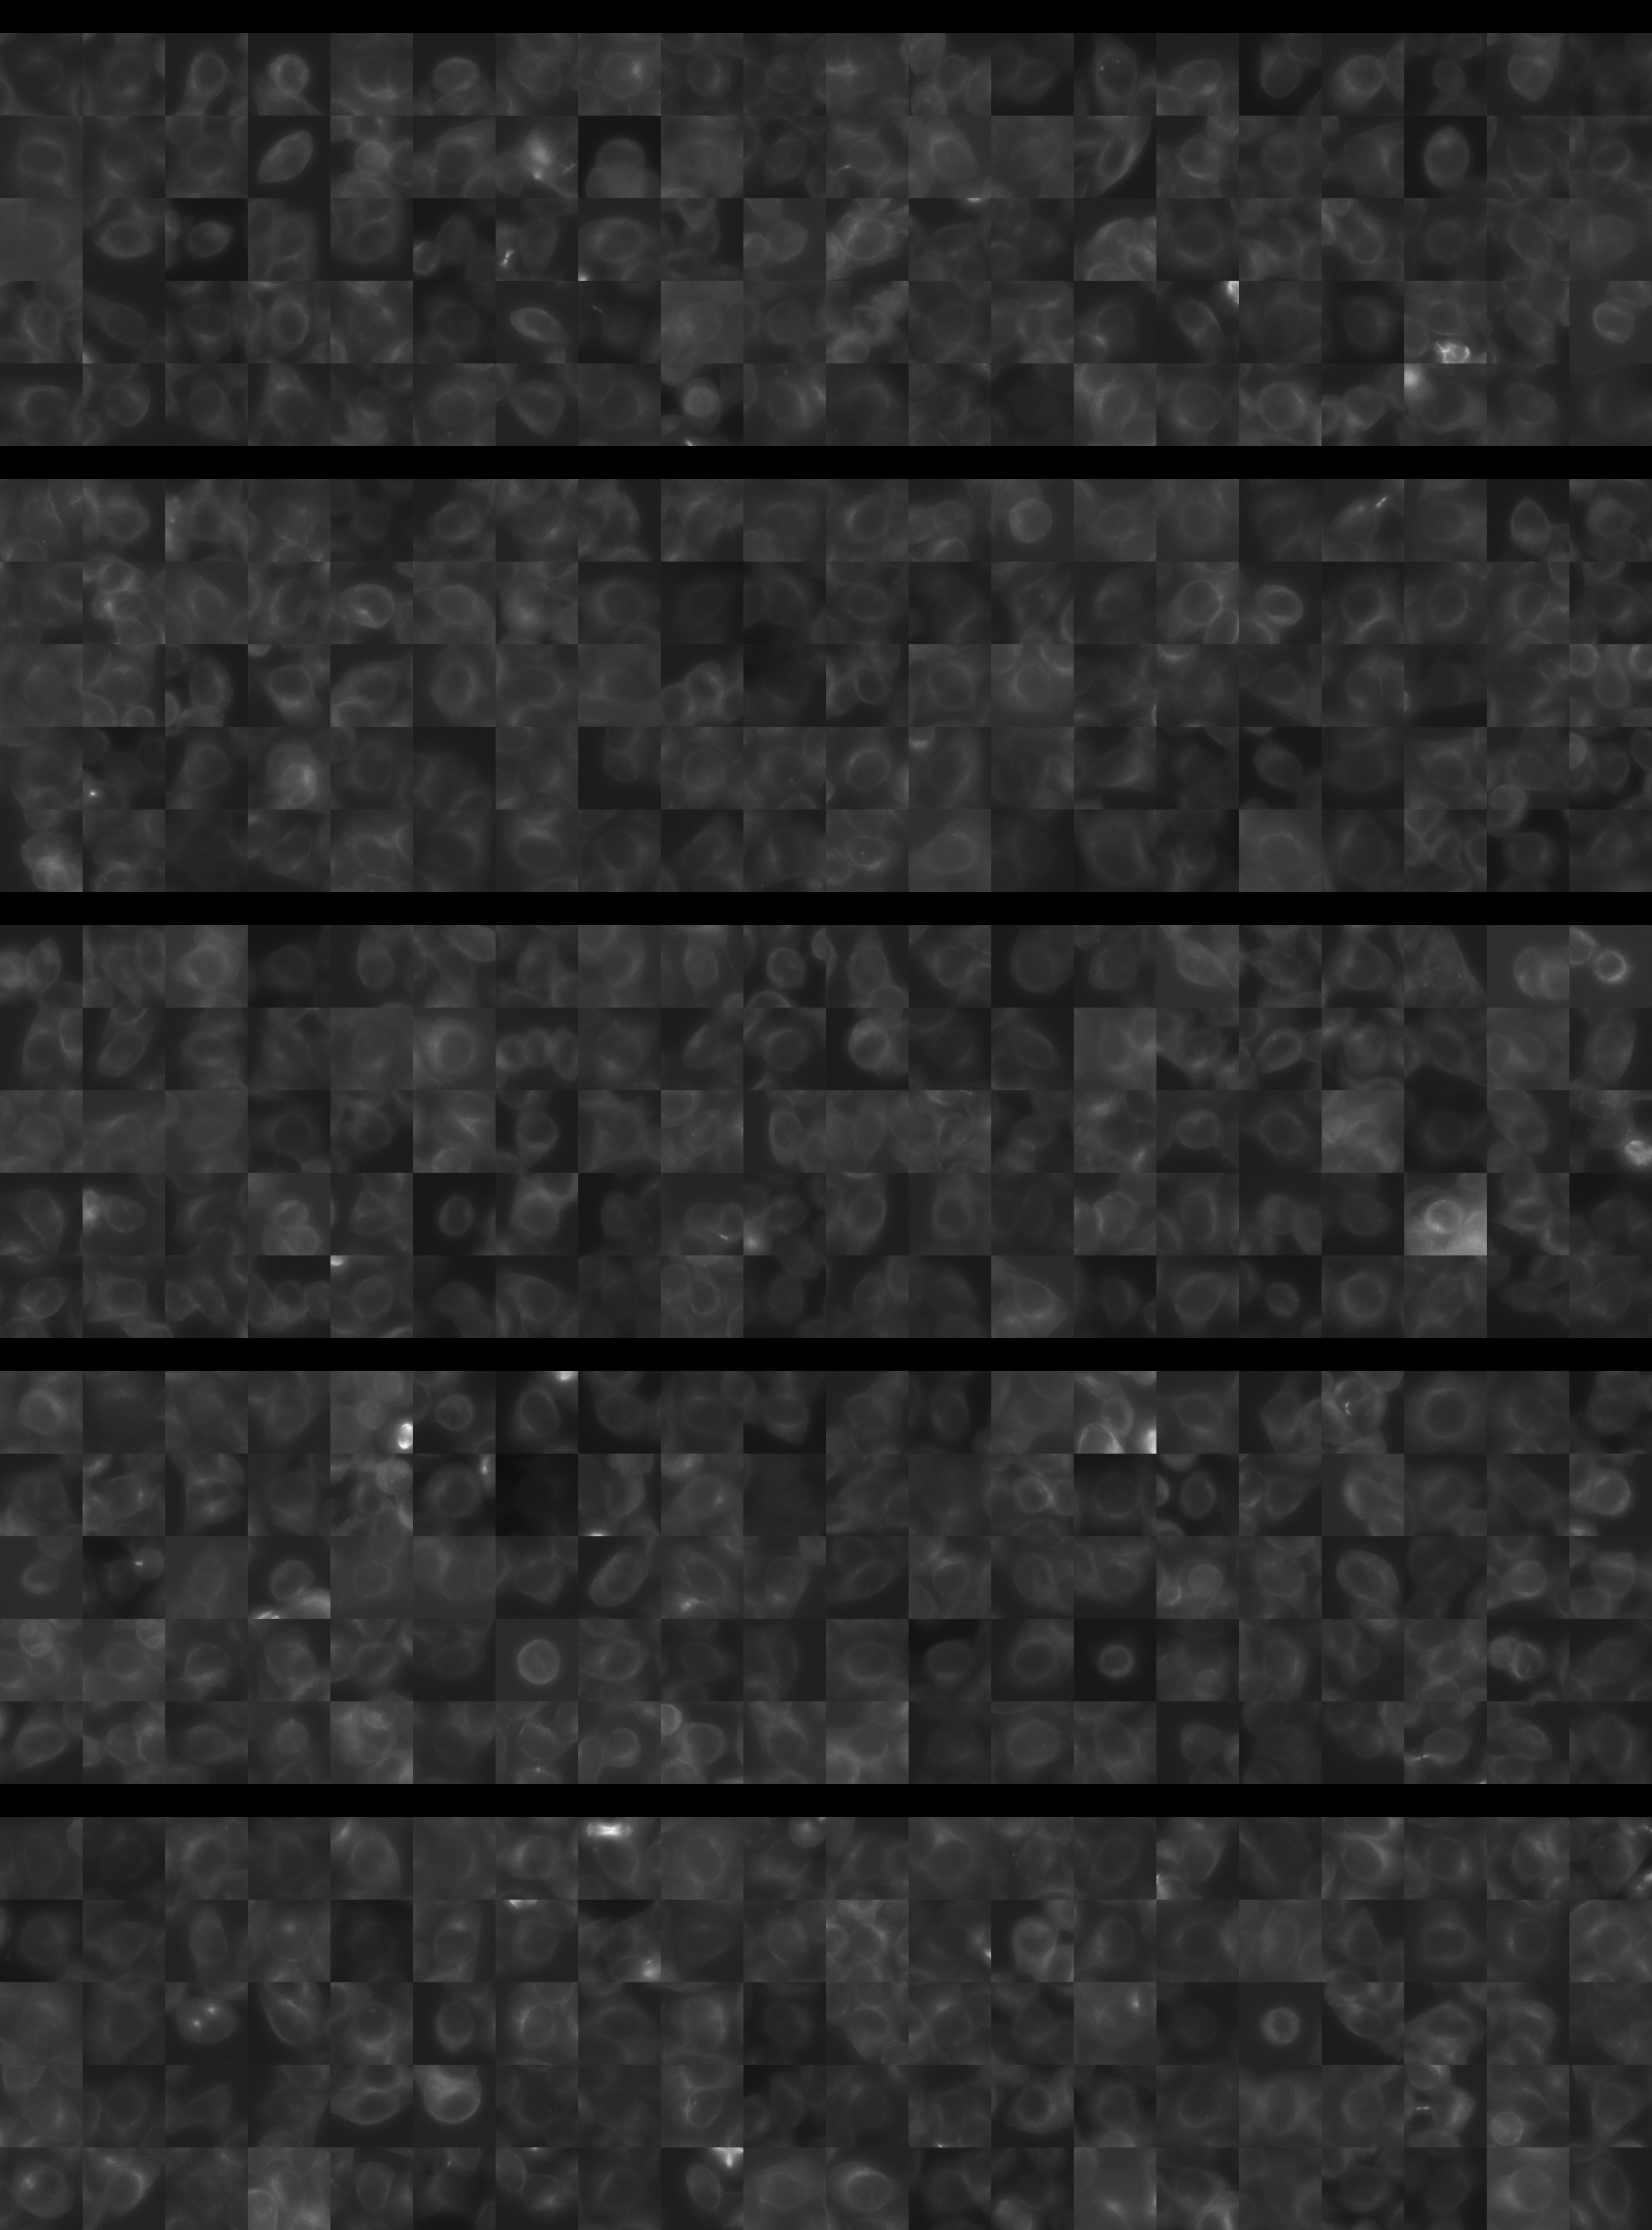
Each montage below shows randomly selected individual cell images for the same target gene separated by sgRNA, along with an example montage of cells expressing a non-targeting negative control sgRNA at the bottom. sgRNA labels in the montages correspond to the numbered sgRNA sequences in the gene info table above. The DNA (blue) and tubulin (green) channels are displayed by default, with gH2AX (grayscale) and actin (yellow) available using the check boxes. Channel brightness, contrast, and opacity are adjustable by clicking the arrow next to the channel name. When only one channel is selected, the display defaults to grayscale. Click the “Zoom” checkbox above the channel controls to enable image zooming (via scrolling) and panning (via click-and-drag).

The cell boxes displayed for this gene are square, 30.36 μm per side for the interphase montage and 30.36 μm per side for the mitotic montage.
Features

Interphase Score Rank FDR q-value
Nucleus DNA Integrated 0.019 2154 of 5322 0.867
Nucleus DNA Mean 0.380 172 of 5322 1.505e-04
Nucleus gH2AX Mean 0.045 3646 of 5322 0.315
Nucleus DNA - gH2AX Correlation 0.132 130 of 5322 0.001
Nucleus Shape Area -3.738e-01 5157 of 5322 1.633e-04
Nucleus Shape Eccentricity -3.696e-02 4632 of 5322 0.514
Nucleus Shape Form Factor -8.546e-02 4065 of 5322 0.060
Nucleus Shape Solidity -1.864e-01 5061 of 5322 1.903e-04
Cell DNA Mass Displacement 0.064 667 of 5322 0.302
Cell Tubulin Mean -1.672e-02 3430 of 5322 0.844
Cell Tubulin Mass Displacement -2.263e-02 4142 of 5322 0.790
Cell Actin Mean 0.130 584 of 5322 0.007
Cell Tubulin - Actin Correlation 0.205 160 of 5322 2.896e-04
Cell DNA - Tubulin Correlation 0.315 144 of 5322 1.948e-04
Cell Shape Area -4.242e-01 5195 of 5322 1.651e-04
Cell Shape Eccentricity 0.042 858 of 5322 0.607
Mitotic Score Rank FDR q-value
Nucleus DNA Integrated 0.148 1831 of 5322 0.965
Nucleus DNA Mean 0.366 126 of 5322 1.000
Nucleus DNA Mass Displacement -2.847e-02 3936 of 5322 0.999
Nucleus DNA Mean Frac 3 -2.852e-01 5226 of 5322 1.000
Nucleus gH2AX Mean 0.184 851 of 5322 1.000
Nucleus gH2AX Mean Frac 0 0.020 1963 of 5322 1.000
Nucleus Tubulin Mean Frac 0 0.189 940 of 5322 0.999
Nucleus Tubulin Mean Edge -2.448e-01 5019 of 5322 0.995
Nucleus Tubulin Std Edge -7.675e-02 3617 of 5322 0.999
Nucleus Shape Area 0.229 1236 of 5322 0.930
Nucleus Shape Eccentricity 0.123 643 of 5322 1.000
Nucleus Shape Form Factor -8.787e-02 2671 of 5322 0.998
Cell Tubulin Mean -1.421e-01 4847 of 5322 0.997
Cell Tubulin Mean Frac 3 -1.431e-01 3472 of 5322 0.999
Cell Actin Mean 0.188 970 of 5322 0.997
Cell Shape Area 0.046 3341 of 5322 0.999
( Reset Zoom )
Brightness
Contrast
Opacity
Brightness
Contrast
Opacity
Brightness
Contrast
Opacity
Brightness
Contrast
Opacity
Brightness
Contrast
Opacity

( Reset Zoom )
Brightness
Contrast
Opacity
Brightness
Contrast
Opacity
Brightness
Contrast
Opacity
Brightness
Contrast
Opacity
Brightness
Contrast
Opacity

MIT Central Accessability