MRPS34

Due to sgRNA sequence design constraints two or more of the sgRNAs used to target this gene have multiple genomic target sites, potentially impacting the observed phenotype through increased DNA damage.
Gene symbol: MRPS34
Gene: 65993
Uniprot Function: Required for mitochondrial translation, plays a role in maintaining the stability of the small ribosomal subunit and the 12S rRNA that are required for mitoribosome formation.
Mitotic Index 0.0236
Interphase Cluster: #89 (25 genes)
Mitotic Cluster: #159 (17 genes)
sgRNA 1: AGGACTTGCGCGTGACCAGG (interphase cells: 1813, mitotic cells: 35)
sgRNA 2: CATGTACCATGACTGGCGGC (interphase cells: 1019, mitotic cells: 34)
sgRNA 3: GGAAGACTGAGAGCGAGGCG (interphase cells: 1792, mitotic cells: 43)
sgRNA 4: TGGACTACGAGACCTTGACG (interphase cells: 1250, mitotic cells: 30)

Interphase Cluster

Mitotic Cluster

Overview

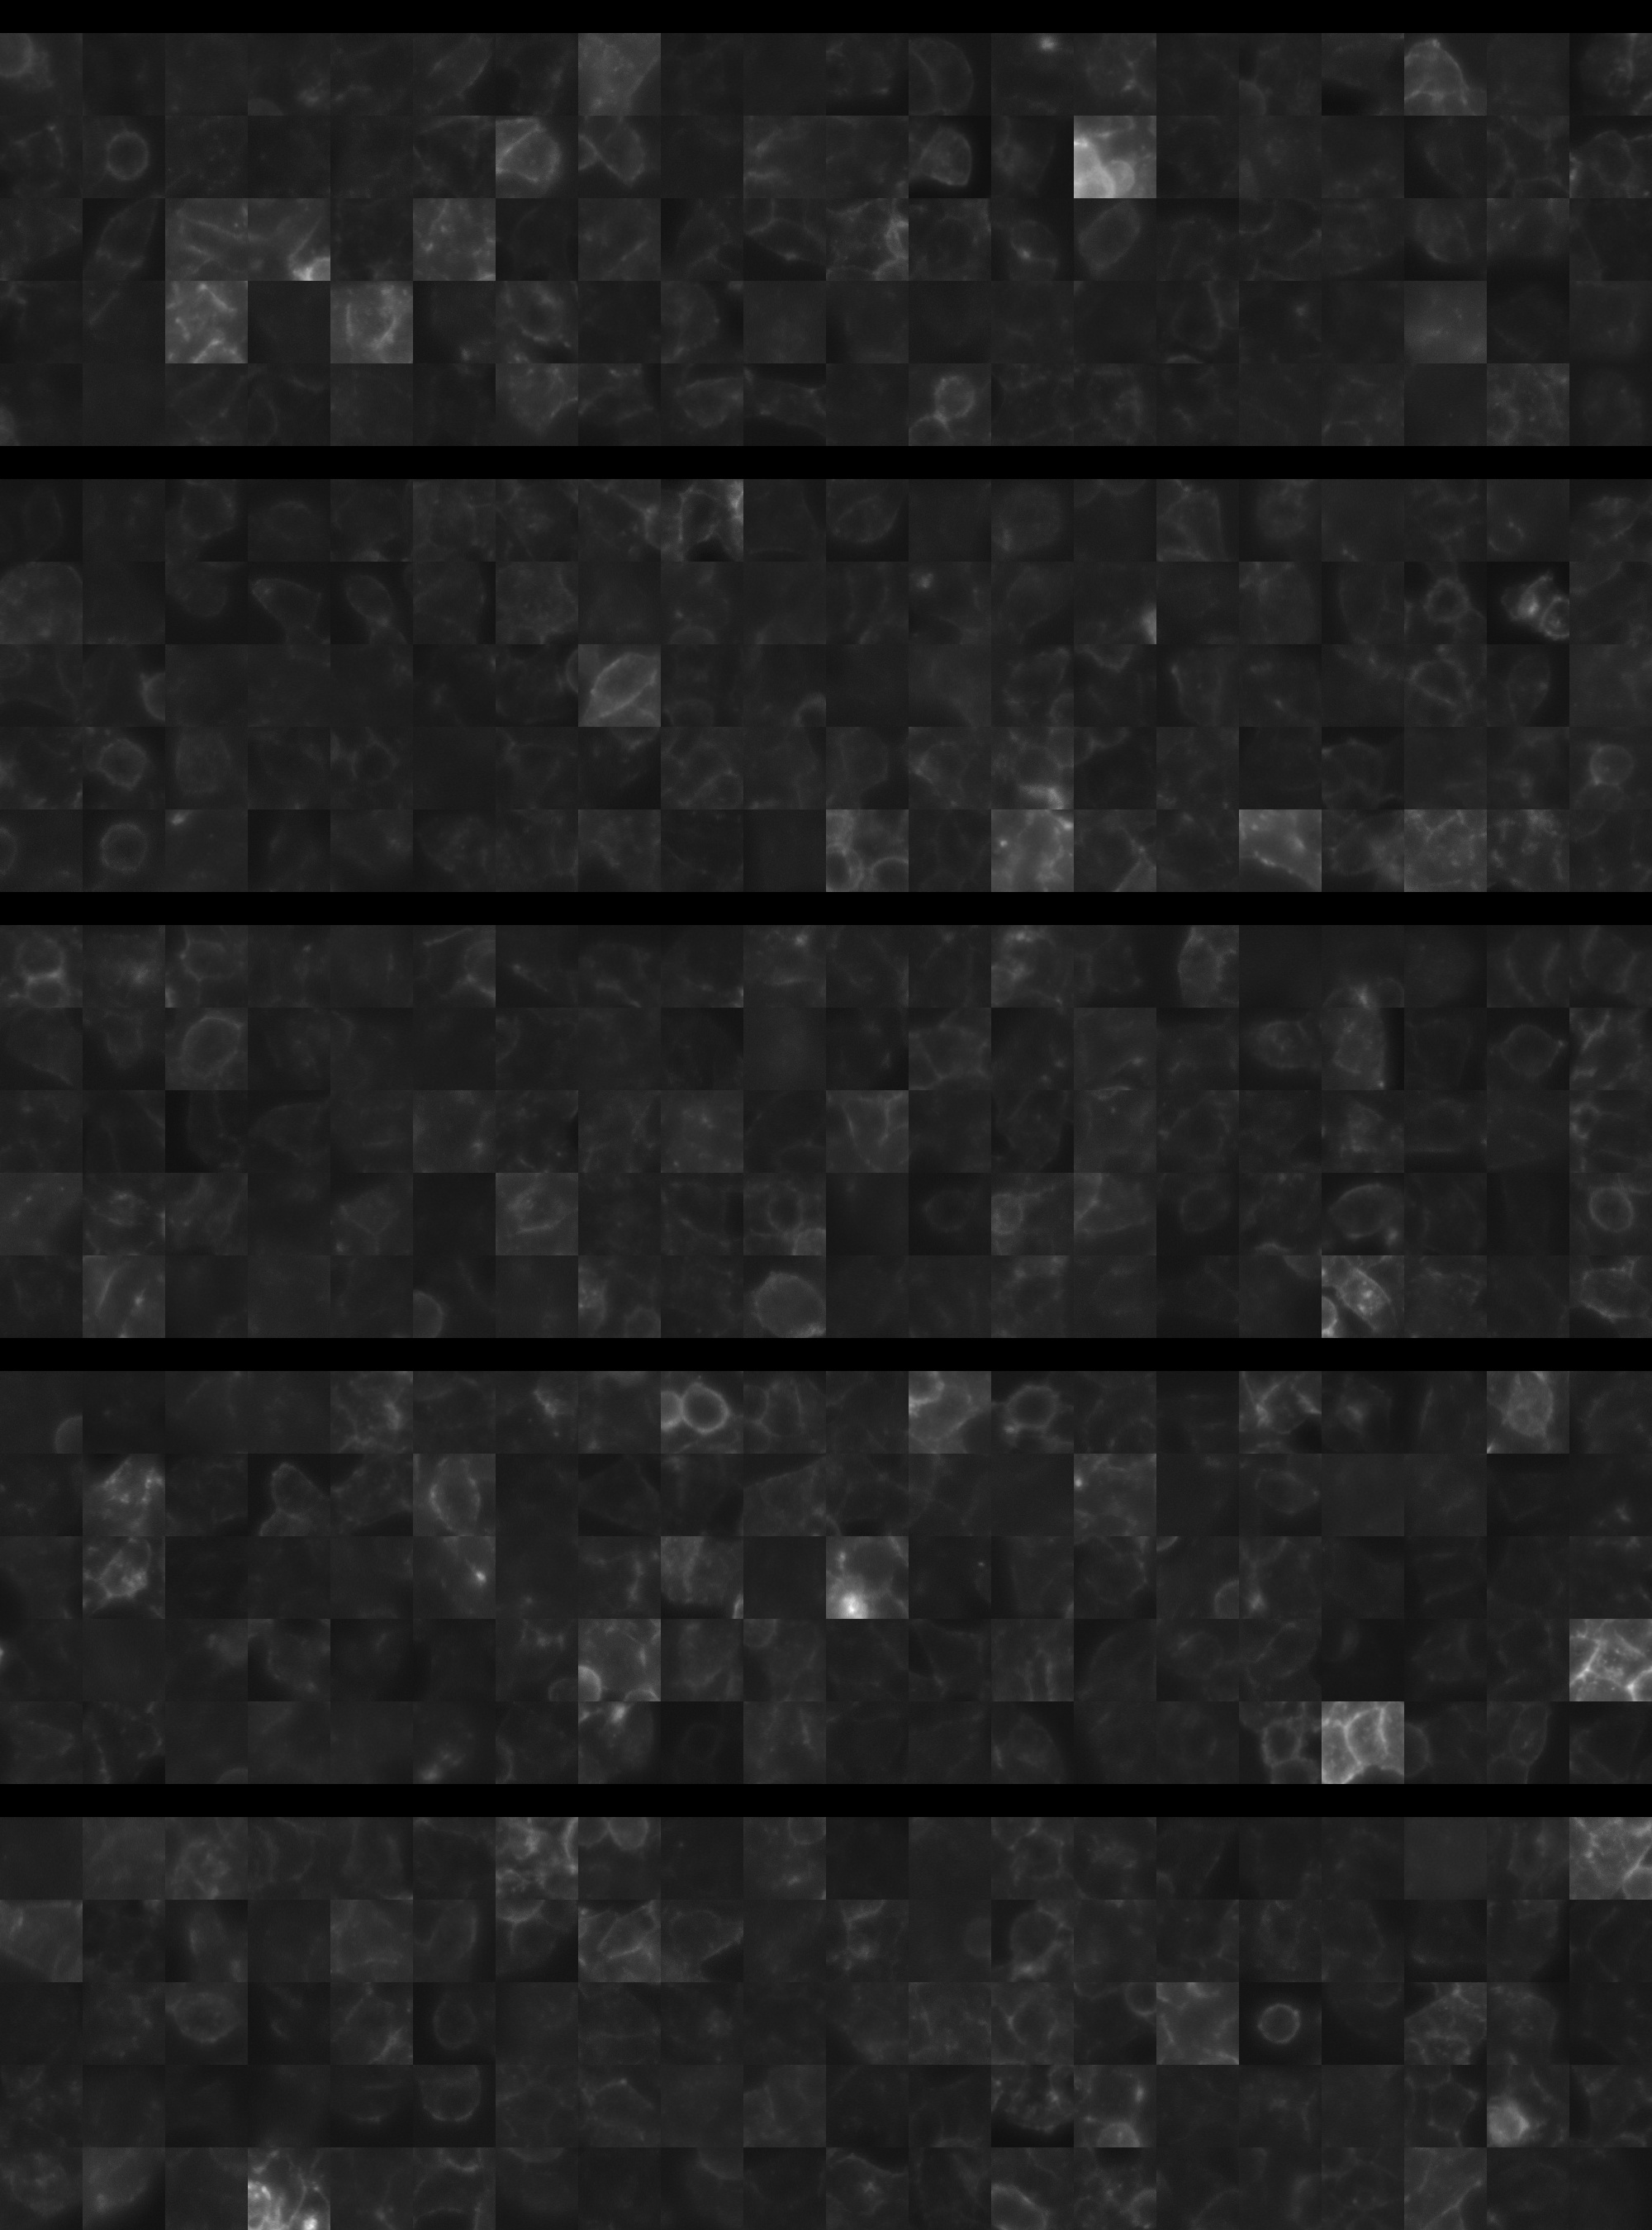
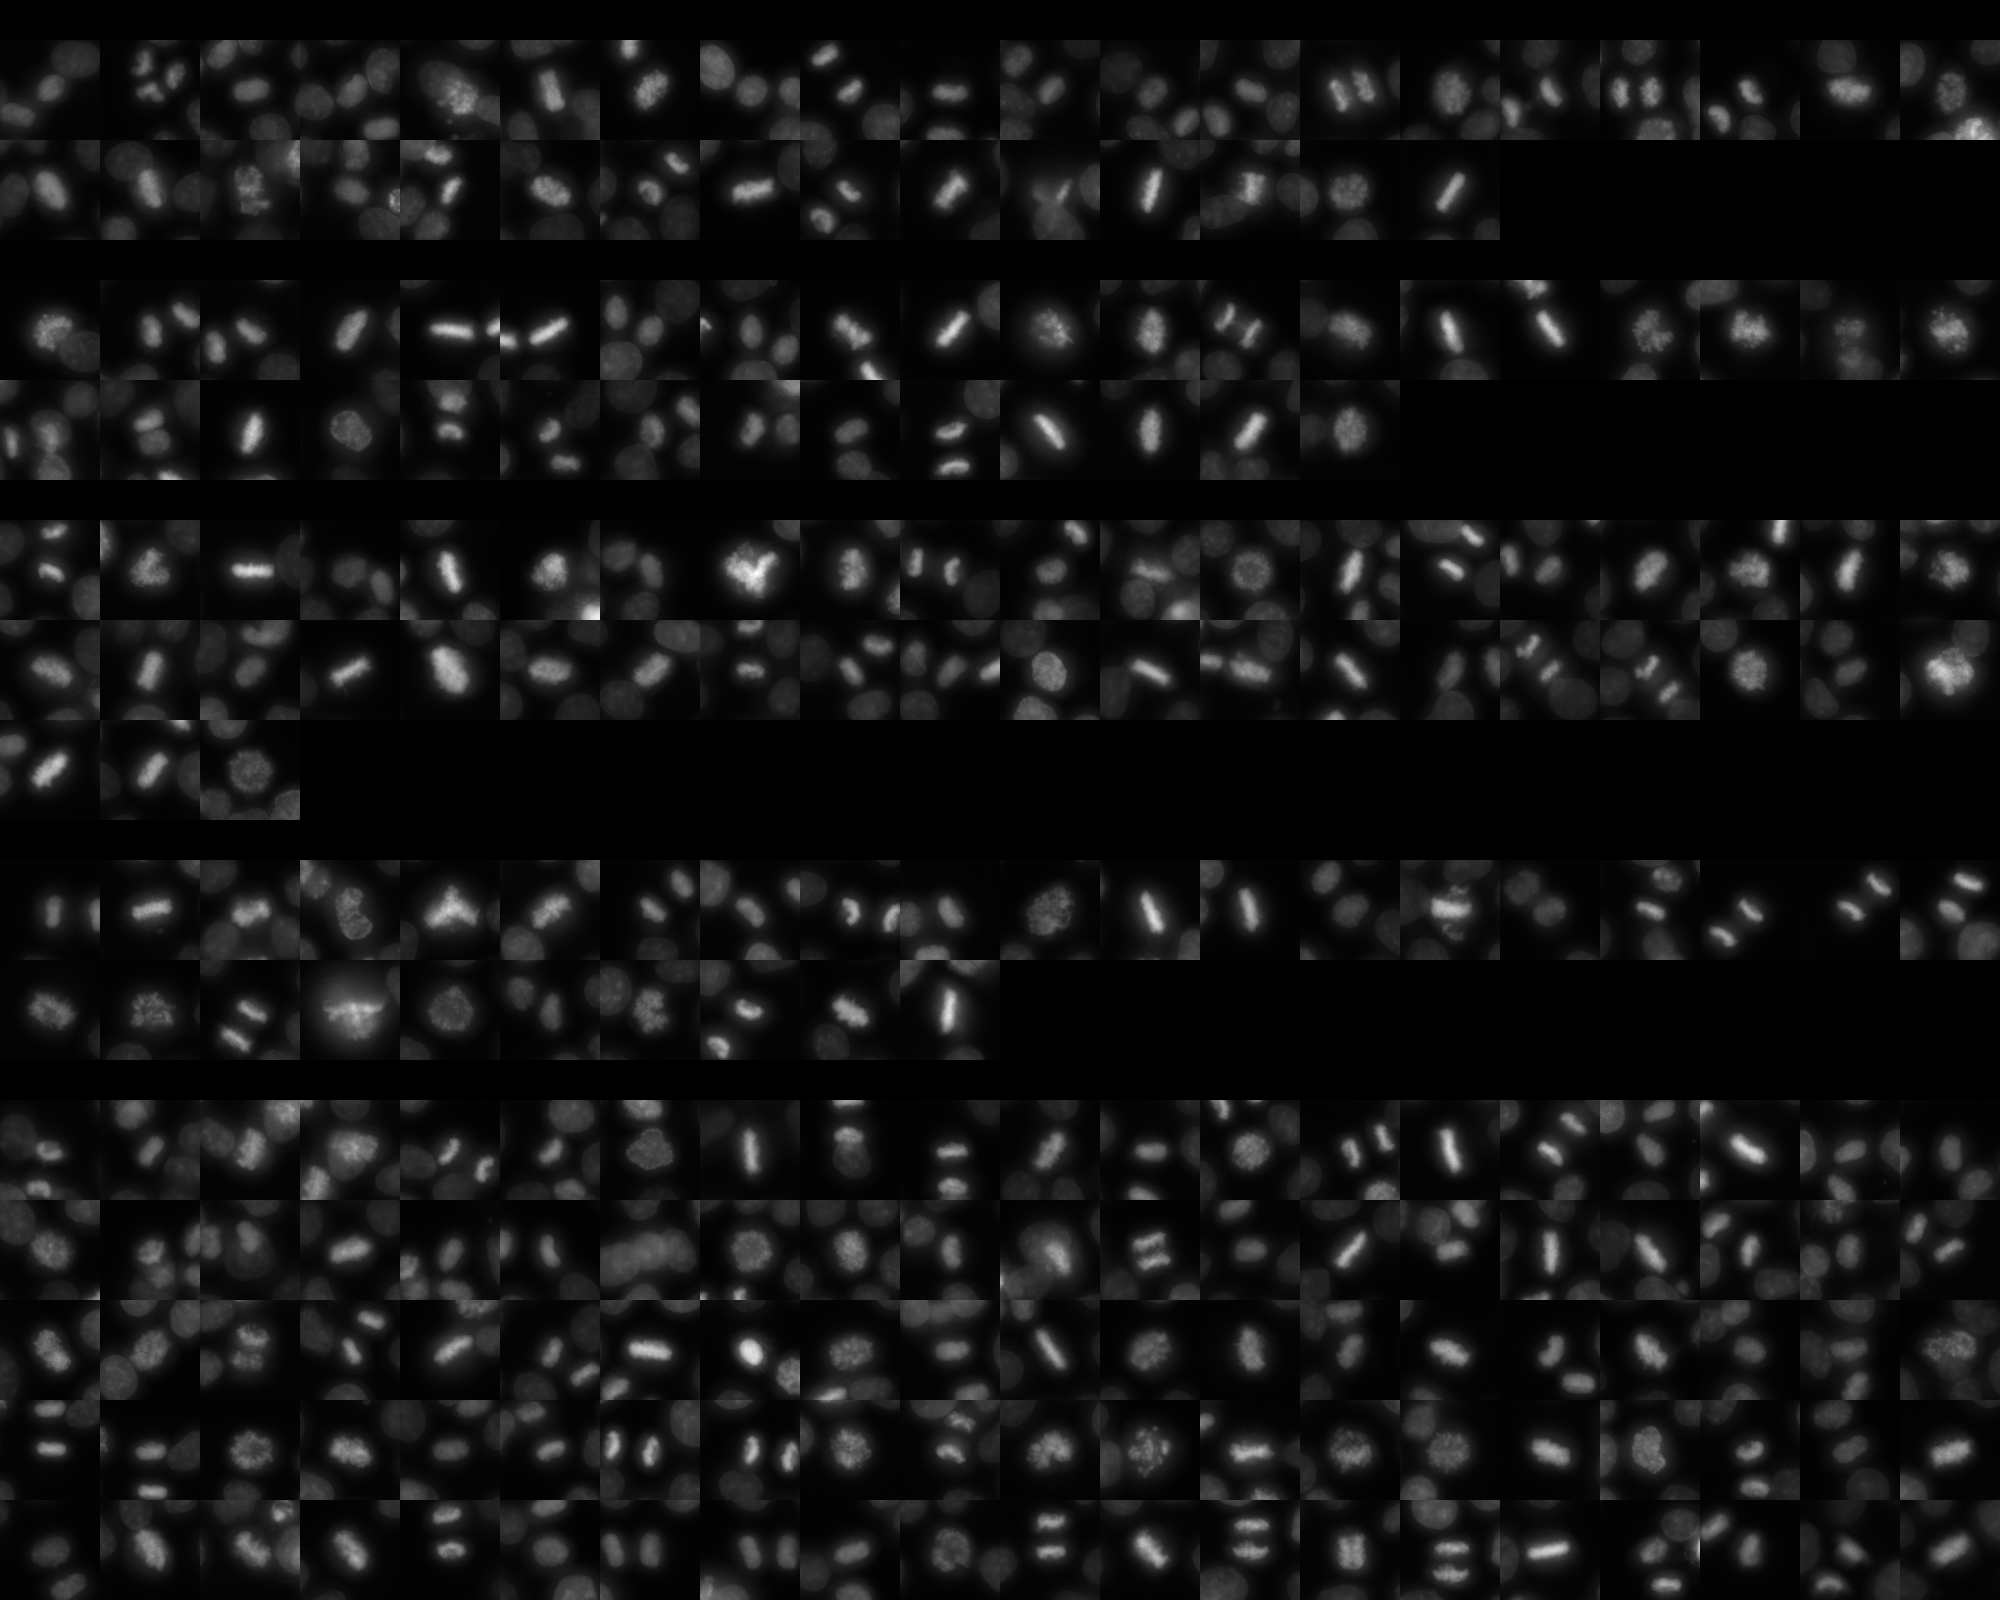
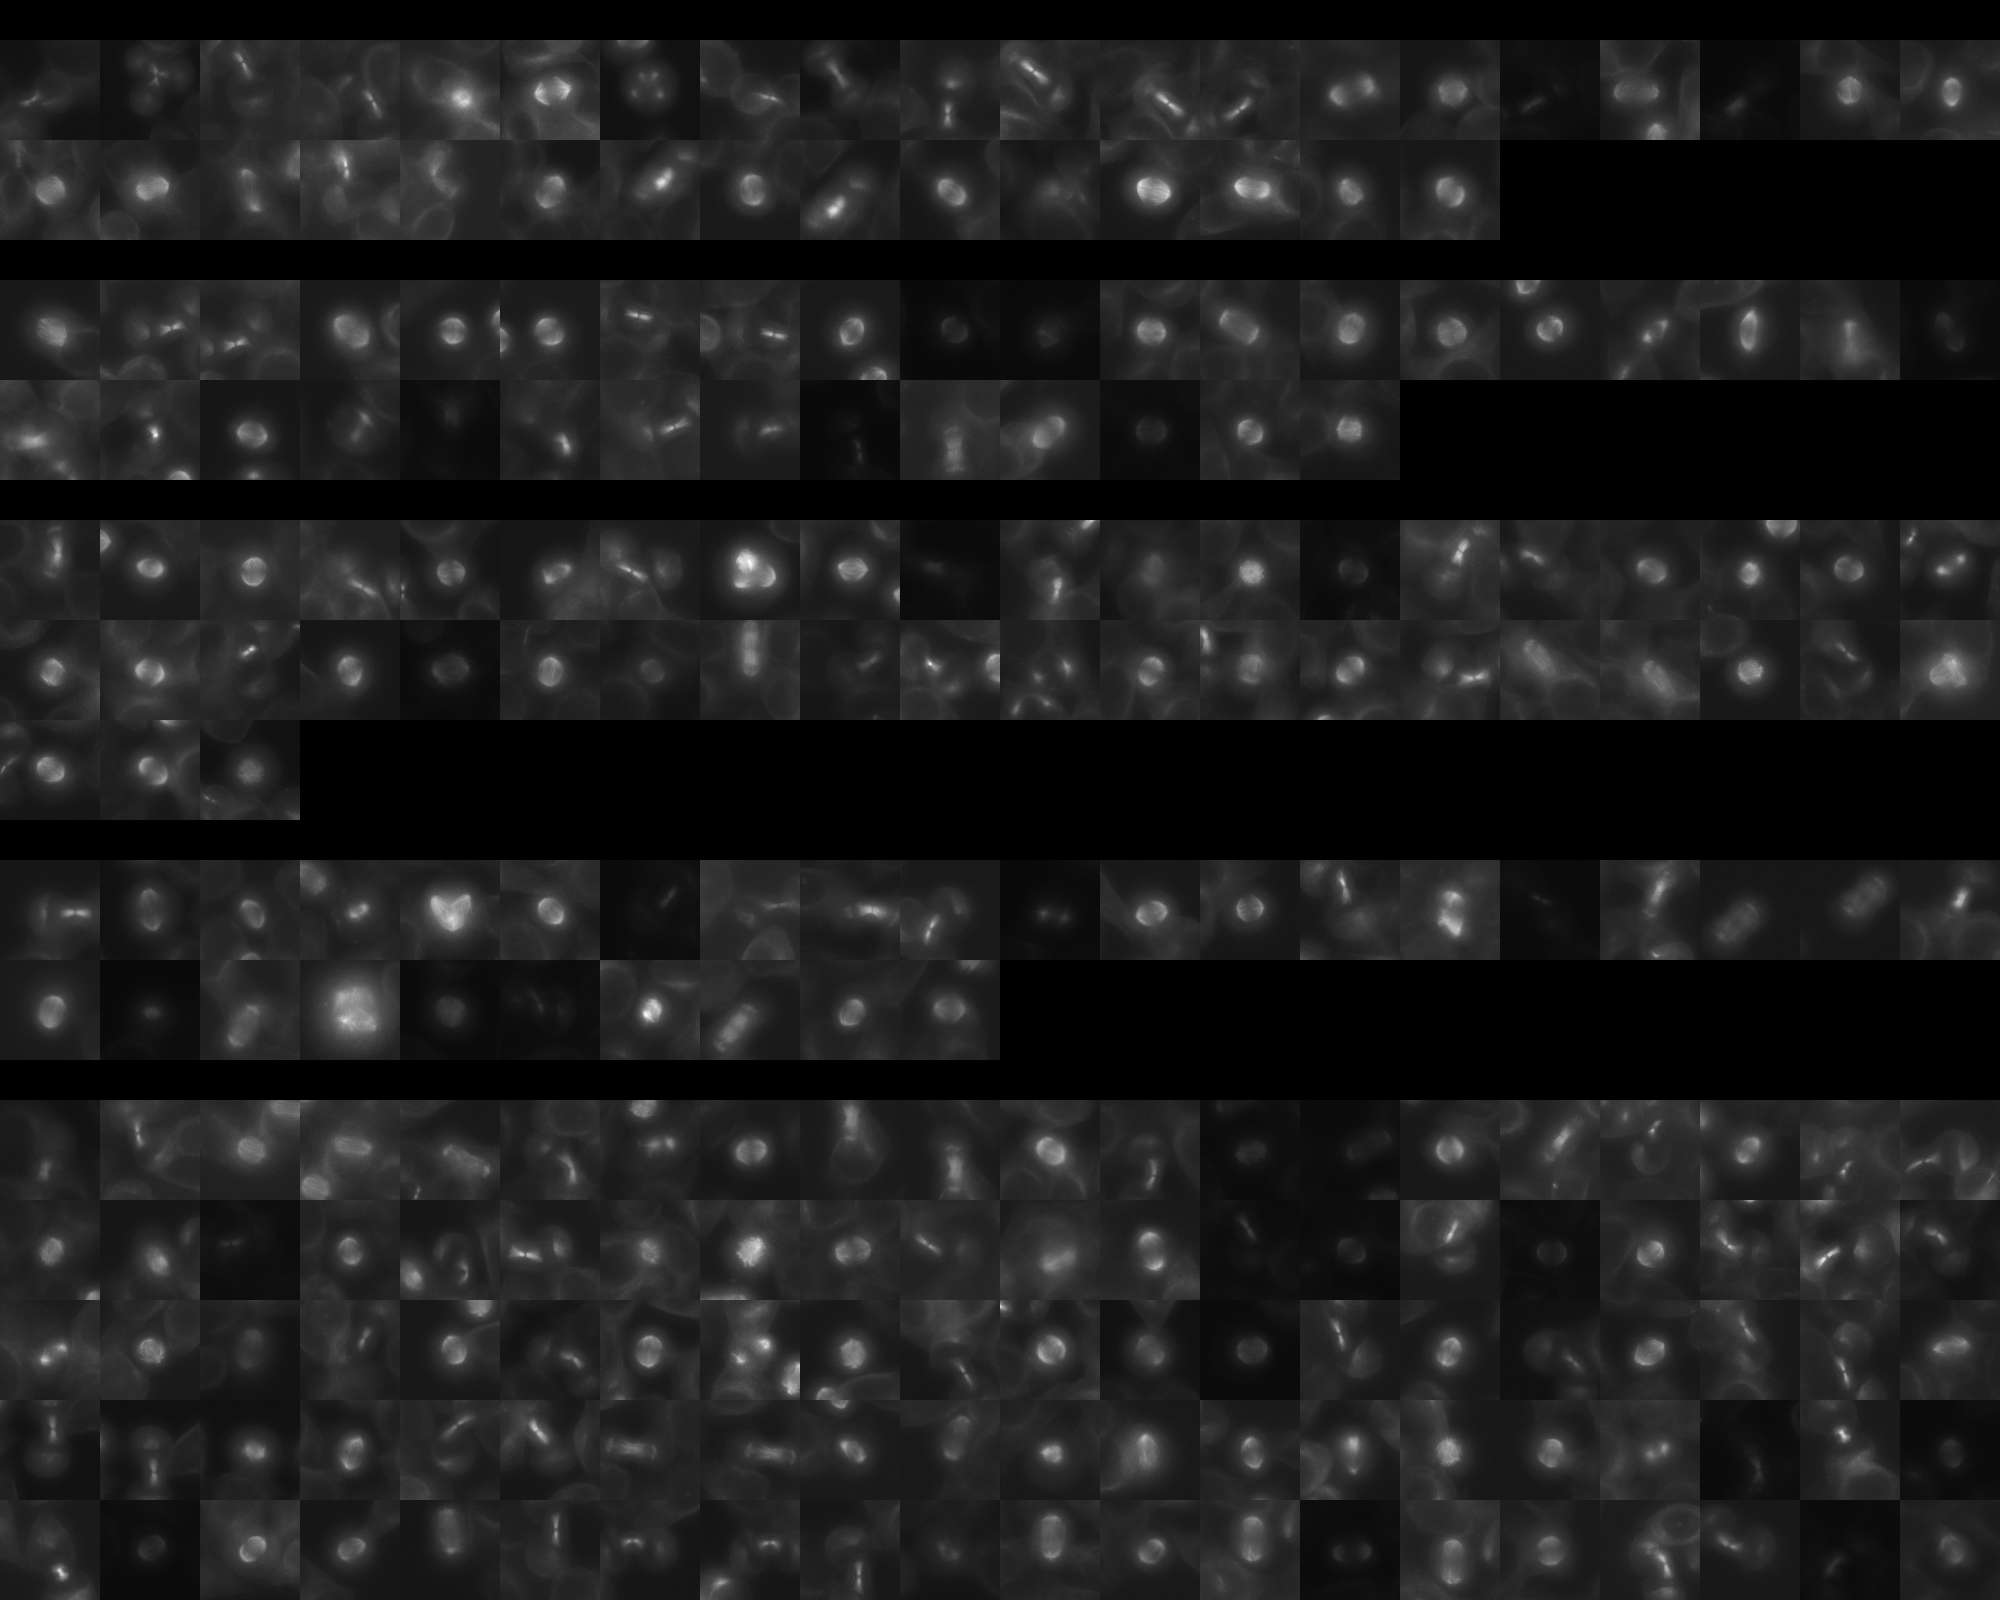
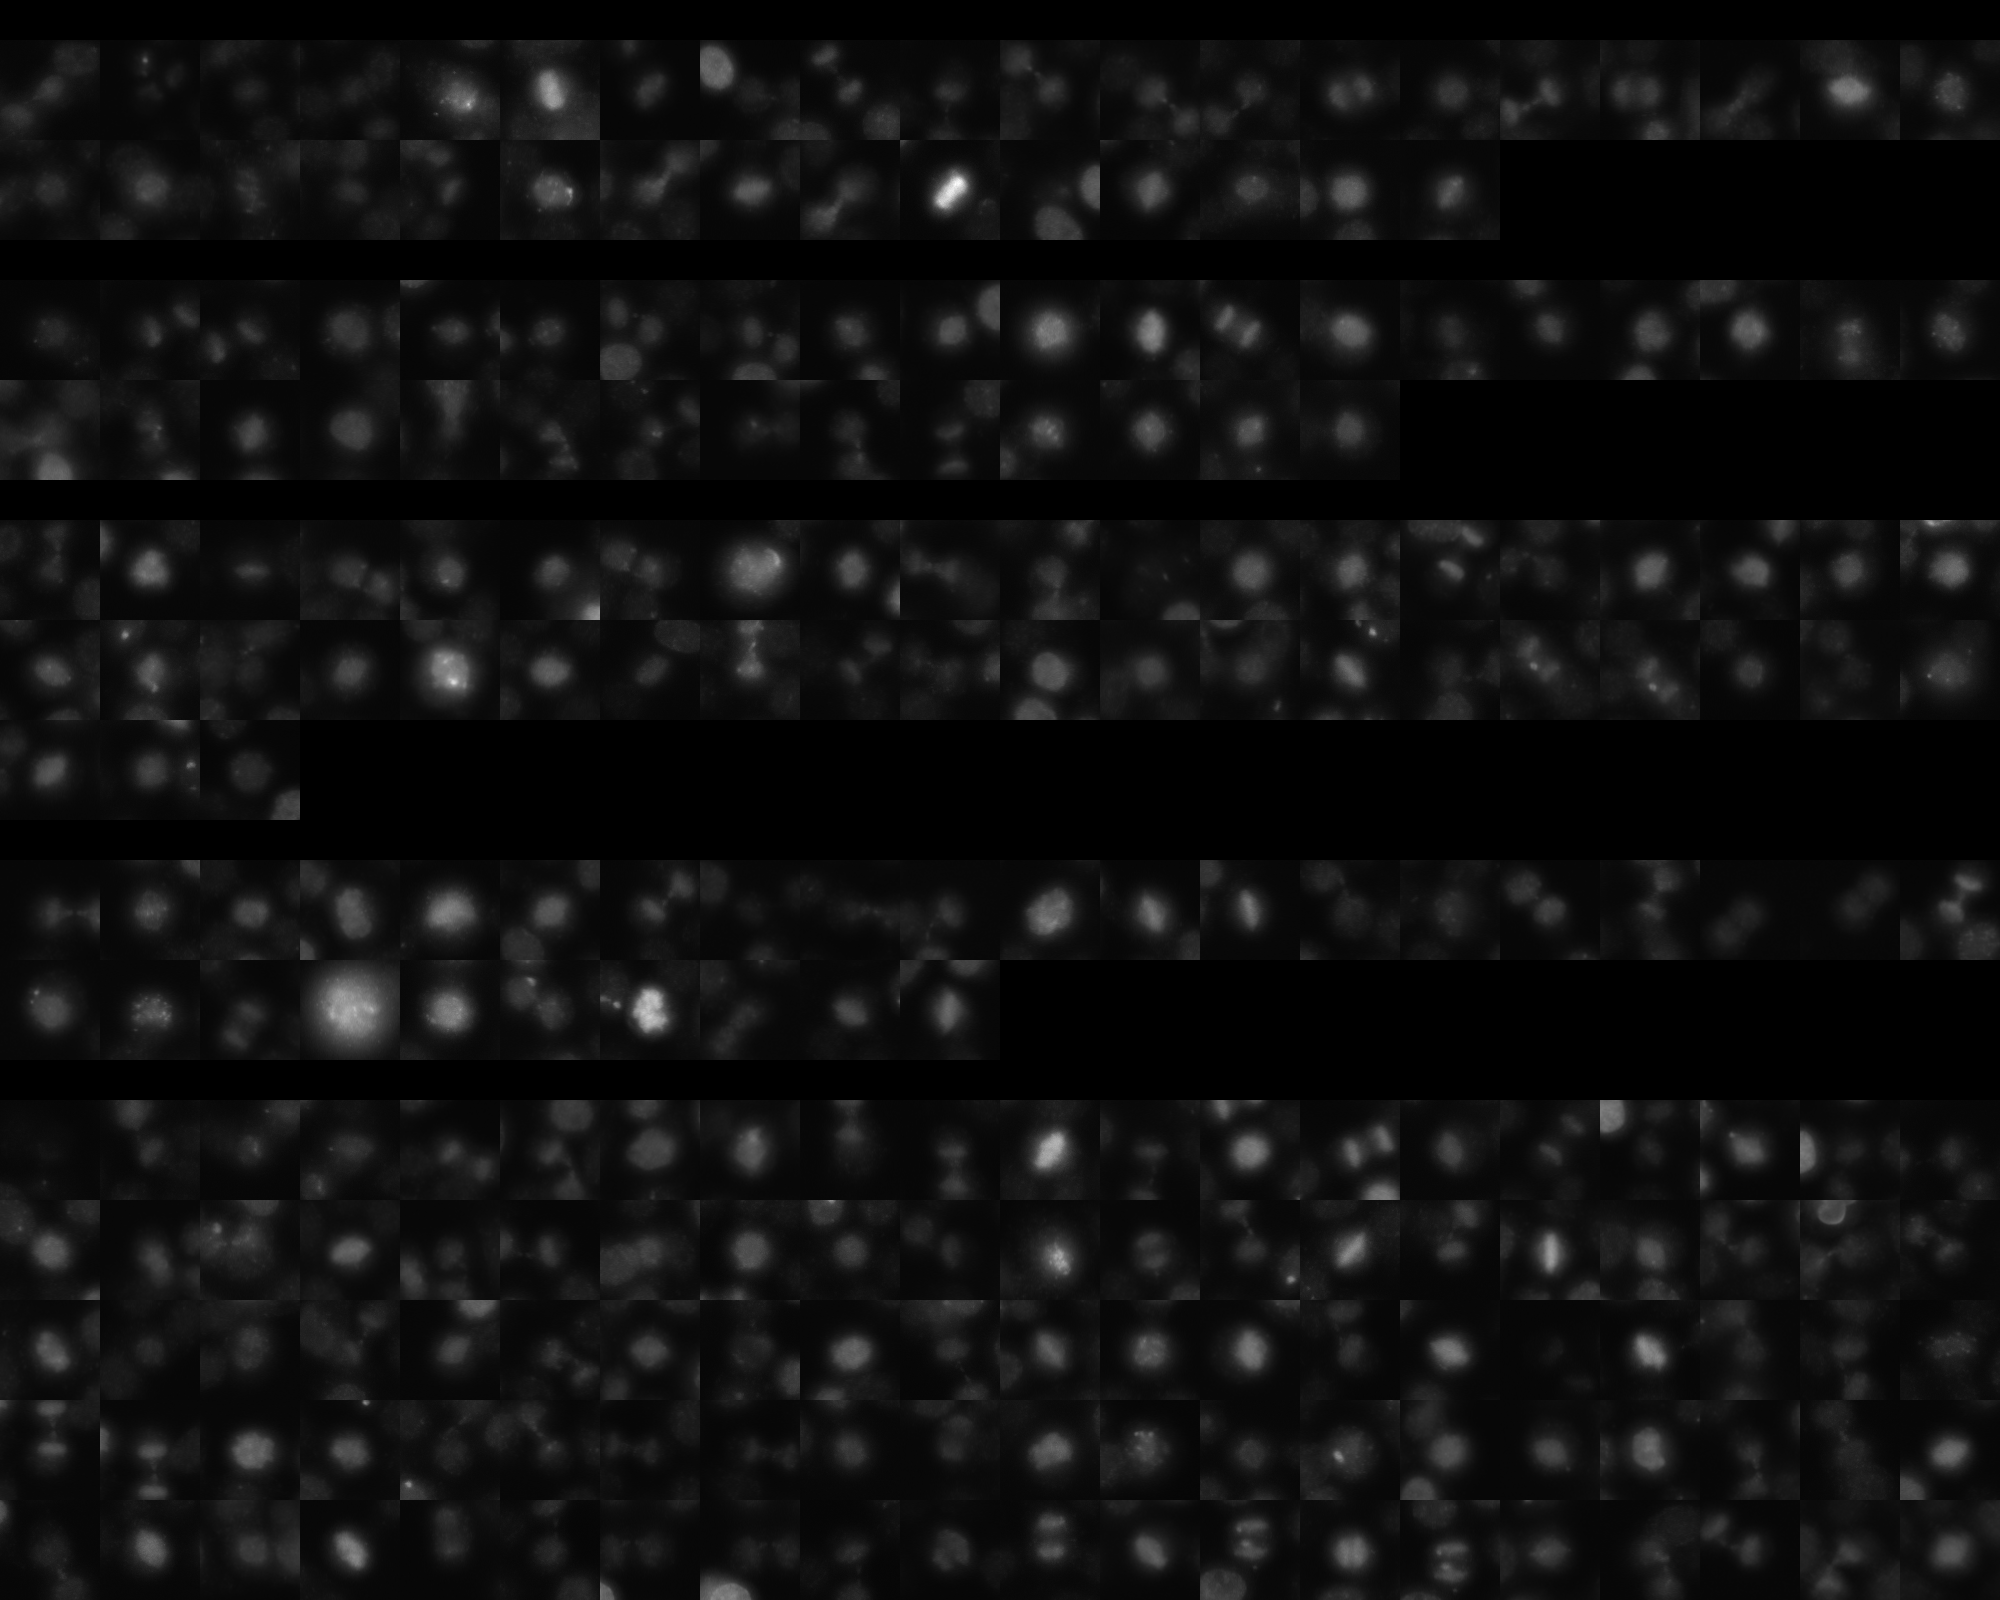
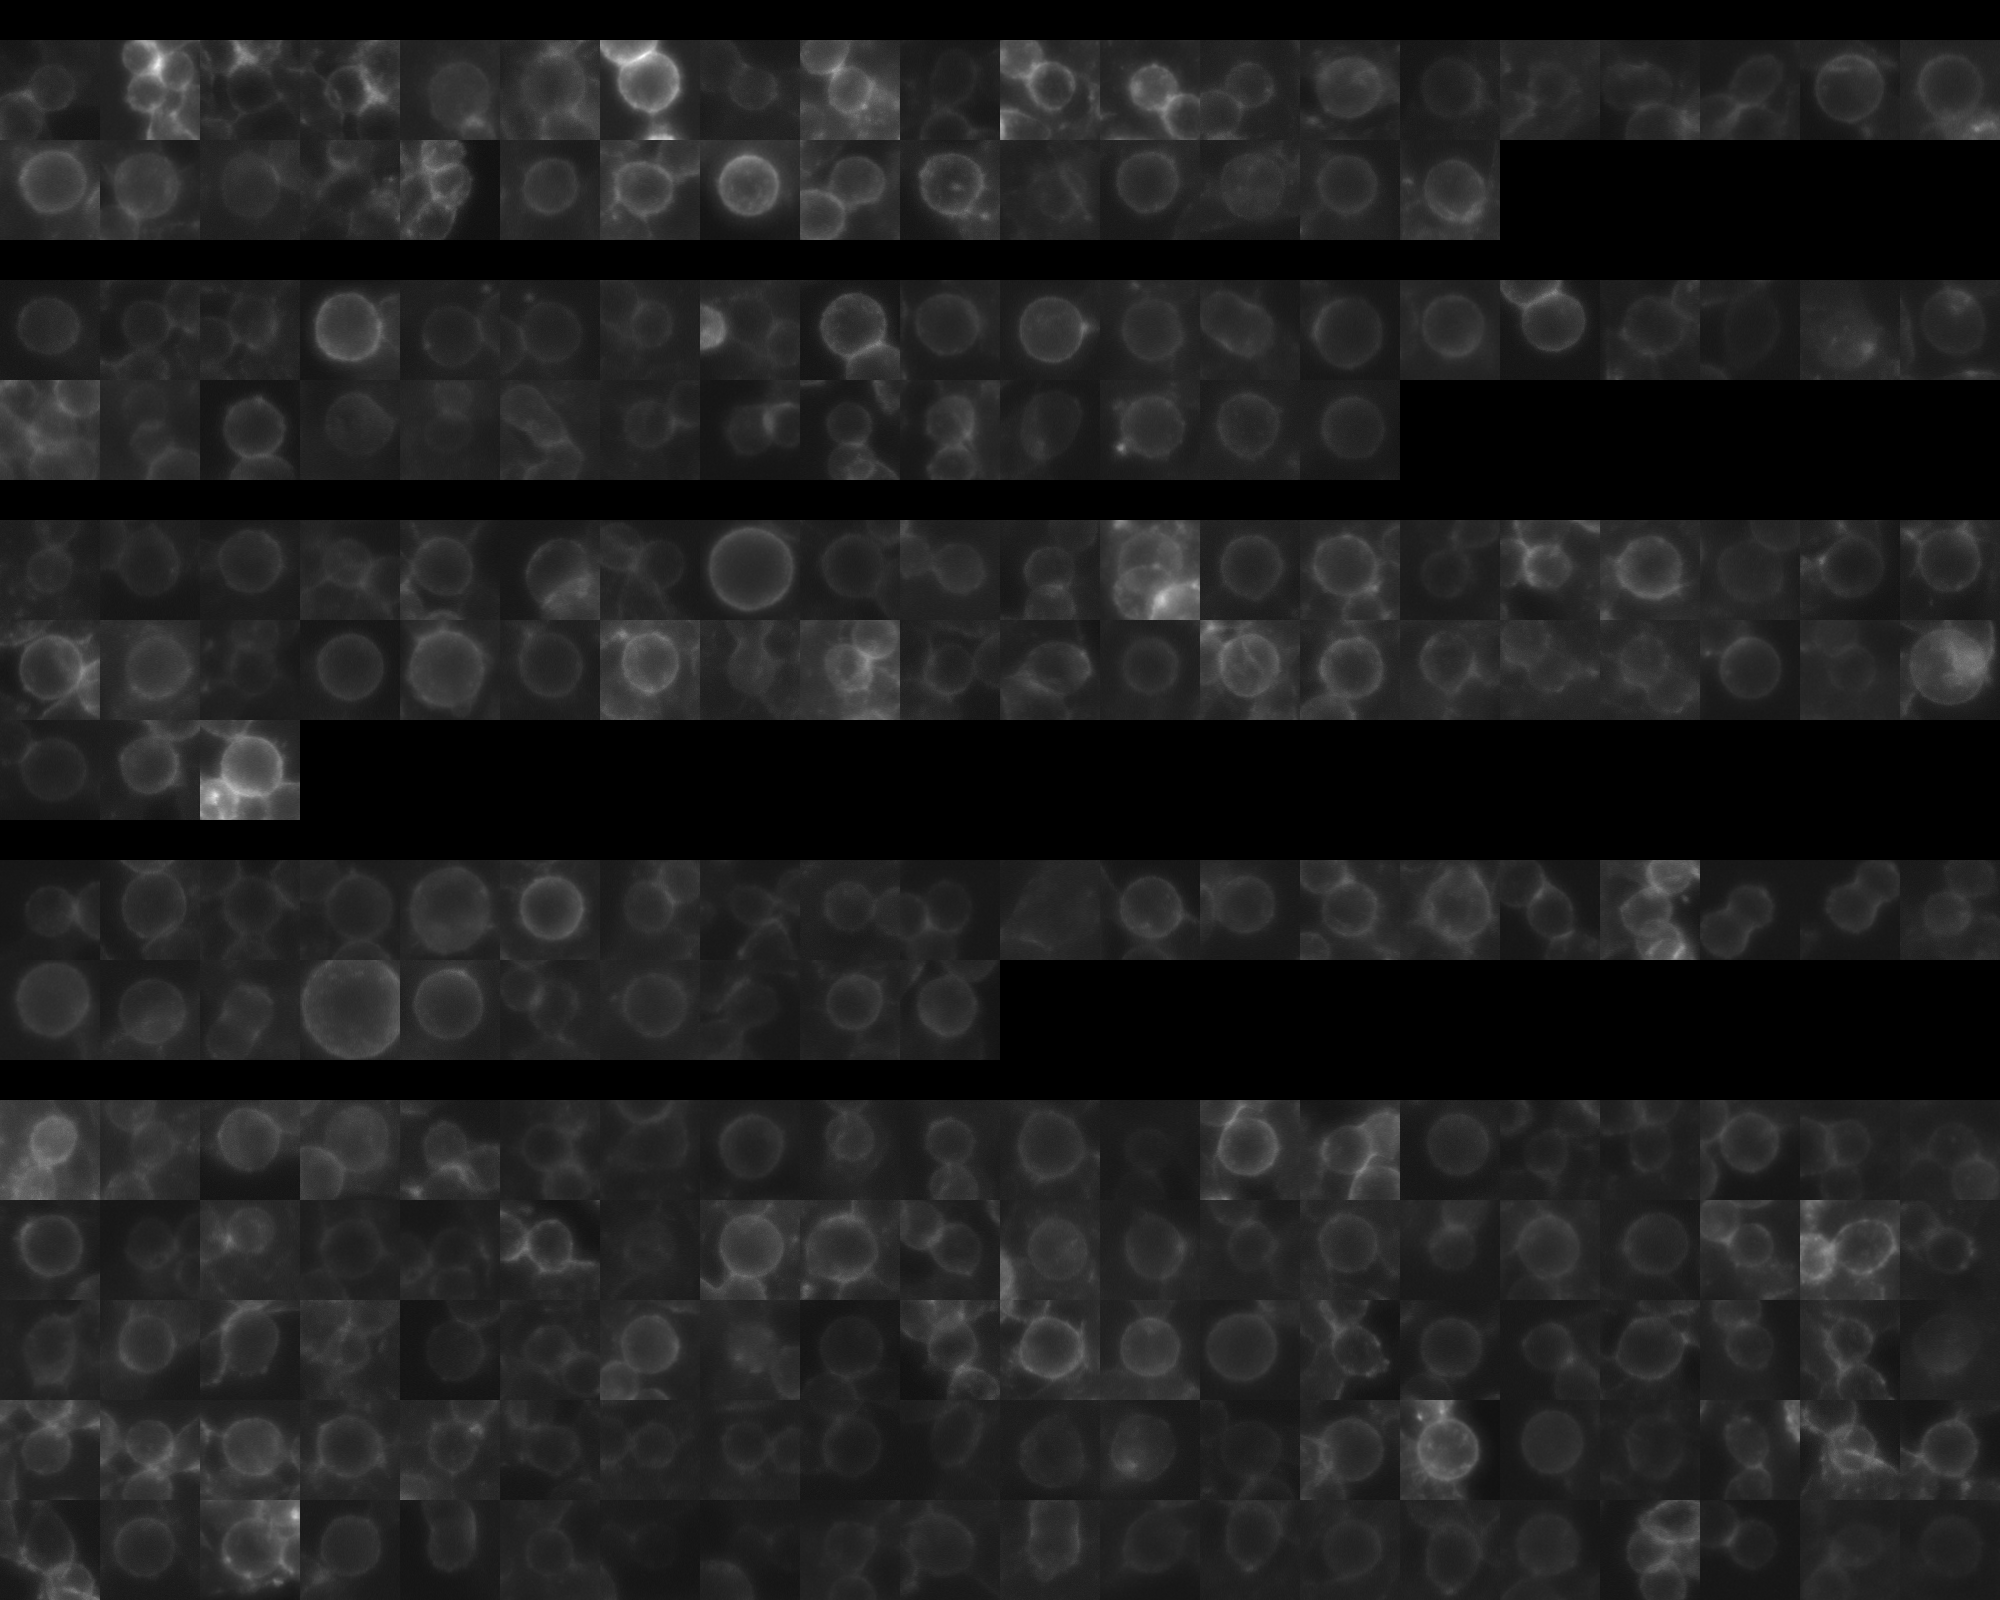
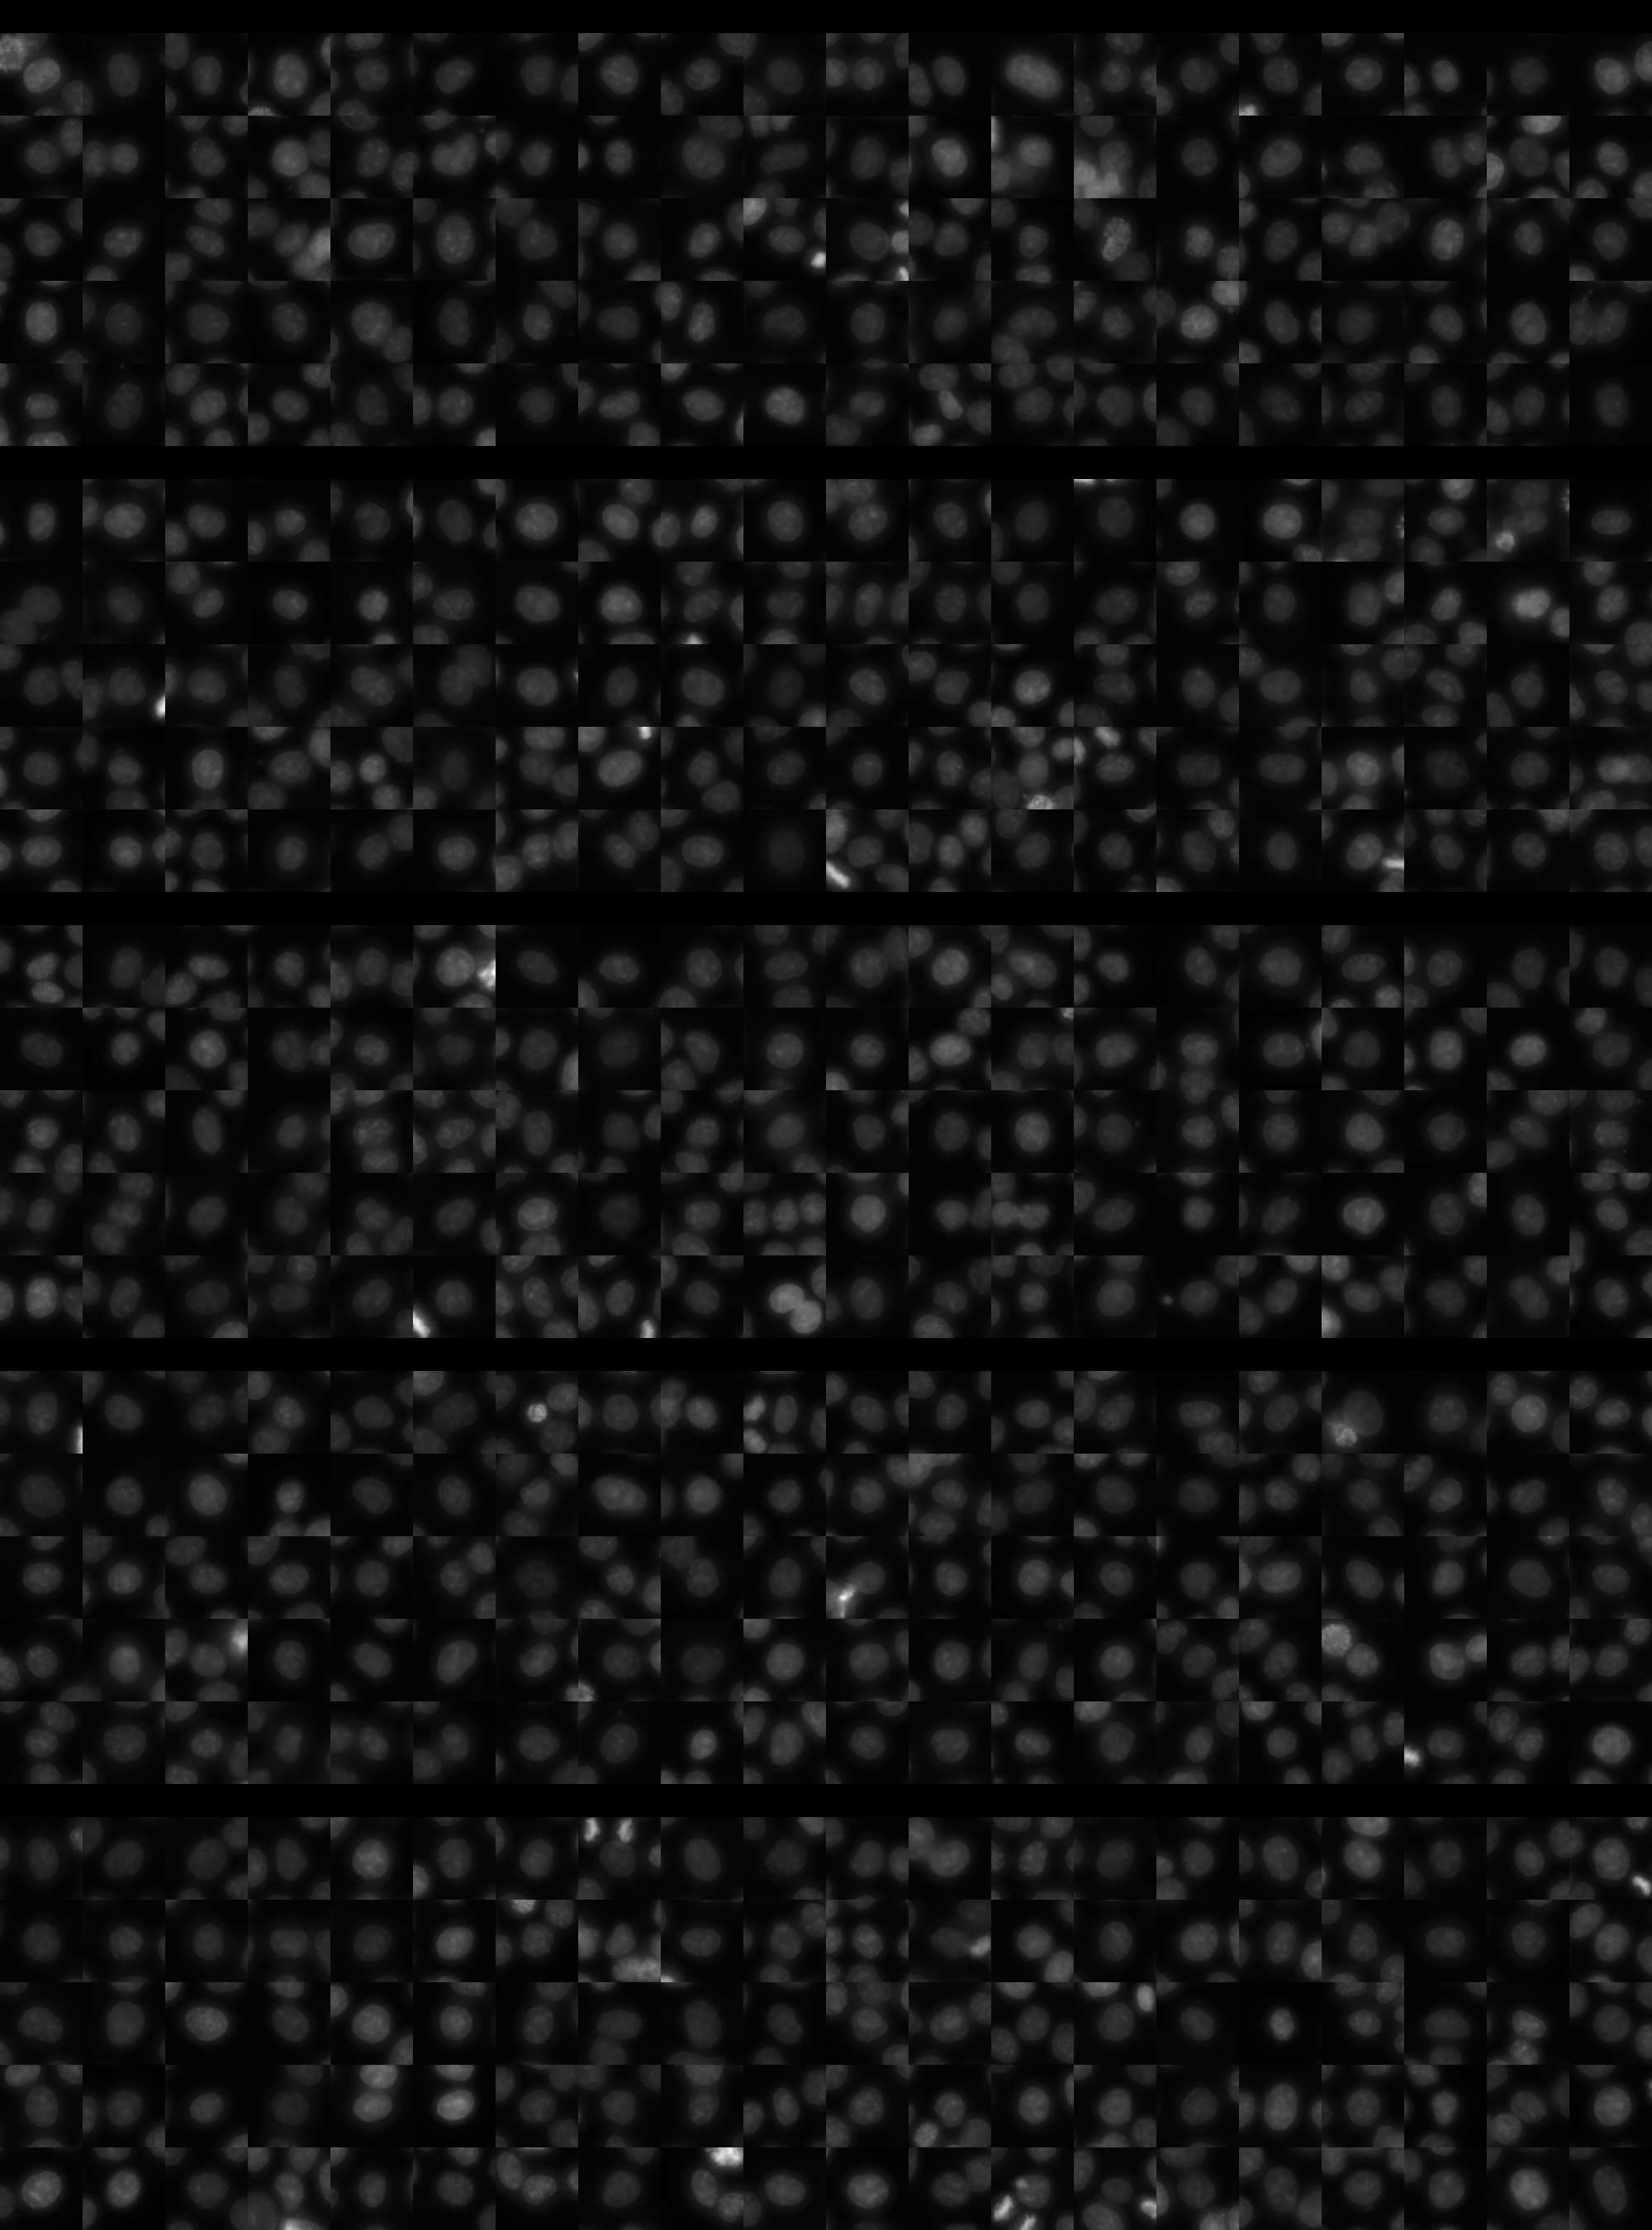
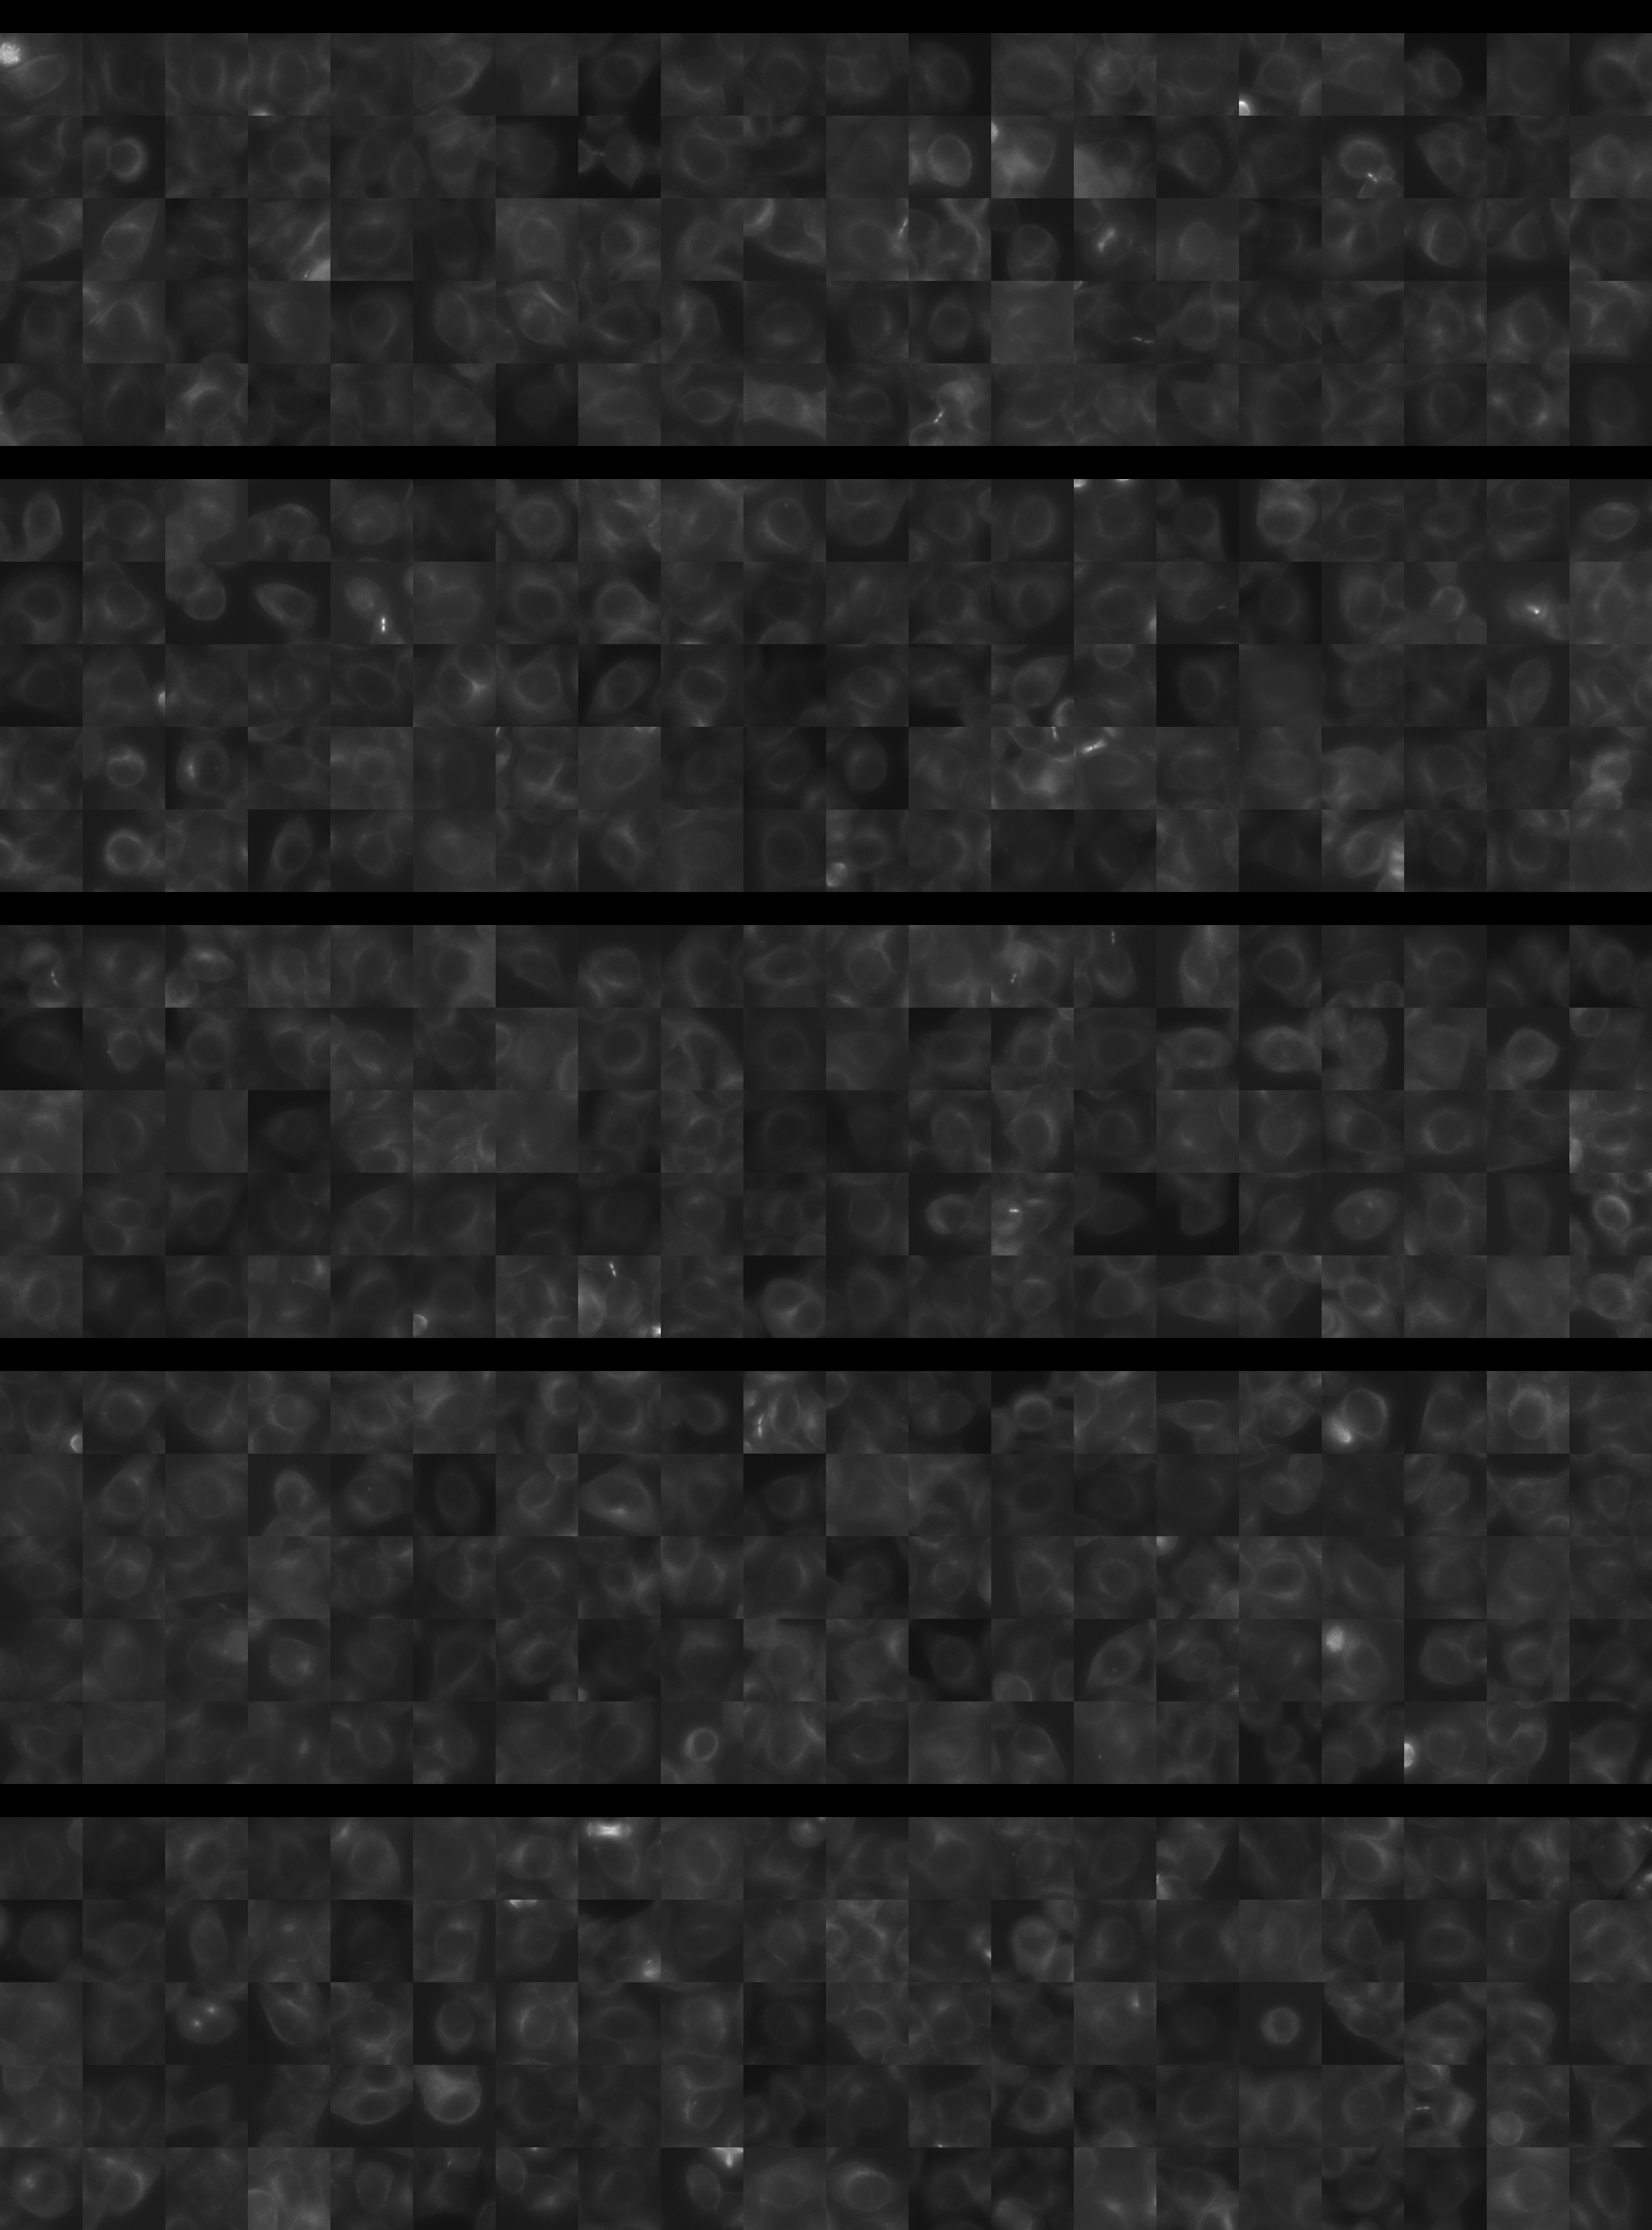
Each montage below shows randomly selected individual cell images for the same target gene separated by sgRNA, along with an example montage of cells expressing a non-targeting negative control sgRNA at the bottom. sgRNA labels in the montages correspond to the numbered sgRNA sequences in the gene info table above. The DNA (blue) and tubulin (green) channels are displayed by default, with gH2AX (grayscale) and actin (yellow) available using the check boxes. Channel brightness, contrast, and opacity are adjustable by clicking the arrow next to the channel name. When only one channel is selected, the display defaults to grayscale. Click the “Zoom” checkbox above the channel controls to enable image zooming (via scrolling) and panning (via click-and-drag).

The cell boxes displayed for this gene are square, 30.36 μm per side for the interphase montage and 30.36 μm per side for the mitotic montage.
Features

Interphase Score Rank FDR q-value
Nucleus DNA Integrated -3.106e-02 4430 of 5322 0.597
Nucleus DNA Mean -4.238e-02 3362 of 5322 0.351
Nucleus gH2AX Mean 0.037 3868 of 5322 0.332
Nucleus DNA - gH2AX Correlation -5.349e-02 2551 of 5322 0.060
Nucleus Shape Area 0.016 2741 of 5322 0.890
Nucleus Shape Eccentricity 0.039 1319 of 5322 0.328
Nucleus Shape Form Factor -5.888e-02 3097 of 5322 0.127
Nucleus Shape Solidity -7.692e-02 3719 of 5322 0.023
Cell DNA Mass Displacement -1.090e-02 4837 of 5322 0.833
Cell Tubulin Mean -7.267e-03 3074 of 5322 0.943
Cell Tubulin Mass Displacement -1.290e-02 3714 of 5322 0.871
Cell Actin Mean 0.027 2135 of 5322 0.620
Cell Tubulin - Actin Correlation -2.082e-02 4507 of 5322 0.684
Cell DNA - Tubulin Correlation 0.055 1794 of 5322 0.142
Cell Shape Area 0.012 2788 of 5322 0.973
Cell Shape Eccentricity 0.012 2737 of 5322 0.905
Mitotic Score Rank FDR q-value
Nucleus DNA Integrated -6.114e-02 4513 of 5322 0.969
Nucleus DNA Mean -3.979e-02 3574 of 5322 1.000
Nucleus DNA Mass Displacement -2.847e-02 3937 of 5322 0.999
Nucleus DNA Mean Frac 3 -1.322e-03 3151 of 5322 1.000
Nucleus gH2AX Mean 0.088 1756 of 5322 1.000
Nucleus gH2AX Mean Frac 0 -1.587e-01 4470 of 5322 1.000
Nucleus Tubulin Mean Frac 0 -8.053e-02 4520 of 5322 0.999
Nucleus Tubulin Mean Edge 0.186 929 of 5322 0.996
Nucleus Tubulin Std Edge 0.228 343 of 5322 0.999
Nucleus Shape Area -1.193e-01 4899 of 5322 0.974
Nucleus Shape Eccentricity 0.119 686 of 5322 1.000
Nucleus Shape Form Factor -3.191e-01 4876 of 5322 0.844
Cell Tubulin Mean 0.080 2352 of 5322 0.997
Cell Tubulin Mean Frac 3 0.178 328 of 5322 0.999
Cell Actin Mean 0.136 1432 of 5322 0.997
Cell Shape Area -2.241e-02 4160 of 5322 0.998
( Reset Zoom )
Brightness
Contrast
Opacity
Brightness
Contrast
Opacity
Brightness
Contrast
Opacity
Brightness
Contrast
Opacity
Brightness
Contrast
Opacity

( Reset Zoom )
Brightness
Contrast
Opacity
Brightness
Contrast
Opacity
Brightness
Contrast
Opacity
Brightness
Contrast
Opacity
Brightness
Contrast
Opacity

MIT Central Accessability