MED19

Gene symbol: MED19
Gene: 219541
Uniprot Function: Component of the Mediator complex, a coactivator involved in the regulated transcription of nearly all RNA polymerase II-dependent genes. Mediator functions as a bridge to convey information from gene-specific regulatory proteins to the basal RNA polymerase II transcription machinery. Mediator is recruited to promoters by direct interactions with regulatory proteins and serves as a scaffold for the assembly of a functional preinitiation complex with RNA polymerase II and the general transcription factors.
Mitotic Index 0.0203
Interphase Cluster: #60 (29 genes)
Mitotic Cluster: #116 (23 genes)
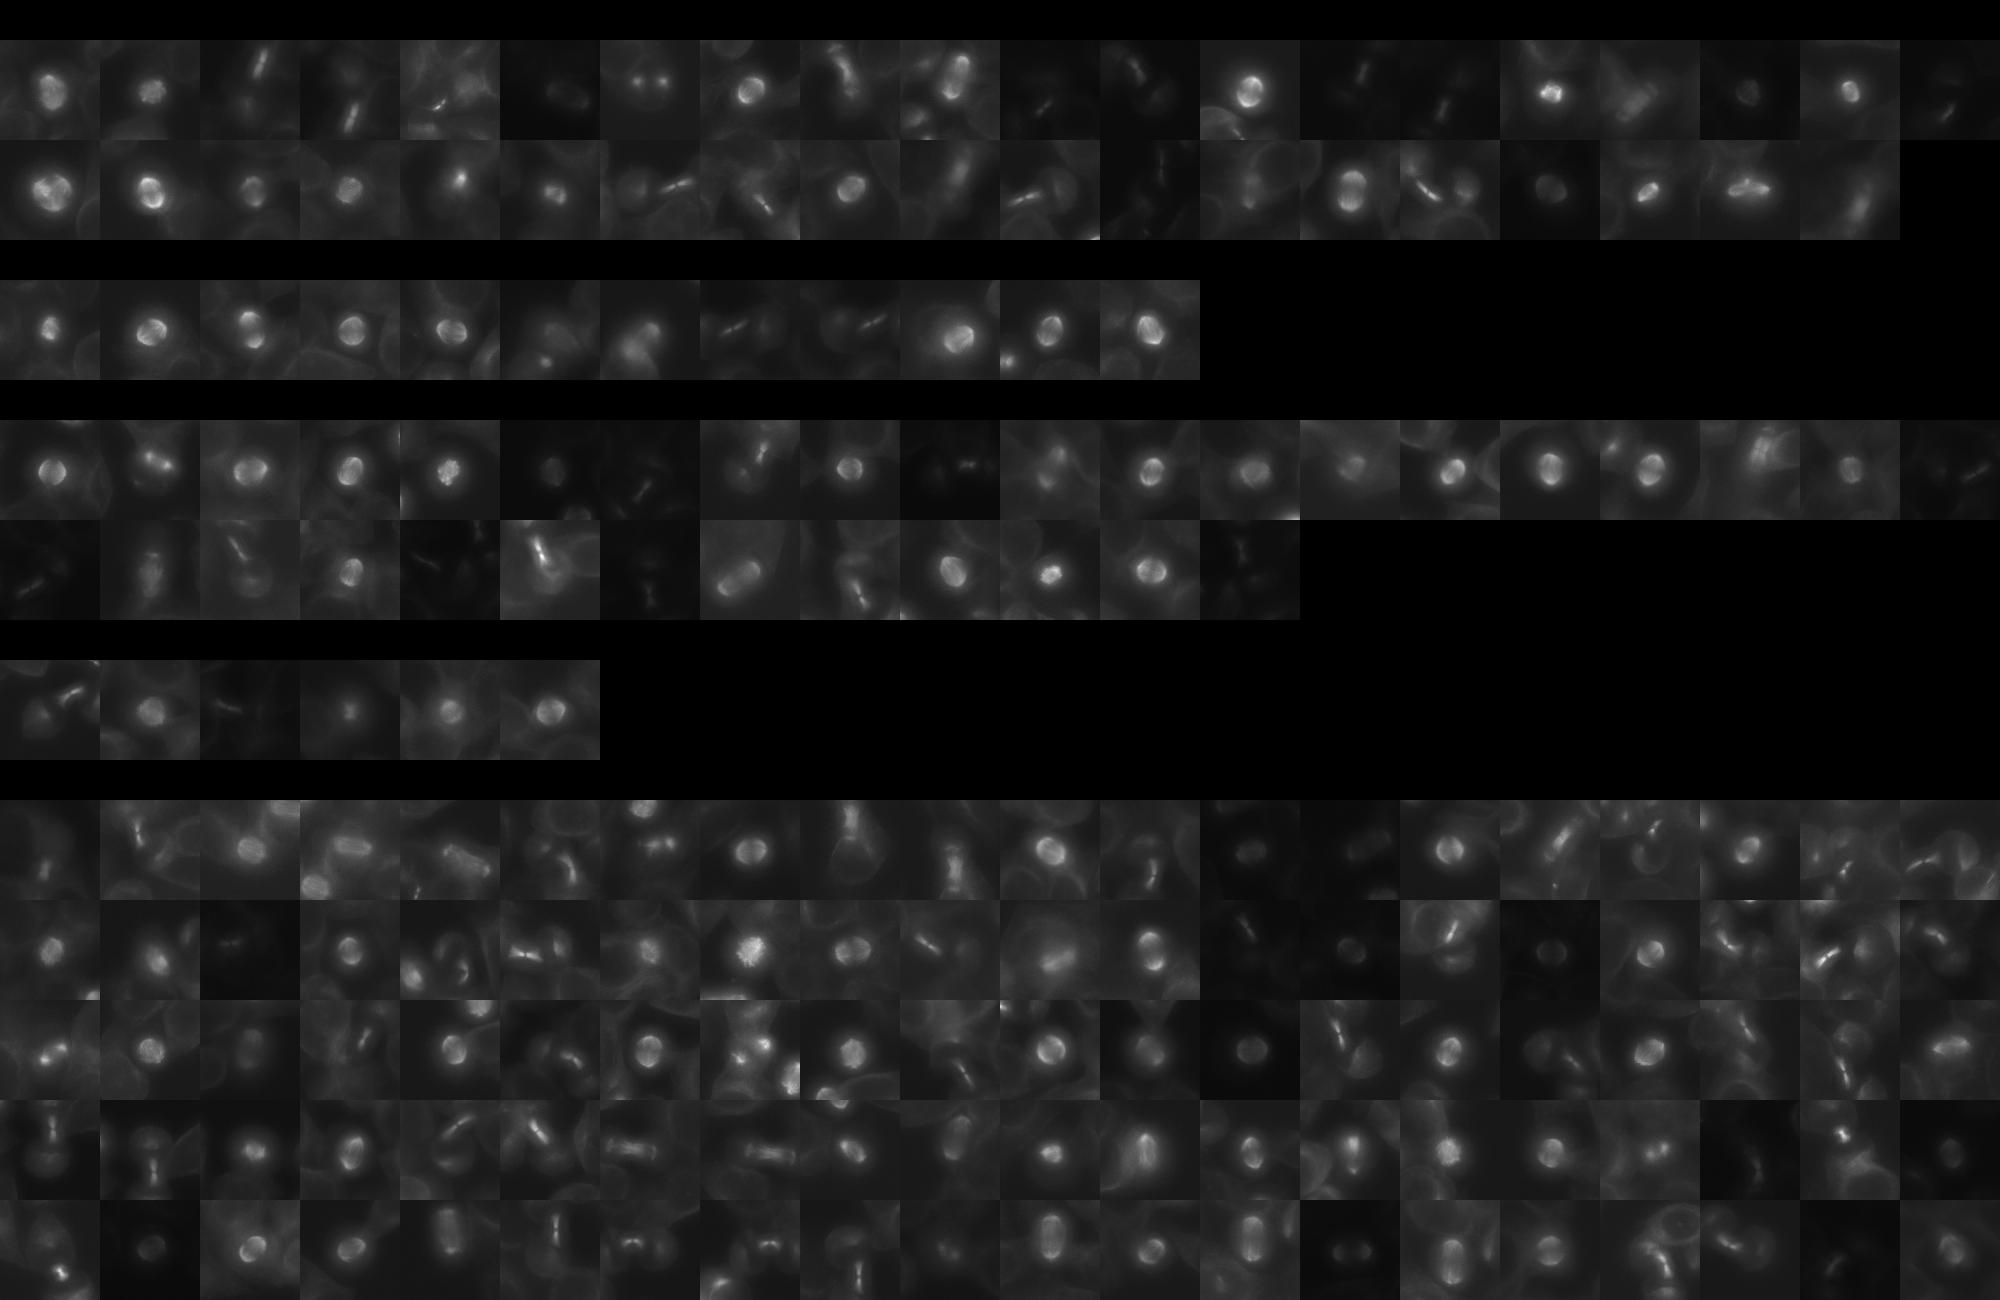
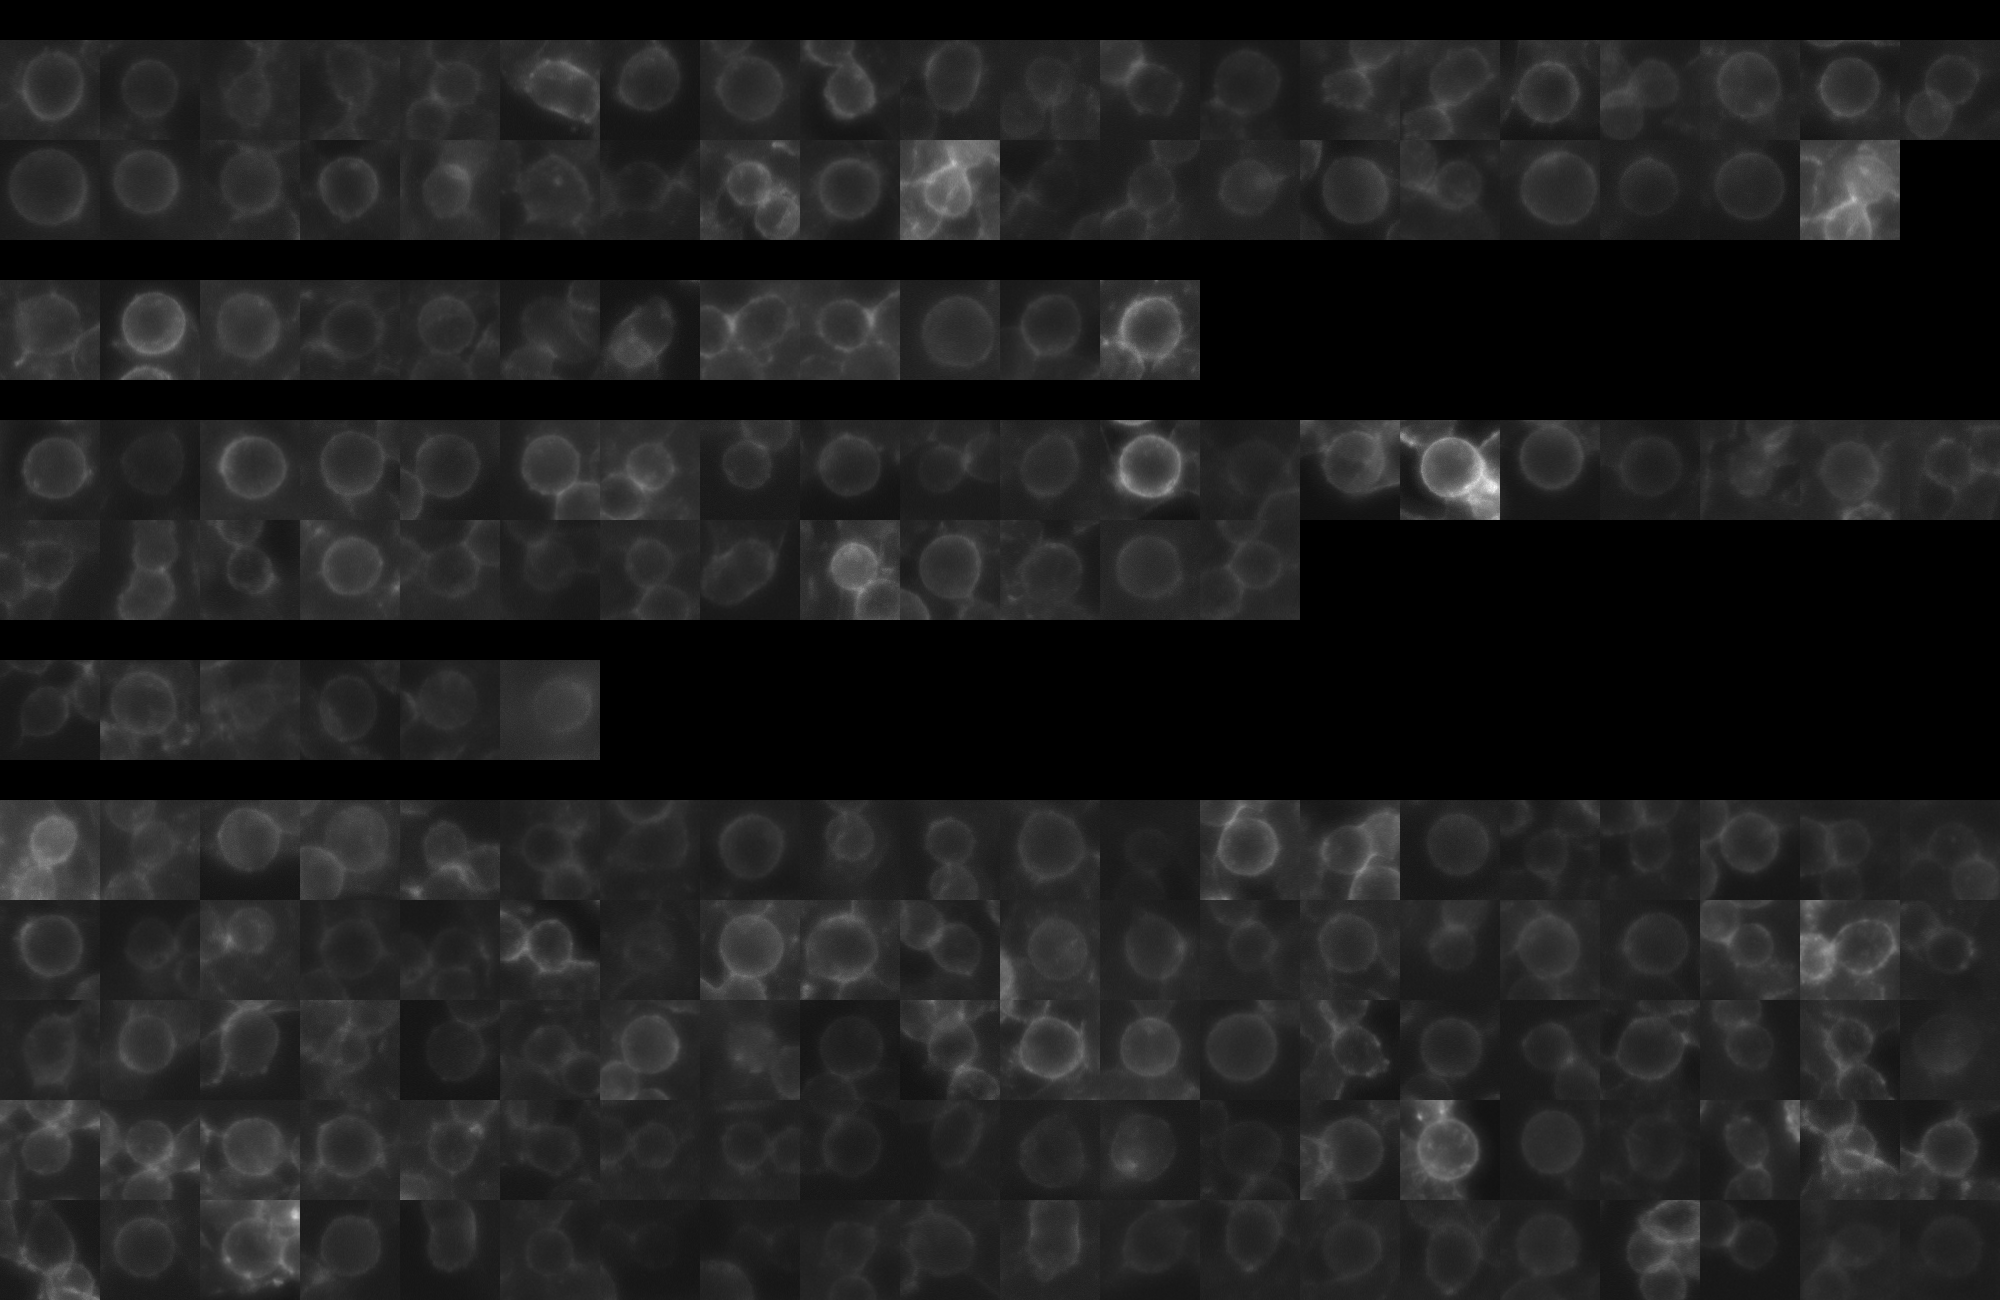
sgRNA 1: CACCTGGCAGTTCCCTCATG (interphase cells: 1743, mitotic cells: 39)
sgRNA 2: CCTGACTTGTCCGCGCCAGG (interphase cells: 736, mitotic cells: 12)
sgRNA 3: GCAGATCAATCATCCCTGGC (interphase cells: 1452, mitotic cells: 33)
sgRNA 4: TCCTGGTCCGAAGCCGAGTG (interphase cells: 422, mitotic cells: 6)

Interphase Cluster

Mitotic Cluster

Overview

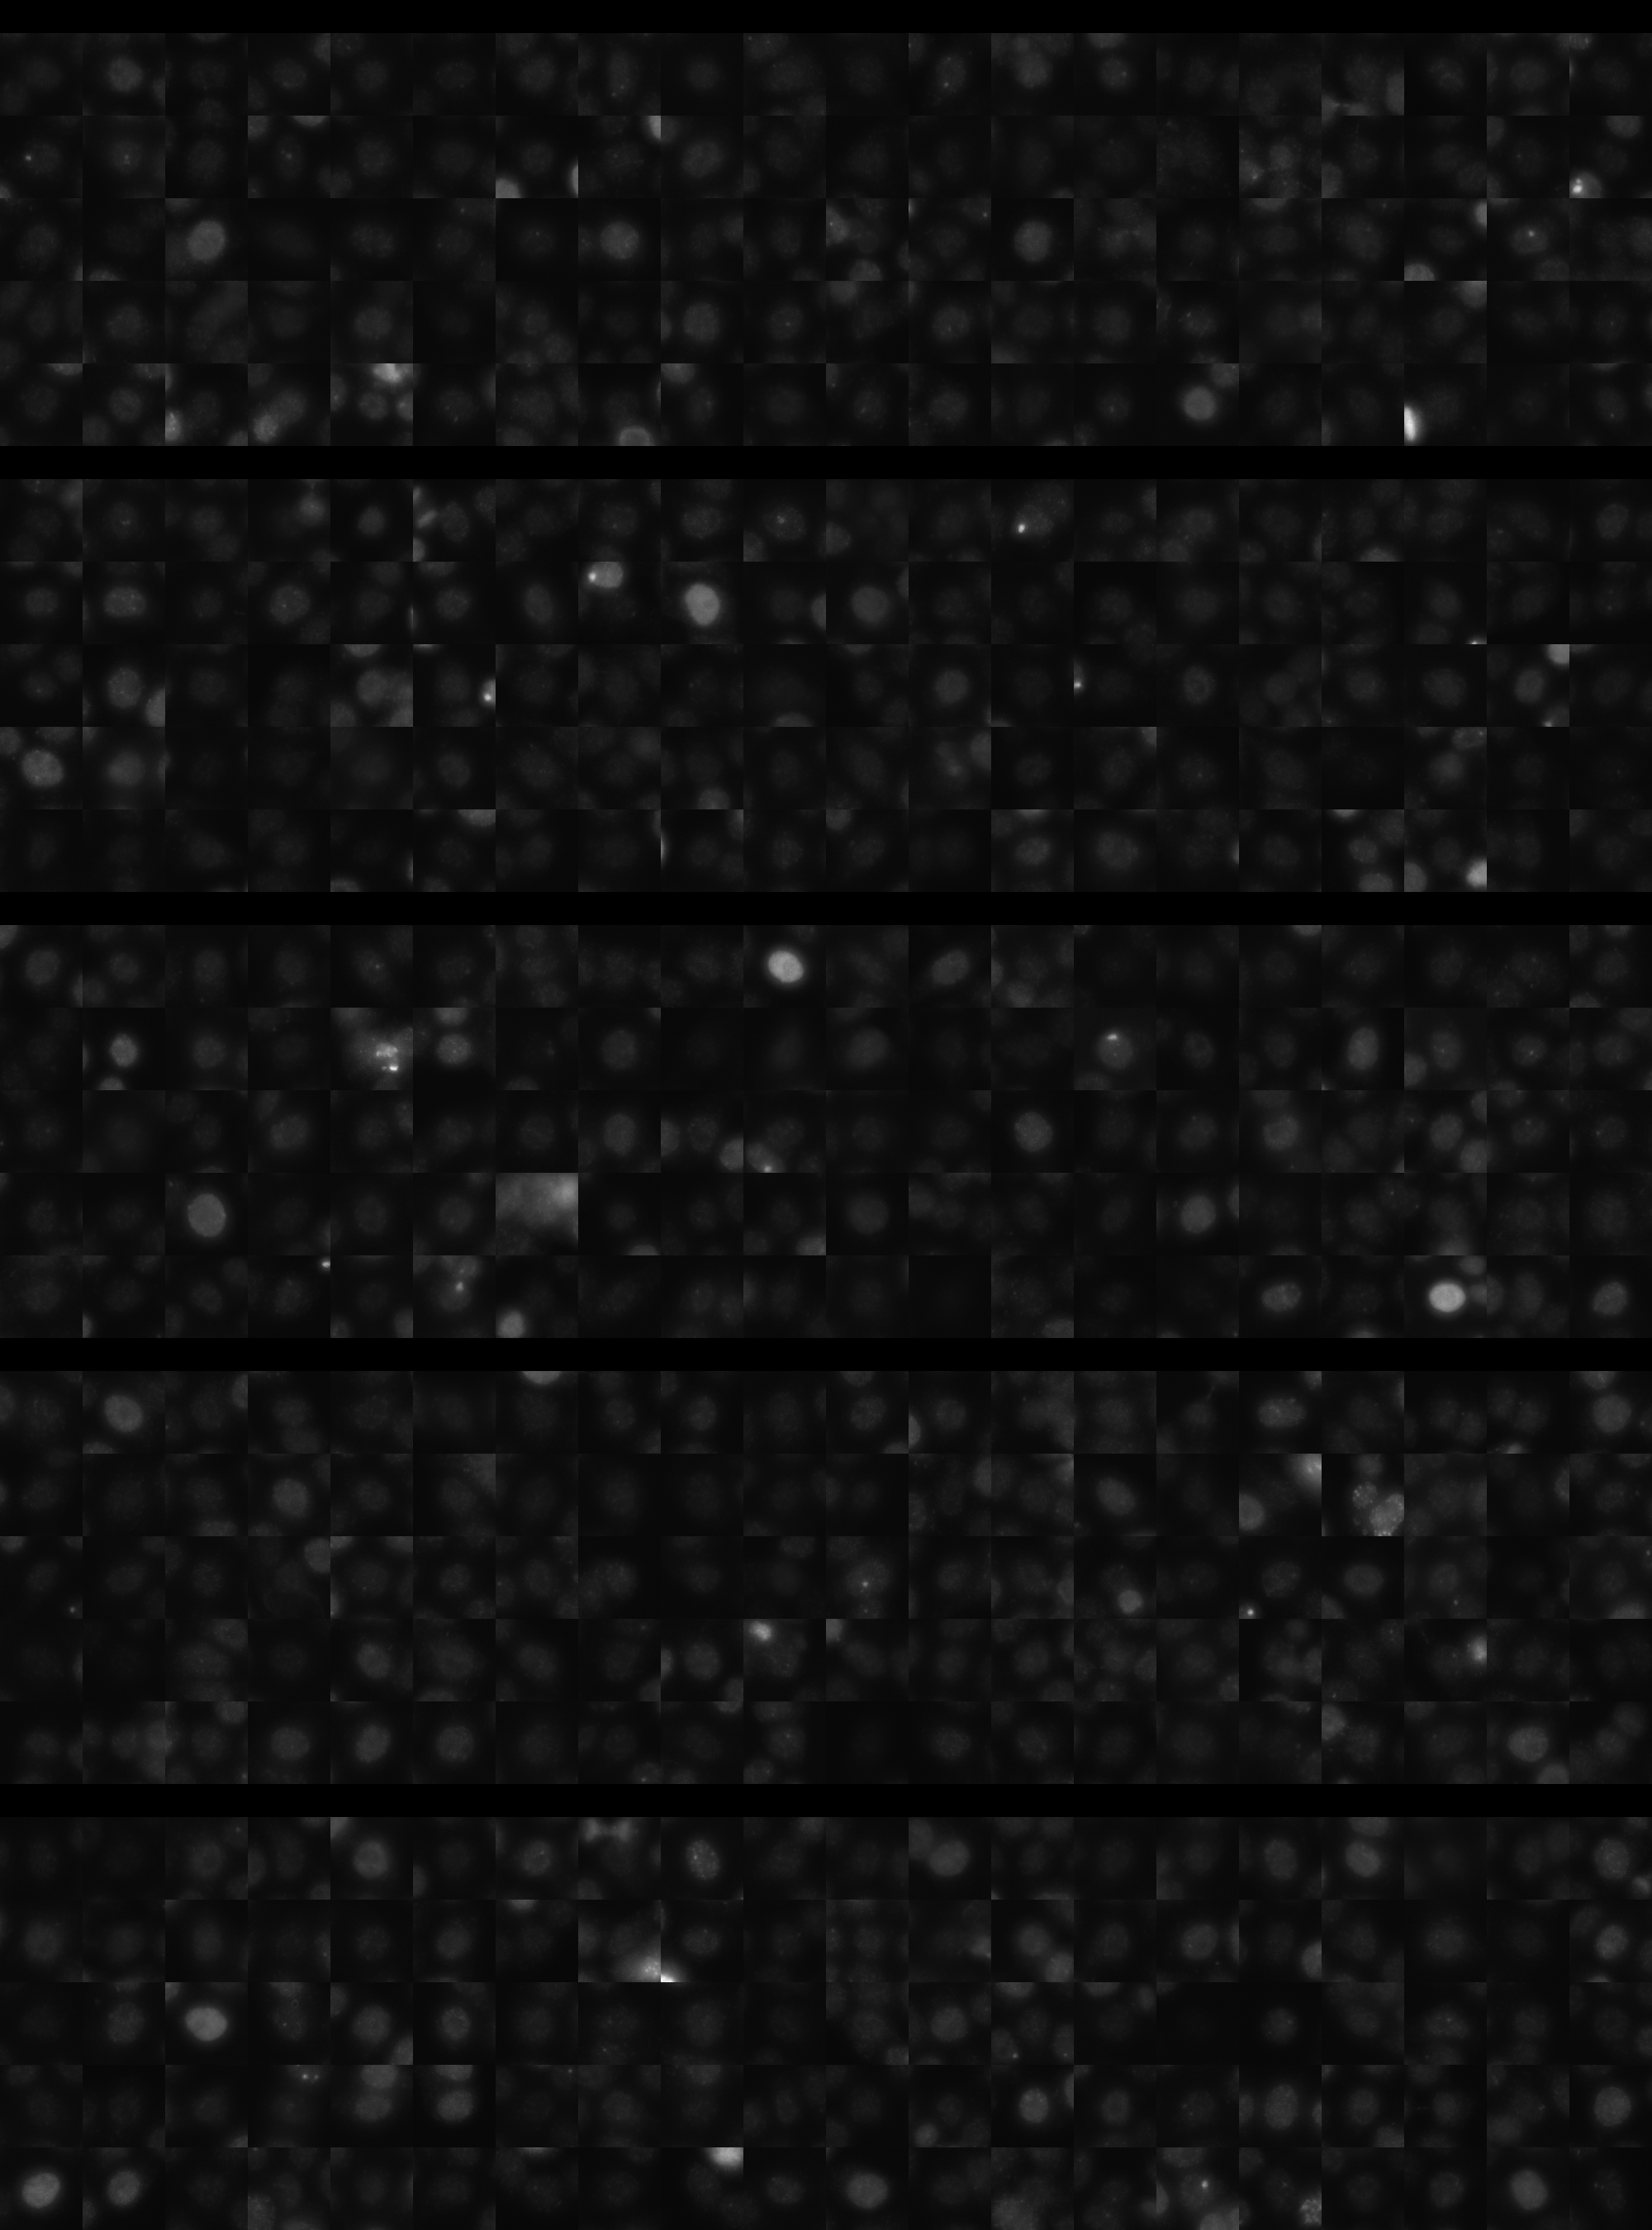
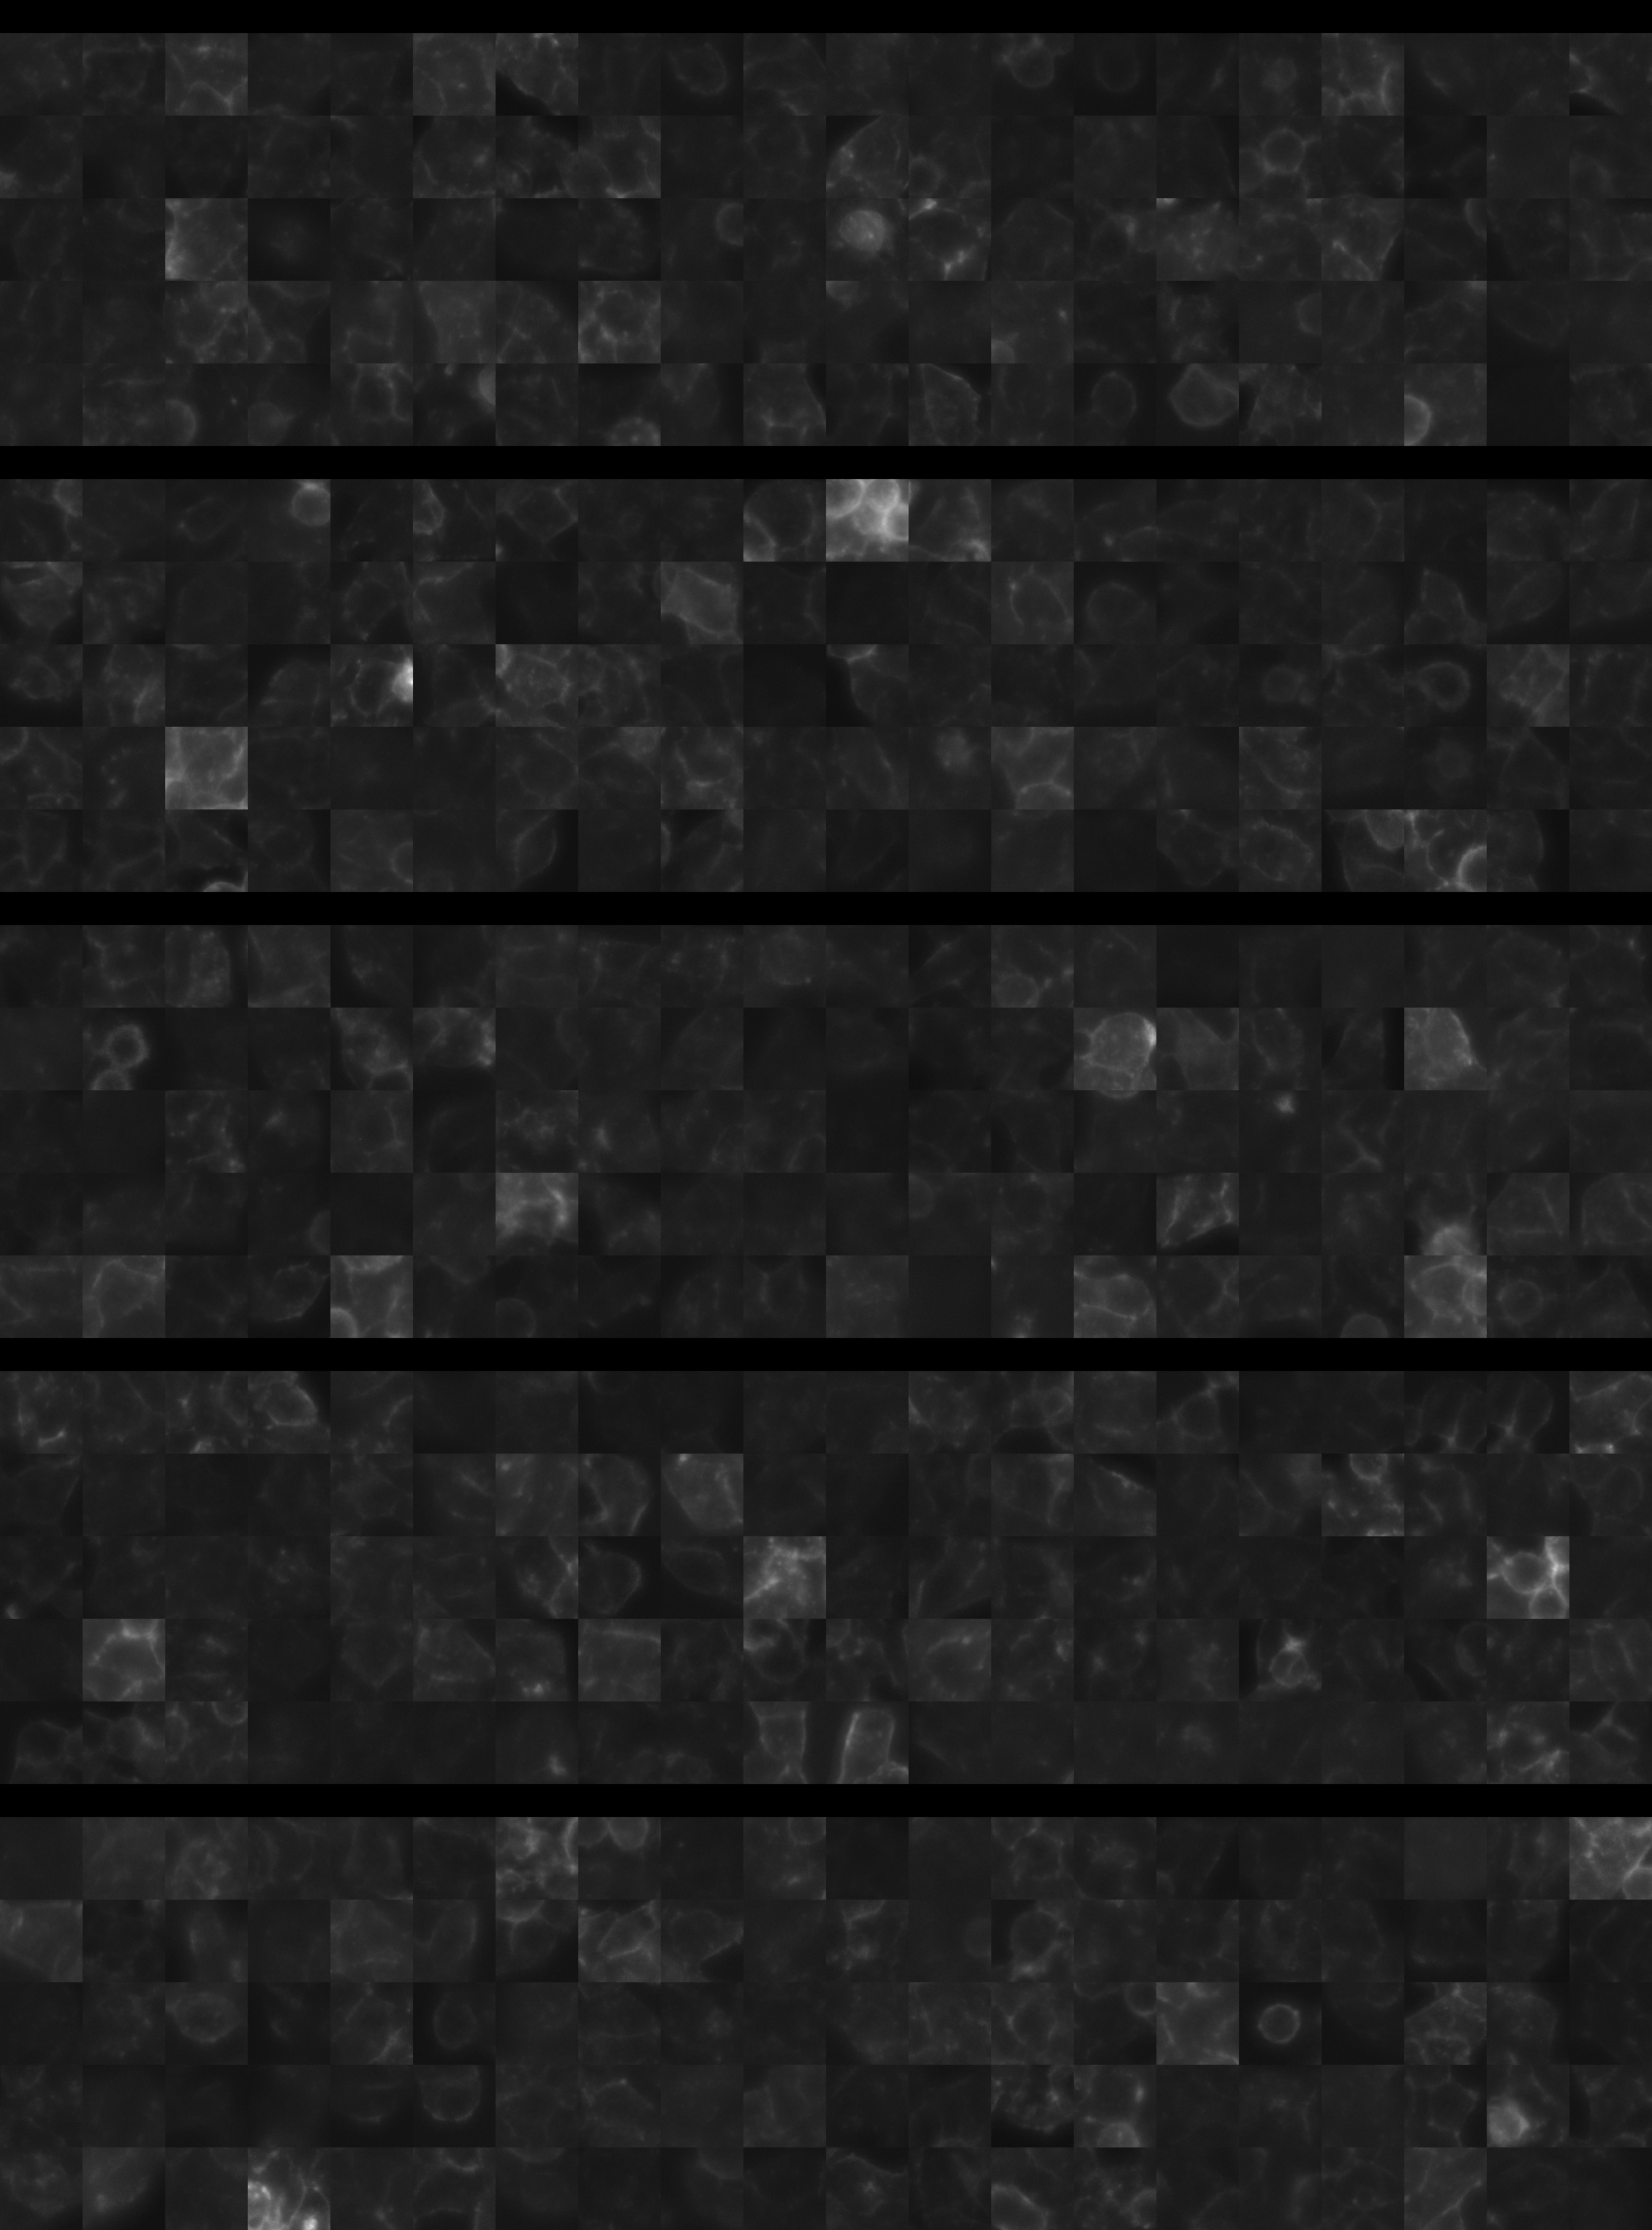
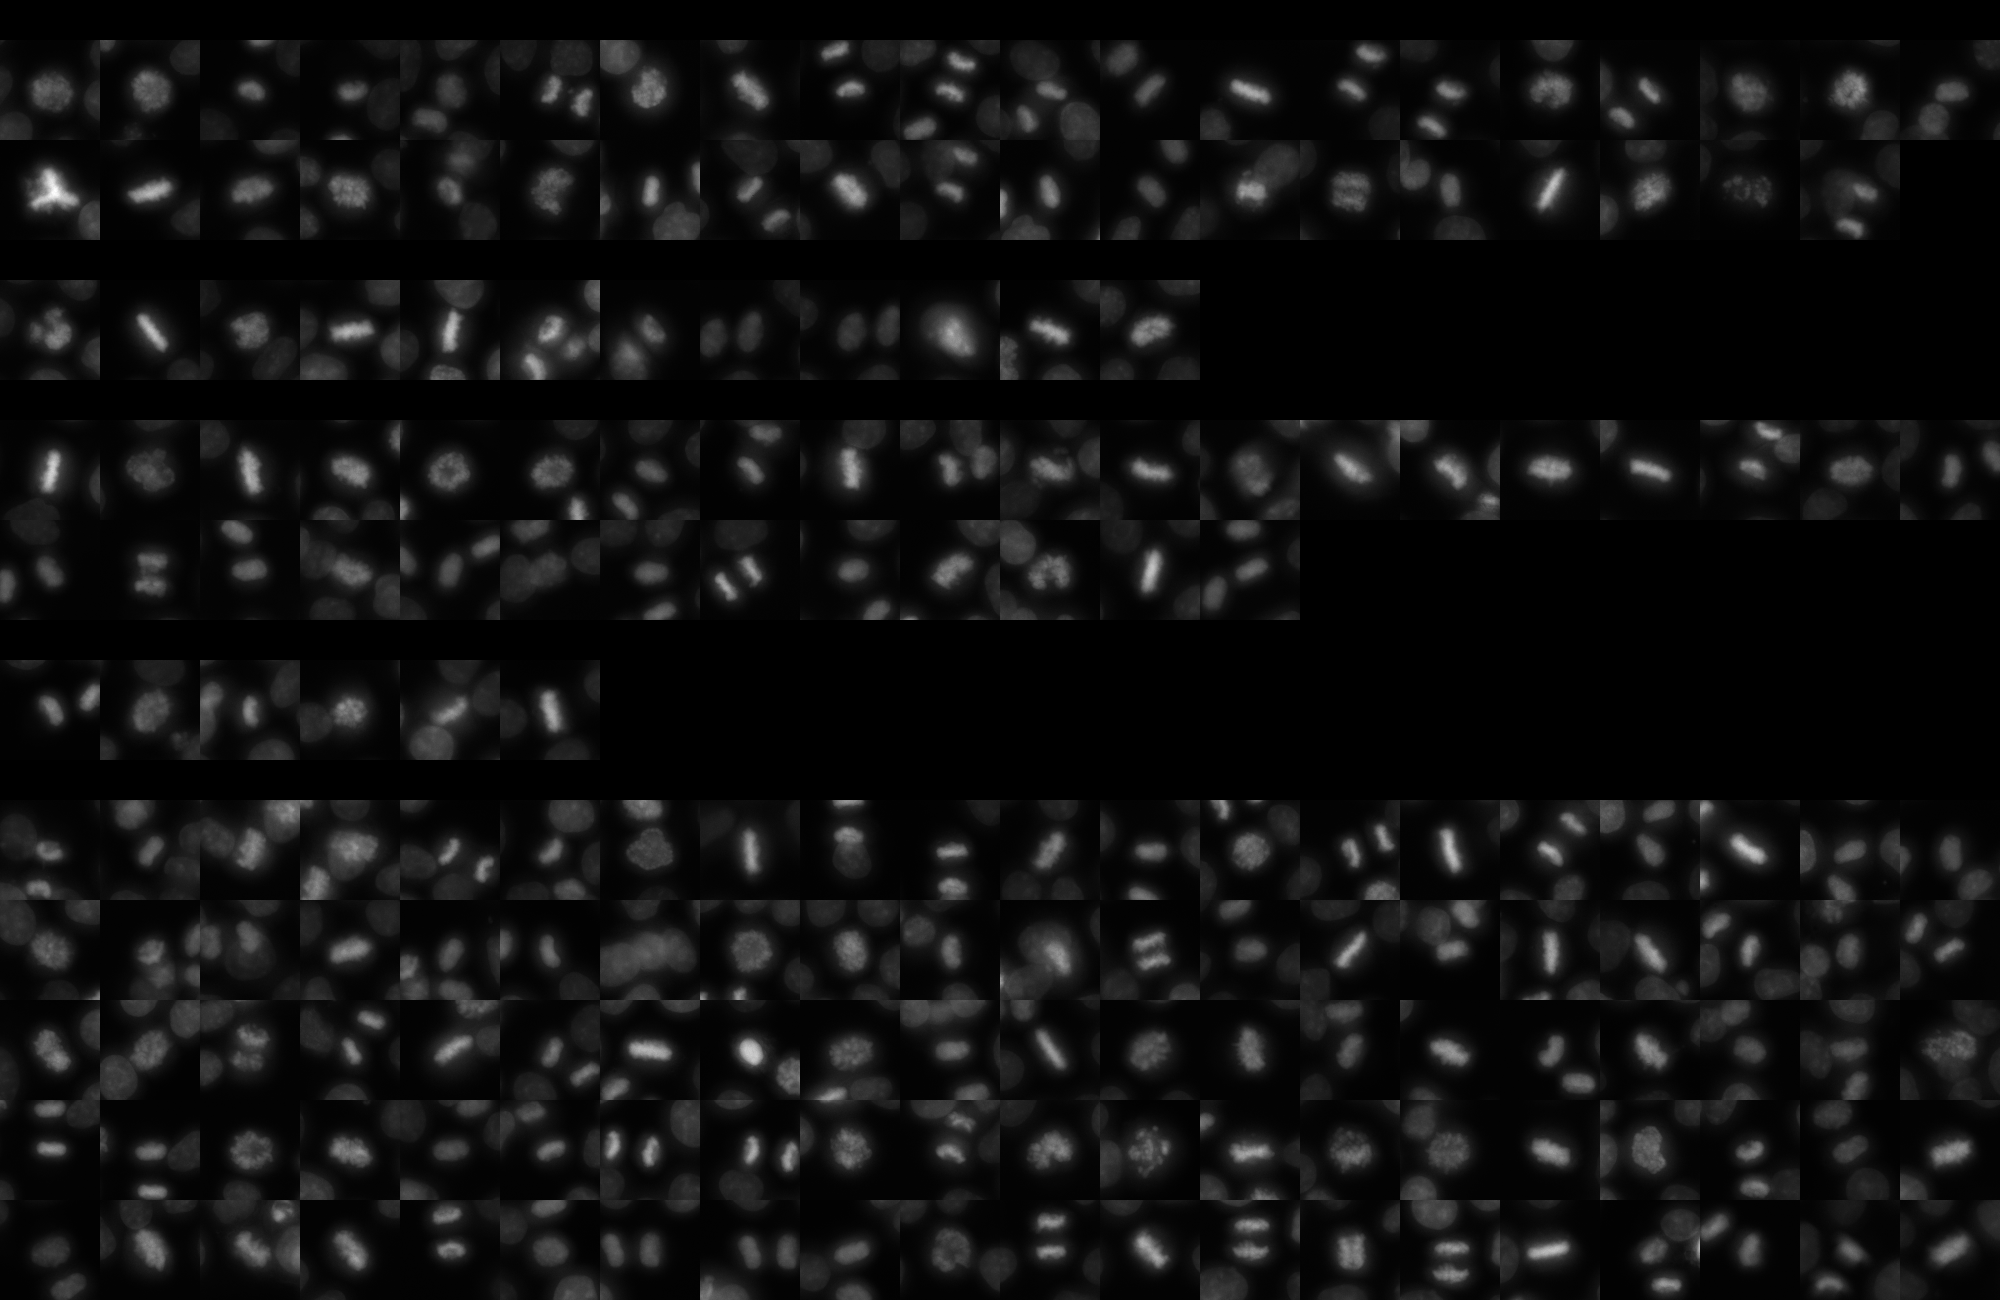
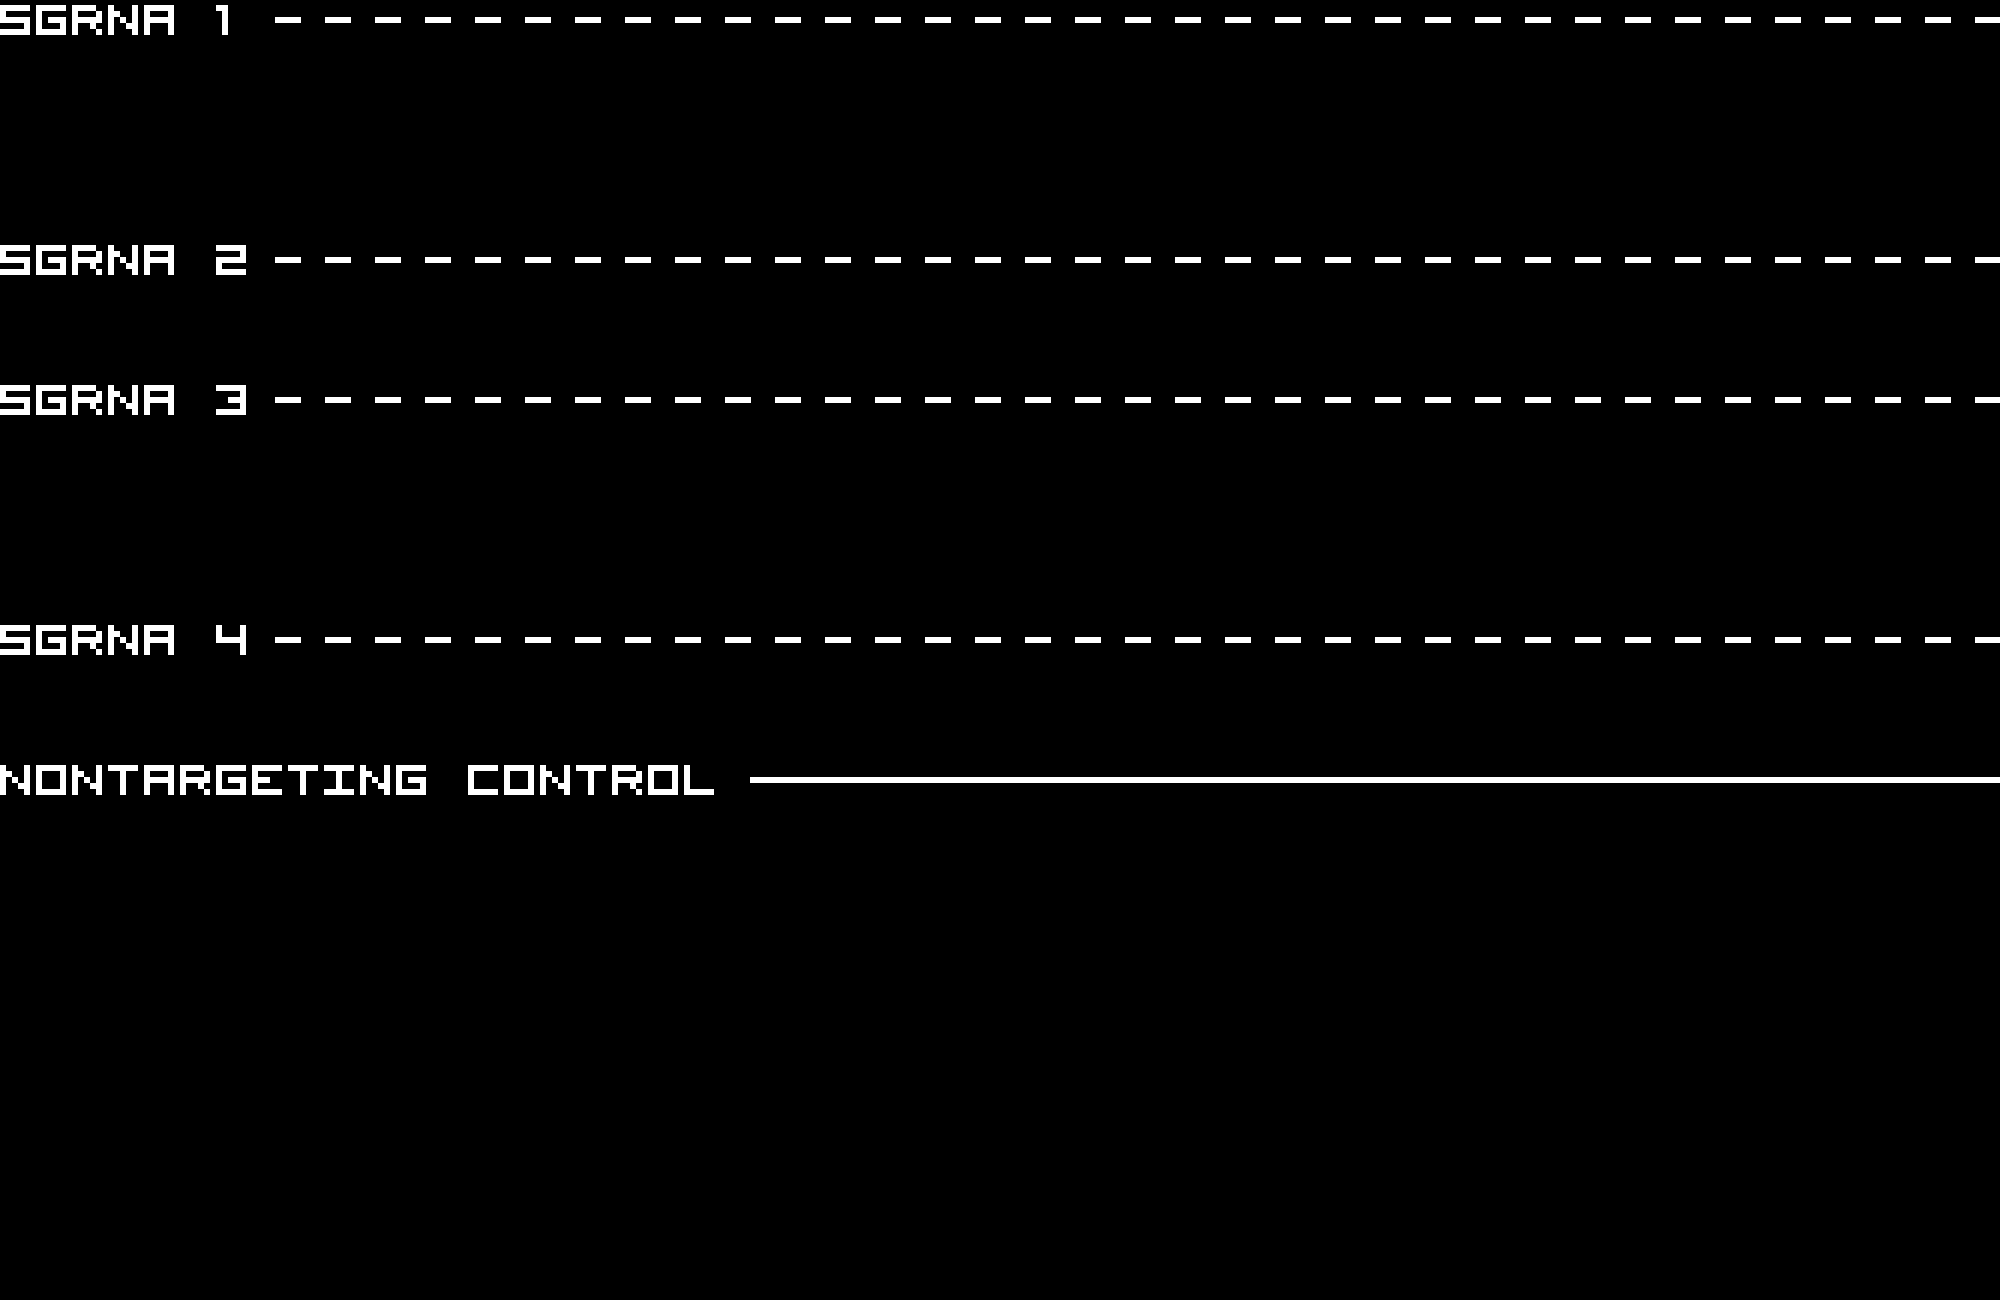
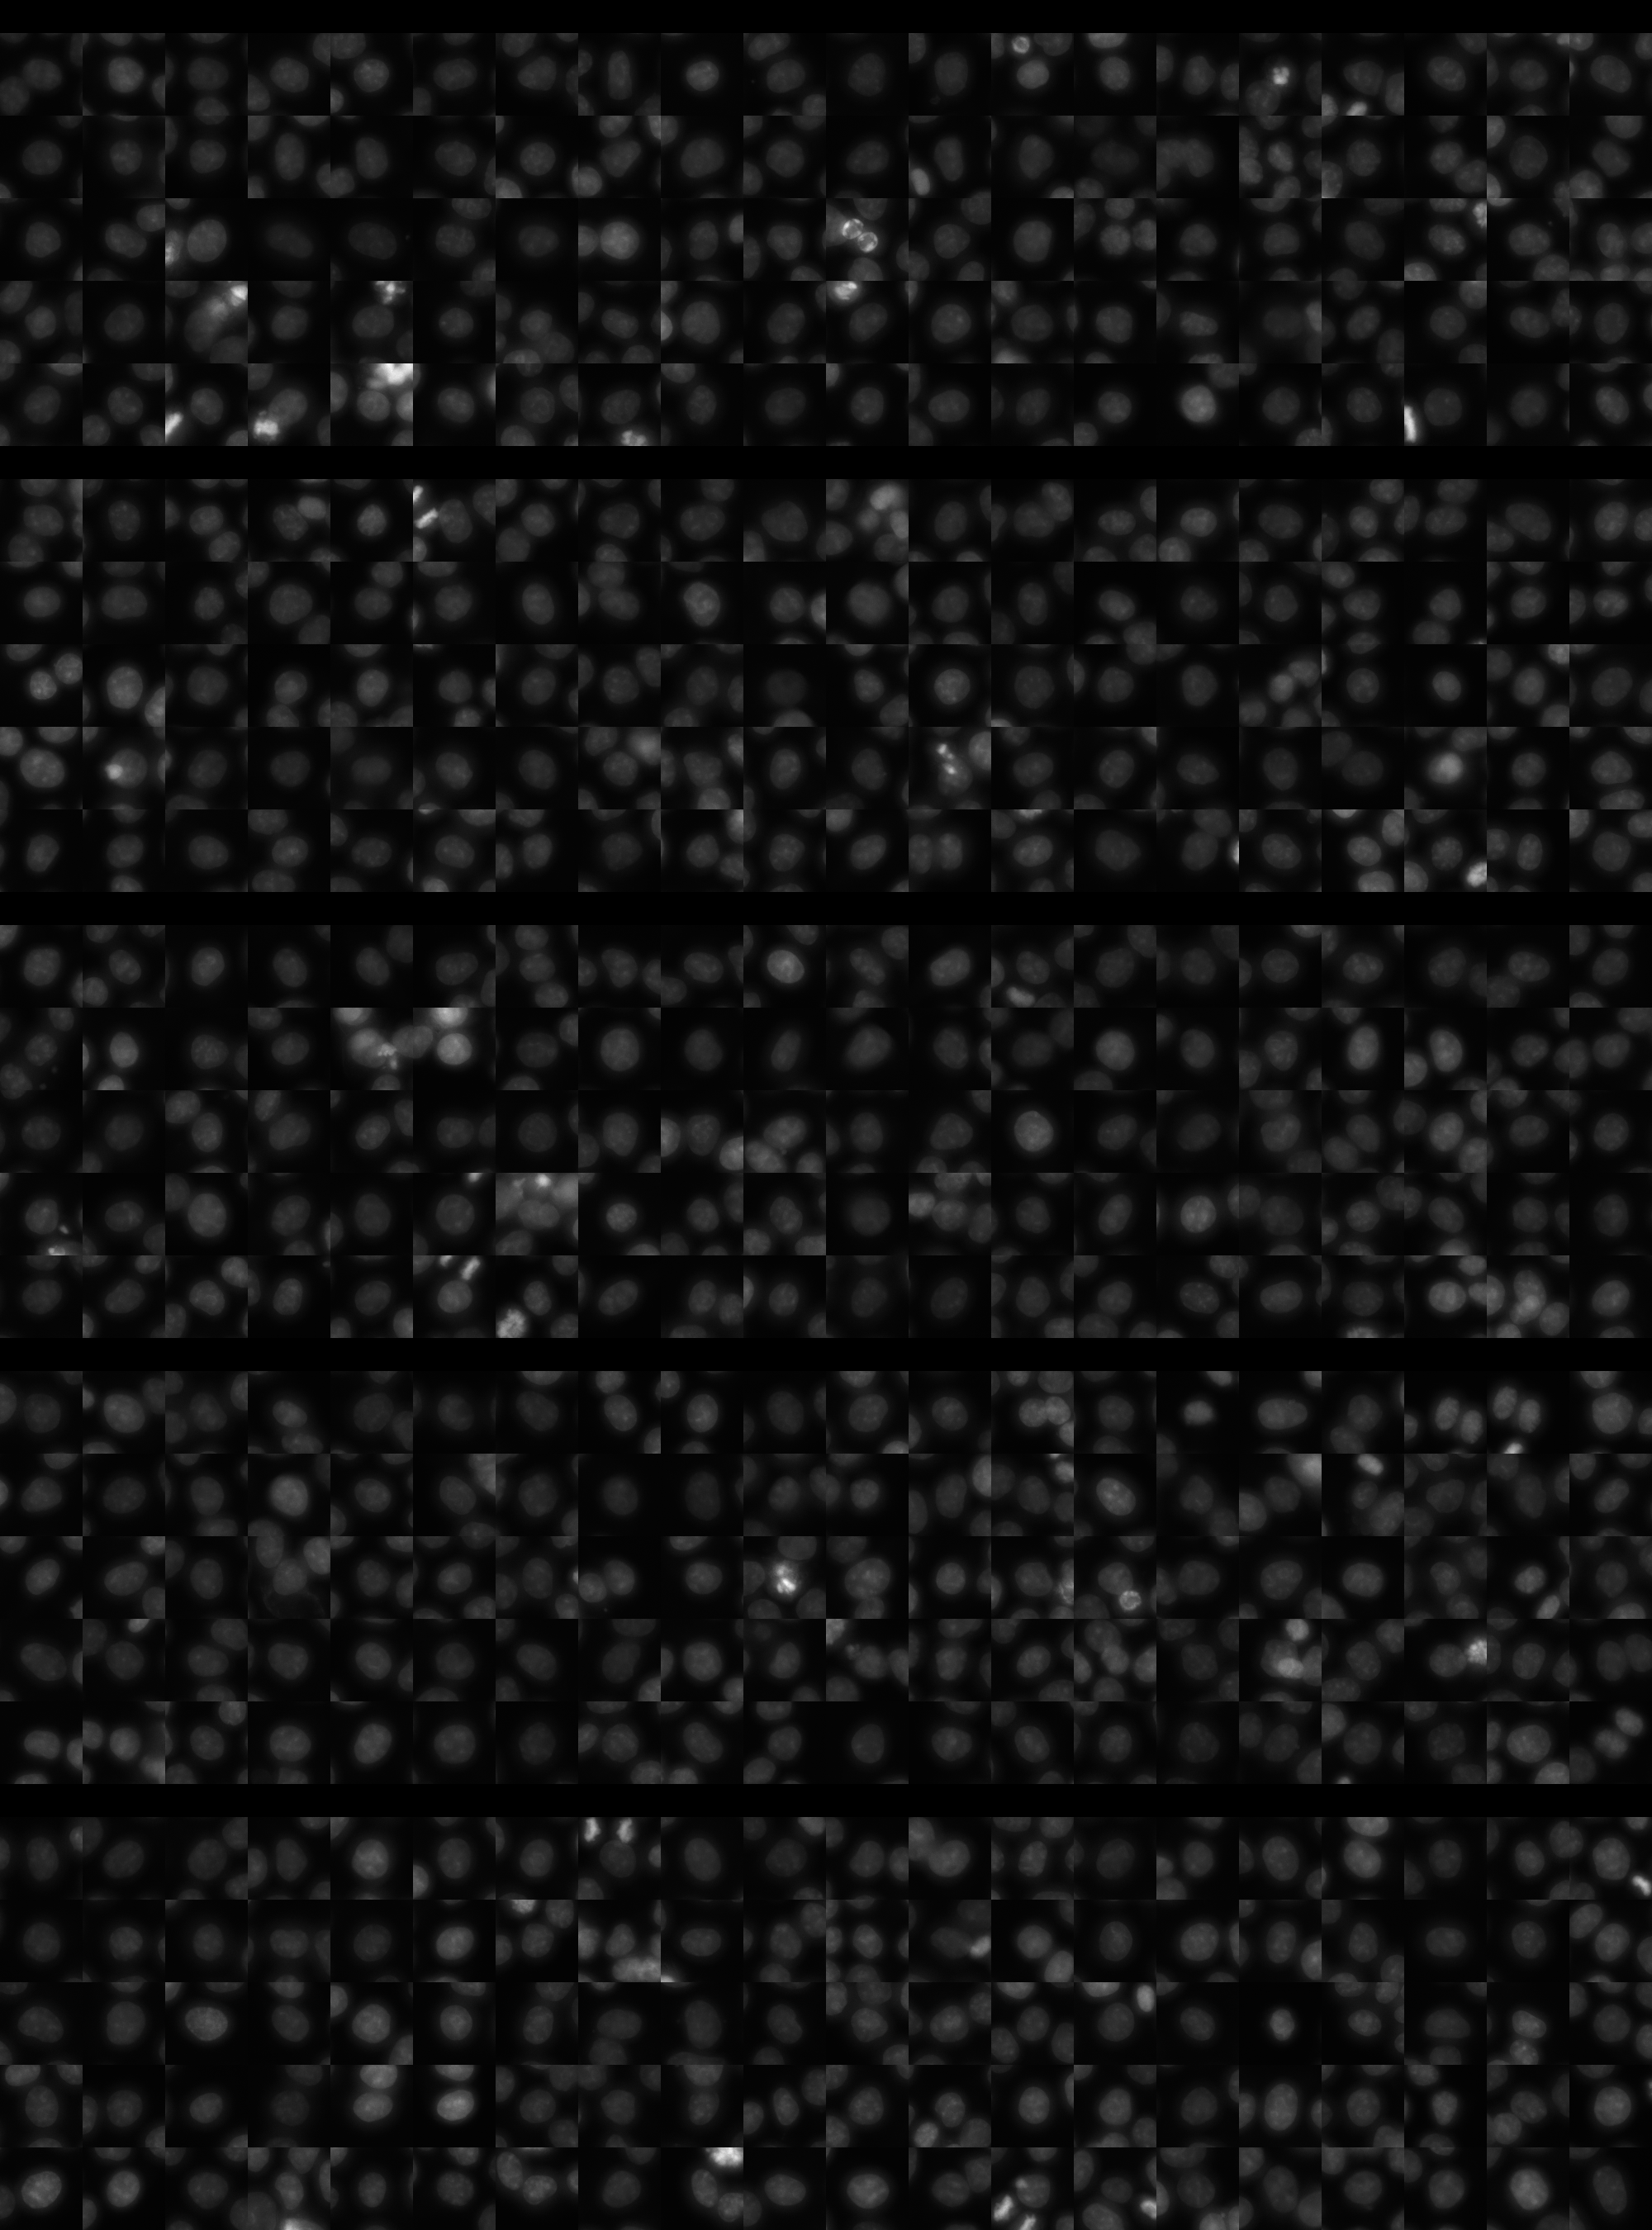
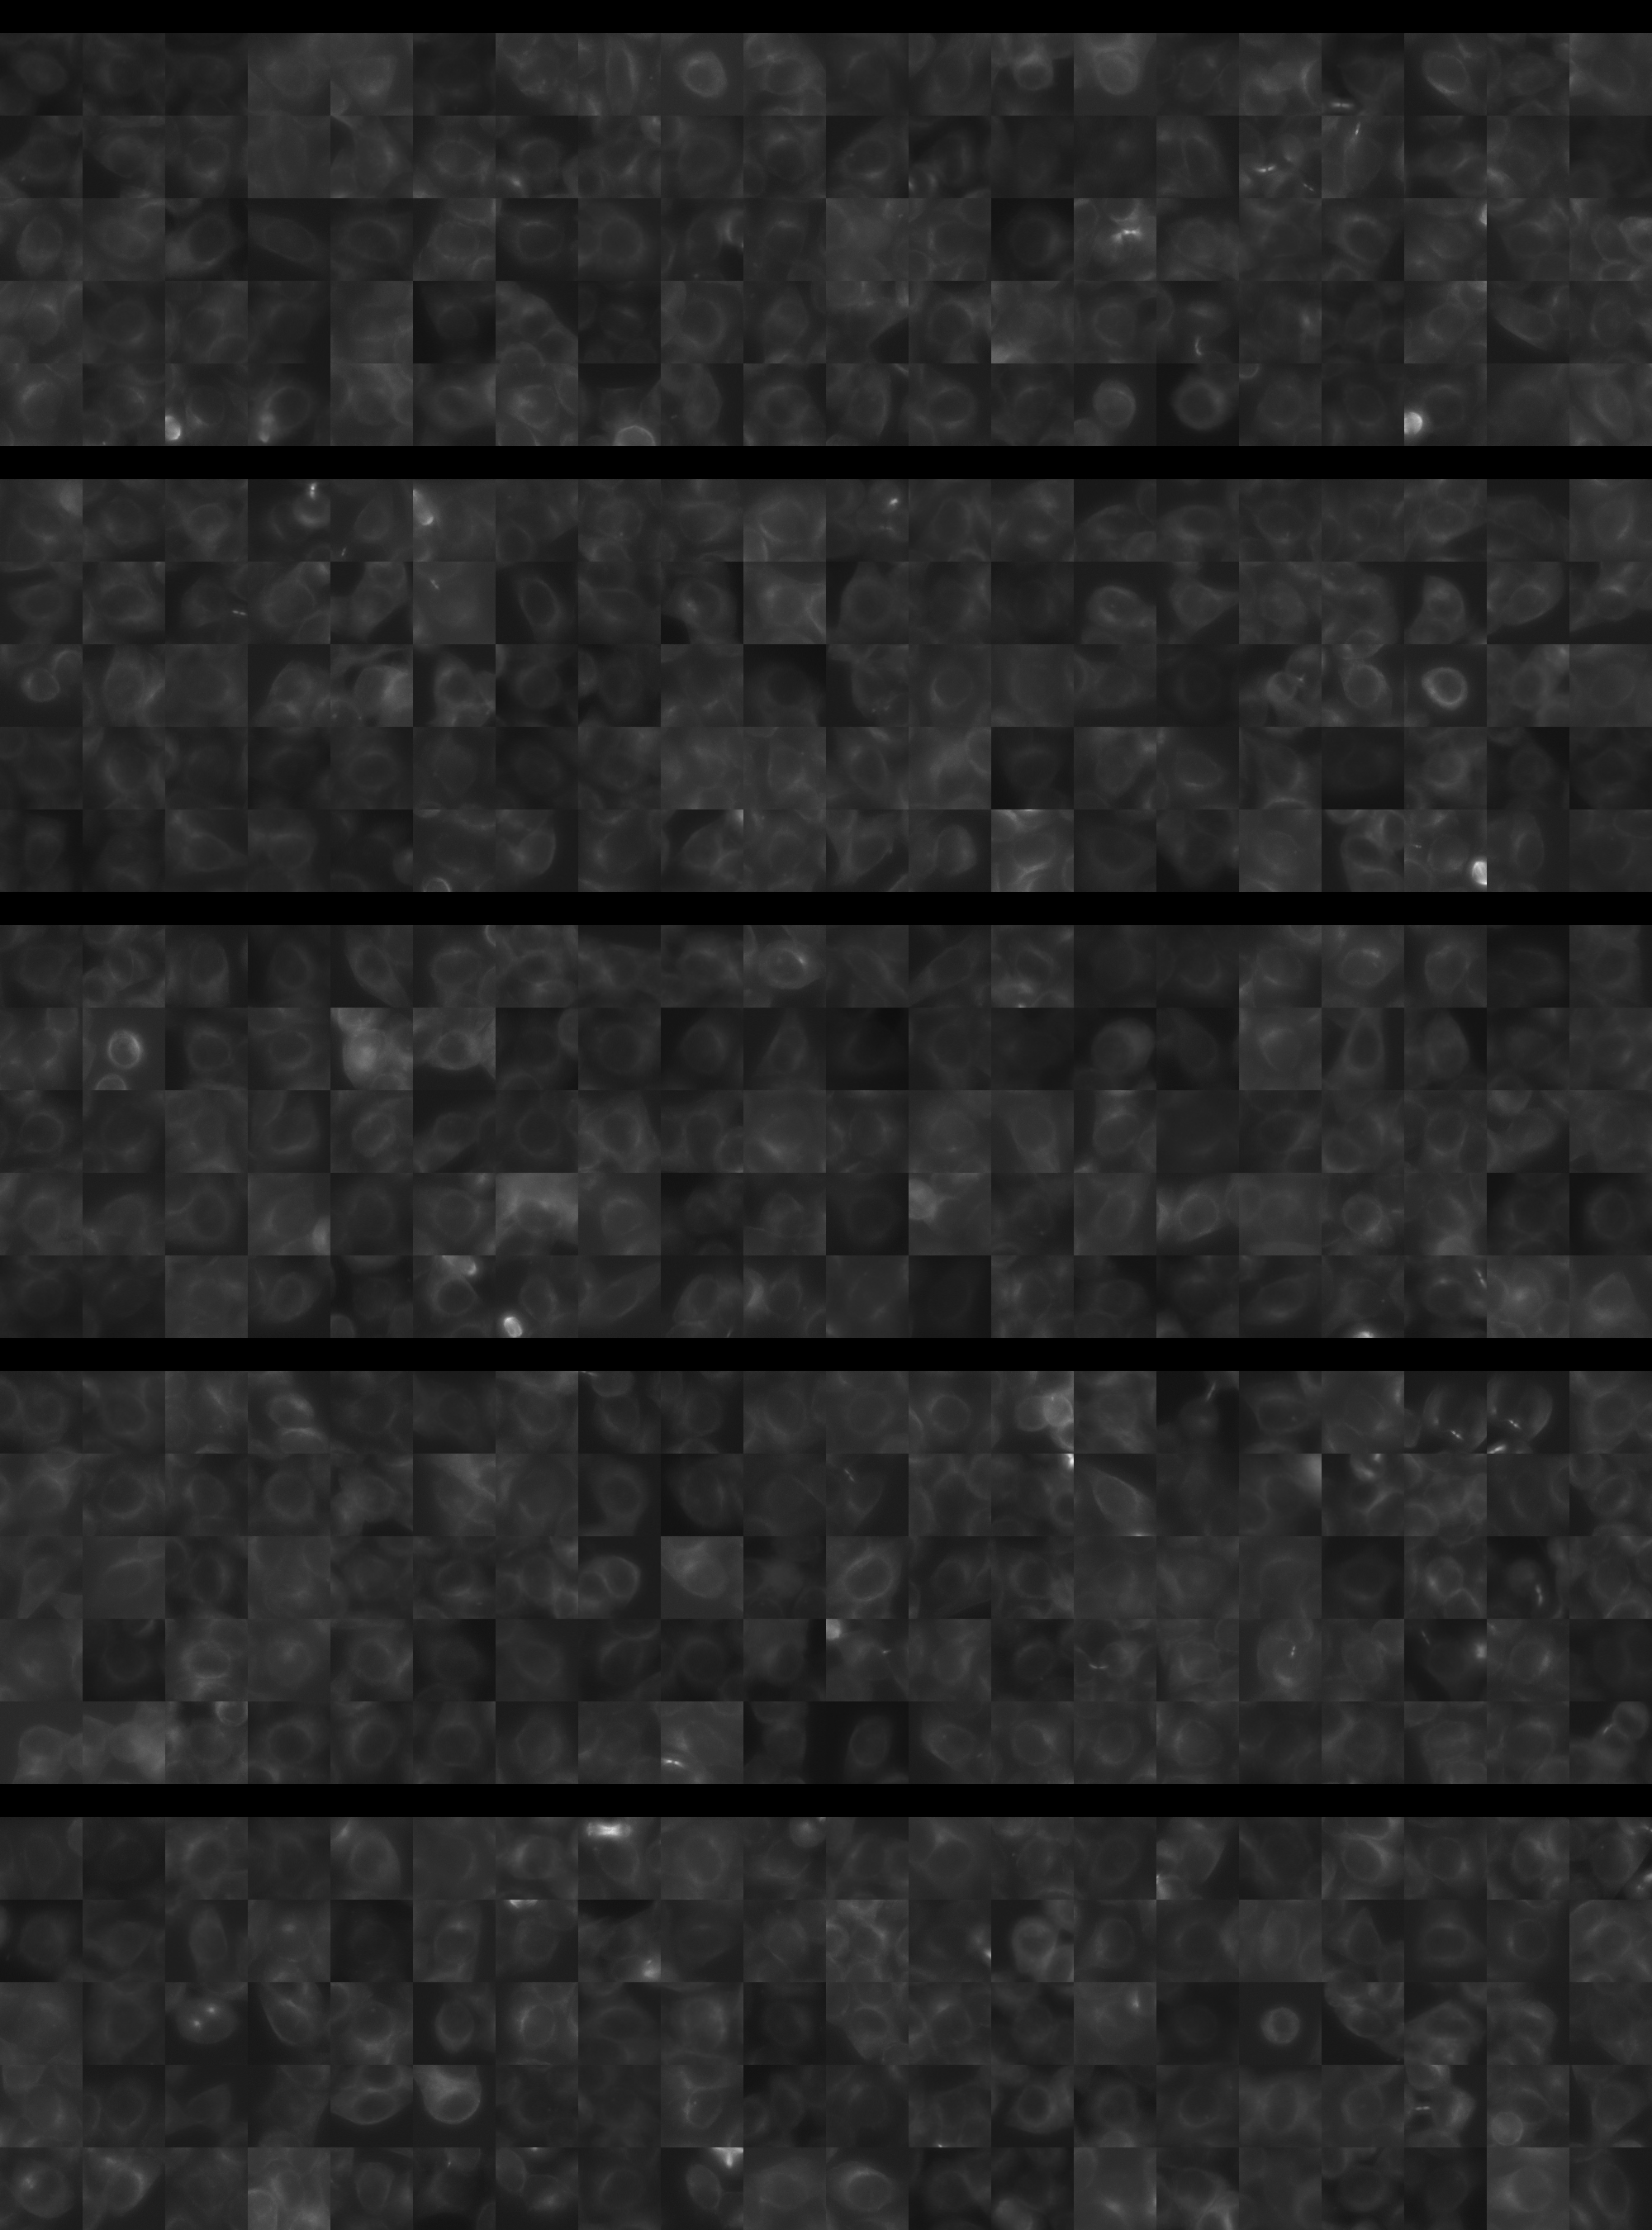
Each montage below shows randomly selected individual cell images for the same target gene separated by sgRNA, along with an example montage of cells expressing a non-targeting negative control sgRNA at the bottom. sgRNA labels in the montages correspond to the numbered sgRNA sequences in the gene info table above. The DNA (blue) and tubulin (green) channels are displayed by default, with gH2AX (grayscale) and actin (yellow) available using the check boxes. Channel brightness, contrast, and opacity are adjustable by clicking the arrow next to the channel name. When only one channel is selected, the display defaults to grayscale. Click the “Zoom” checkbox above the channel controls to enable image zooming (via scrolling) and panning (via click-and-drag).

The cell boxes displayed for this gene are square, 30.36 μm per side for the interphase montage and 30.36 μm per side for the mitotic montage.
Features

Interphase Score Rank FDR q-value
Nucleus DNA Integrated -4.685e-02 4820 of 5322 0.420
Nucleus DNA Mean -1.516e-01 4952 of 5322 2.900e-04
Nucleus gH2AX Mean -2.697e-02 4918 of 5322 0.484
Nucleus DNA - gH2AX Correlation -9.605e-02 3876 of 5322 0.003
Nucleus Shape Area 0.063 1338 of 5322 0.316
Nucleus Shape Eccentricity 0.014 2558 of 5322 0.797
Nucleus Shape Form Factor -9.915e-02 4361 of 5322 0.022
Nucleus Shape Solidity -7.916e-02 3798 of 5322 0.040
Cell DNA Mass Displacement 0.043 1486 of 5322 0.532
Cell Tubulin Mean -3.924e-02 4064 of 5322 0.499
Cell Tubulin Mass Displacement 0.038 955 of 5322 0.534
Cell Actin Mean 0.038 1846 of 5322 0.503
Cell Tubulin - Actin Correlation 0.074 880 of 5322 0.094
Cell DNA - Tubulin Correlation 0.036 2394 of 5322 0.438
Cell Shape Area 0.059 1279 of 5322 0.425
Cell Shape Eccentricity 0.034 1236 of 5322 0.681
Mitotic Score Rank FDR q-value
Nucleus DNA Integrated 0.039 3391 of 5322 0.996
Nucleus DNA Mean 0.284 271 of 5322 1.000
Nucleus DNA Mass Displacement -1.611e-01 5076 of 5322 0.999
Nucleus DNA Mean Frac 3 -2.354e-01 5130 of 5322 1.000
Nucleus gH2AX Mean -1.489e-01 4635 of 5322 1.000
Nucleus gH2AX Mean Frac 0 0.191 370 of 5322 1.000
Nucleus Tubulin Mean Frac 0 0.048 2764 of 5322 0.999
Nucleus Tubulin Mean Edge -8.779e-02 4230 of 5322 0.999
Nucleus Tubulin Std Edge -5.140e-02 3280 of 5322 0.999
Nucleus Shape Area 0.057 3238 of 5322 0.990
Nucleus Shape Eccentricity 0.086 987 of 5322 1.000
Nucleus Shape Form Factor -4.216e-02 1983 of 5322 0.998
Cell Tubulin Mean -8.887e-02 4489 of 5322 0.997
Cell Tubulin Mean Frac 3 -6.161e-03 1751 of 5322 0.999
Cell Actin Mean 0.141 1394 of 5322 0.997
Cell Shape Area -2.777e-02 4224 of 5322 0.998
( Reset Zoom )
Brightness
Contrast
Opacity
Brightness
Contrast
Opacity
Brightness
Contrast
Opacity
Brightness
Contrast
Opacity
Brightness
Contrast
Opacity

( Reset Zoom )
Brightness
Contrast
Opacity
Brightness
Contrast
Opacity
Brightness
Contrast
Opacity
Brightness
Contrast
Opacity
Brightness
Contrast
Opacity

MIT Central Accessability