MAU2

Gene symbol: MAU2
Gene: 23383
Uniprot Function: Plays an important role in the loading of the cohesin complex on to DNA. Forms a heterodimeric complex (also known as cohesin loading complex) with NIPBL/SCC2 which mediates the loading of the cohesin complex onto chromatin (PubMed:28167679, PubMed:22628566). Plays a role in sister chromatid cohesion and normal progression through prometaphase (PubMed:16802858, PubMed:16682347).
Mitotic Index 0.0251
Interphase Cluster: #218 (7 genes)
Mitotic Cluster: #113 (23 genes)
sgRNA 1: ACTCGGCCCCTACACCCAGG (interphase cells: 1974, mitotic cells: 54)
sgRNA 2: GATCTCATCATCGTGCAGTG (interphase cells: 2992, mitotic cells: 61)
sgRNA 3: GCAGGCAGTGCACGCACAGG (interphase cells: 1640, mitotic cells: 48)
sgRNA 4: GTATTCAGATCCCACCACCC (interphase cells: 2119, mitotic cells: 62)

Interphase Cluster

Mitotic Cluster

Overview

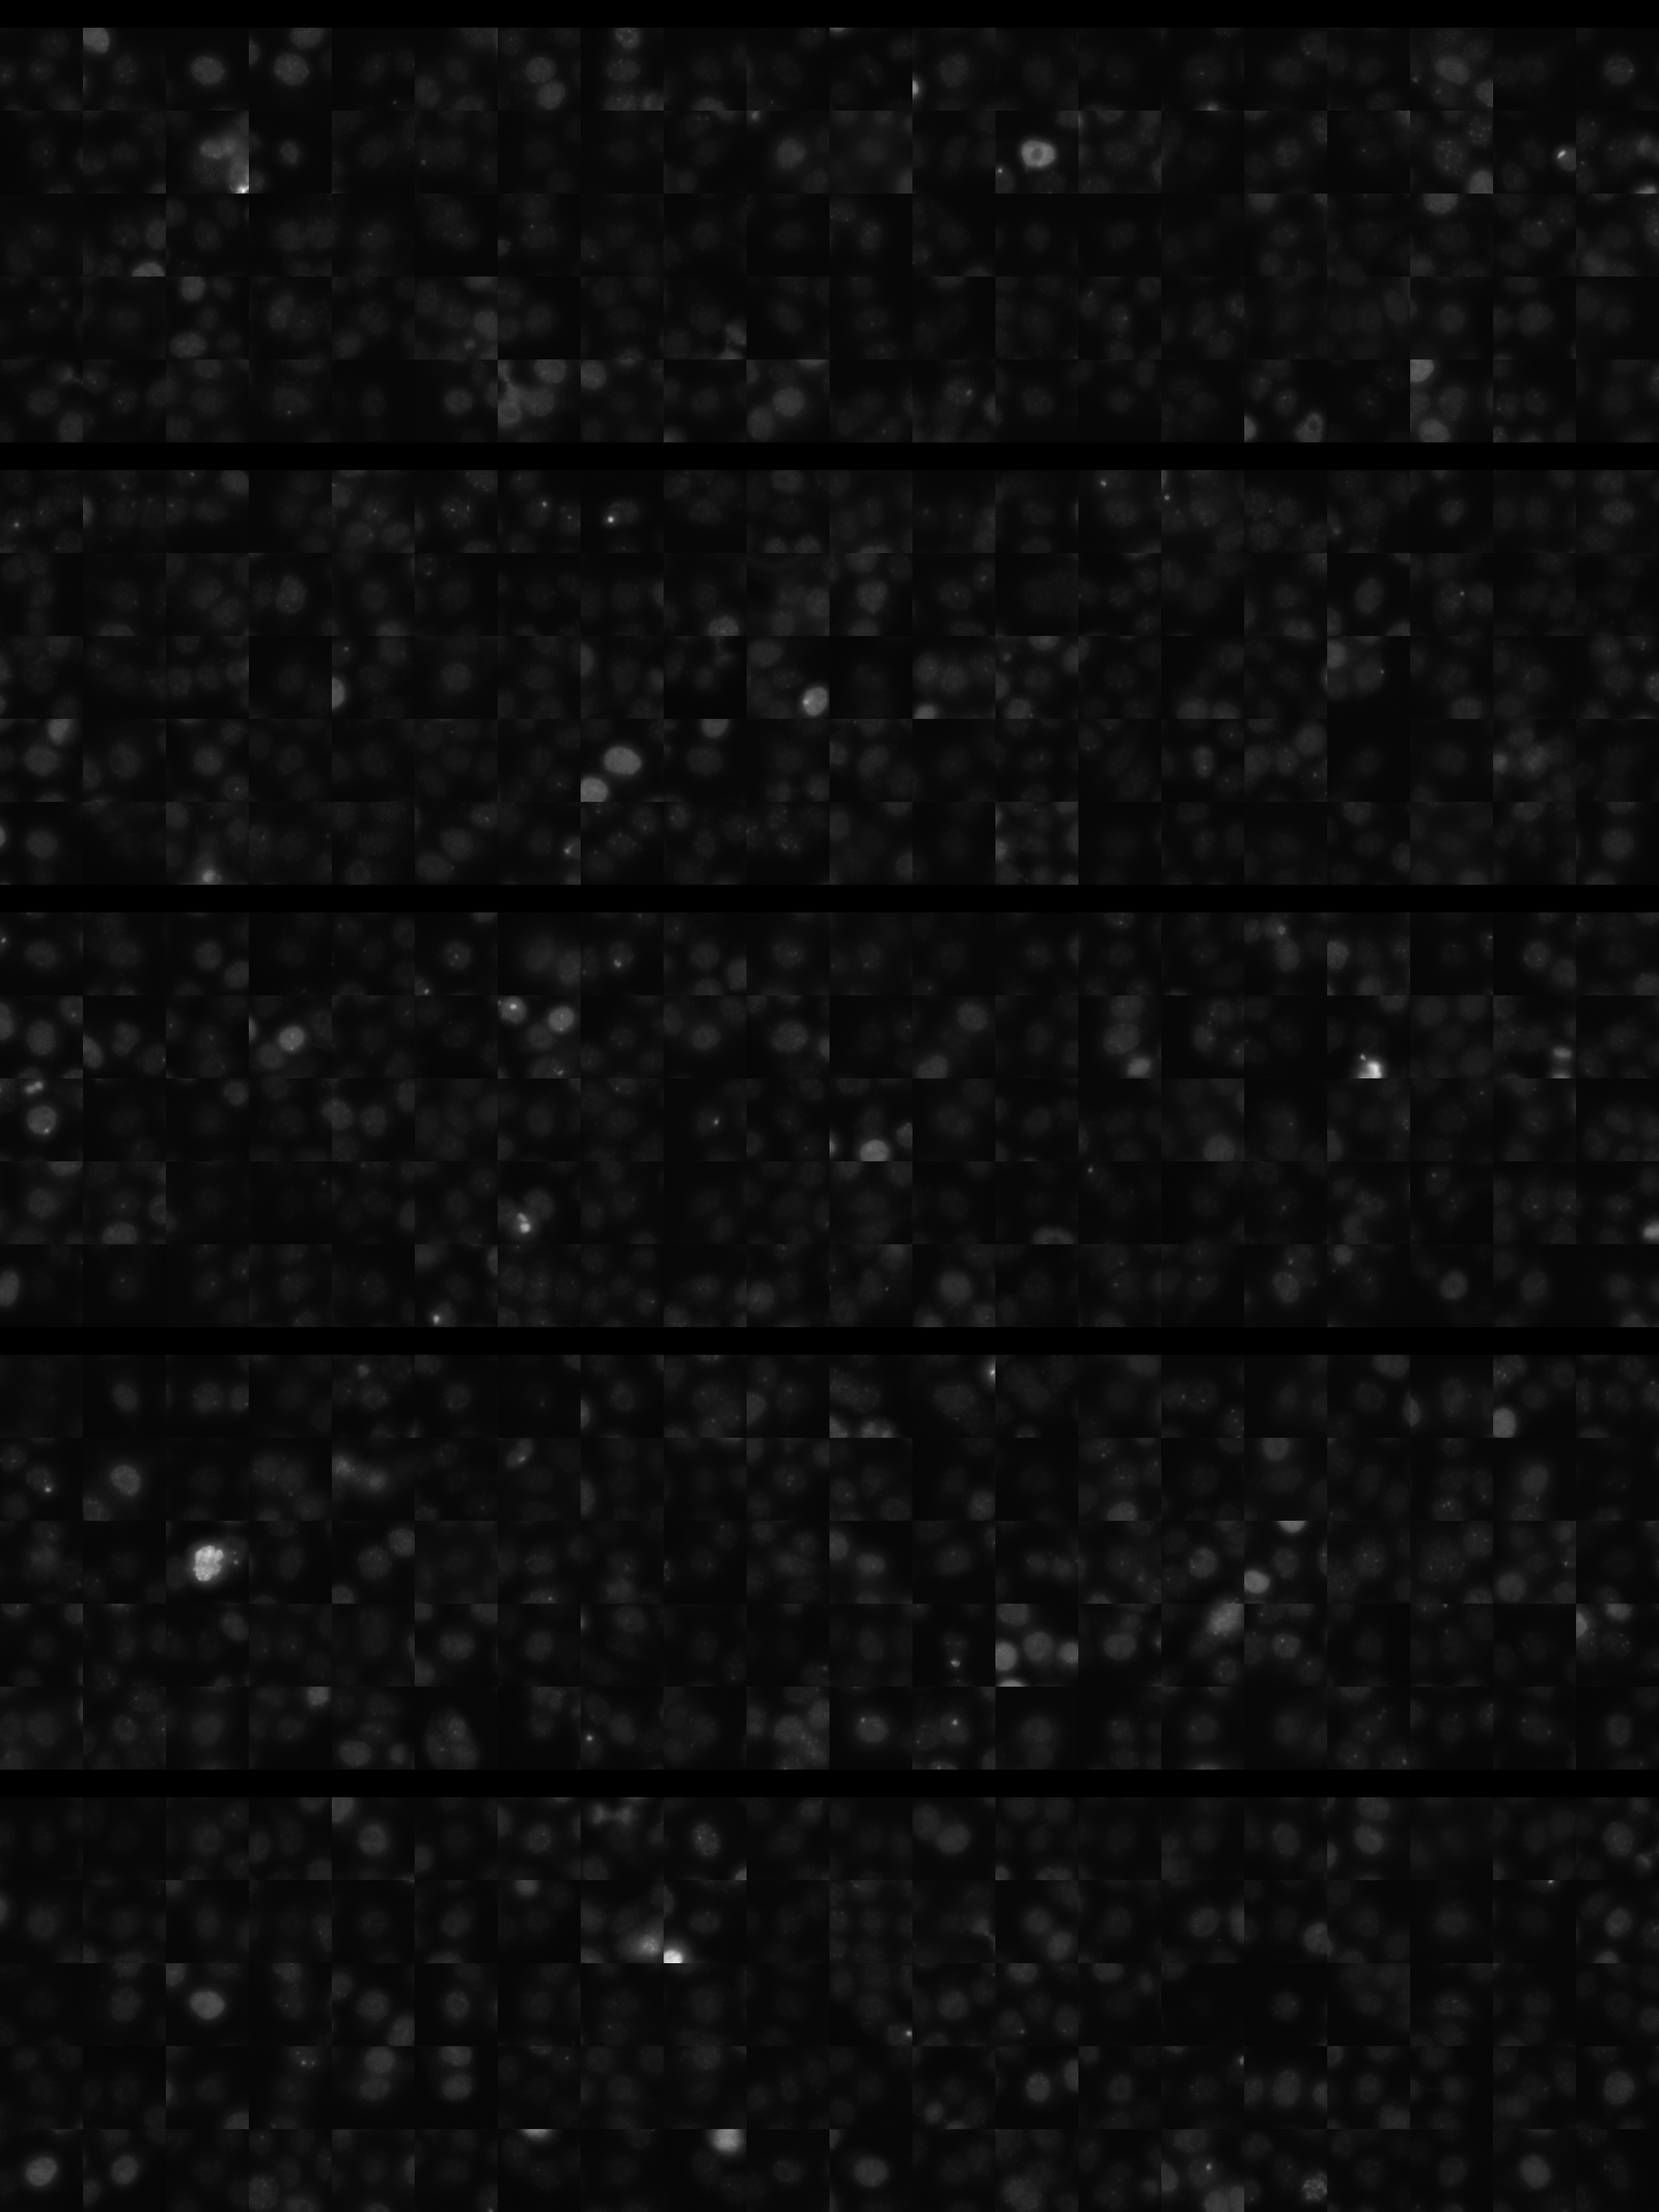
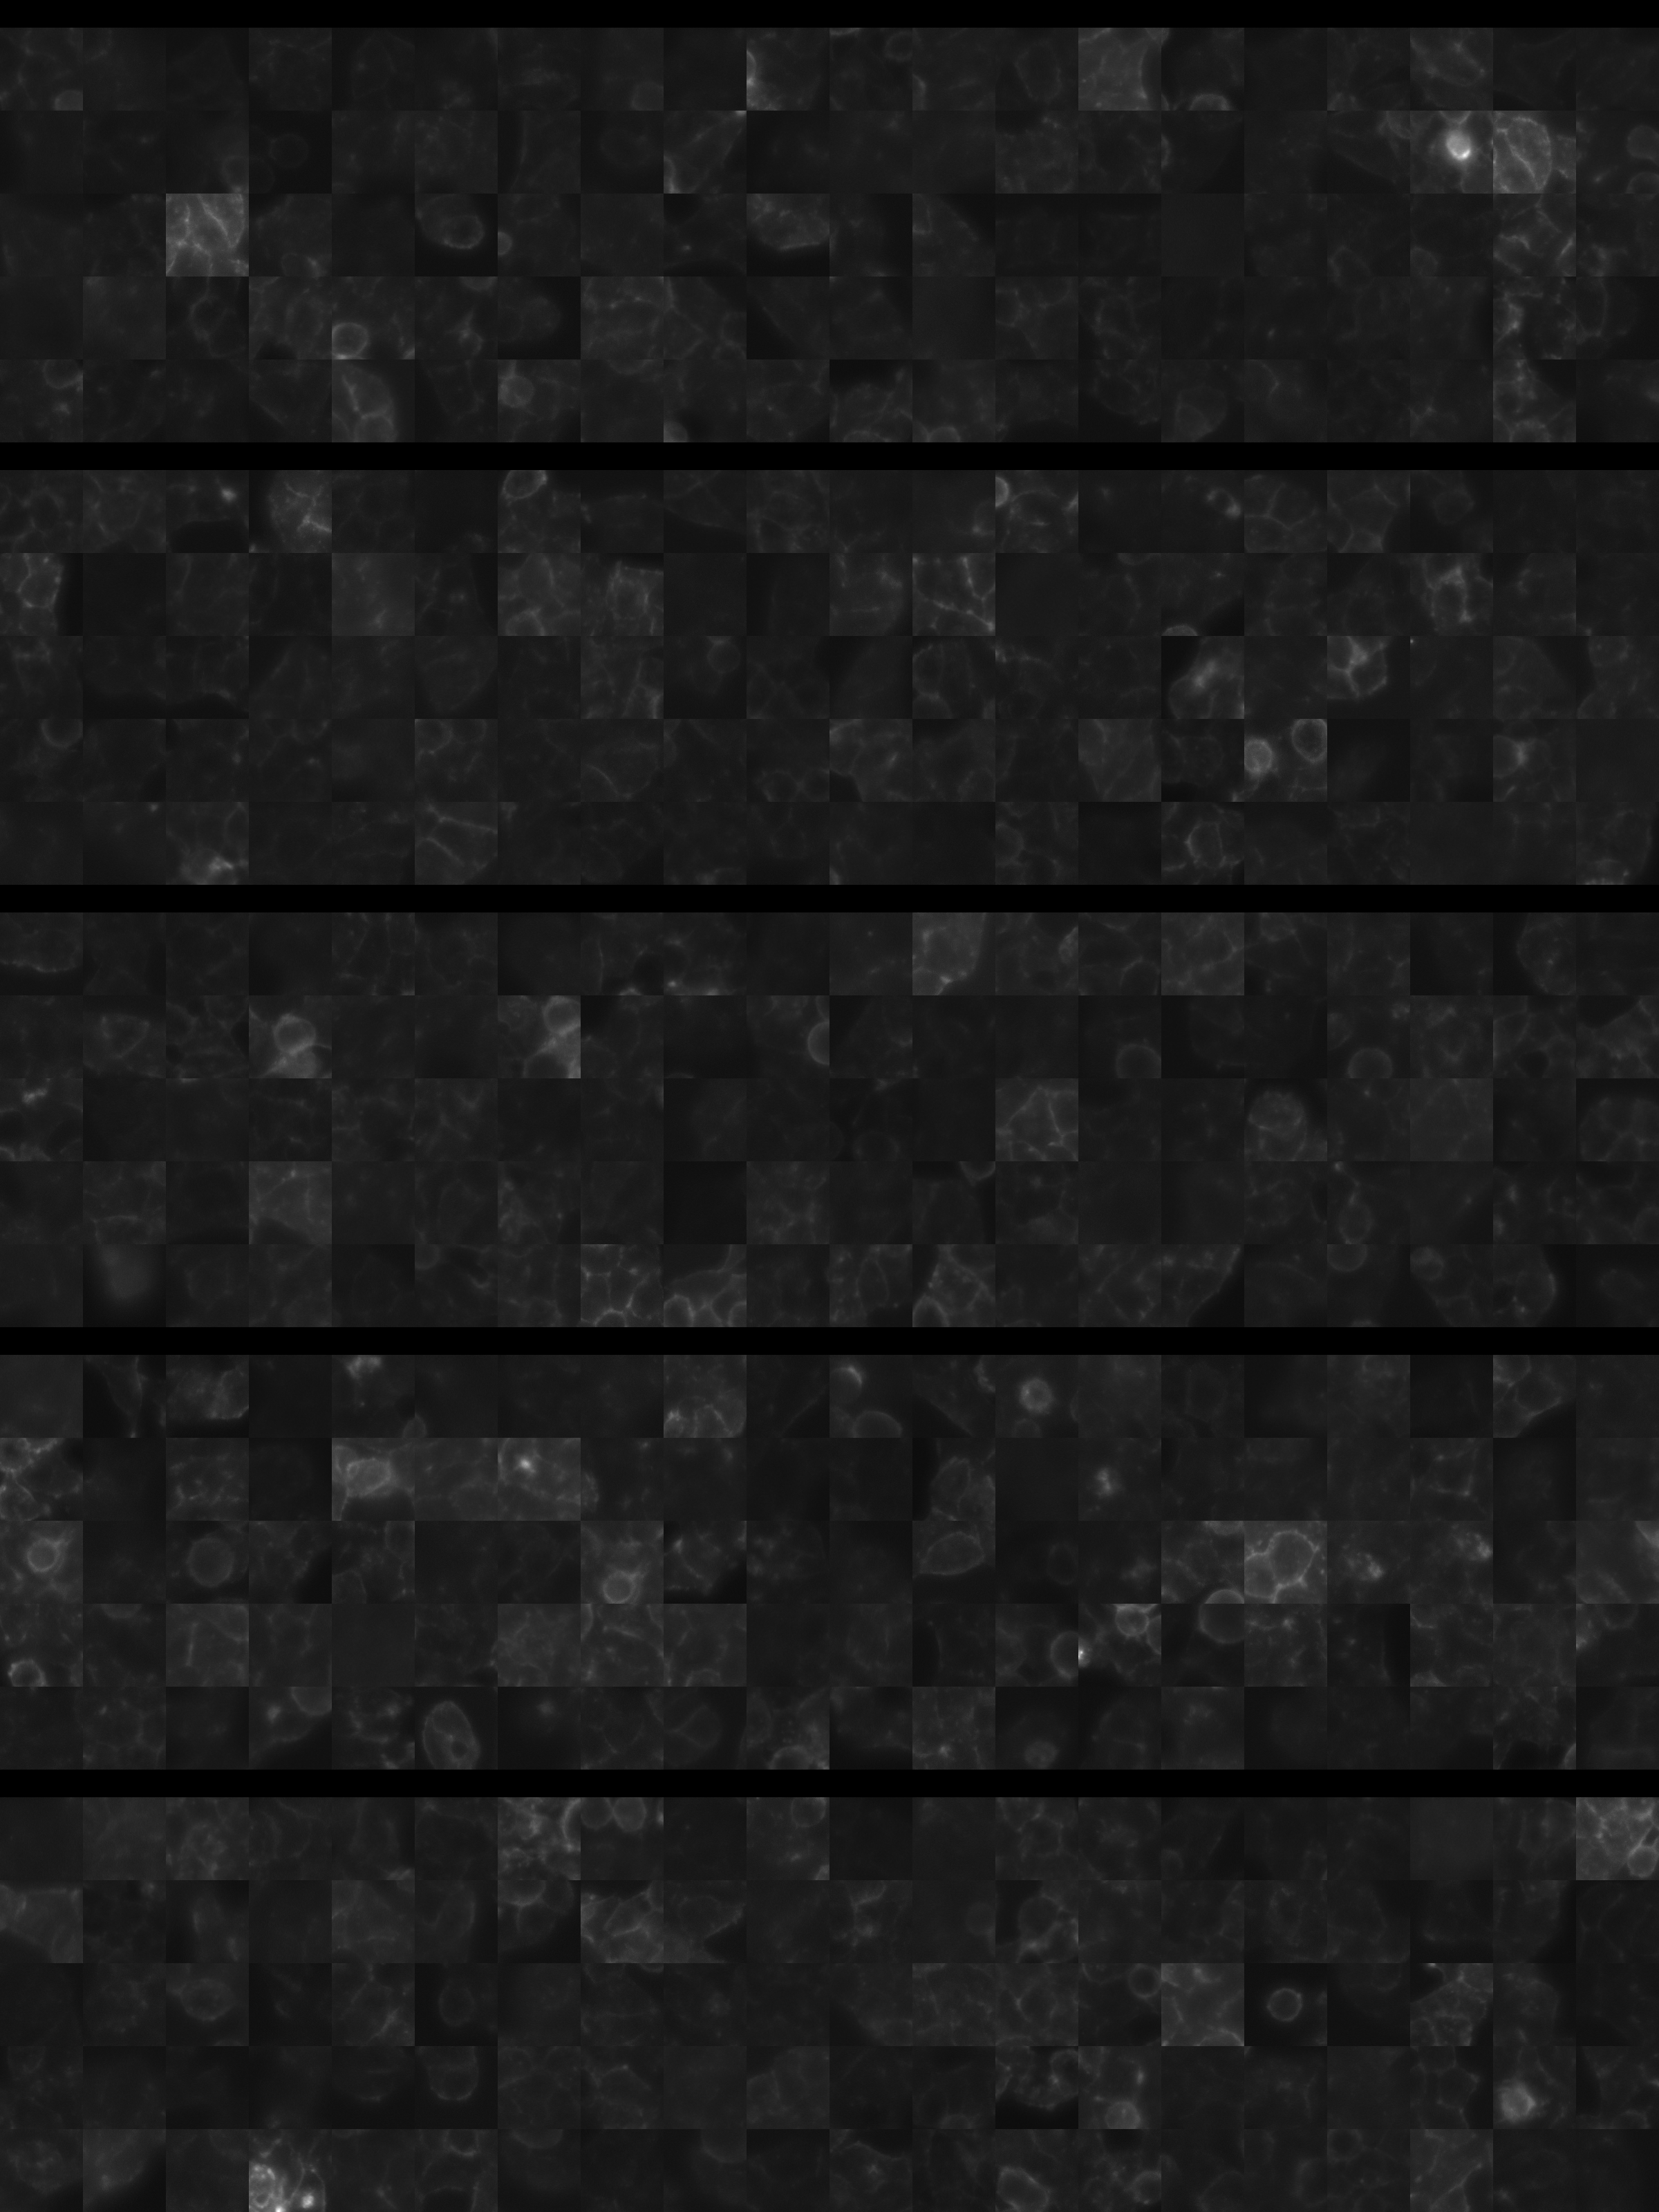
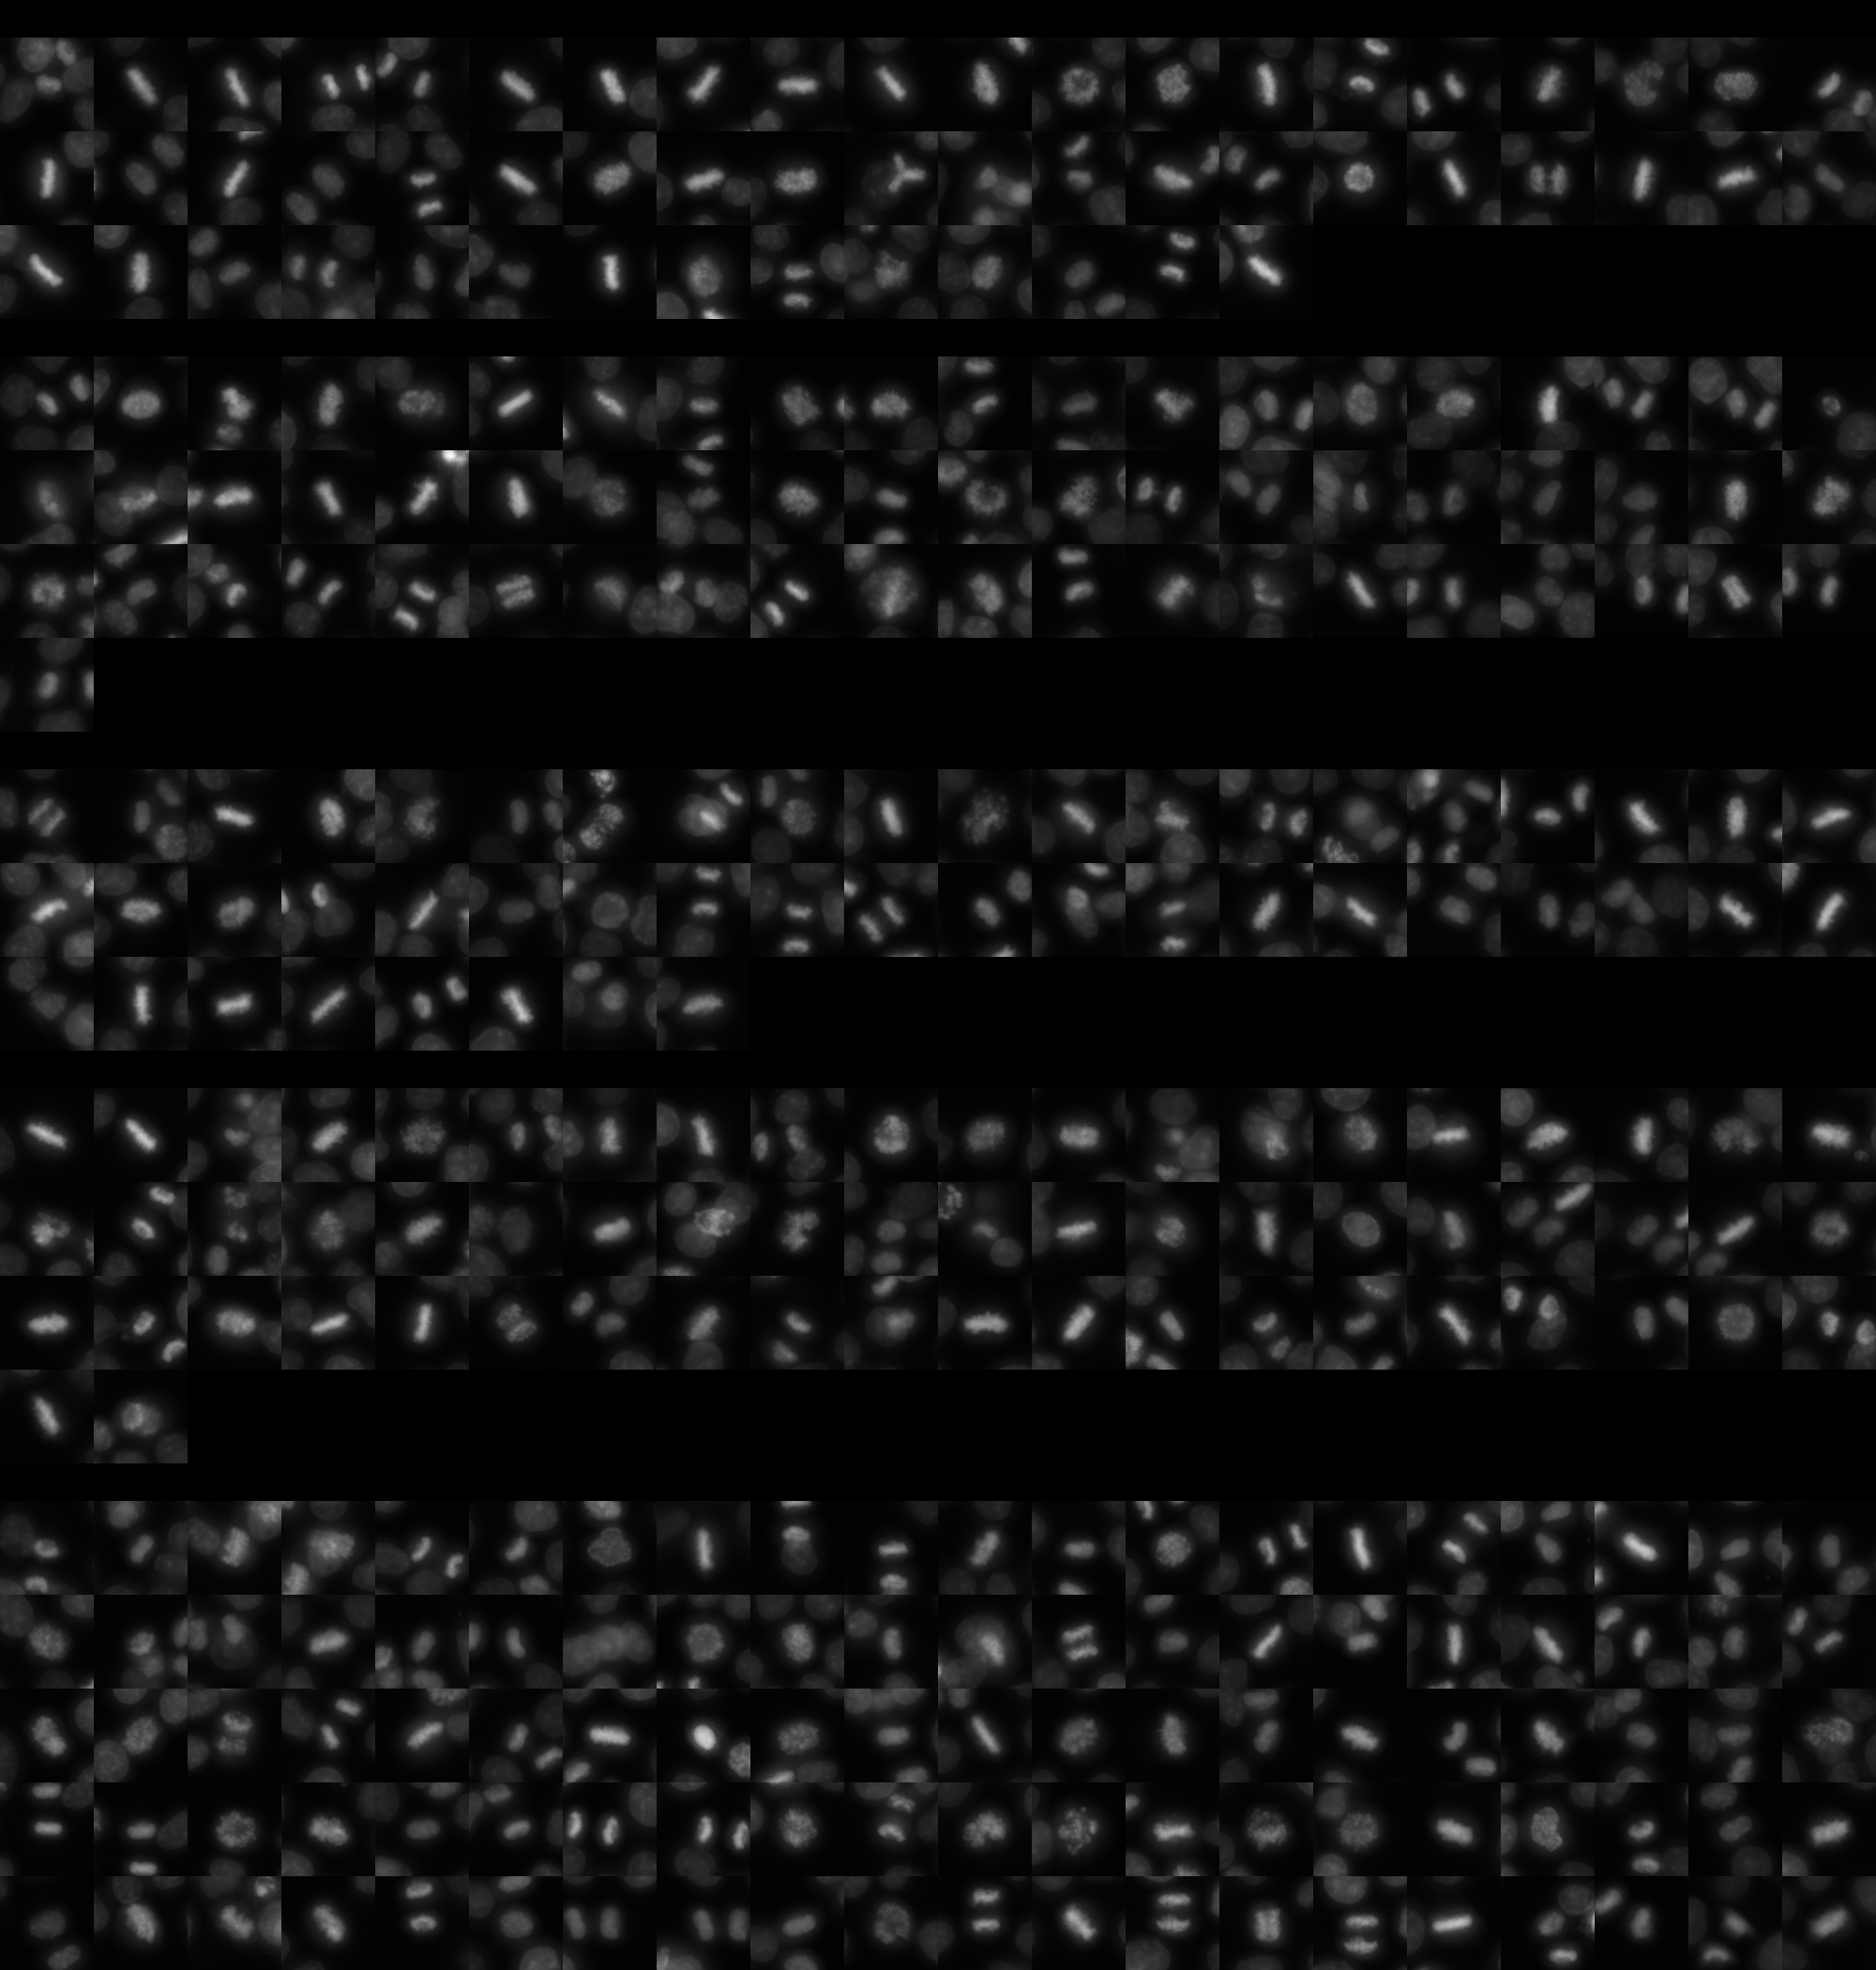
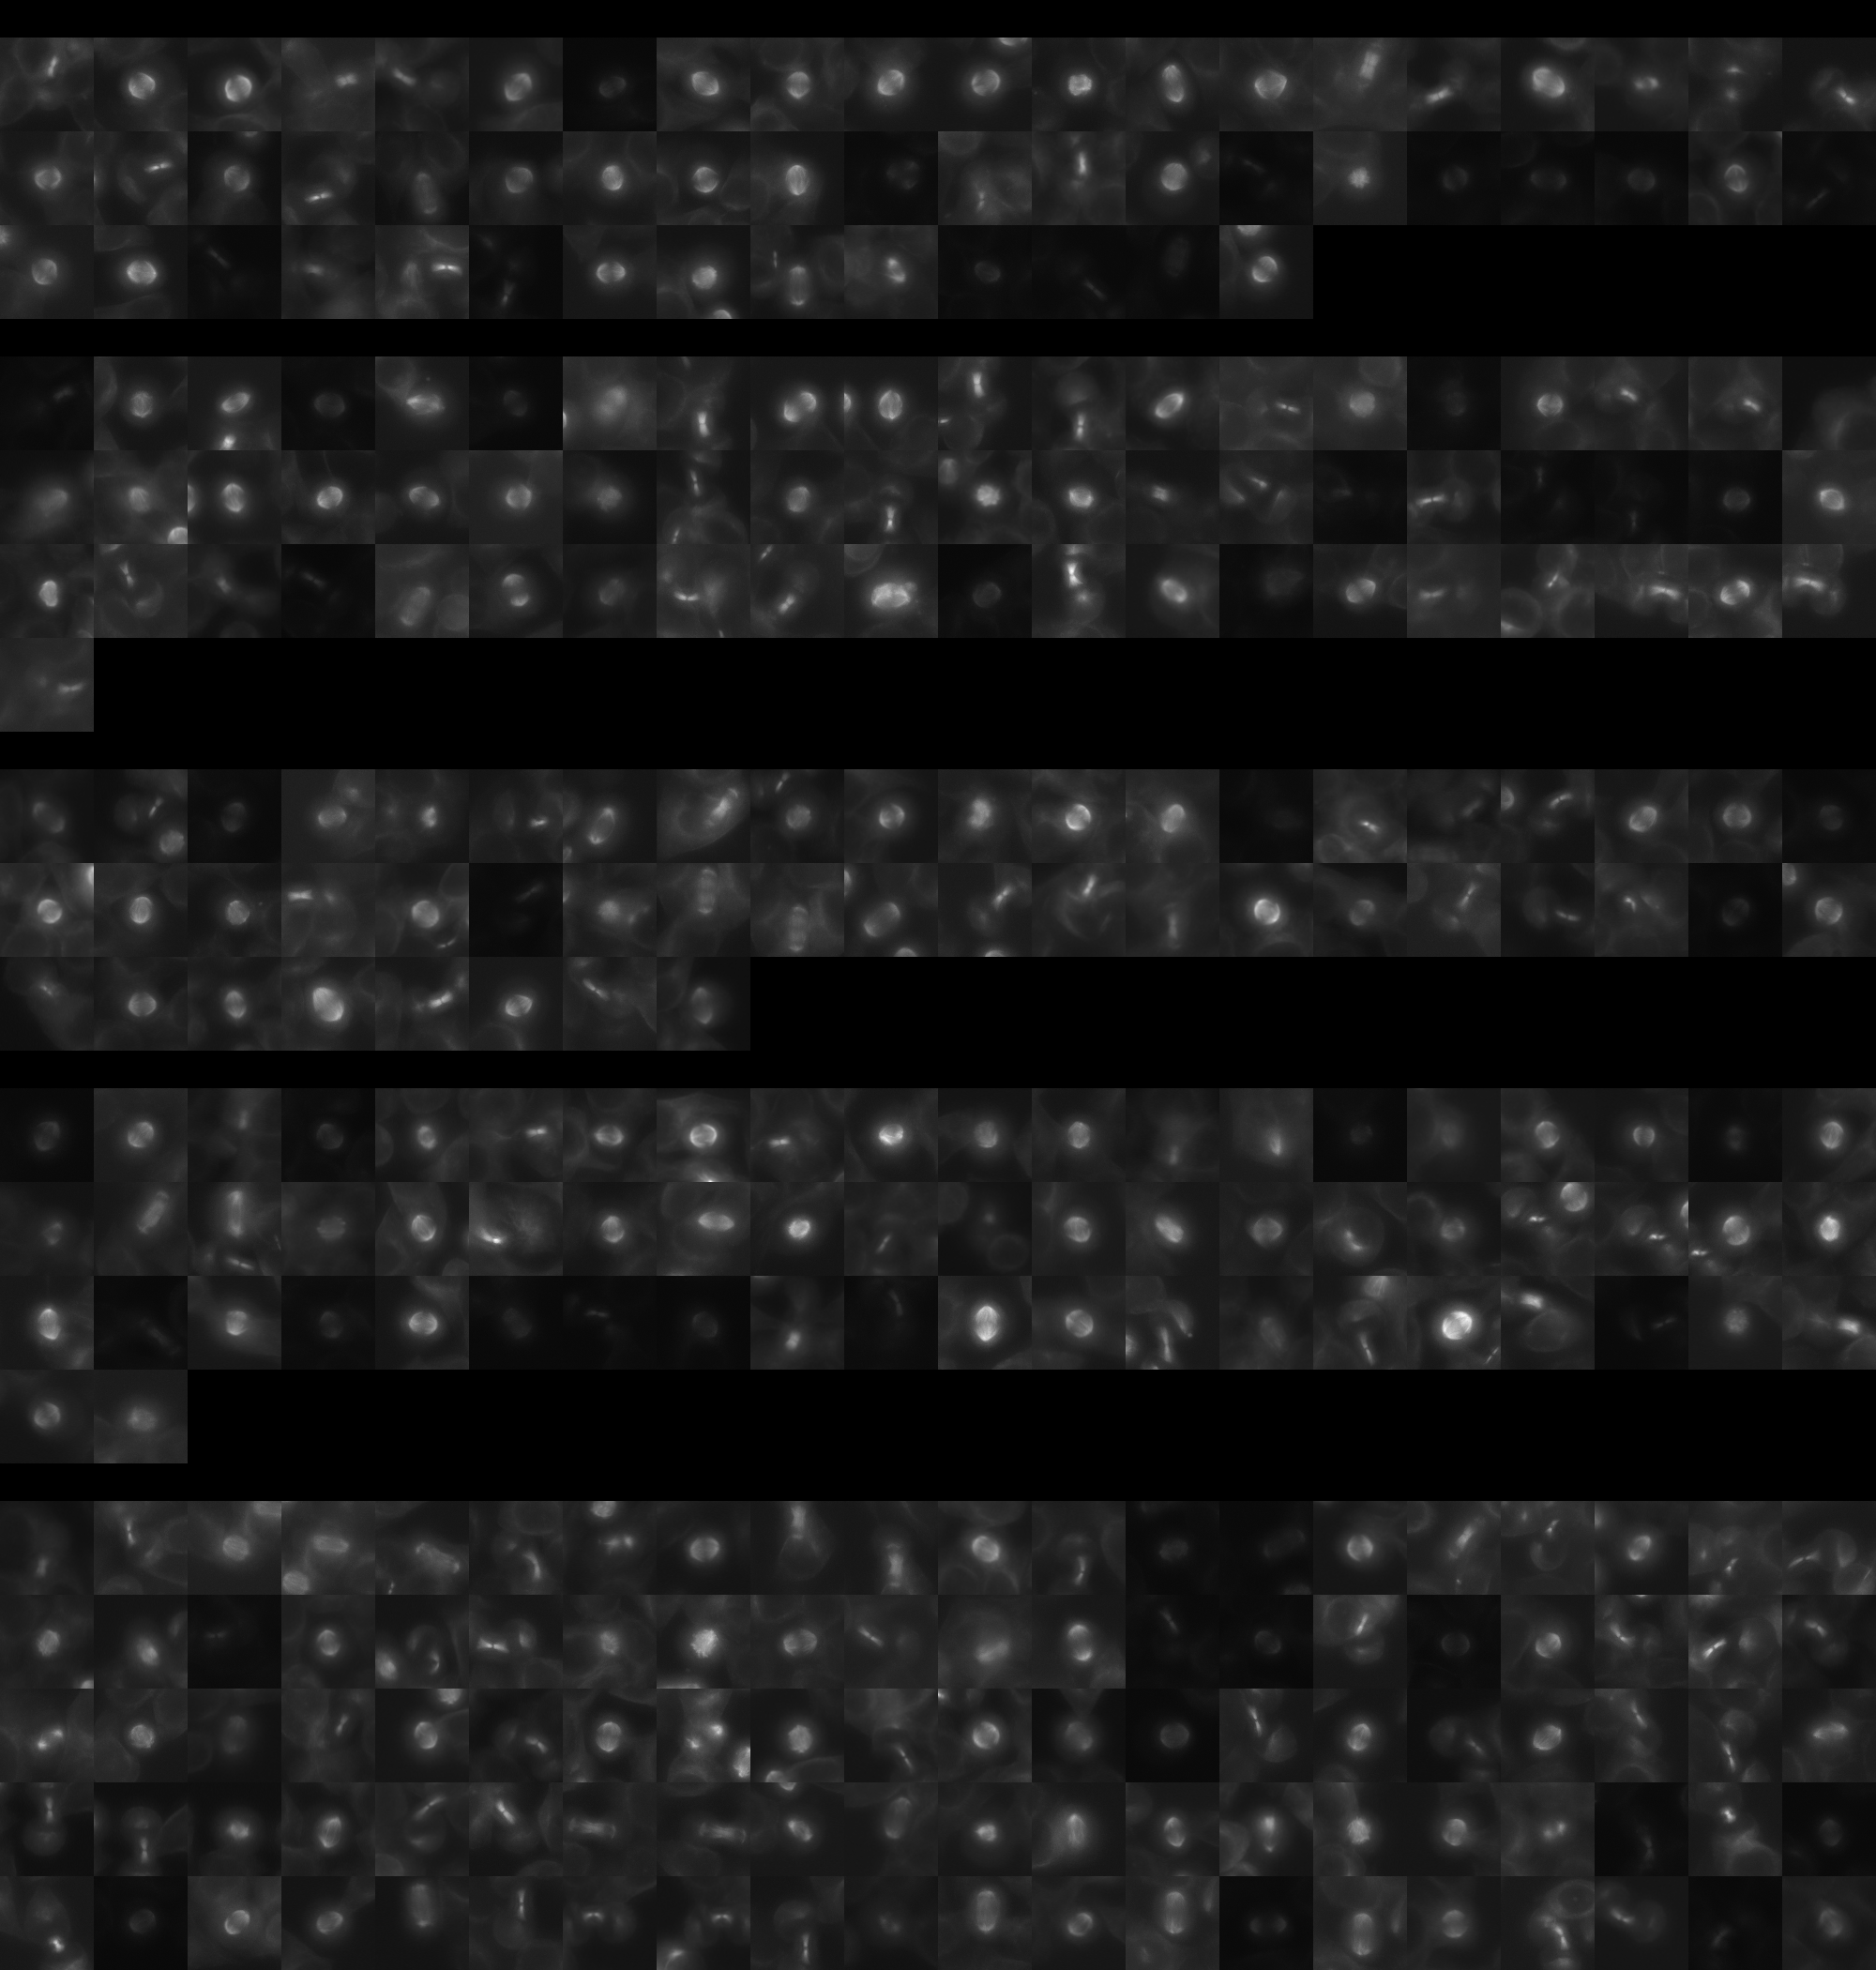
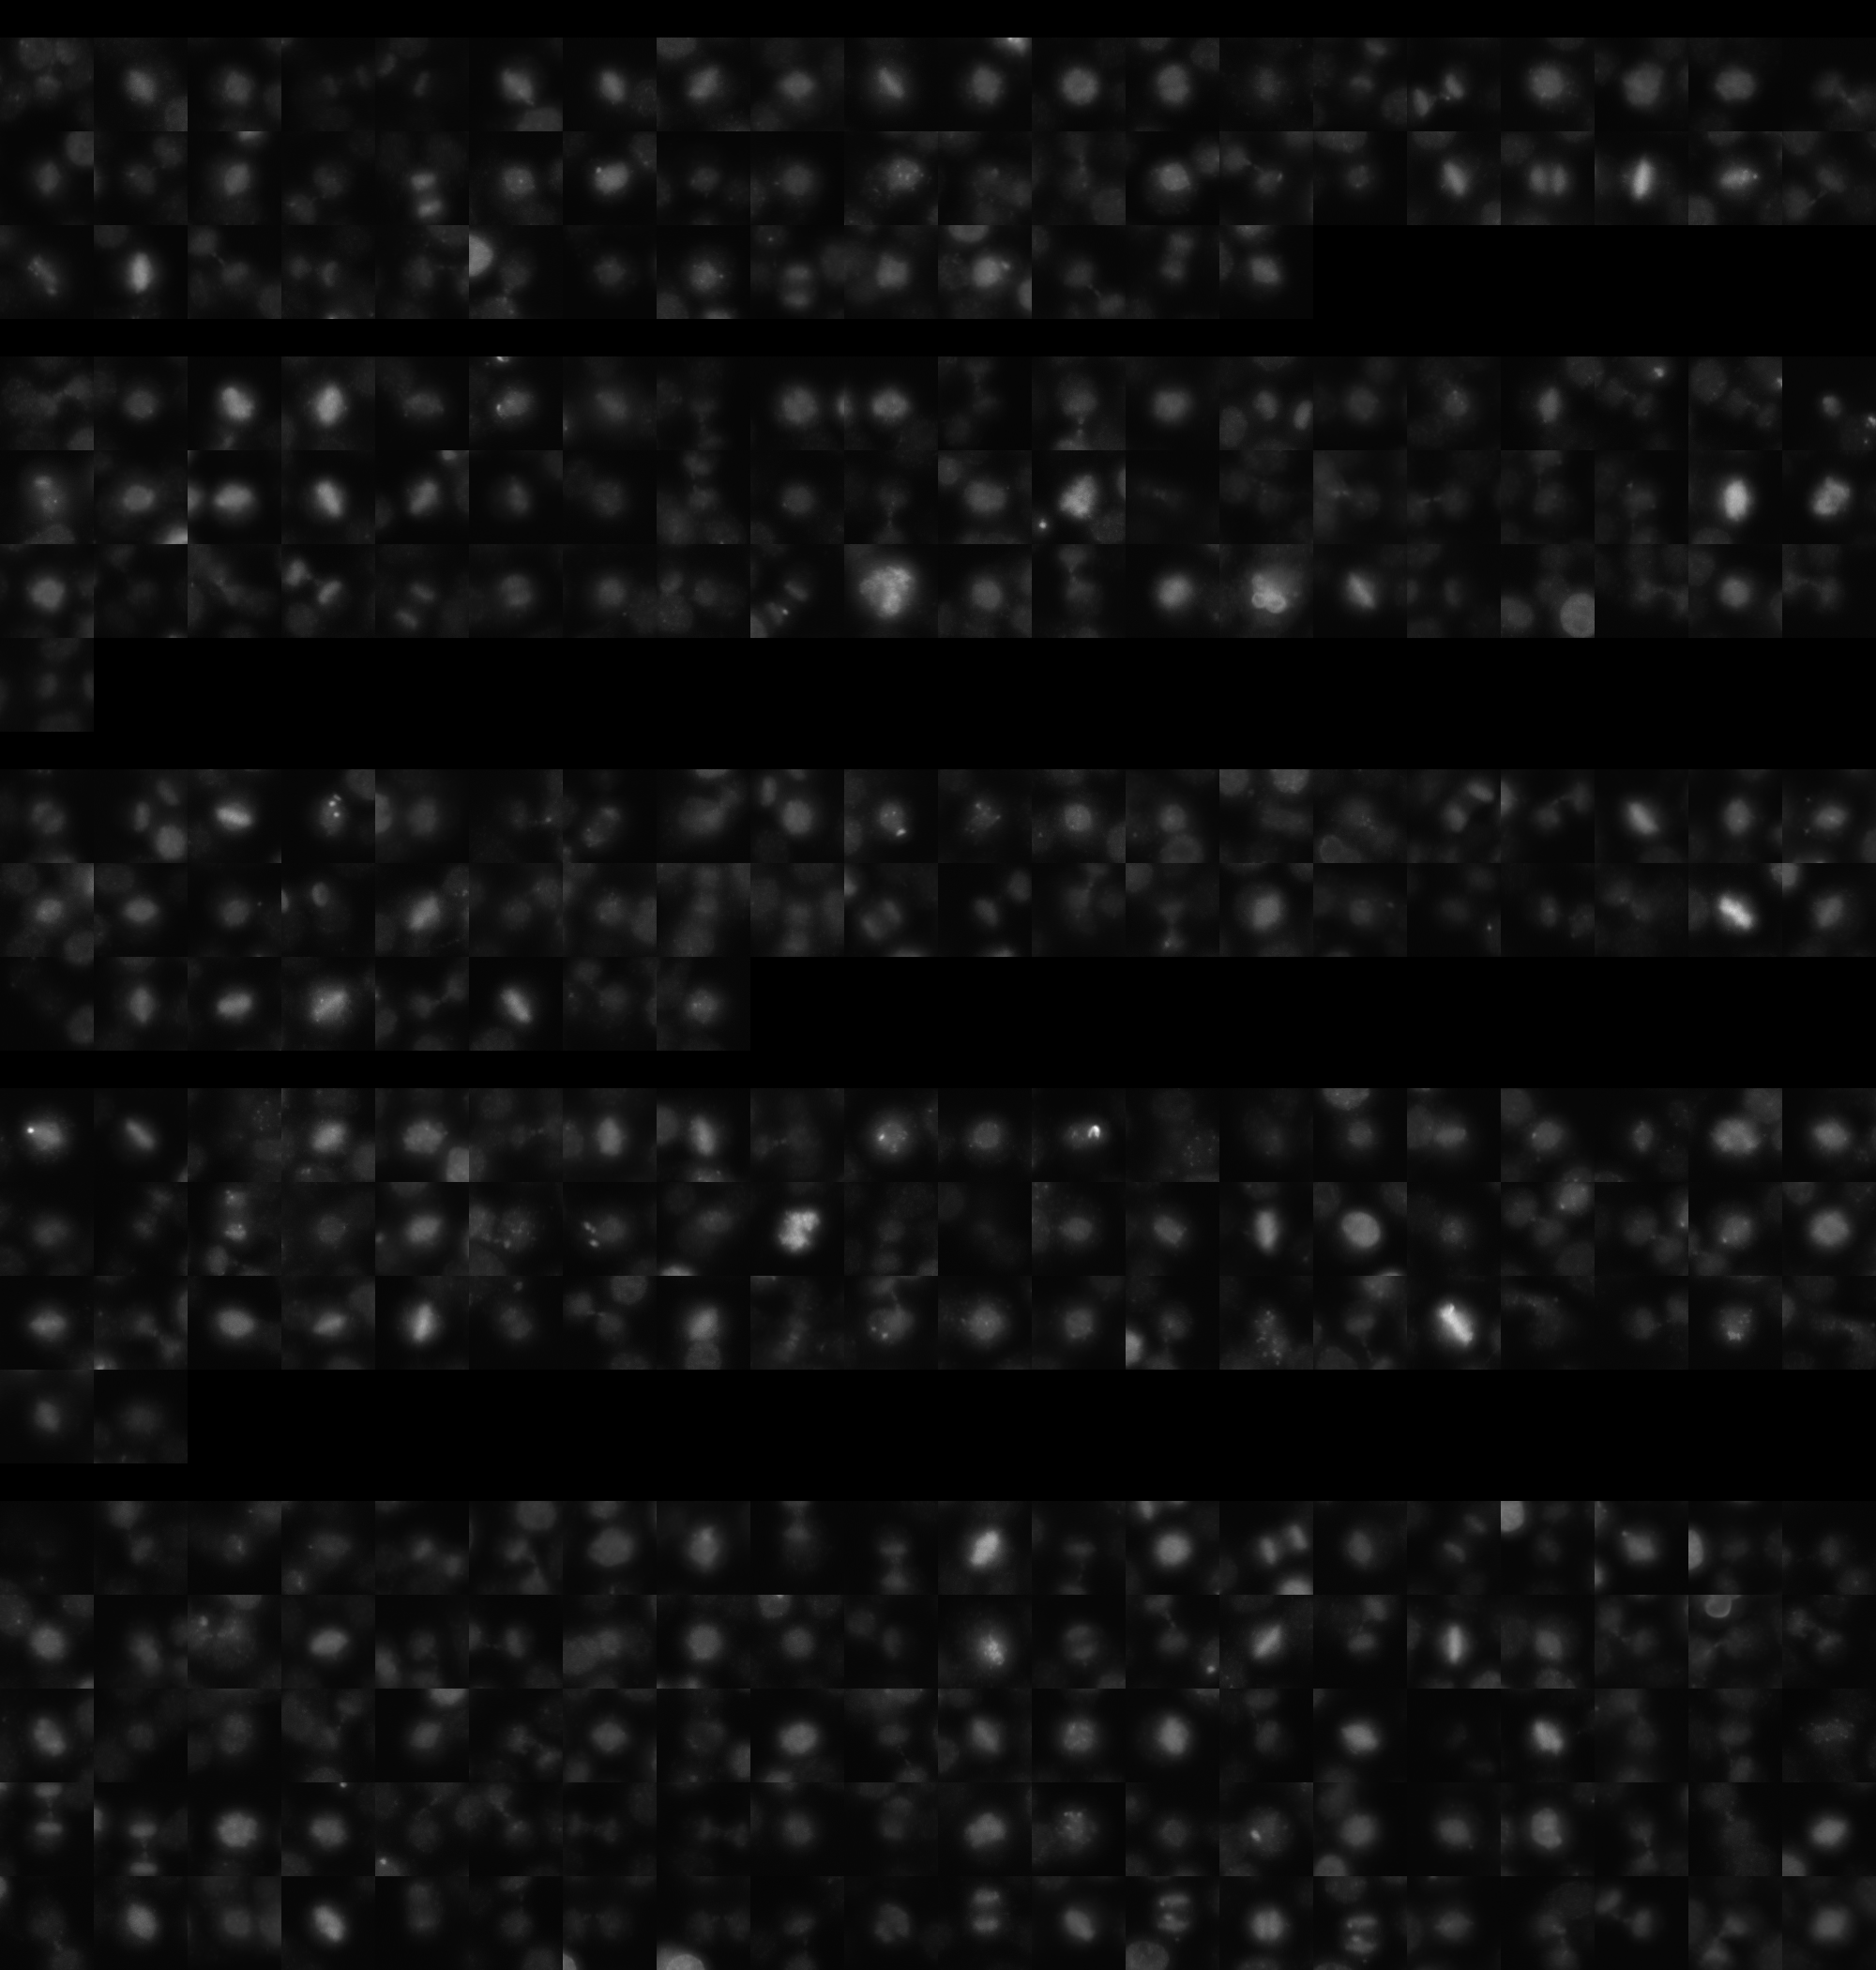
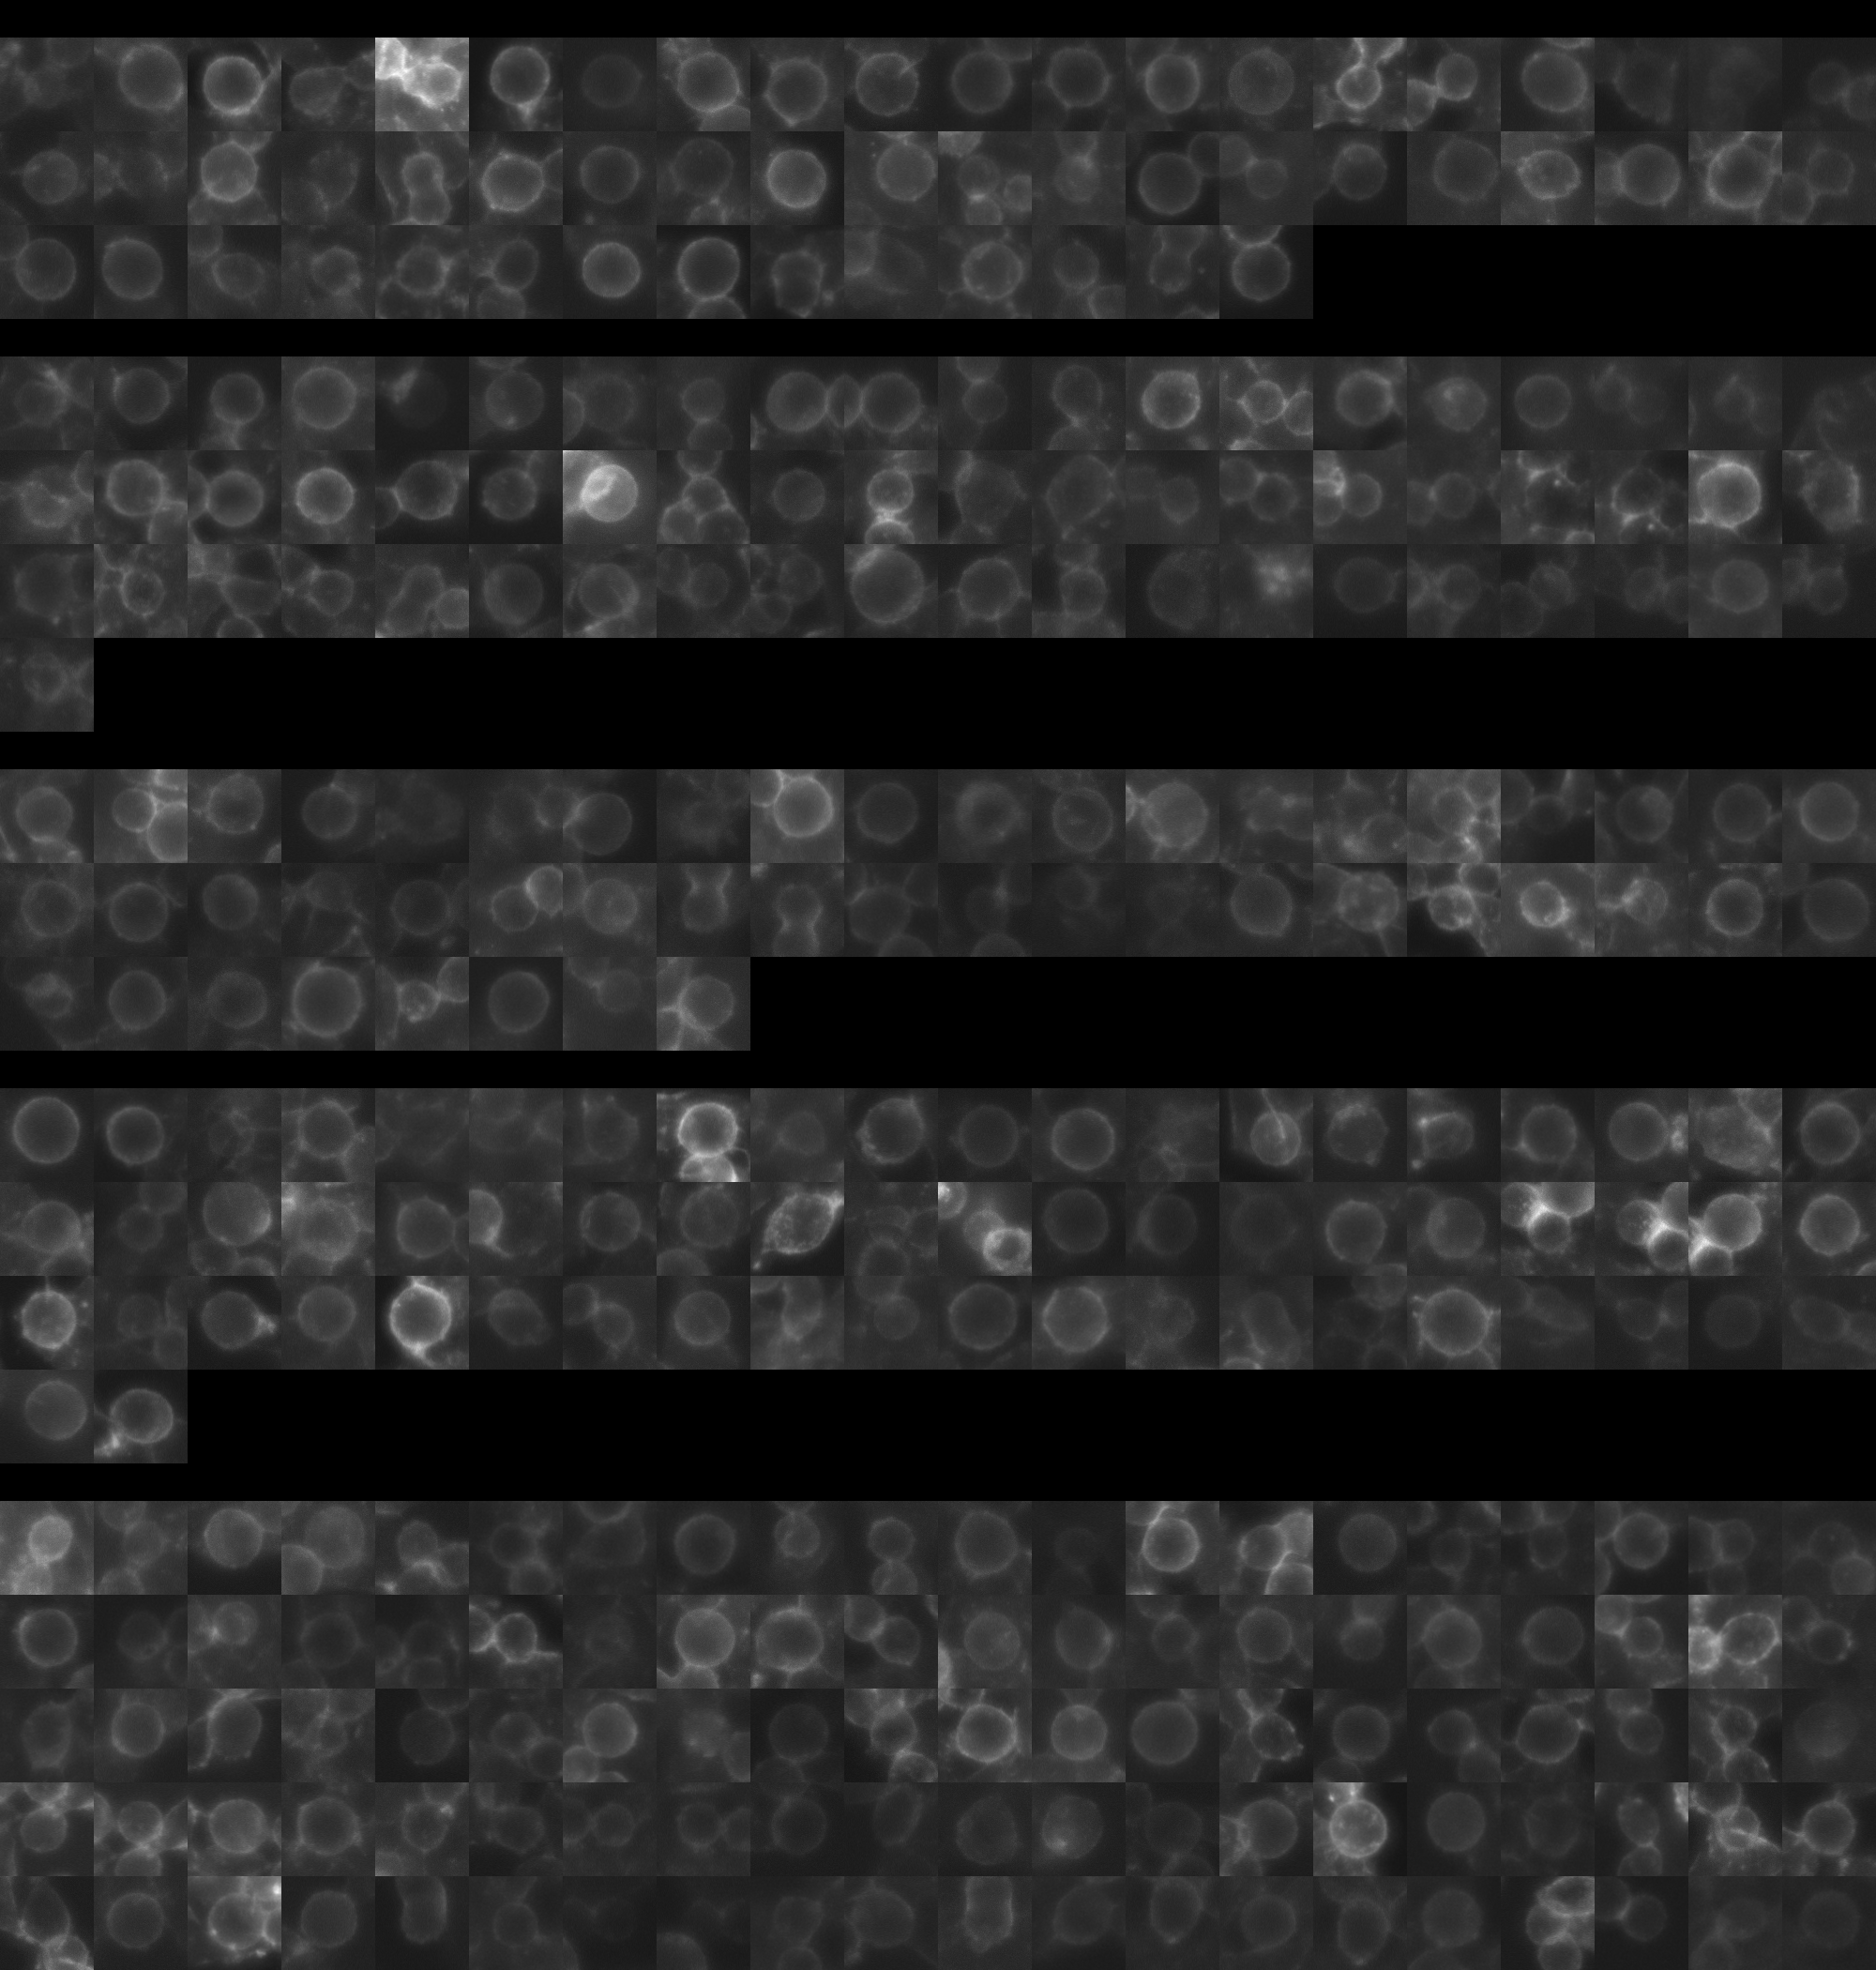
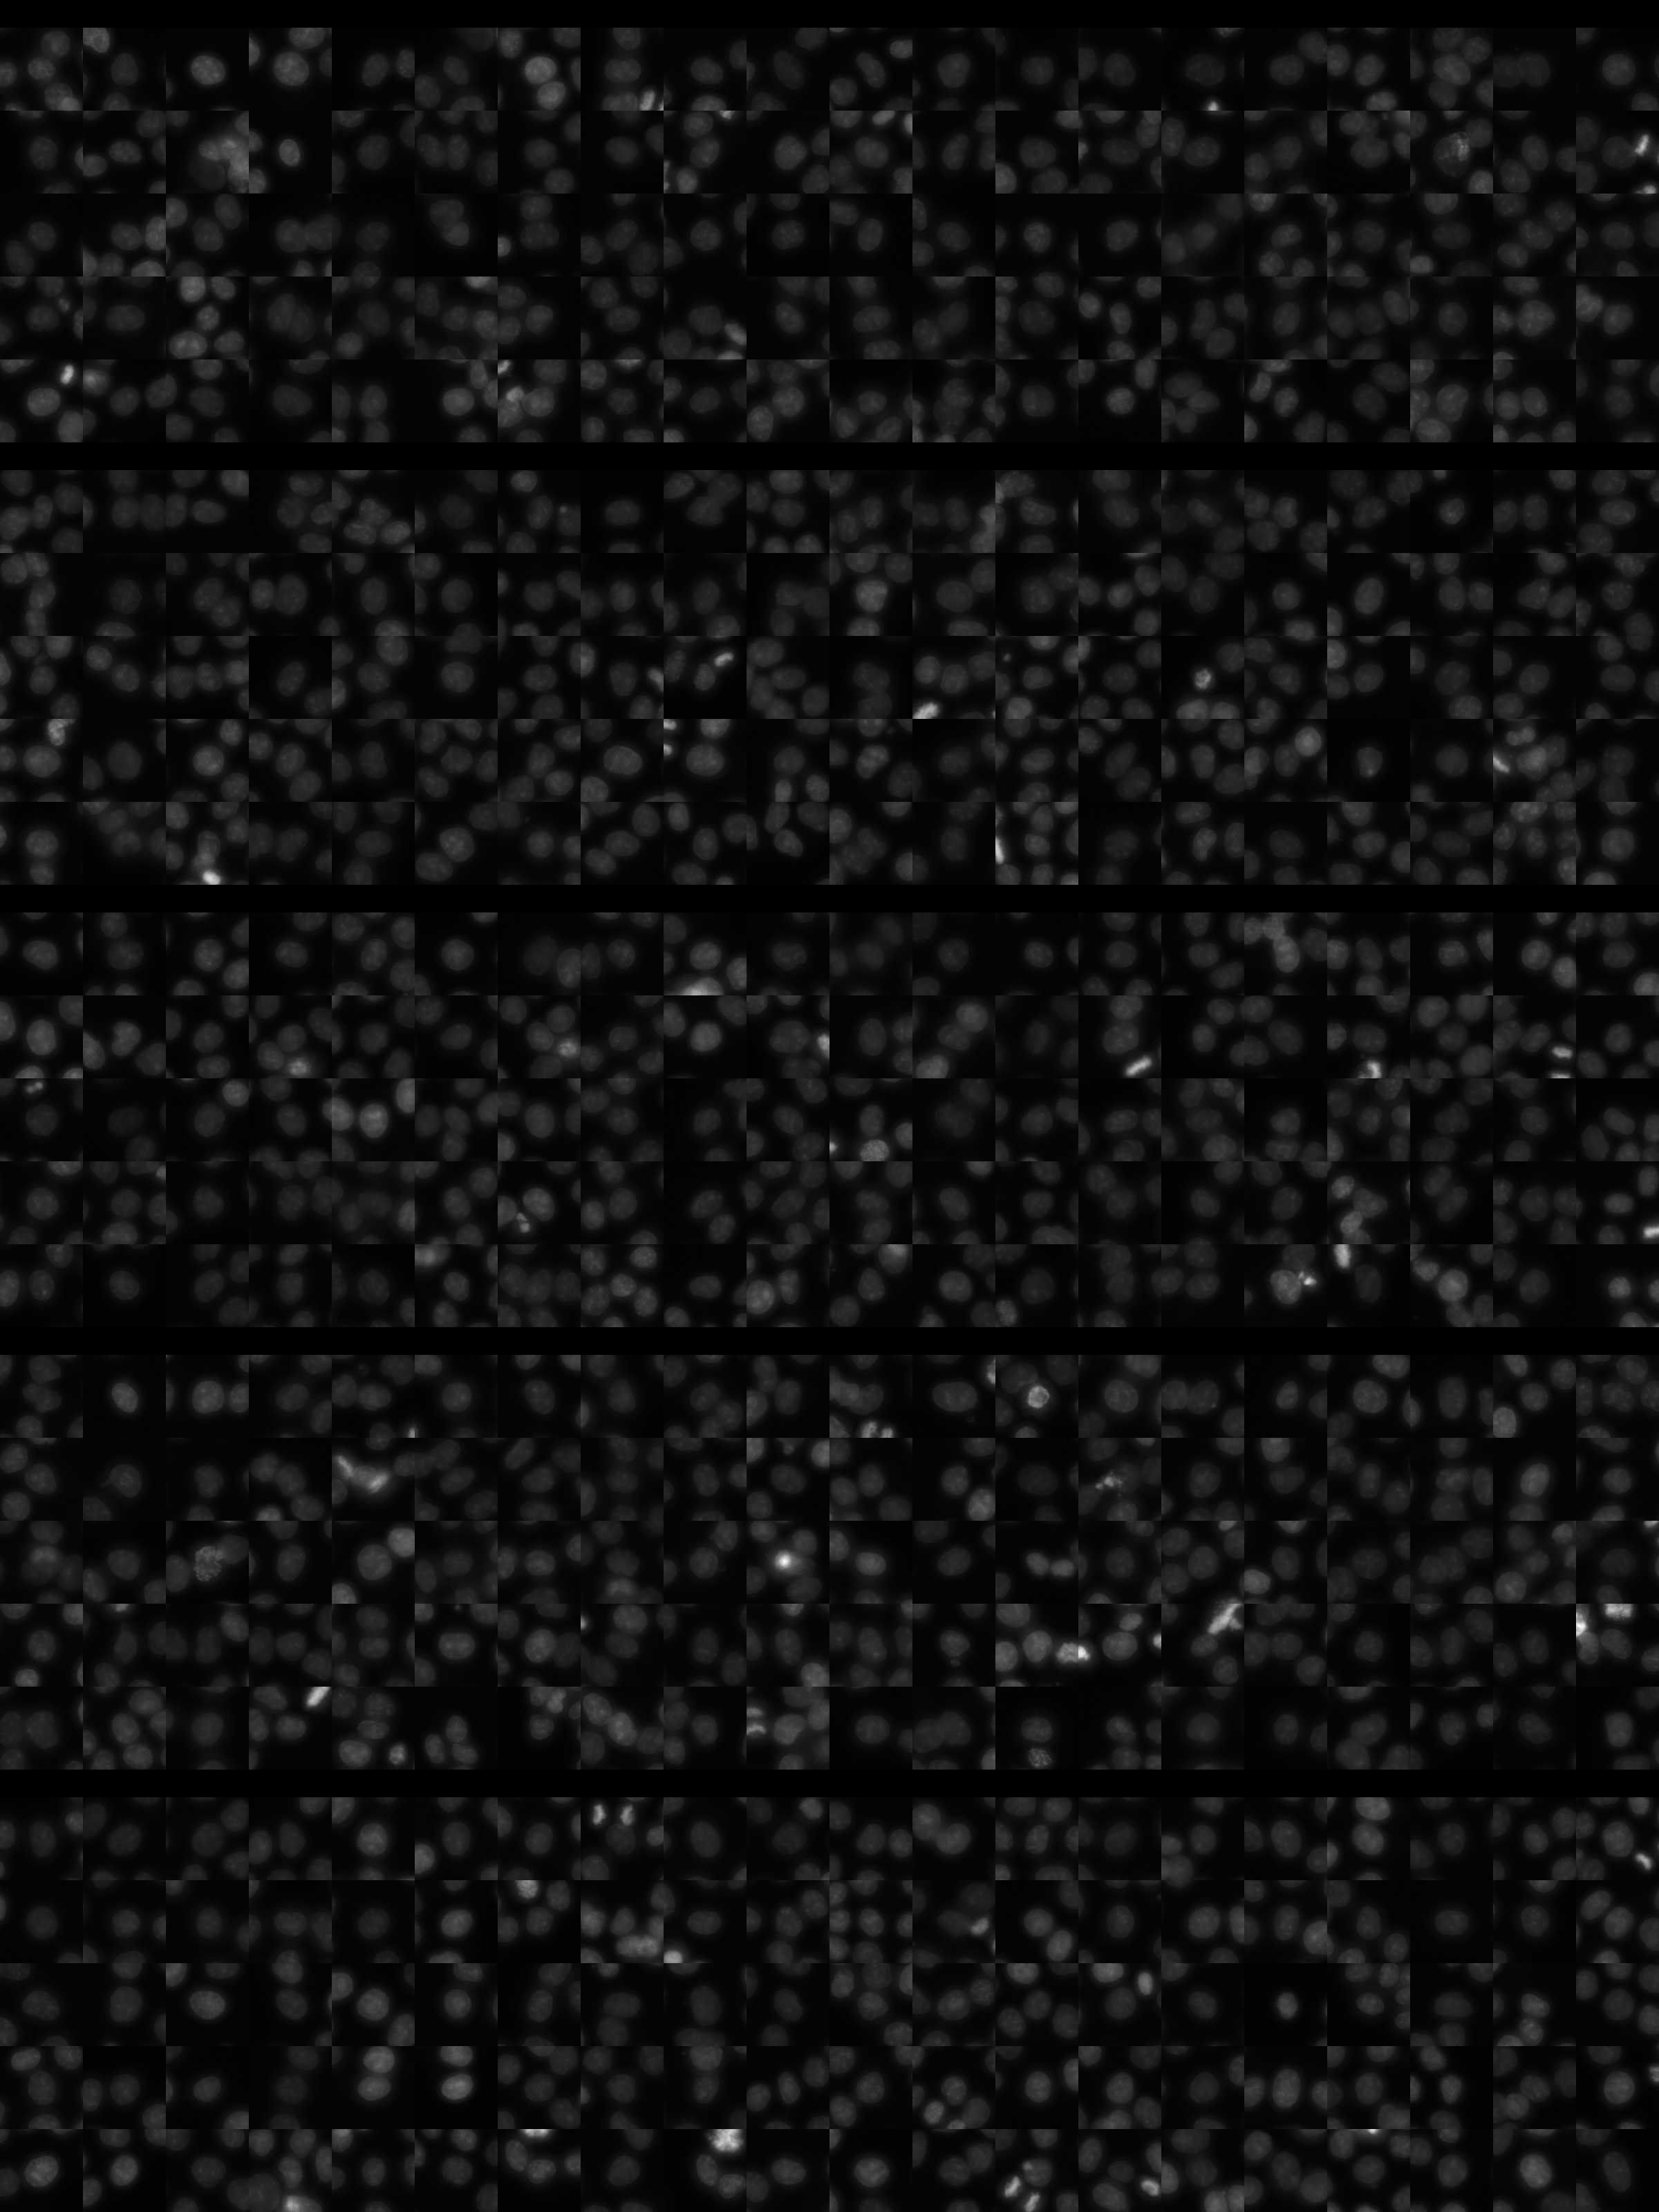
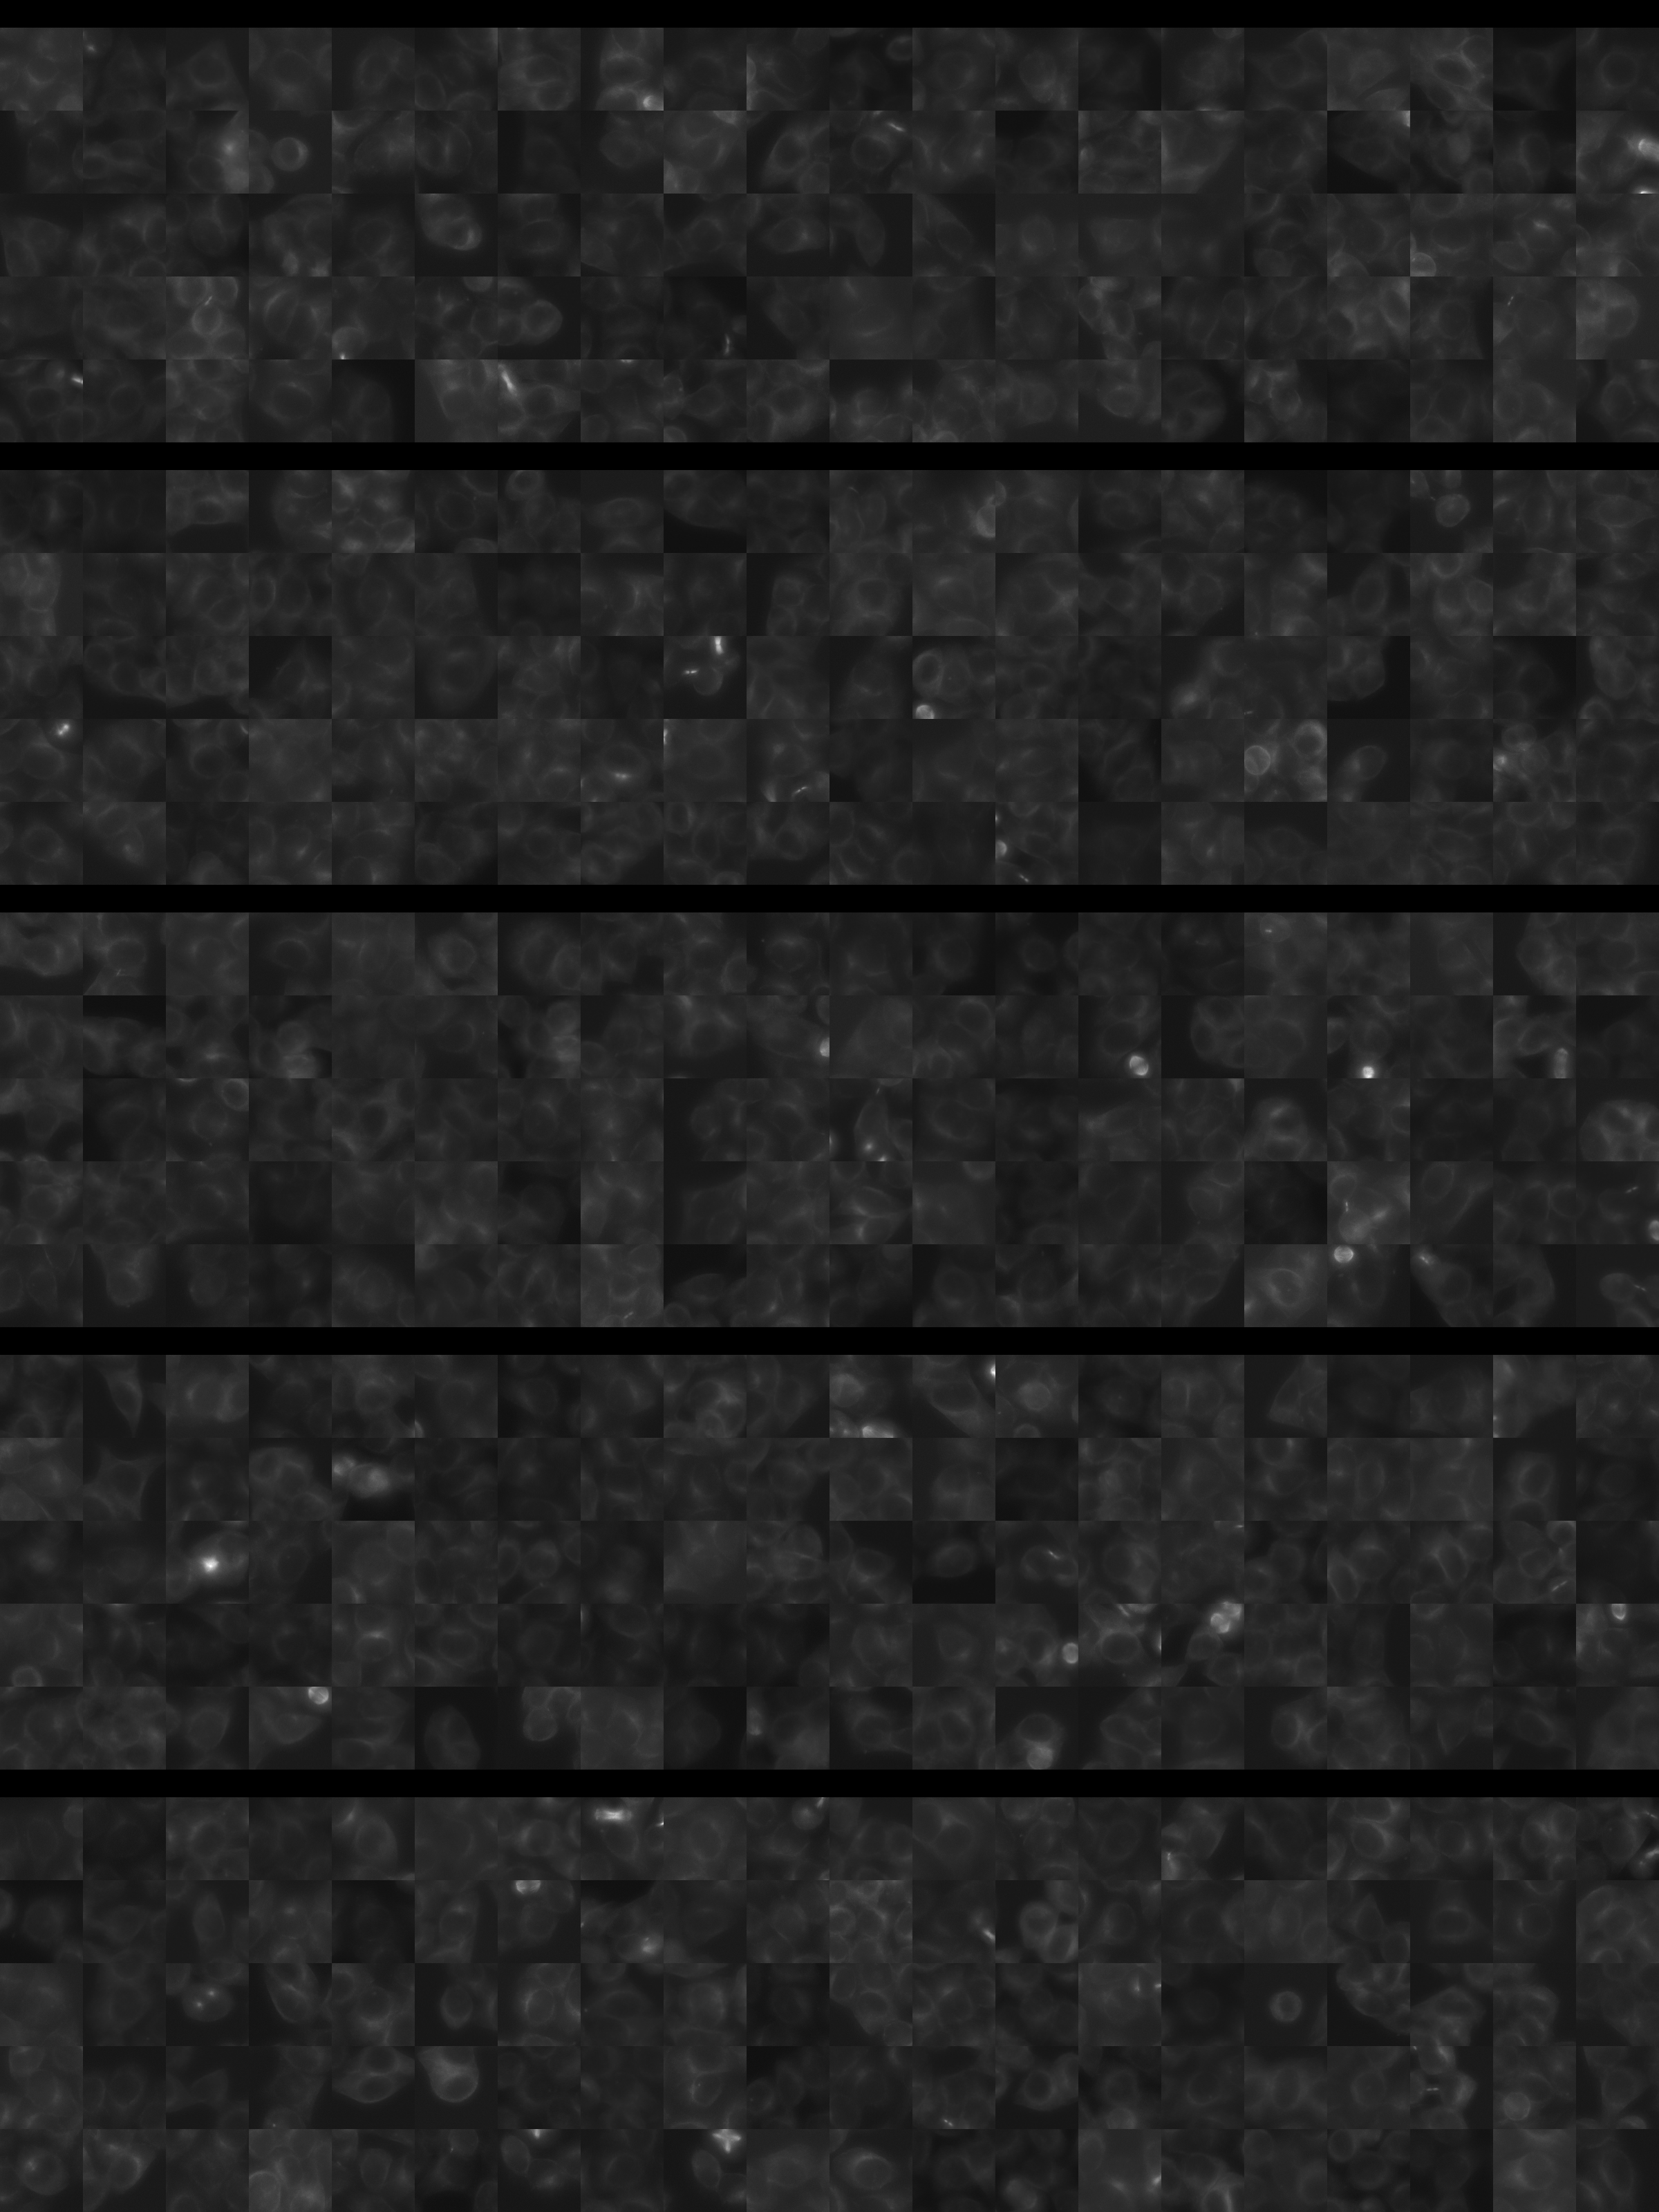
Each montage below shows randomly selected individual cell images for the same target gene separated by sgRNA, along with an example montage of cells expressing a non-targeting negative control sgRNA at the bottom. sgRNA labels in the montages correspond to the numbered sgRNA sequences in the gene info table above. The DNA (blue) and tubulin (green) channels are displayed by default, with gH2AX (grayscale) and actin (yellow) available using the check boxes. Channel brightness, contrast, and opacity are adjustable by clicking the arrow next to the channel name. When only one channel is selected, the display defaults to grayscale. Click the “Zoom” checkbox above the channel controls to enable image zooming (via scrolling) and panning (via click-and-drag).

The cell boxes displayed for this gene are square, 36.43 μm per side for the interphase montage and 30.36 μm per side for the mitotic montage.
Features

Interphase Score Rank FDR q-value
Nucleus DNA Integrated -8.148e-02 5182 of 5322 0.027
Nucleus DNA Mean -1.721e-01 5041 of 5322 1.505e-04
Nucleus gH2AX Mean 0.200 588 of 5322 1.367e-04
Nucleus DNA - gH2AX Correlation -3.882e-01 5306 of 5322 1.021e-04
Nucleus Shape Area 0.067 1251 of 5322 0.202
Nucleus Shape Eccentricity 0.230 11 of 5322 4.529e-04
Nucleus Shape Form Factor -2.027e-01 5196 of 5322 2.872e-04
Nucleus Shape Solidity -2.255e-01 5173 of 5322 1.903e-04
Cell DNA Mass Displacement 0.207 27 of 5322 0.001
Cell Tubulin Mean 0.033 1563 of 5322 0.400
Cell Tubulin Mass Displacement 0.080 273 of 5322 0.007
Cell Actin Mean -4.267e-03 3134 of 5322 0.971
Cell Tubulin - Actin Correlation -1.485e-01 5292 of 5322 2.896e-04
Cell DNA - Tubulin Correlation -3.510e-01 5315 of 5322 1.948e-04
Cell Shape Area -1.139e-01 4840 of 5322 0.002
Cell Shape Eccentricity 0.089 88 of 5322 0.046
Mitotic Score Rank FDR q-value
Nucleus DNA Integrated 0.083 2734 of 5322 0.965
Nucleus DNA Mean 0.186 674 of 5322 1.000
Nucleus DNA Mass Displacement -9.499e-02 4672 of 5322 0.999
Nucleus DNA Mean Frac 3 0.041 2474 of 5322 1.000
Nucleus gH2AX Mean 0.191 795 of 5322 1.000
Nucleus gH2AX Mean Frac 0 -7.011e-03 2387 of 5322 1.000
Nucleus Tubulin Mean Frac 0 -4.698e-02 4132 of 5322 0.999
Nucleus Tubulin Mean Edge 0.258 466 of 5322 0.853
Nucleus Tubulin Std Edge 0.316 136 of 5322 0.574
Nucleus Shape Area -2.866e-02 4252 of 5322 0.990
Nucleus Shape Eccentricity 0.206 212 of 5322 1.000
Nucleus Shape Form Factor -2.787e-01 4695 of 5322 0.871
Cell Tubulin Mean 0.202 954 of 5322 0.975
Cell Tubulin Mean Frac 3 -1.699e-01 3751 of 5322 0.999
Cell Actin Mean 0.201 894 of 5322 0.997
Cell Shape Area 0.196 1431 of 5322 0.994
( Reset Zoom )
Brightness
Contrast
Opacity
Brightness
Contrast
Opacity
Brightness
Contrast
Opacity
Brightness
Contrast
Opacity
Brightness
Contrast
Opacity

( Reset Zoom )
Brightness
Contrast
Opacity
Brightness
Contrast
Opacity
Brightness
Contrast
Opacity
Brightness
Contrast
Opacity
Brightness
Contrast
Opacity

MIT Central Accessability