MAPK15

Gene symbol: MAPK15
Gene: 225689
Uniprot Function: Atypical MAPK protein that regulates several process such as autophagy, ciliogenesis, protein trafficking/secretion and genome integrity, in a kinase activity-dependent manner (PubMed:22948227, PubMed:24618899, PubMed:29021280, PubMed:21847093, PubMed:20733054). Controls both, basal and starvation-induced autophagy throught its interaction with GABARAP, MAP1LC3B and GABARAPL1 leading to autophagosome formation, SQSTM1 degradation and reduced MAP1LC3B inhibitory phosphorylation (PubMed:22948227). Regulates primary cilium formation and the localization of ciliary proteins involved in cilium structure, transport, and signaling (PubMed:29021280). Prevents the relocation of the sugar-adding enzymes from the Golgi to the endoplasmic reticulum, thereby restricting the production of sugar-coated proteins (PubMed:24618899). Upon amino-acid starvation, mediates transitional endoplasmic reticulum site disassembly and inhibition of secretion (PubMed:21847093). Binds to chromatin leading to MAPK15 activation and interaction with PCNA, that which protects genomic integrity by inhibiting MDM2-mediated degradation of PCNA (PubMed:20733054). Regulates DA transporter (DAT) activity and protein expression via activation of RhoA (PubMed:28842414). In response to H(2)O(2) treatment phosphorylates ELAVL1, thus preventing it from binding to the PDCD4 3'UTR and rendering the PDCD4 mRNA accessible to miR-21 and leading to its degradation and loss of protein expression (PubMed:26595526). Also functions in a kinase activity-independent manner as a negative regulator of growth (By similarity). Phosphorylates in vitro FOS and MBP (PubMed:11875070, PubMed:16484222, PubMed:20638370, PubMed:19166846). During oocyte maturation, plays a key role in the microtubule organization and meiotic cell cycle progression in oocytes, fertilized eggs, and early embryos (By similarity). Interacts with ESRRA promoting its re-localization from the nucleus to the cytoplasm and then prevents its transcriptional activity (PubMed:21190936).
Mitotic Index 0.0226
Interphase Cluster: #89 (25 genes)
Mitotic Cluster: #13 (43 genes)
sgRNA 1: CCCTGGGCGACCTCCCCGAG (interphase cells: 1235, mitotic cells: 30)
sgRNA 2: CTCGTGCCCACTCGTCGCTG (interphase cells: 965, mitotic cells: 16)
sgRNA 3: GATCCGGGCAGAGAACGACA (interphase cells: 1409, mitotic cells: 34)
sgRNA 4: GGTATCTCCGGACAATGCGA (interphase cells: 460, mitotic cells: 14)

Interphase Cluster

Mitotic Cluster

Overview

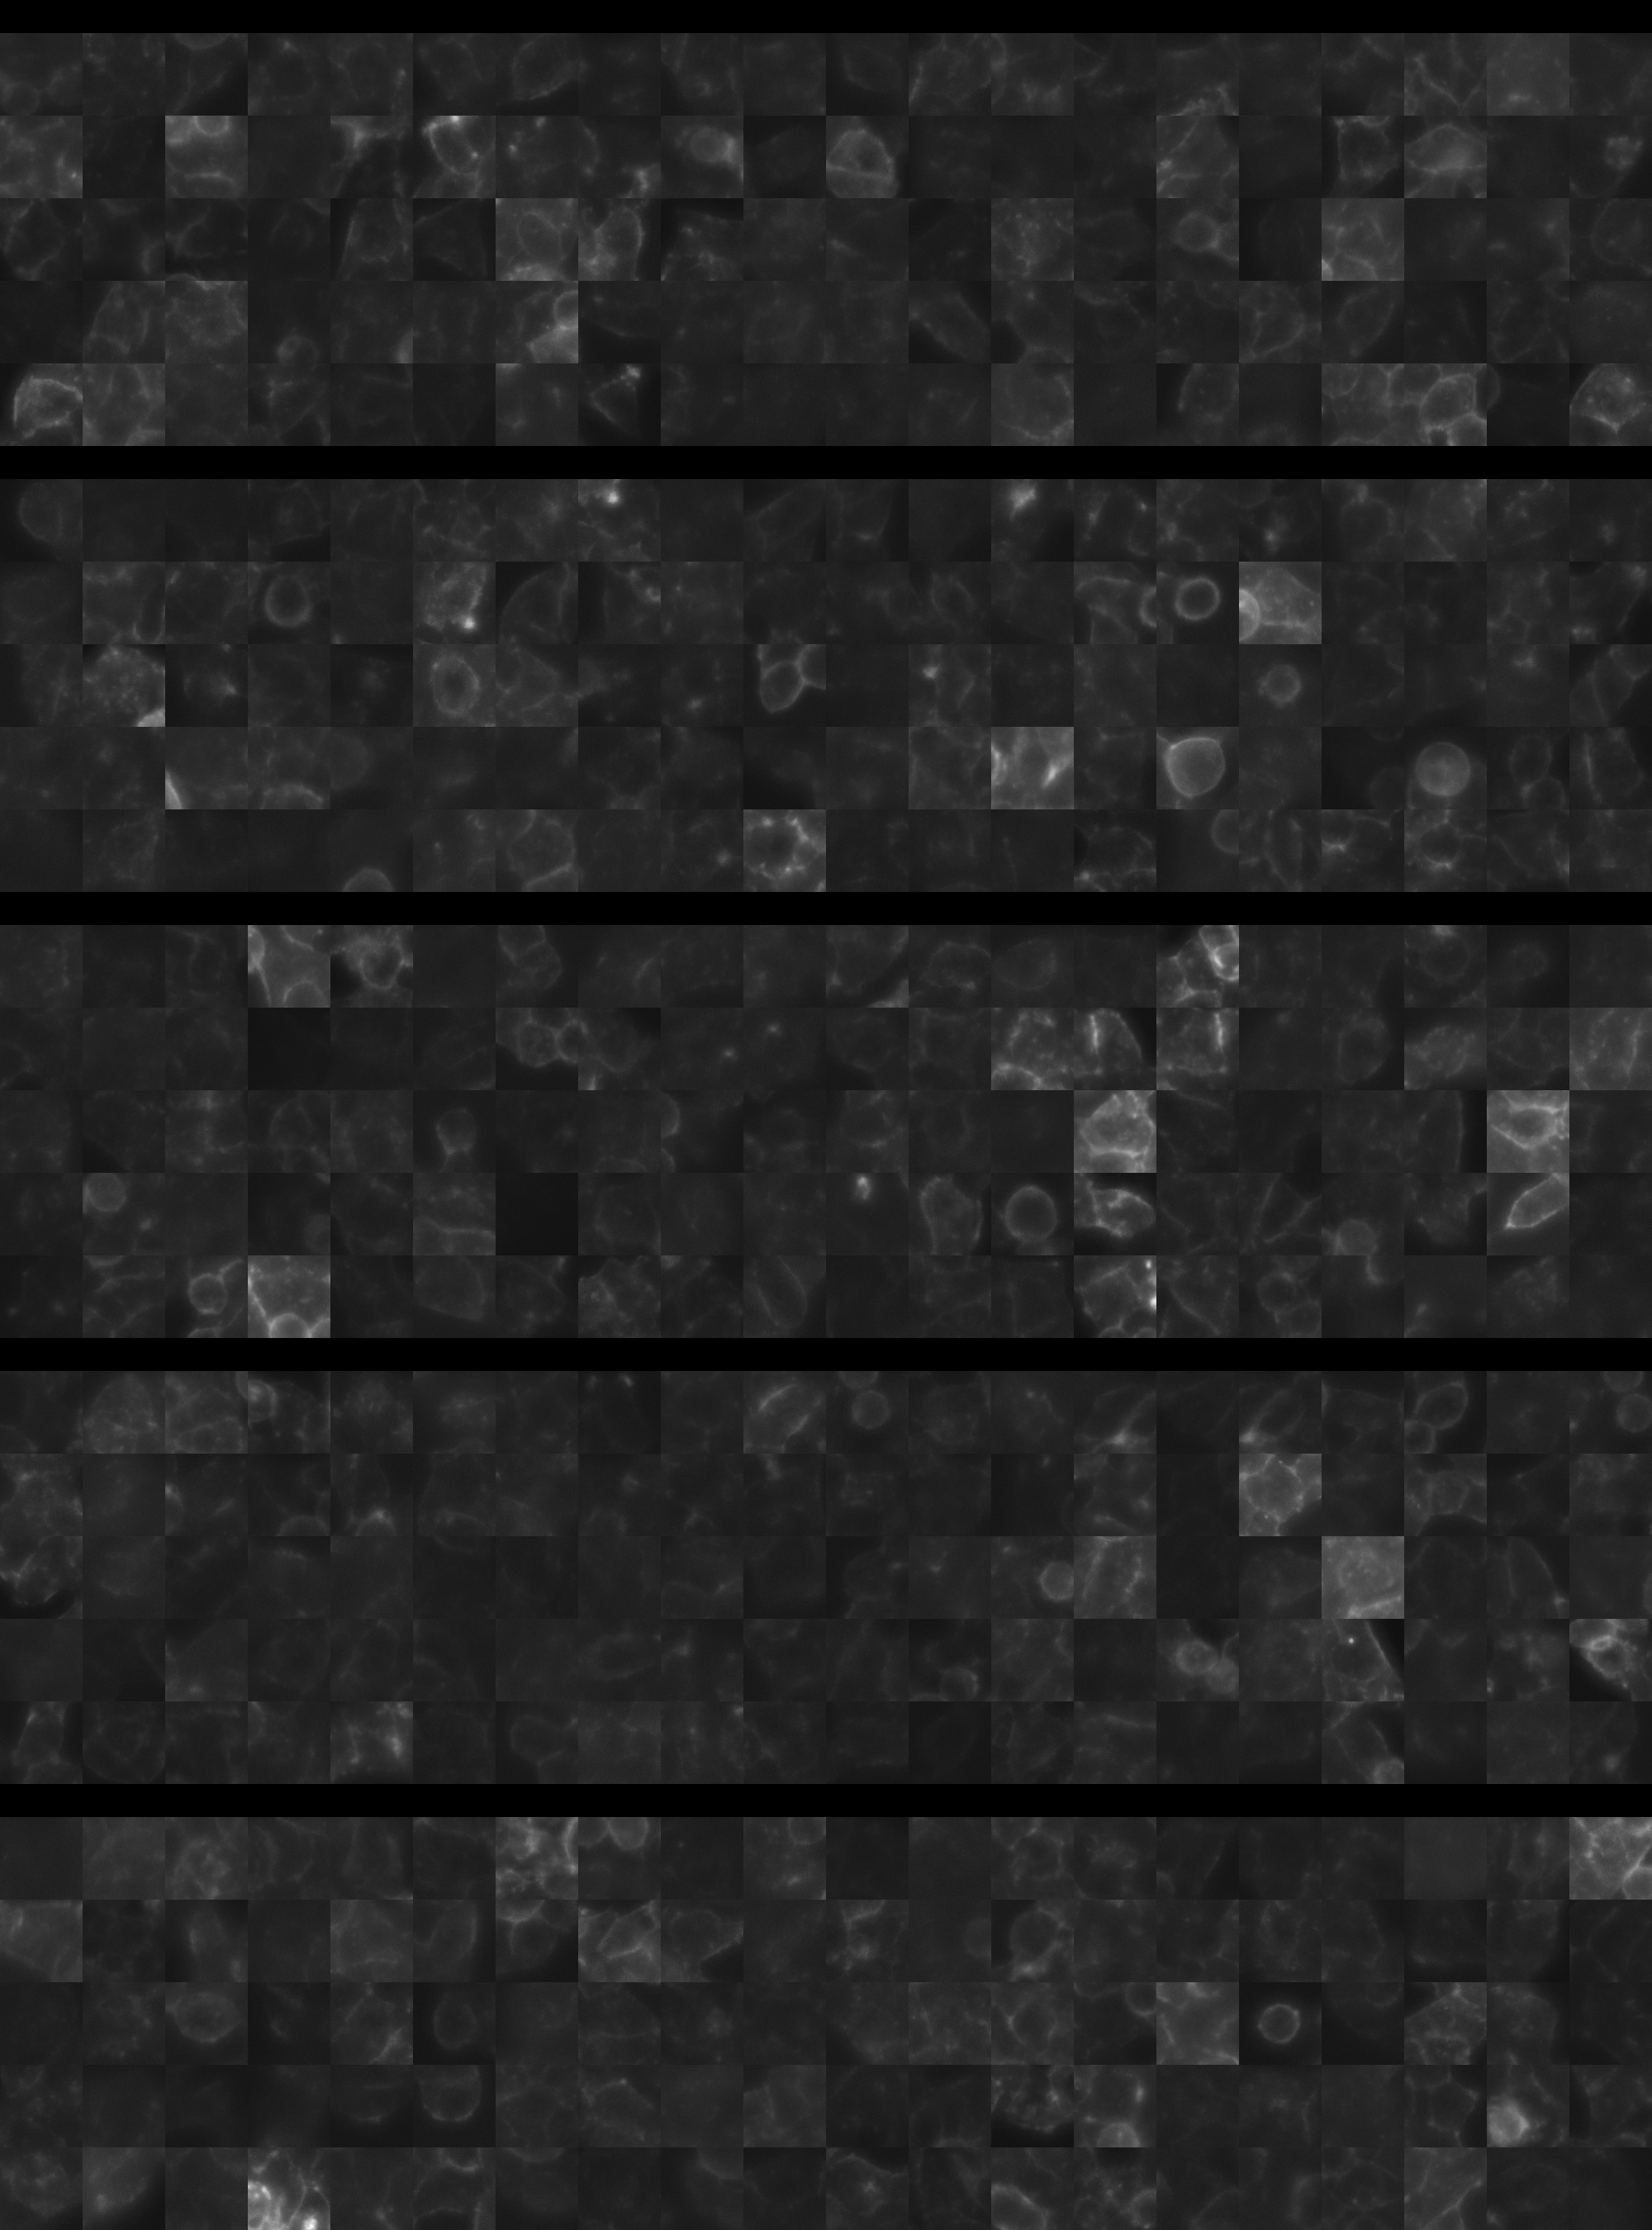
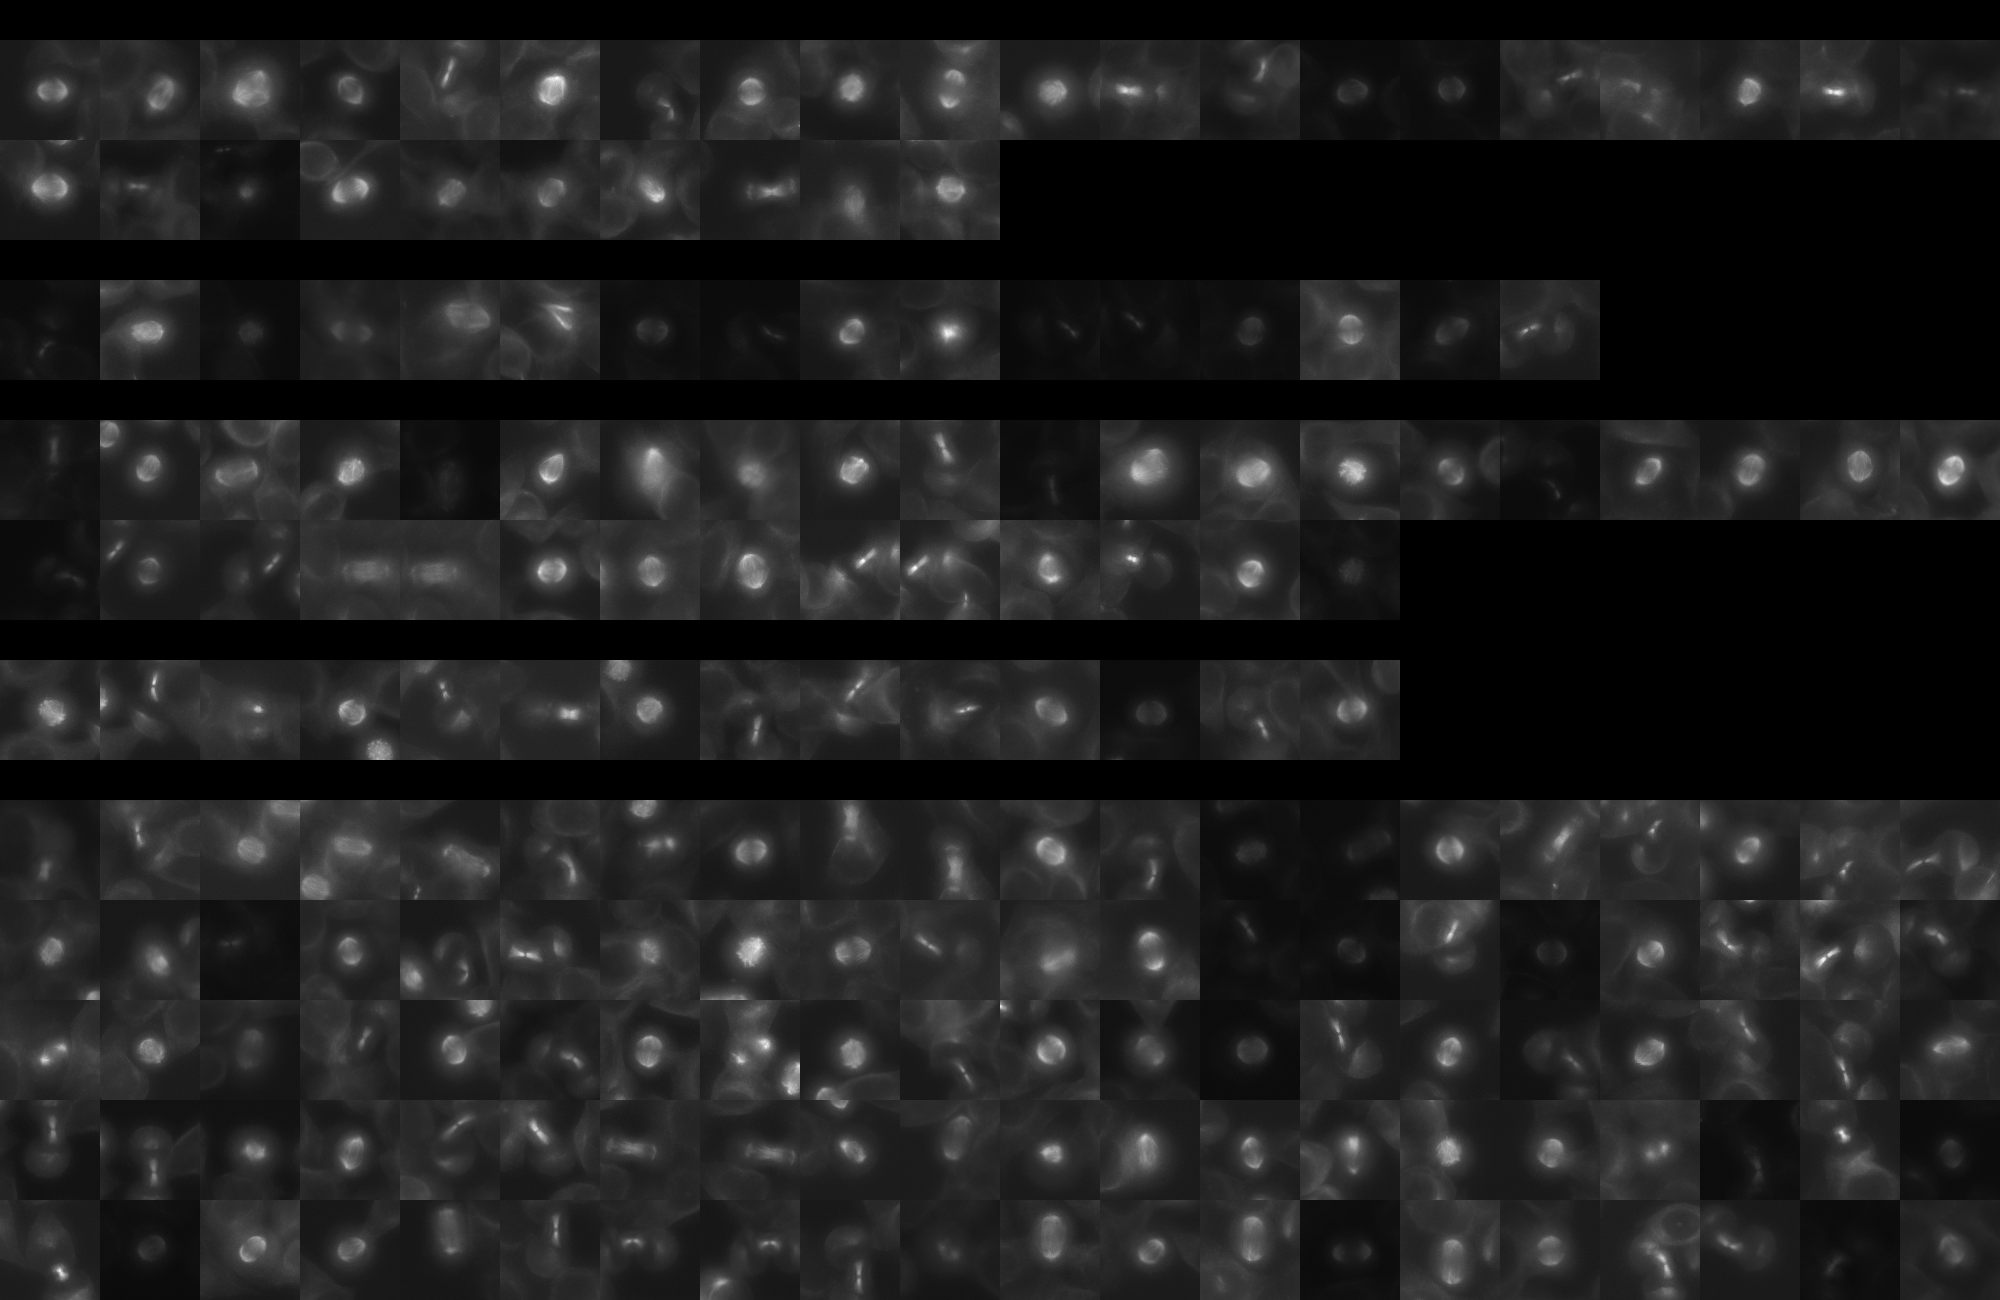
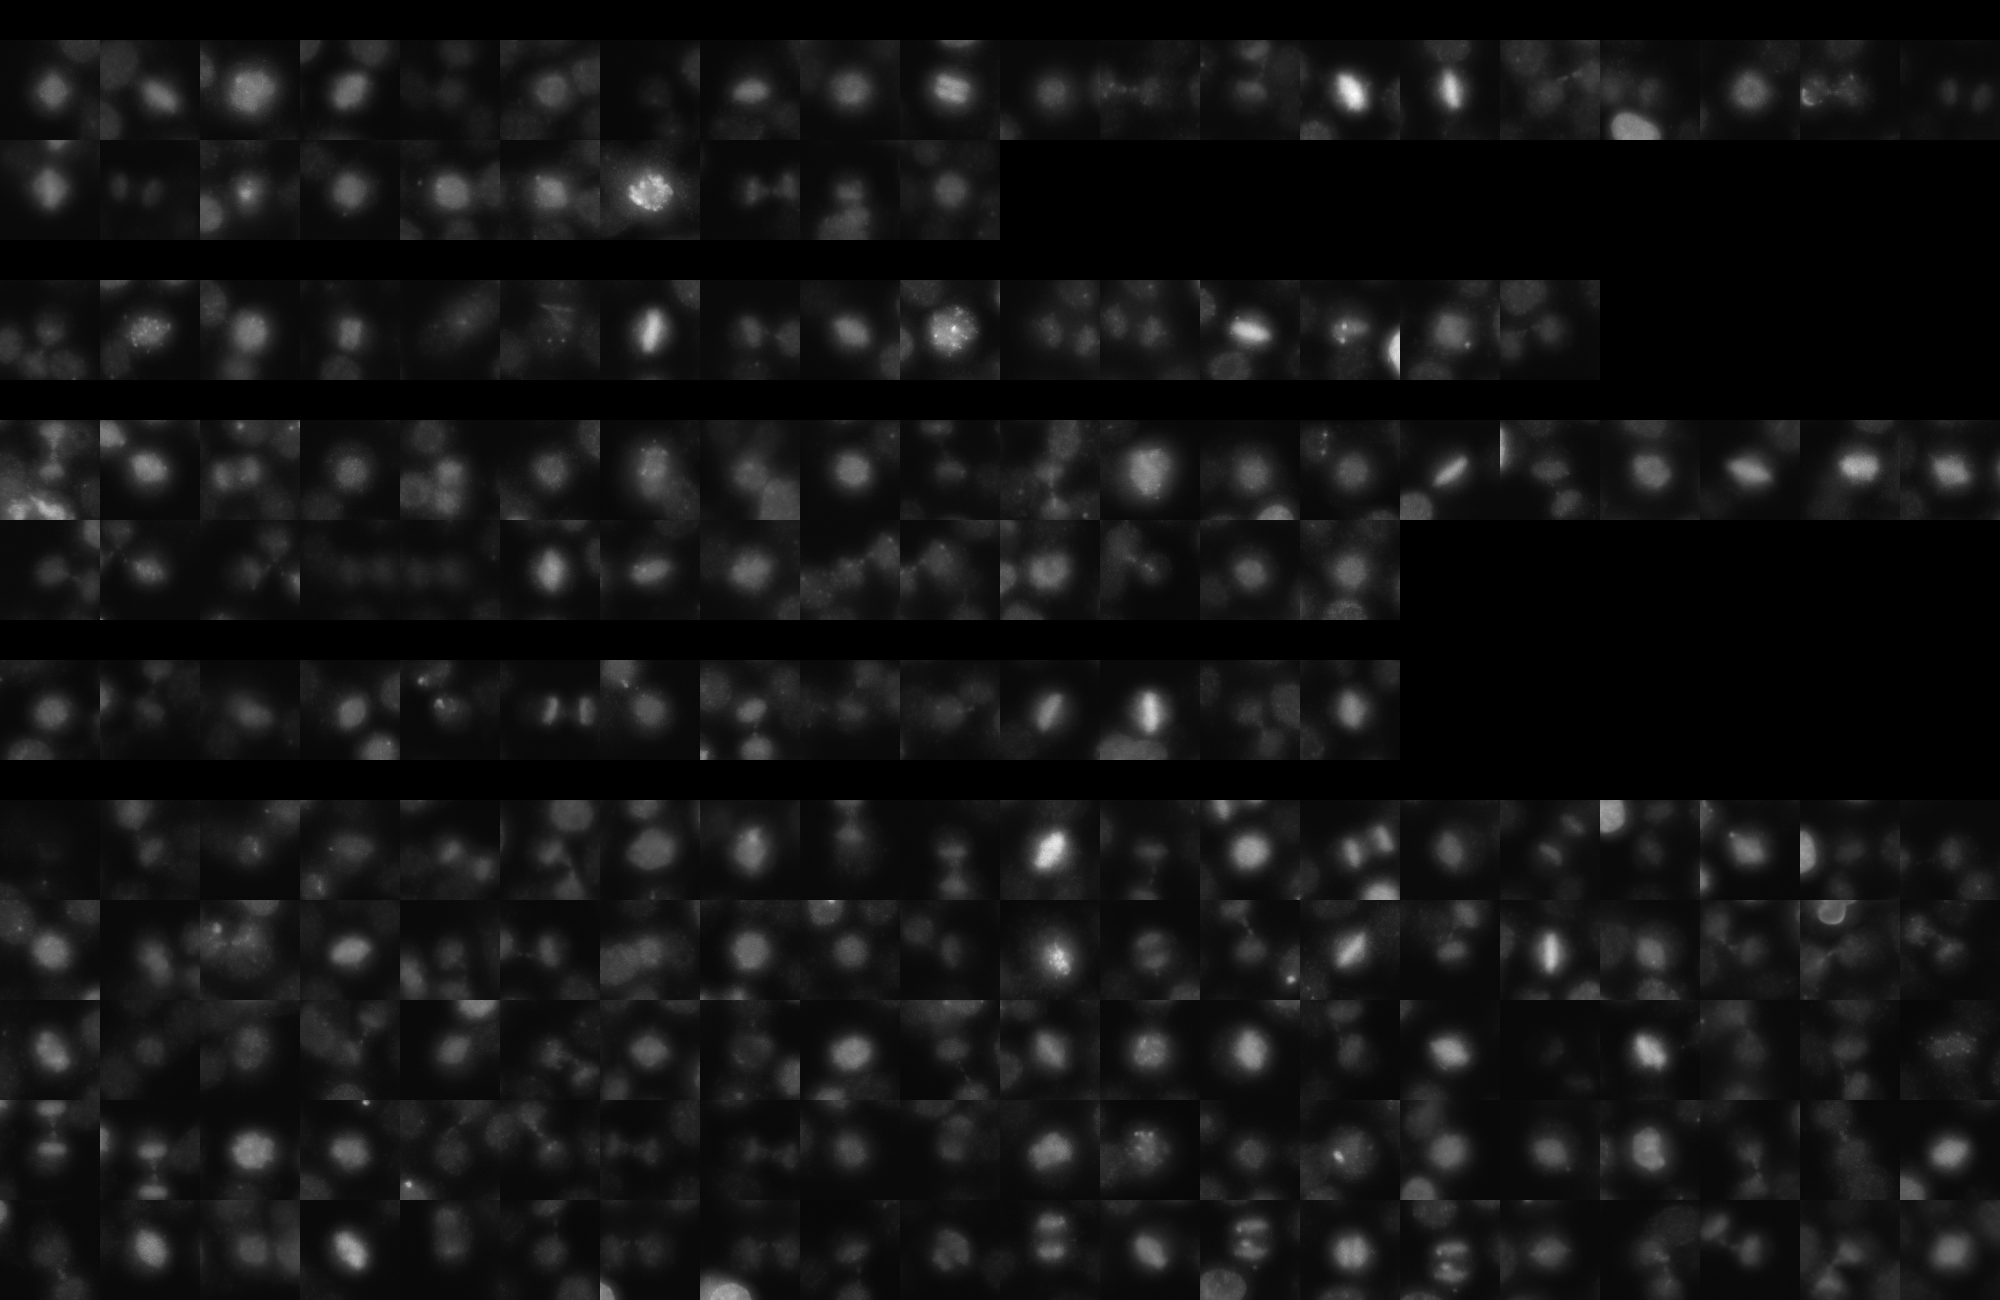
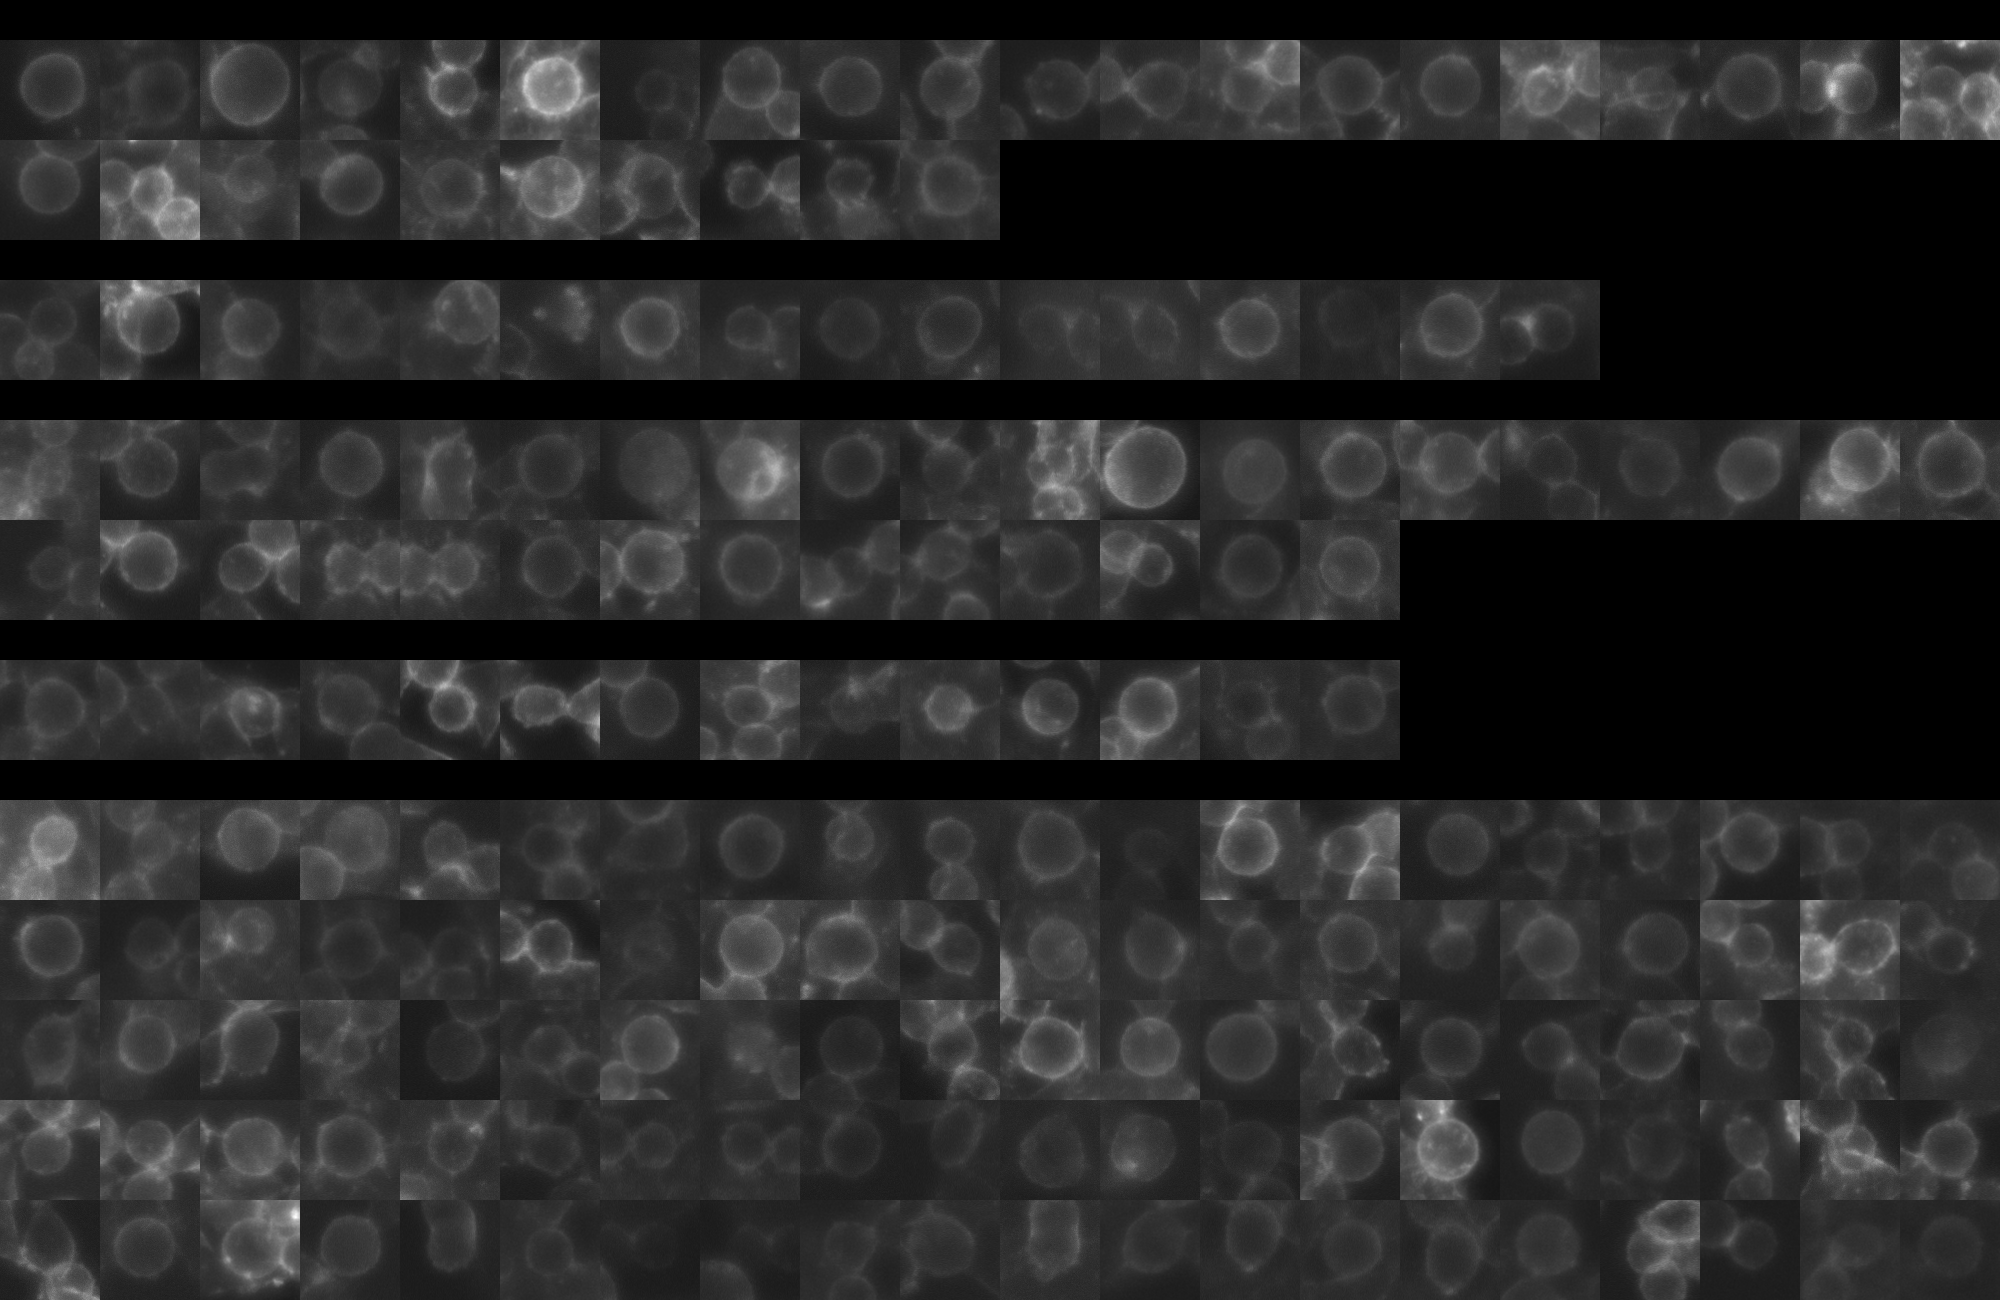
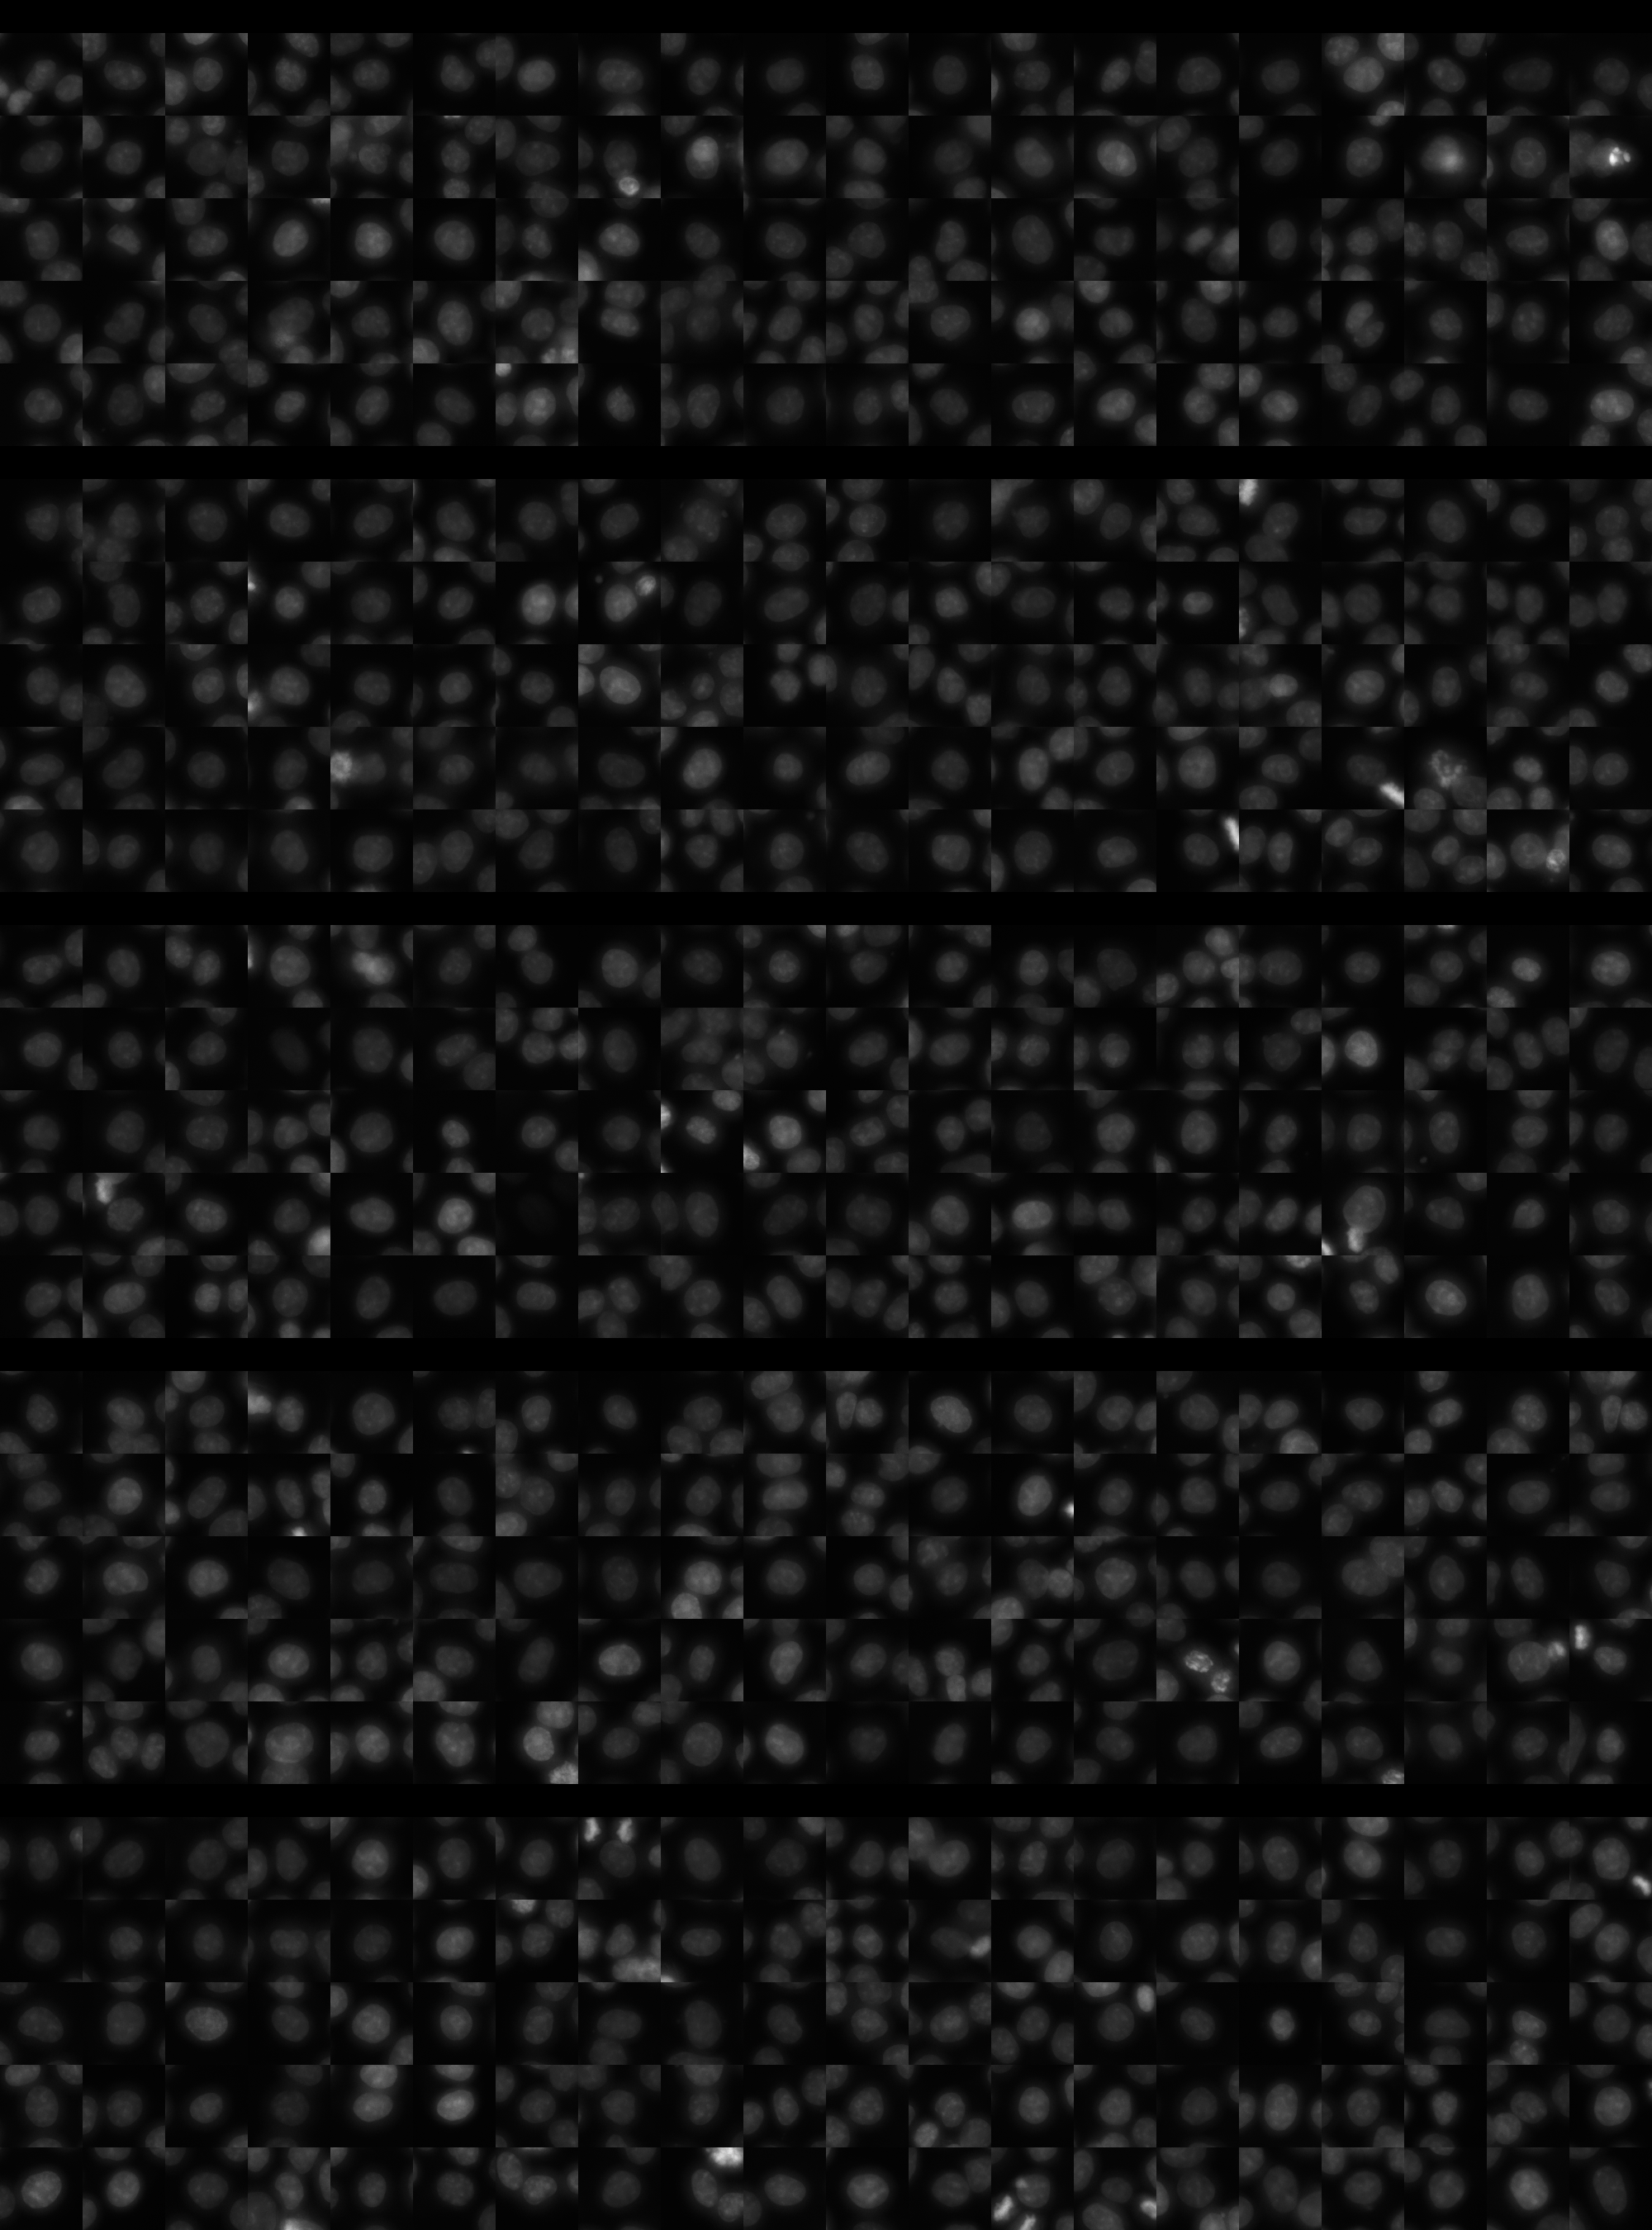
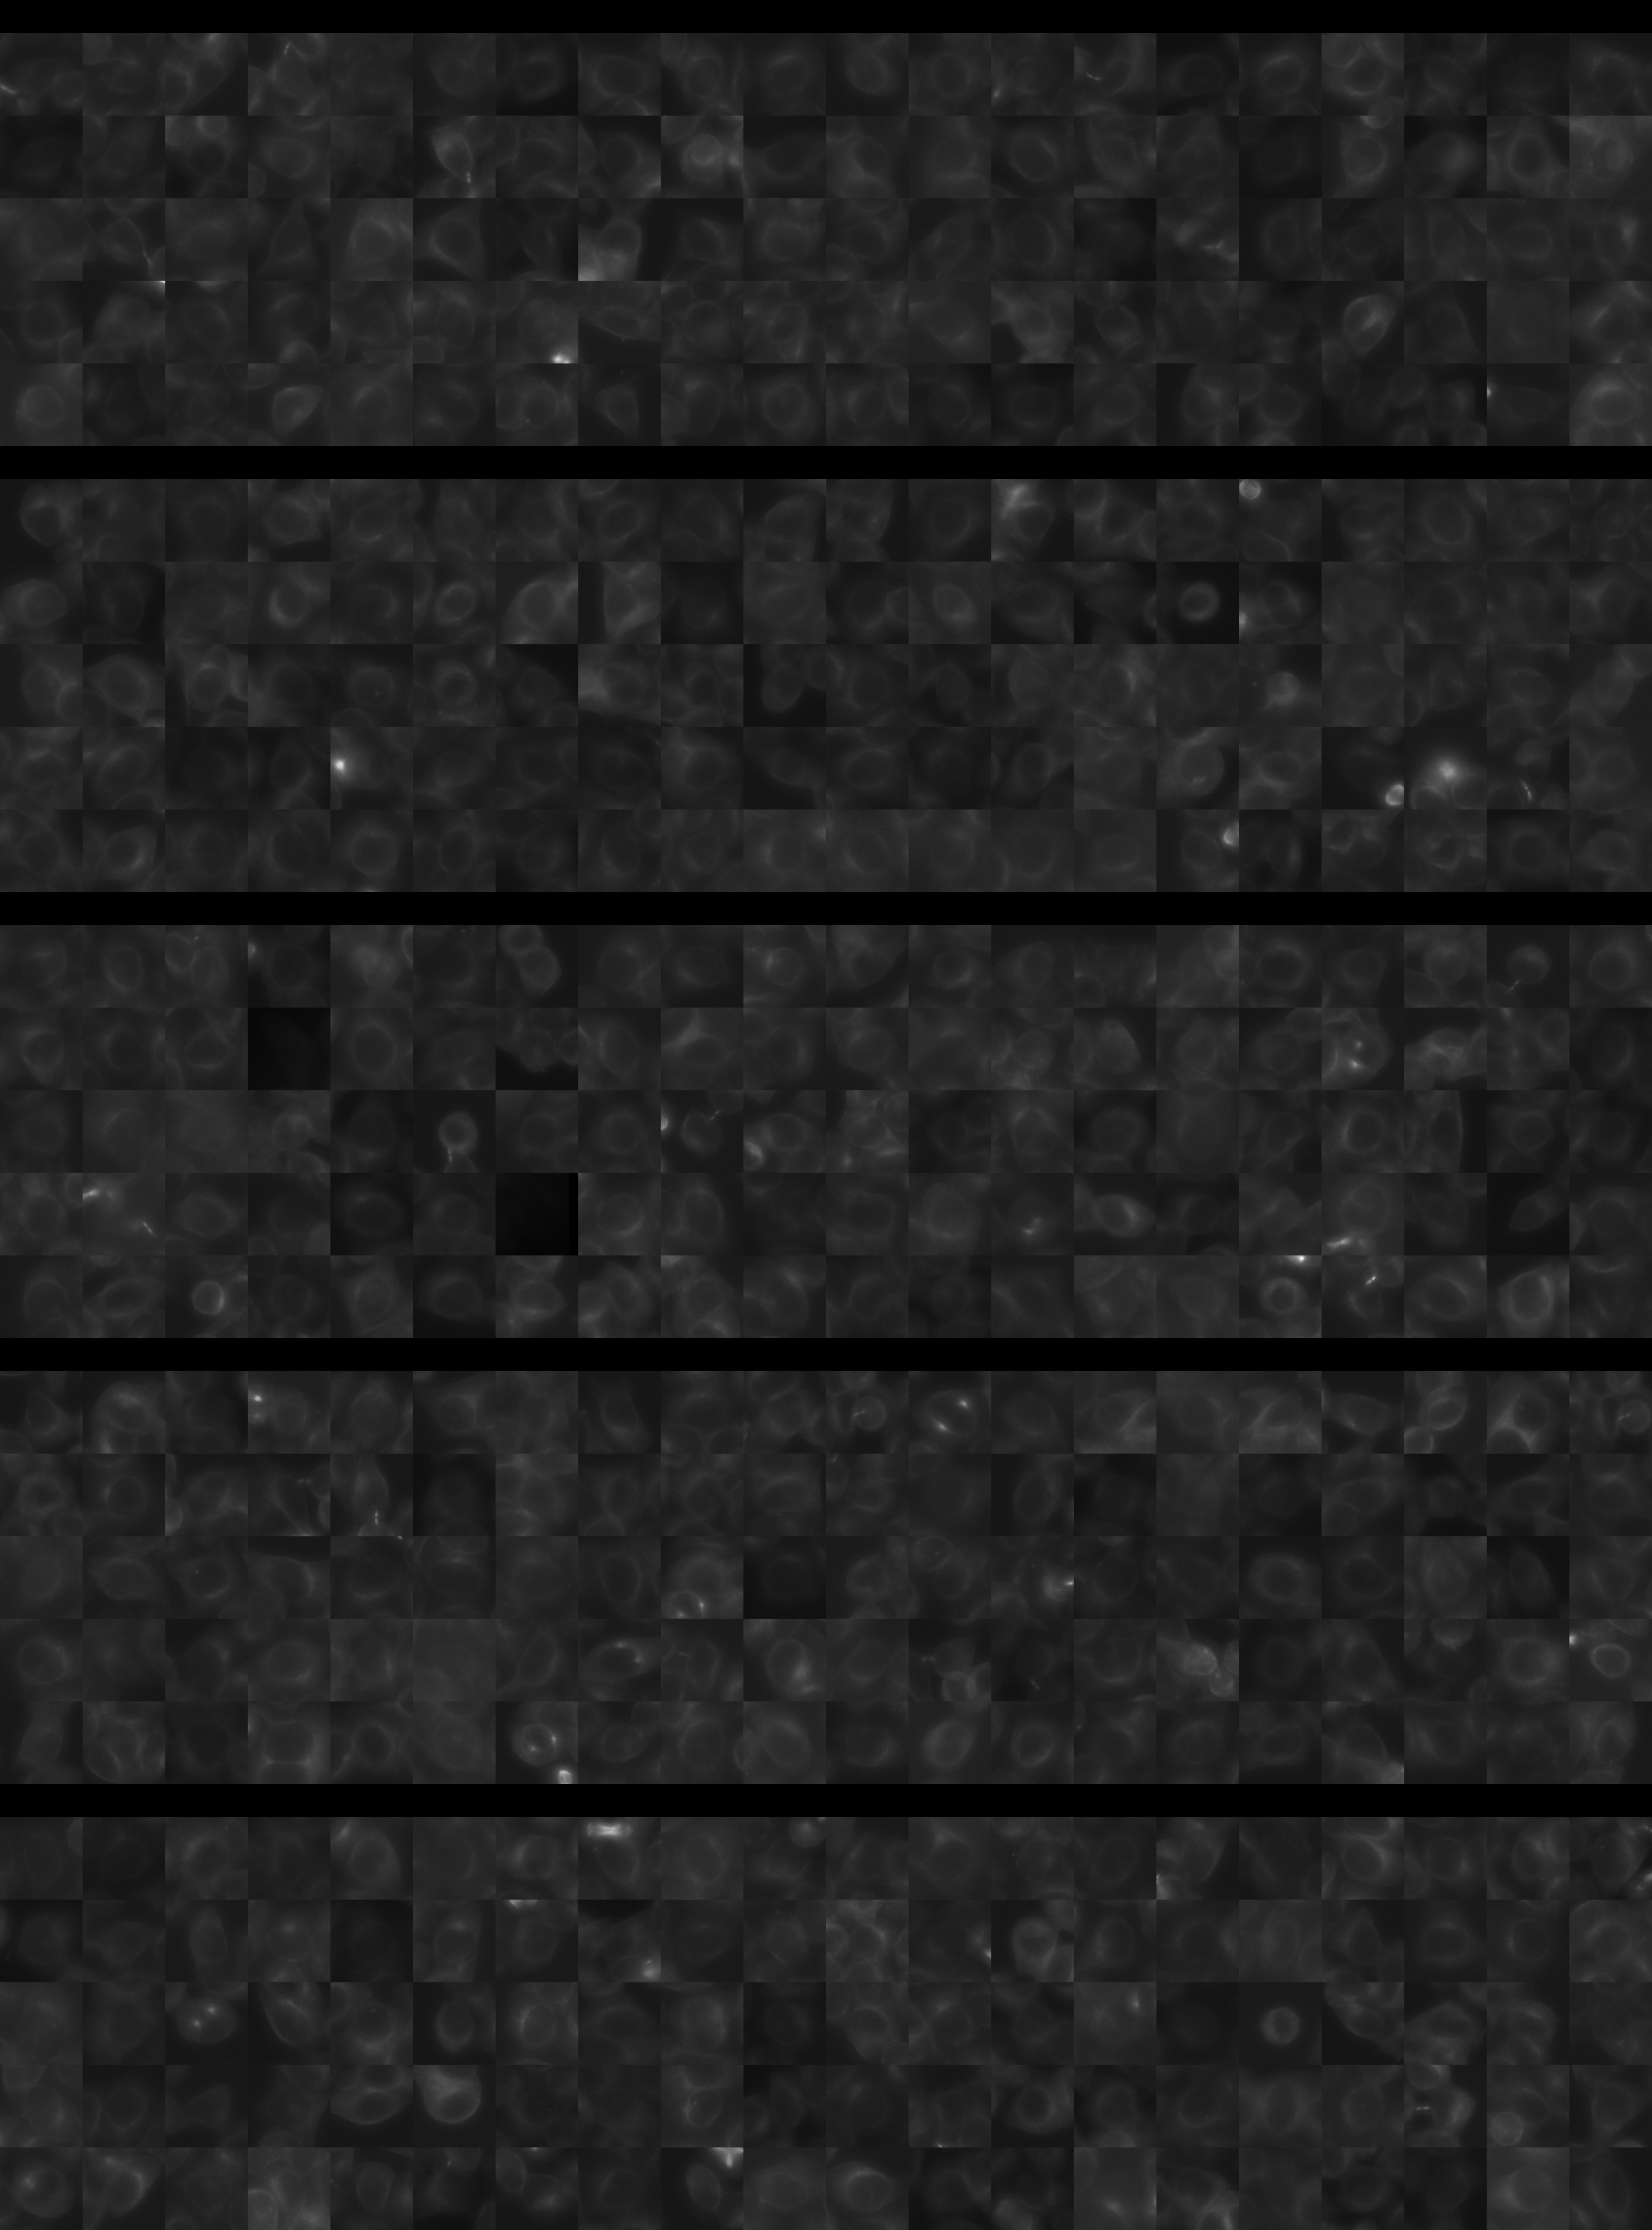
Each montage below shows randomly selected individual cell images for the same target gene separated by sgRNA, along with an example montage of cells expressing a non-targeting negative control sgRNA at the bottom. sgRNA labels in the montages correspond to the numbered sgRNA sequences in the gene info table above. The DNA (blue) and tubulin (green) channels are displayed by default, with gH2AX (grayscale) and actin (yellow) available using the check boxes. Channel brightness, contrast, and opacity are adjustable by clicking the arrow next to the channel name. When only one channel is selected, the display defaults to grayscale. Click the “Zoom” checkbox above the channel controls to enable image zooming (via scrolling) and panning (via click-and-drag).

The cell boxes displayed for this gene are square, 30.36 μm per side for the interphase montage and 30.36 μm per side for the mitotic montage.
Features

Interphase Score Rank FDR q-value
Nucleus DNA Integrated 0.040 1309 of 5322 0.620
Nucleus DNA Mean -5.658e-02 3775 of 5322 0.233
Nucleus gH2AX Mean 0.056 3310 of 5322 0.184
Nucleus DNA - gH2AX Correlation -7.549e-02 3282 of 5322 0.021
Nucleus Shape Area 0.046 1771 of 5322 0.515
Nucleus Shape Eccentricity 0.036 1434 of 5322 0.432
Nucleus Shape Form Factor -1.411e-02 1031 of 5322 0.823
Nucleus Shape Solidity -1.010e-02 939 of 5322 0.833
Cell DNA Mass Displacement 0.031 2185 of 5322 0.669
Cell Tubulin Mean -1.748e-02 3453 of 5322 0.820
Cell Tubulin Mass Displacement 0.036 993 of 5322 0.547
Cell Actin Mean -2.443e-02 3771 of 5322 0.728
Cell Tubulin - Actin Correlation -4.011e-02 4908 of 5322 0.420
Cell DNA - Tubulin Correlation -2.931e-02 4685 of 5322 0.524
Cell Shape Area 0.066 1108 of 5322 0.323
Cell Shape Eccentricity 0.022 1997 of 5322 0.831
Mitotic Score Rank FDR q-value
Nucleus DNA Integrated 0.146 1863 of 5322 0.959
Nucleus DNA Mean -4.053e-02 3585 of 5322 1.000
Nucleus DNA Mass Displacement -4.237e-02 4120 of 5322 0.999
Nucleus DNA Mean Frac 3 0.207 571 of 5322 1.000
Nucleus gH2AX Mean 0.208 707 of 5322 1.000
Nucleus gH2AX Mean Frac 0 -1.231e-01 4093 of 5322 1.000
Nucleus Tubulin Mean Frac 0 -9.244e-02 4624 of 5322 0.999
Nucleus Tubulin Mean Edge 0.338 208 of 5322 0.853
Nucleus Tubulin Std Edge 0.111 1148 of 5322 0.999
Nucleus Shape Area -4.968e-02 4460 of 5322 0.990
Nucleus Shape Eccentricity 0.150 460 of 5322 1.000
Nucleus Shape Form Factor -4.519e-02 2034 of 5322 0.998
Cell Tubulin Mean 0.498 96 of 5322 0.351
Cell Tubulin Mean Frac 3 -2.310e-01 4312 of 5322 0.999
Cell Actin Mean 0.010 3074 of 5322 1.000
Cell Shape Area 0.034 3472 of 5322 0.999
( Reset Zoom )
Brightness
Contrast
Opacity
Brightness
Contrast
Opacity
Brightness
Contrast
Opacity
Brightness
Contrast
Opacity
Brightness
Contrast
Opacity

( Reset Zoom )
Brightness
Contrast
Opacity
Brightness
Contrast
Opacity
Brightness
Contrast
Opacity
Brightness
Contrast
Opacity
Brightness
Contrast
Opacity

MIT Central Accessability